development of an assay for aflatoxin b1 in a range of ...doras.dcu.ie/16635/1/complete_msc.pdf ·...
TRANSCRIPT

Development of an assay for Aflatoxin B1 in a range of
foodstuffs using the Biacore Q Surface Plasmon Resonance
biosensor
A dissertation for the degree of
Master of Science
by
Claire Jones, BA
August, 2011
Under the supervision of
Professor Richard O‟Kennedy, Dr Andrew Baxter,
School of Biotechnology and Xenosense Ltd.,
National Centre for Sensor Research, The Innovation Centre,
Dublin City University, Queen‟s Road,
Dublin 9. Belfast.

ii
DECLARATION
I hereby certify that this material, which I now submit for assessment on the programme of
study leading to the award of Master of Science is entirely my own work, that I have
exercised reasonable care to ensure that the work is original, and does not to the best of my
knowledge breach any law of copyright, and has not been taken from the work of others
save and to the extent that such work has been cited and acknowledged within the text of
my work.
Signed: ____________________ ID No.: ___________________Date: ______________

iii
ACKNOWLEDGEMENTS
I would like to thank Professor Richard O‟Kennedy. Without his unfaultering support,
encouragement and patience this thesis would not have been completed. I would also like
to thank all my colleagues at Xenosense, Andrew Baxter, Simon Haughey, Josephine
McIvor, Andrew Walker, Terry McGrath and Anthony O‟Kane.

iv
PUBLICATIONS AND PRESENTATIONS
Publications
Applications of Sensors in Food and Environmental Analysis (2010)
O'Kennedy, R., Finlay, J.J., Leonard, P., Hearty, S., Brennan, J., Stapleton, S. Townsend S.,
Darmaninsheehan, A., Baxter, A. and Jones, C.
pp 195-232.Book chapter in:
Sensors for Chemical and Biological Applications, Edited by Manoj Kumar Ram and Venat
R. Bhethanabotla
CRC Press, Taylor and Francis Group, Bocan Raton, Fl., USA.
Oral presentations
“The Detection of Aflatoxin B1 by Optical Biosensor Analysis”
SafeFood Biotoxin Research Network, April 2007, Belfast, UK.
Poster presentations
“The Detection of Aflatoxins by Optical Biosensor Analysis”
International Association for Cereal Science and Technology, September 2007, Glasgow,
UK.
“The Detection of Aflatoxins by Optical Biosensor Analysis”
XII International IUPAC Symposium on Mycotoxins and Phycotoxins, May 2007, Istanbul,
Turkey.
“The Detection of Aflatoxins by Optical Biosensor Analysis”
Rapid Methods Europe 2007, January 2007, Noorwijk, The Netherlands.
“The Detection of Mycotoxins by Optical Biosensor”
3th
World Mycotoxin Forum, November 2005, Noorwijk, The Netherlands.
v
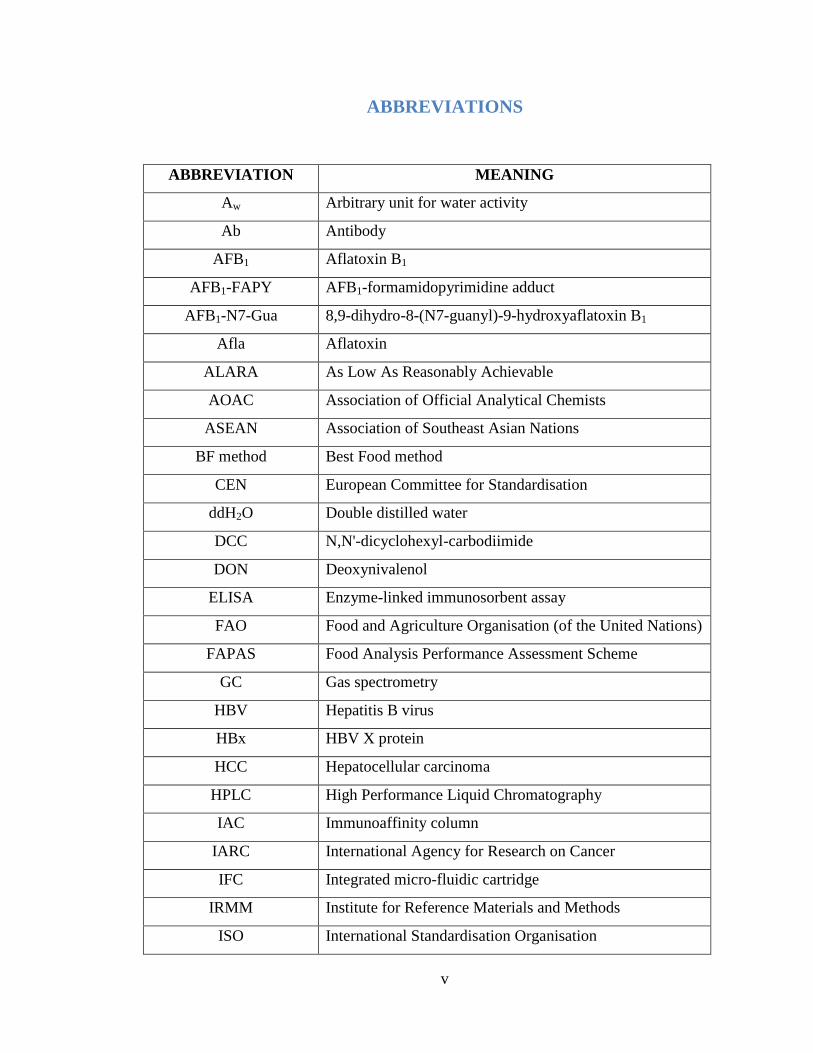
ABBREVIATIONS
ABBREVIATION MEANING
Aw Arbitrary unit for water activity
Ab Antibody
AFB1 Aflatoxin B1
AFB1-FAPY AFB1-formamidopyrimidine adduct
AFB1-N7-Gua 8,9-dihydro-8-(N7-guanyl)-9-hydroxyaflatoxin B1
Afla Aflatoxin
ALARA As Low As Reasonably Achievable
AOAC Association of Official Analytical Chemists
ASEAN Association of Southeast Asian Nations
BF method Best Food method
CEN European Committee for Standardisation
ddH2O Double distilled water
DCC N,N'-dicyclohexyl-carbodiimide
DON Deoxynivalenol
ELISA Enzyme-linked immunosorbent assay
FAO Food and Agriculture Organisation (of the United Nations)
FAPAS Food Analysis Performance Assessment Scheme
GC Gas spectrometry
HBV Hepatitis B virus
HBx HBV X protein
HCC Hepatocellular carcinoma
HPLC High Performance Liquid Chromatography
IAC Immunoaffinity column
IARC International Agency for Research on Cancer
IFC Integrated micro-fluidic cartridge
IRMM Institute for Reference Materials and Methods
ISO International Standardisation Organisation
vi
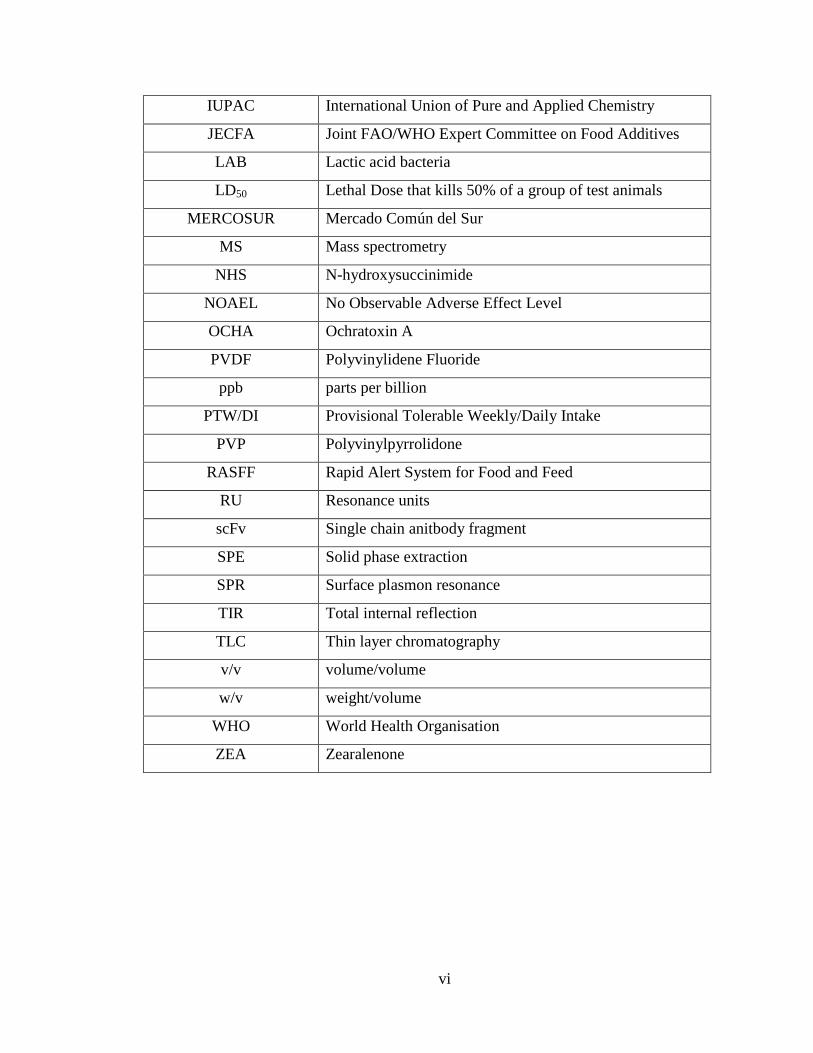
IUPAC International Union of Pure and Applied Chemistry
JECFA Joint FAO/WHO Expert Committee on Food Additives
LAB Lactic acid bacteria
LD50 Lethal Dose that kills 50% of a group of test animals
MERCOSUR Mercado Común del Sur
MS Mass spectrometry
NHS N-hydroxysuccinimide
NOAEL No Observable Adverse Effect Level
OCHA Ochratoxin A
PVDF Polyvinylidene Fluoride
ppb parts per billion
PTW/DI Provisional Tolerable Weekly/Daily Intake
PVP Polyvinylpyrrolidone
RASFF Rapid Alert System for Food and Feed
RU Resonance units
scFv Single chain anitbody fragment
SPE Solid phase extraction
SPR Surface plasmon resonance
TIR Total internal reflection
TLC Thin layer chromatography
v/v volume/volume
w/v weight/volume
WHO World Health Organisation
ZEA Zearalenone
vii
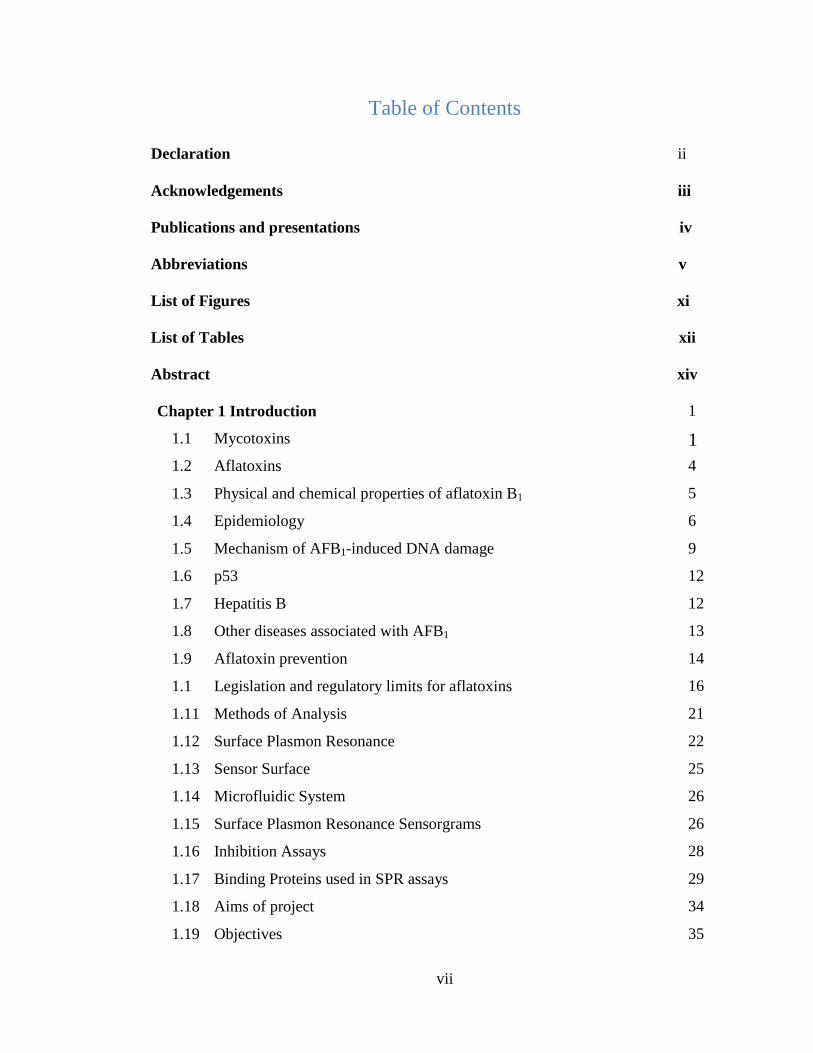
Table of Contents
Declaration ii
Acknowledgements iii
Publications and presentations iv
Abbreviations v
List of Figures xi
List of Tables xii
Abstract xiv
Chapter 1 Introduction 1
1.1 Mycotoxins 1
1.2 Aflatoxins 4
1.3 Physical and chemical properties of aflatoxin B1 5
1.4 Epidemiology 6
1.5 Mechanism of AFB1-induced DNA damage 9
1.6 p53 12
1.7 Hepatitis B 12
1.8 Other diseases associated with AFB1 13
1.9 Aflatoxin prevention 14
1.1 Legislation and regulatory limits for aflatoxins 16
1.11 Methods of Analysis 21
1.12 Surface Plasmon Resonance 22
1.13 Sensor Surface 25
1.14 Microfluidic System 26
1.15 Surface Plasmon Resonance Sensorgrams 26
1.16 Inhibition Assays 28
1.17 Binding Proteins used in SPR assays 29
1.18 Aims of project 34
1.19 Objectives 35

viii
Chapter 2 Materials and Methods 37
2.1 Suppliers 37
2.2 Materials 38
2.2.1 Chemicals 38
2.2.2 Preparation of Buffers and Reagents 38
2.2.3 Consumables 39
2.2.4 Equipment 40
2.3 Methods 41
2.3.1 Assay Development Methodology 41
2.3.1a Preparation of aflatoxin B1-oxime-ethylenediamine 41
2.3.1b Immobilisation of aflatoxin B1 derivative, 42
aflatoxin B1-oxime-ethylenediamine onto sensor
chip surface through amine coupling
2.3.1c Optimisation of the immobilisation of aflatoxin B1 42
derivative, aflatoxin B1-oxime-ethylenediamine
onto sensor chip surface through amine coupling
2.3.2 Extraction Methodology for Compound Feed (IRMM 43
Reference Material)
2.3.2a Simple methanol extraction of aflatoxin B1 from 43
compound feed
2.3.2b Extraction of aflatoxin B1 from compound feed 44
using “Mycosep” SPE (solid phase extraction)
columns from Romer Laboratories
2.3.2c Extraction of aflatoxin B1 from compound feed 44
using “Easi-extract aflatoxin” immunoaffinity
columns from R-Biopharm Rhone
2.3.2d Extraction of aflatoxin B1 from compound feed 45
using “Aflatest” immunoaffinity columns from Vicam
2.3.3 Extraction Methodology for Infant Formula 46
2.3.3a Methanol extraction of aflatoxin B1 from infant 46
formula
ix
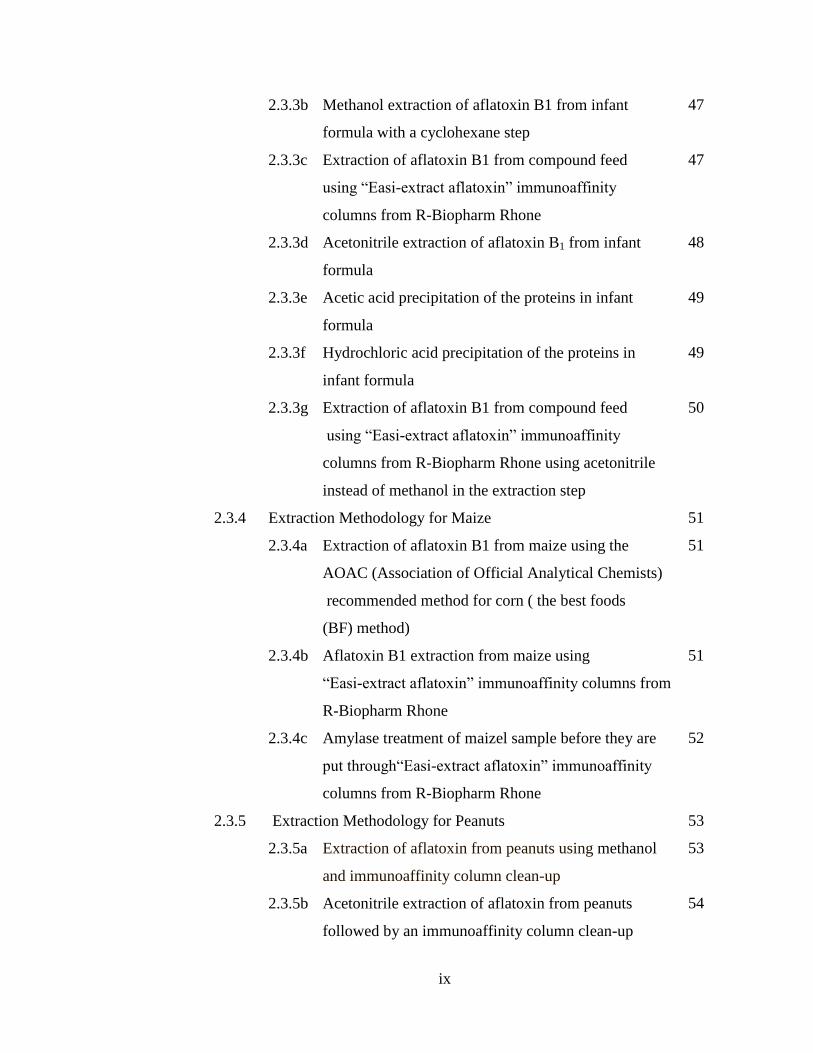
2.3.3b Methanol extraction of aflatoxin B1 from infant 47
formula with a cyclohexane step
2.3.3c Extraction of aflatoxin B1 from compound feed 47
using “Easi-extract aflatoxin” immunoaffinity
columns from R-Biopharm Rhone
2.3.3d Acetonitrile extraction of aflatoxin B1 from infant 48
formula
2.3.3e Acetic acid precipitation of the proteins in infant 49
formula
2.3.3f Hydrochloric acid precipitation of the proteins in 49
infant formula
2.3.3g Extraction of aflatoxin B1 from compound feed 50
using “Easi-extract aflatoxin” immunoaffinity
columns from R-Biopharm Rhone using acetonitrile
instead of methanol in the extraction step
2.3.4 Extraction Methodology for Maize 51
2.3.4a Extraction of aflatoxin B1 from maize using the 51
AOAC (Association of Official Analytical Chemists)
recommended method for corn ( the best foods
(BF) method)
2.3.4b Aflatoxin B1 extraction from maize using 51
“Easi-extract aflatoxin” immunoaffinity columns from
R-Biopharm Rhone
2.3.4c Amylase treatment of maizel sample before they are 52
put through“Easi-extract aflatoxin” immunoaffinity
columns from R-Biopharm Rhone
2.3.5 Extraction Methodology for Peanuts 53
2.3.5a Extraction of aflatoxin from peanuts using methanol 53
and immunoaffinity column clean-up
2.3.5b Acetonitrile extraction of aflatoxin from peanuts 54
followed by an immunoaffinity column clean-up

x
2.3.5c Treatment of peanuts with polyvinylpyrrolidone 55
(PVP) to remove tannins present in the skins
2.3.5d Optimised assay for the extraction of aflatoxin from 56
peanuts
2.3.6 General Methods 57
2.3.6a Decontamination of consumables and glassware that 57
have come into contact with aflatoxin
Chapter 3 Assay Development and Feasibility 59
3.1 Format of aflatoxin B1 assay using a Biacore Q biosensor 59
3.2 Development of a sensor chip for the aflatoxin B1 assay 59
3.3 Testing the efficacy of the surface of the aflatoxin B1 assay sensor chip 61
3.4 Evaluation of the feasibility of the aflatoxin B1 assay 63
3.5 Evaluation of the anti-aflatoxin B1 antibodies for use in an assay using 64
A Biacore Q biosensor
Chapter 4 Matrices and Sample Extraction 66
4.1 Introduction 66
4.2 Compound Feed 68
4.3 Infant Formula 74
4.4 Maize 79
4.5 Peanuts 82
Chapter 5 Discussion and Conclusions 94
5.1 Aflatoxin B1 detection and quantification 94
5.2 Assay development and feasibility 95
5.3 Aflatoxin B1 assay with compound feed (IRMM Reference Material) as 96
the sample matrix
5.4 Aflatoxin B1 assay with infant formula as the sample matrix 97
5.5 Aflatoxin B1 assay with maize as the sample matrix 98
5.6 Aflatoxin B1 assay with peanuts as the sample matrix 99
5.7 Comparison of assay with current market leaders 100
5.8 Conclusions 105
Chapter 6 Bibliography 108

xi
List of Figures
Figure 1.1 Chemical structure of aflatoxin B1, B2, G1 and G2 5
Figure 1.2 Diagram showing the Aflatoxin B1 metabolic 11
pathway
Figure 1.3 Graph showing the worldwide limits for aflatoxin B1 17
in food
Figure 1.4 Graph showing the worldwide limits for total aflatoxins 18
in feed
Figure 1.5 The BiacoreTM
Surface Plasmon Resonance System 23
Figure 1.6 Surface Plasmon Resonance 24
Figure 1.7 BiacoreTM
CM5 Sensor Chip 25
Figure 1.8 SPR Sensorgram 27
Figure 1.9 Inhibition Assay for Aflatoxin B1 Determination 28
Figure1.10 Structure of an antibody made up of two identical 29
heavy and two identical light chains.
Figure1.11 Diagram showing structures of a Fab fragment and an 32
scFv compared to a typical IgG molecule
Figure1.12 Schematic drawing of phage display and bio-panning 33
Figure 3.1 Diagram showing the reactions and chemical structures 60
of the products and intermediates in the formation of
aflatoxin B1-oxime-ethylenediamine
Figure 3.2 Sensorgram showing an Rmax, the maximum amount 62
of antibody binding to the chip surface
Figure 3.3 Aflatoxin B1 calibration curve in HBS buffer 63
Figure 4.1 Aflatoxin B1 in compound feed reference material assay 70
using “Easi-extract aflatoxin” immunoaffinity columns
commercially available from R-Biopharm Rhone
Figure 4.2 Aflatoxin B1 in compound feed reference material assay 73
xii
using “Aflatest” immunoaffinity columns commercially
available from Vicam
Figure 4.3 Aflatoxin B1 extraction from infant formula using a 75
simple methanol extraction and including a cyclohexane
Figure 4.4 Aflatoxin B1 extraction from maize with 55% (v/v) 82
methanol/water, followed by a hexane step and then a
final chloroform extraction after the maize had been
treated with amylase
Figure 4.5 Optimisation of the aflatoxin B1 assay in peanuts 89
Figure 4.6 Aflatoxin B1 extraction from peanuts using the new 90
assay conditions of an antibody fraction of 20% and
an injection of 10 minutes
Figure 4.7 Aflatoxin B1 extraction from peanuts using an increased 93
sample size of 50g
Figure 4.8 Baseline Trendplot
List of Tables
Table 1.1 Acute toxicity of aflatoxin B1 expressed as a single 7
oral dose LD50
Table 1.2 Comparison between worldwide aflatoxin regulations 20
Table 2.1 List of suppliers for raw materials, consumables and 36
equipment
Table 2.2 List of chemicals used with the supplier and the 37
catalogue number
Table 2.3 List of consumables and details of where they were 39
purchased
Table 2.4 List of equipment and details of where they were 40
purchased
Table 3.1 Table of results showing the midpoint values for antibodies 65
xiii
G6, D11 and scFv500 each with a range of antibody
fractions and contact times
Table 4.1 Table showing the re-usablity of the “Easi-extract 71
aflatoxin” immunoaffinity columns
Table 4.2 Results for experiments extracting aflatoxin B1 from 78
infant formula
Table 4.3 Composition of Maize 80
Table 4.4 Table showing the efficacy of a range of different filters 86
in removing matrix effect from peanuts whilst not
sequestering aflatoxin B1
Table 4.5 Table showing sample recoveries from the Aflatoxin B1 91
extraction from peanuts using the new assay conditions
of an antibody fraction of 20% and an injection of 10 minutes
xiv
ABSTRACT
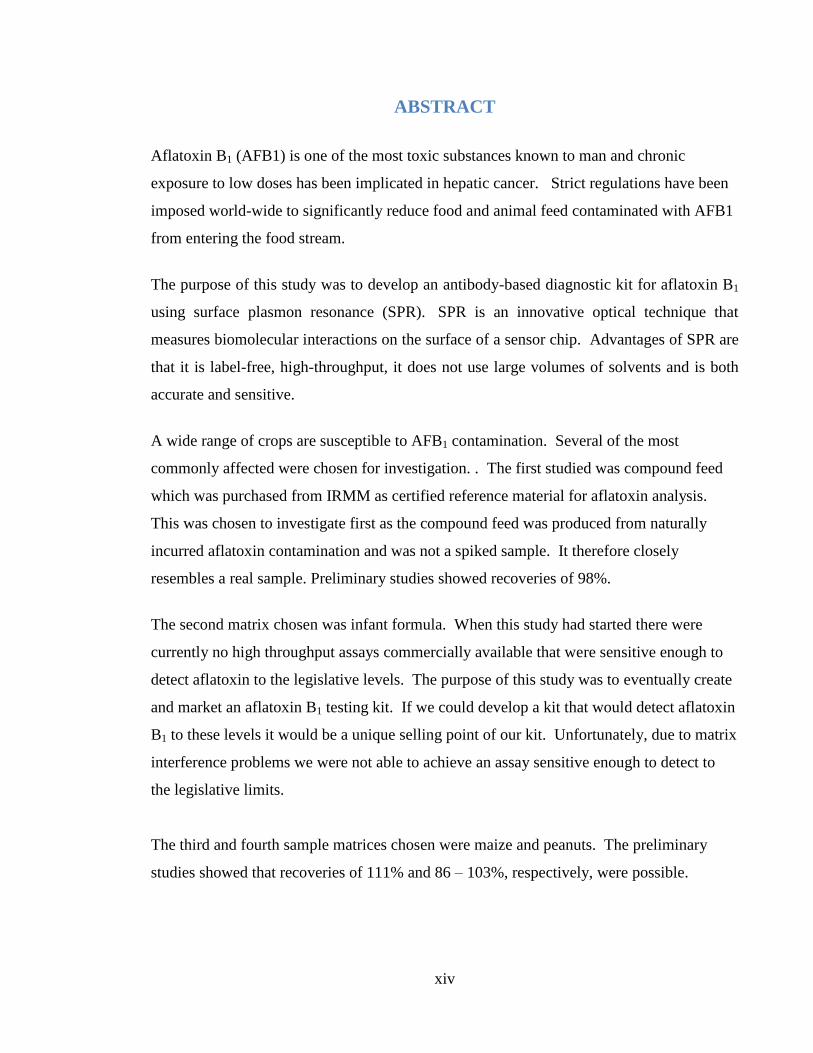
Aflatoxin B1 (AFB1) is one of the most toxic substances known to man and chronic
exposure to low doses has been implicated in hepatic cancer. Strict regulations have been
imposed world-wide to significantly reduce food and animal feed contaminated with AFB1
from entering the food stream.
The purpose of this study was to develop an antibody-based diagnostic kit for aflatoxin B1
using surface plasmon resonance (SPR). SPR is an innovative optical technique that
measures biomolecular interactions on the surface of a sensor chip. Advantages of SPR are
that it is label-free, high-throughput, it does not use large volumes of solvents and is both
accurate and sensitive.
A wide range of crops are susceptible to AFB1 contamination. Several of the most
commonly affected were chosen for investigation. . The first studied was compound feed
which was purchased from IRMM as certified reference material for aflatoxin analysis.
This was chosen to investigate first as the compound feed was produced from naturally
incurred aflatoxin contamination and was not a spiked sample. It therefore closely
resembles a real sample. Preliminary studies showed recoveries of 98%.
The second matrix chosen was infant formula. When this study had started there were
currently no high throughput assays commercially available that were sensitive enough to
detect aflatoxin to the legislative levels. The purpose of this study was to eventually create
and market an aflatoxin B1 testing kit. If we could develop a kit that would detect aflatoxin
B1 to these levels it would be a unique selling point of our kit. Unfortunately, due to matrix
interference problems we were not able to achieve an assay sensitive enough to detect to
the legislative limits.
The third and fourth sample matrices chosen were maize and peanuts. The preliminary
studies showed that recoveries of 111% and 86 – 103%, respectively, were possible.

Chapter 1:
Introduction

1
1.1 Mycotoxins
Mycotoxins are toxic secondary metabolites produced from a range of toxigenic
filamentous fungi (moulds), predominantly from the genera Aspergillis, Penicillium and
Fusarium (Sweeney et al., 1998). Some originate from a particular species, for example,
only A. flavus or A. parasiticus produce aflatoxins, whilst patulin is produced by a variety
of different moulds from the species Penicillium, Aspergillus and Byssochlamys (Alves et
al., 2000). Some other moulds can produce several mycotoxins. Fusarium species can
produce tricothecenes, fumonisins, zearolenone (ZEA), deoxynivalenol (DON) and
monoliform amongst others (Creppy, 2002). However, the maximum production of
different mycotoxins may not occur under the same conditions. A single strain of
Fusarium graminearum can produce both ZEA and DON. However, while ZEA
production reaches a maximum at 25ºC, DON production increases with increased
temperature, the maximal amount being produced at 30 ºC (Ramirez et al., 2006)
Certain environmental conditions favour mycotoxin production. These conditions are more
restricted than those needed for normal fungal growth (Kokkonen et al., 2005). Production
of particular mycotoxins is also dependant on the climate. Some mycotoxins, such as
ochratoxin A produced by P. verrucosum, favour temperate climates and are, therefore,
found predominantly in Europe. Others, for example aflatoxins, occur more commonly in
tropical climes. They are produced when the crop is under stressed conditions and this is
accelerated by crop damage e.g. by insect infestation (Pier, 1992).
Since mycotoxins can occur all over the world, all crops are susceptible to contamination,
and this can happen at any stage of the farming process, including cultivation, harvest,
drying, storage, or transportation. Major commodities affected are cereals (maize, wheat,
barley, oats and rice), nuts, dried fruit, coffee, cocoa, spices, beer and wine. Mycotoxins
can also enter the human food chain through the meat of livestock that have eaten
contaminated feed, or from their milk, cheese or eggs (Bintvihok et al., 2002; Battacone et
al., 2003; Van Eikeren et al., 2006). Many mycotoxins are stable to heat and other effects
of food processing. Therefore, processed foods, especially those intended for children,
have to be tested for contamination.

2
The functions of mycotoxins are not fully understood. Mycotoxins are secondary
metabolites, and as such they are not involved in fungal growth, respiration or reproduction.
A range of theories have been put forward as to their precise physiological roles.
Suggestions include that they may be waste products, that they have antibiotic properties,
that they were developed as a chemical defence system or they may facilitate
communication between moulds (Etzel, 2006; Ciegler, 2007).
Approximately 400 mycotoxins exist. Only six or seven, however, are considered
significant, as they are causative agents for a large range of food-borne illnesses in both
humans and livestock. These mycotoxins are the aflatoxins B1, B2, G1 and G2, ochratoxin
A, fumonisin, deoxynivalenol, zearalenone, tricothecenes and patulin.
The detrimental effect of fungal toxins was first uncovered in the 1960‟s when the
consumption of contaminated peanut meal from Brazil lead to the death of 100,000 turkeys
in England. Subsequently, it was discovered that the meal had been infected with the
mycotoxin aflatoxin B1 (Diaz, 2005).
Since then, mycotoxin contamination was linked to many and varied human disorders
depending on the type and dose of the toxin. Acute cases of mycotoxicosis, where large
amounts have been consumed, are generally confined to the developing countries. An
example of this is the acute aflatoxicosis outbreak in Kenya in 2004, which resulted in 125
deaths due to the consumption of contaminated maize (Niyikal et al., 2004; Aziz-
Baumgartner et al., 2005; Lewis et al., 2005). Chronic cases of mycotoxin contamination,
where small amounts of the mycotoxin have been ingested over long periods of time, have
been associated with a wide variety of diseases targeting several organs in humans and
animals. These include Balkan Nephropathy (ochratoxin A) (Petkova-Bocharova et al.,
1991), Reye‟s Syndrome (aflatoxins) (Trauner al., 1984), alimentary toxic aleukia
(tricothecenes) (Lutsky et al., 1983) and oesophageal cancer (fumonisins) (Chu et al.,
1994).

3
Most of the epidemiological research has focused on the individual effects of mycotoxins.
However, several mycotoxins are able to contaminate the same commodity concurrently
(Fernandez al., 2001; Domijan et al., 2005). For example, corn can be infected with
fumonisin, aflatoxin, zearalenone and/or ochratoxin, and there is a positive association
between the presence aflatoxin and patulin in Turkish dried figs (Karaca et al., 2006).
Therefore, recent studies have investigated the simultaneous effects of mycotoxins, or
whether they act additively, synergistically or antagonistically.
An additive effect is when the cumulative effects of two mycotoxins are equal to the sum of
the separate effects. However, a synergistic effect is when the interaction between the
mycotoxins causes a greater effect than just the sum of the individual mycotoxin‟s effect,
whereas an antagonistic effect lessens the combined effect of the mycotoxins through the
interference of one mycotoxin with the effect of the other.
Aflatoxin has an additive affect on both DON and fumonisin B. It acts synergistically with
T2 toxin and ochratoxin A, but works antagnostically with monoliform. A study (Huff et
al., 1986) showed the synergism between AFB1 and T2 by feeding broiler chickens a diet
containing either:
- 2.5μg/g aflatoxin B1
- 4.0 μg/g T-2
- 2.5μg/g aflatoxin B1 + 4.0 μg/g T-2,
and comparing it to uncontaminated feed.
By the end of three weeks, the results show that with the combined diet there was a weight
drop of 28% when compared to the control, whereas with AFB1 and T-2 alone there was a
12% and 8% drop, respectively. A synergistic effect was also noted with respect to the
increase in relative weights of the kidney, liver and spleen, and also with the reduction of
serum protein, glucose, albumin and potassium levels. In a similar experiment, Huff et al.
(1984) also showed the synergistic effect between aflatoxin and ochratoxin A. Boiler
chickens given feed containing either AFB1 (2.5μg/g) or ochratoxin A (2.0μg/g) or both
combined, showed that the diet containing both toxins caused a drop in body weight of 39%
4
compared to aflatoxin (12%) or ochratoxin A (14%) alone. The reason for this may be that
when these toxins are combined they are more effective at disrupting protein synthesis.
The FAO estimates that 25% of the world‟s crops are contaminated with mycotoxins. It is,
however, difficult to calculate the total economic losses as, in addition to losses of crops,
mycotoxin exposure to livestock can cause loss due to reduced fertility, stunted growth and
impaired immunity.
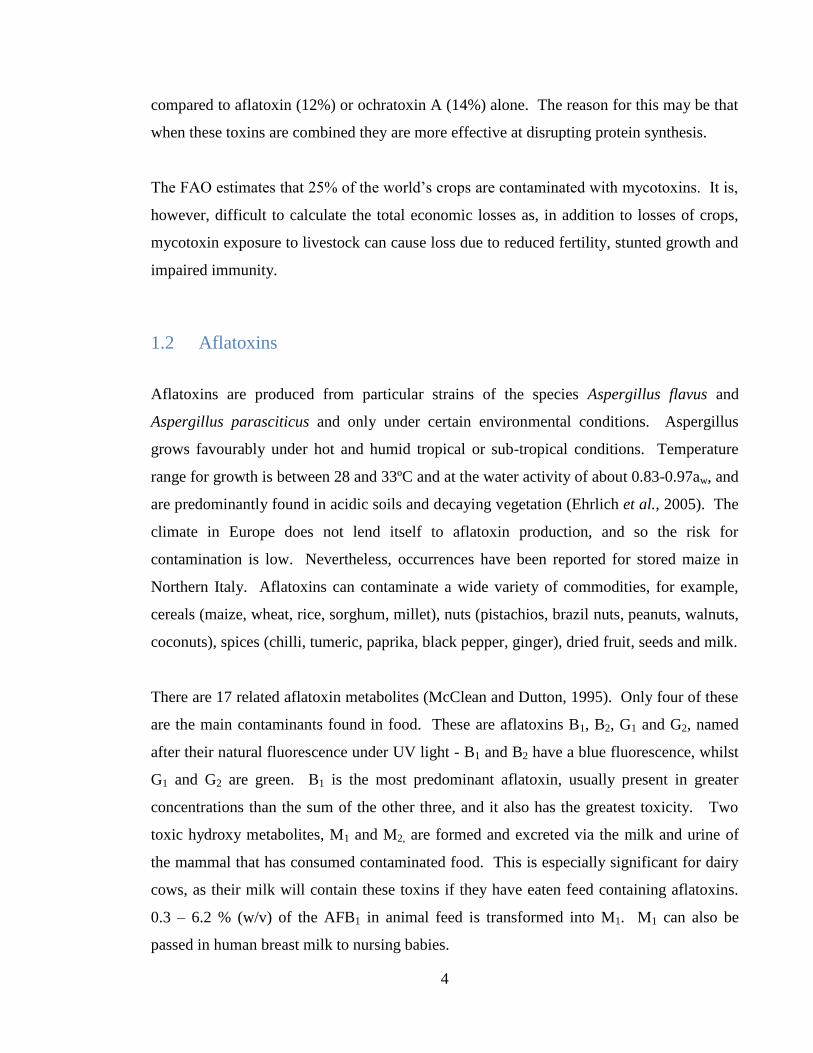
1.2 Aflatoxins
Aflatoxins are produced from particular strains of the species Aspergillus flavus and
Aspergillus parasciticus and only under certain environmental conditions. Aspergillus
grows favourably under hot and humid tropical or sub-tropical conditions. Temperature
range for growth is between 28 and 33ºC and at the water activity of about 0.83-0.97aw, and
are predominantly found in acidic soils and decaying vegetation (Ehrlich et al., 2005). The
climate in Europe does not lend itself to aflatoxin production, and so the risk for
contamination is low. Nevertheless, occurrences have been reported for stored maize in
Northern Italy. Aflatoxins can contaminate a wide variety of commodities, for example,
cereals (maize, wheat, rice, sorghum, millet), nuts (pistachios, brazil nuts, peanuts, walnuts,
coconuts), spices (chilli, tumeric, paprika, black pepper, ginger), dried fruit, seeds and milk.
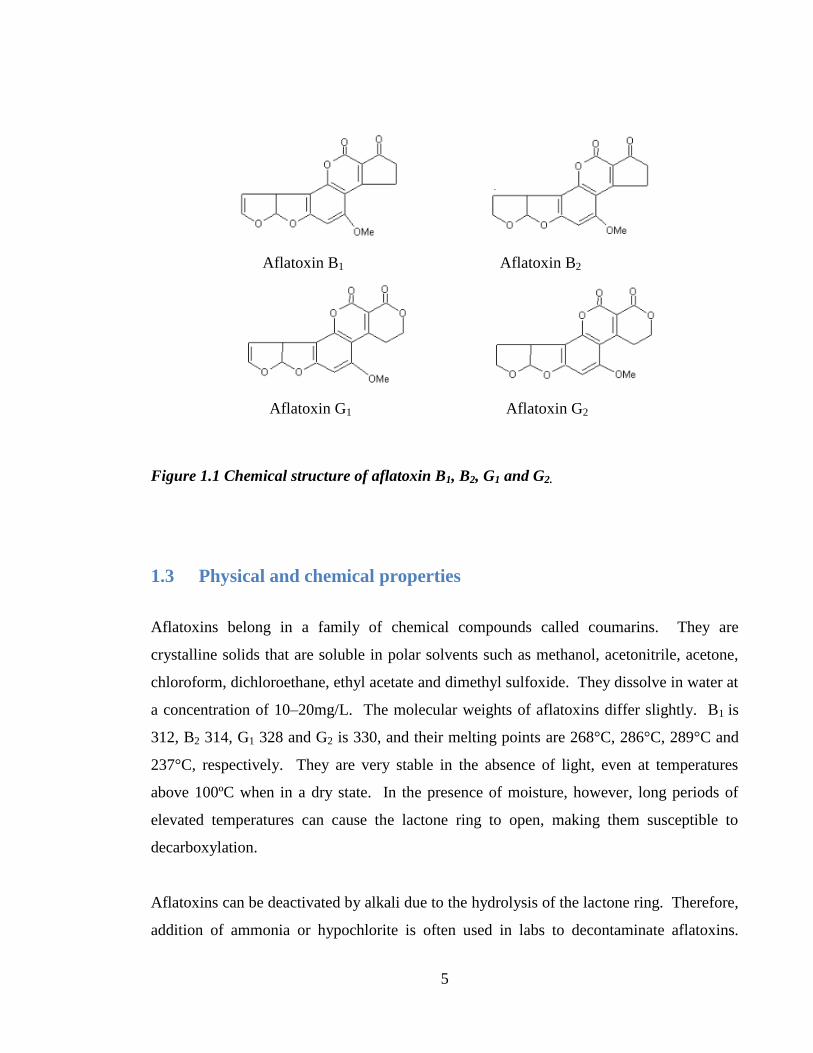
There are 17 related aflatoxin metabolites (McClean and Dutton, 1995). Only four of these
are the main contaminants found in food. These are aflatoxins B1, B2, G1 and G2, named
after their natural fluorescence under UV light - B1 and B2 have a blue fluorescence, whilst
G1 and G2 are green. B1 is the most predominant aflatoxin, usually present in greater
concentrations than the sum of the other three, and it also has the greatest toxicity. Two
toxic hydroxy metabolites, M1 and M2, are formed and excreted via the milk and urine of
the mammal that has consumed contaminated food. This is especially significant for dairy
cows, as their milk will contain these toxins if they have eaten feed containing aflatoxins.
0.3 – 6.2 % (w/v) of the AFB1 in animal feed is transformed into M1. M1 can also be
passed in human breast milk to nursing babies.
5
Figure 1.1 Chemical structure of aflatoxin B1, B2, G1 and G2.
1.3 Physical and chemical properties
Aflatoxins belong in a family of chemical compounds called coumarins. They are
crystalline solids that are soluble in polar solvents such as methanol, acetonitrile, acetone,
chloroform, dichloroethane, ethyl acetate and dimethyl sulfoxide. They dissolve in water at
a concentration of 10–20mg/L. The molecular weights of aflatoxins differ slightly. B1 is
312, B2 314, G1 328 and G2 is 330, and their melting points are 268°C, 286°C, 289°C and
237°C, respectively. They are very stable in the absence of light, even at temperatures
above 100ºC when in a dry state. In the presence of moisture, however, long periods of
elevated temperatures can cause the lactone ring to open, making them susceptible to
decarboxylation.
Aflatoxins can be deactivated by alkali due to the hydrolysis of the lactone ring. Therefore,
addition of ammonia or hypochlorite is often used in labs to decontaminate aflatoxins.
Aflatoxin B1
Aflatoxin G2 Aflatoxin G1
Aflatoxin B2

6
However, if the basic conditions are mild, acidification can reverse the reaction forming the
original aflatoxin.
1.4 Epidemiology
Aflatoxins, especially B1, are the most potent naturally occurring toxins, primarily targeting
the liver. Exposure to large doses of aflatoxin B1 can cause acute toxicity in both animals
and humans, whereas chronic toxicity caused by prolonged exposure to lower doses is
carcinogenic. It was described by the International Agency on Research on Cancer (IARC)
in 1993 as a group I carcinogen. This means that there is sufficient evidence available to
implicate aflatoxin as causative of human hepatocellular carcinoma (HCC). They are also
teratogenic, mutagenic and immunosuppressive (Kihara et al., 2000).
Acute toxicity has been studied in a wide range of animals from trout to primates (Pier et
al., 1992). The susceptibility of a species to aflatoxin exposure varies (Table 1.1). In most
animal studies, however, exposure resulted in hepatocellular and/or cholangiocellular liver
tumours, including carcinomas. The LD50 scores, the dose required to kill half the
population, are generally between 0.5 and 10mg/kg body weight. Susceptibility to
aflatoxicosis has also been shown to be gender-specific in both rat and mice studies, with
males being more sensitive than females.
7
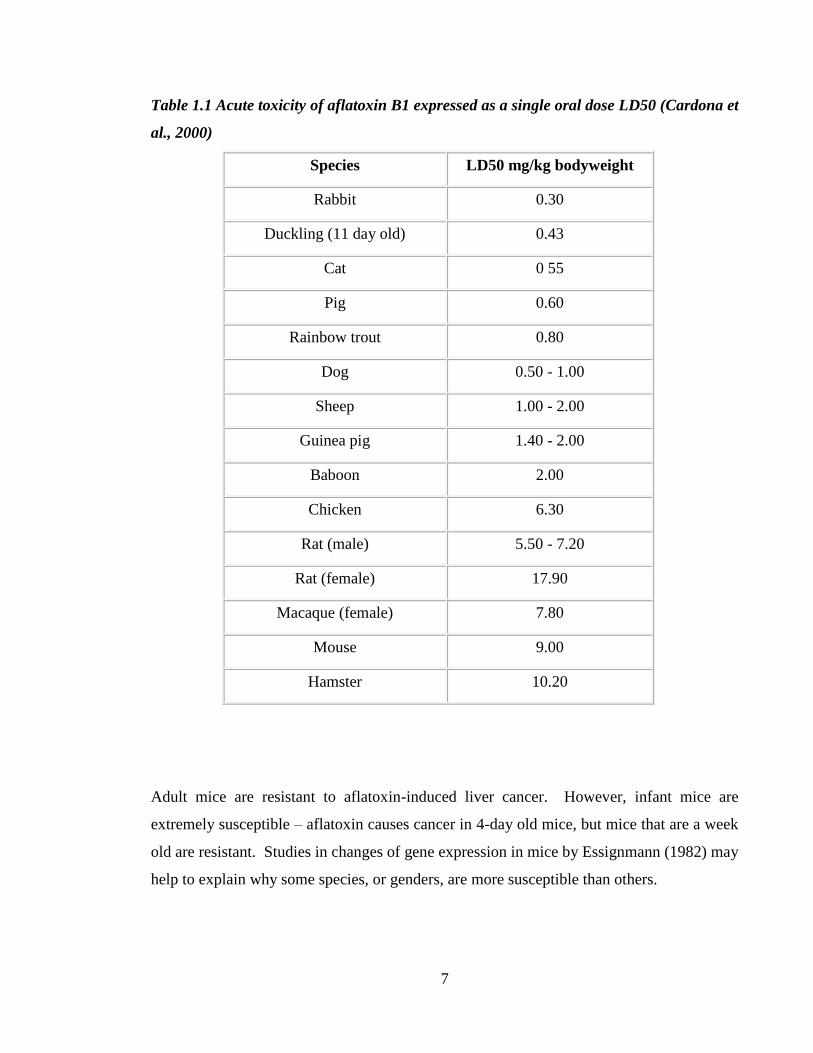
Table 1.1 Acute toxicity of aflatoxin B1 expressed as a single oral dose LD50 (Cardona et
al., 2000)
Species LD50 mg/kg bodyweight
Rabbit 0.30
Duckling (11 day old) 0.43
Cat 0 55
Pig 0.60
Rainbow trout 0.80
Dog 0.50 - 1.00
Sheep 1.00 - 2.00
Guinea pig 1.40 - 2.00
Baboon 2.00
Chicken 6.30
Rat (male) 5.50 - 7.20
Rat (female) 17.90
Macaque (female) 7.80
Mouse 9.00
Hamster 10.20
Adult mice are resistant to aflatoxin-induced liver cancer. However, infant mice are
extremely susceptible – aflatoxin causes cancer in 4-day old mice, but mice that are a week
old are resistant. Studies in changes of gene expression in mice by Essignmann (1982) may
help to explain why some species, or genders, are more susceptible than others.

8
Exposure to fatal doses of aflatoxins (>6000mg) are rare, with outbreaks confined to the
developing countries, and are caused by contamination of a staple food, such as rice, maize
or wheat. The most recent outbreak of aflatoxicosis was in Kenya from January to June
2004, where maize stocks had been contaminated to concentrations as high as 4,400 ppb,
over 220 times greater than the regulatory limits set for Kenya (Niyikal et al., 2004; Aziz-
Baumgartner et al., 2005; Lewis et al., 2005). This episode resulted in 317 cases and 125
deaths Since then several isolated instances of aflatoxin fatalities have occurred. For
example, 5 deaths were reported in April 2006 in the Makueni district of Kenya. In total in
Kenya alone over the last 2 years 100 known fatalities caused by aflatoxins were reported
(FAO/WHO).
Aside from cases of acute aflatoxicosis, chronic doses of aflatoxin over extended periods of
time can also be attributed to many deaths in the developing world.
Aflatoxin has a positive association with hepatocellular carcinoma, which is the fifth most
common and the third most fatal cancer worldwide, causing an estimated 500,000 deaths
annually. Other deaths that have been linked to aflatoxin contamination are caused by
either the loss of immunity or malnutrition, especially to the old and very young. Aflatoxin
in weaning foods or breast milk from a mother who has consumed contaminated food can
cause stunted growth and underweight children. Also, reduction in immunity caused by
aflatoxin consumption can lead to increased susceptibility to a range of diseases, for
example AIDS, or infections from drinking unsafe water.
Fatalities from acute aflatoxicosis are not restricted to humans, a recent example was in
January 2006, where over 100 dogs died due to the contamination of dog food in America
(Leung et al., 2006; Stenske et al., 2006). Symptoms included loss of appetite, jaundice,
severe vomiting combined with bloody diarrhoea and a fever. All dogs died of liver failure.
9
1.5 Mechanism of AFB1-induced DNA damage
After ingestion, aflatoxin is transported to the liver, where it is oxidised by the enzyme
cytochrome P450 (McClean and Dutton, 1995; Turner et al., 1998). The function of
cytochrome P450 is to convert toxins into a more soluble form to facilitate their removal
from the body via the kidney. However, in the case of aflatoxins, the enzyme forms an
intermediate through the addition of an oxygen onto the aflatoxin molecule, converting it to
a highly reactive and mutagenic compound, AFB1-8,9-epoxide (Figure 1.2).
The epoxide can be deactivated by addition of a glutathione molecule, facilitated through
the enzyme glutathione S-transferase, making it more water soluble and easier to eliminate
from the body. However, due to the reactive nature of the epoxide, there is not enough
time for this reaction to be completed, and the intermediate can attack DNA. AFB1-8,9-
epoxide can exist as two stereoisomers in an exo and an endo conformation. AFB1- exo-
epoxide is 1000 fold more reactive than the endo form, and can react with DNA forming
AFB1 adducts with a yield of 98%, despite having a half-life of only one second in aqueous
buffer (Bedard et al., 2006). Mice are able to express constitutively an α-class glutathione-
S-transferase which has higher specificity to AFB1-exo-epoxide, resulting in faster
detoxification by glutathione conjugation. This has been linked to the relative resistance
mice have to the toxicity of aflatoxins (Wang et al., 2000).
The primary DNA adduct that the epoxide forms is 8,9-dihydro-8-(N7-guanyl)-9-
hydroxyaflatoxin B1 (AFB1-N7-Gua) when the C8 position of the epoxide reacts with the
N7 position of guanine in DNA (Bedard et al., 2006). The formation of AFB1-N7-Gua is
directly proportional to the amount of AFB1 ingested and, as it is excreted via urine, several
human studies have exploited this correlation to investigate the relationship between dietary
exposure to AFB1 and hepatocellular carcinoma (HCC) (Groopman et al., 1992, Groopman
et al., 1993; Groopman et al., 1996).
AFB1-N7-Gua is unstable due to the positive charge on the imidazole ring, with a half-life
of 7.5 hours in rat liver (Wang and Groopman, 1999). It is then broken down to form two
10
secondary compounds. The first is due to depurination leading to the formation of an
apurinic (AP) site. The second, is produced when the mildly alkali conditions hydrolyse
the imidazole ring, opening it up, resulting in the creation of the stable AFB1-
formamidopyrimidine adduct (AFB1-FAPY) (Bailey et al., 1996; Keller- Seitz et al., 2004).
It is the AFB1-FAPY adduct that has been implicated as the causative species for HCC.
Both AFB1-N7-Gua and AFB1-FAPY adducts alter the structure of DNA. However, AFB1-
FAPY is less distortive and thus is more resistant to repair through the nucleotide excision
repair pathway. This adduct is, therefore, resistant and can interfere with DNA replication.
It is probably responsible for the G to T transformation in the third position of codon 249 of
the p53 tumour suppressor gene that is associated with over 50% of AFB1-related
hepatocellular carcinoma (Aguilar et al., 1993; Bailey et al., 1996; Smela et al., 2002).
- 11 -
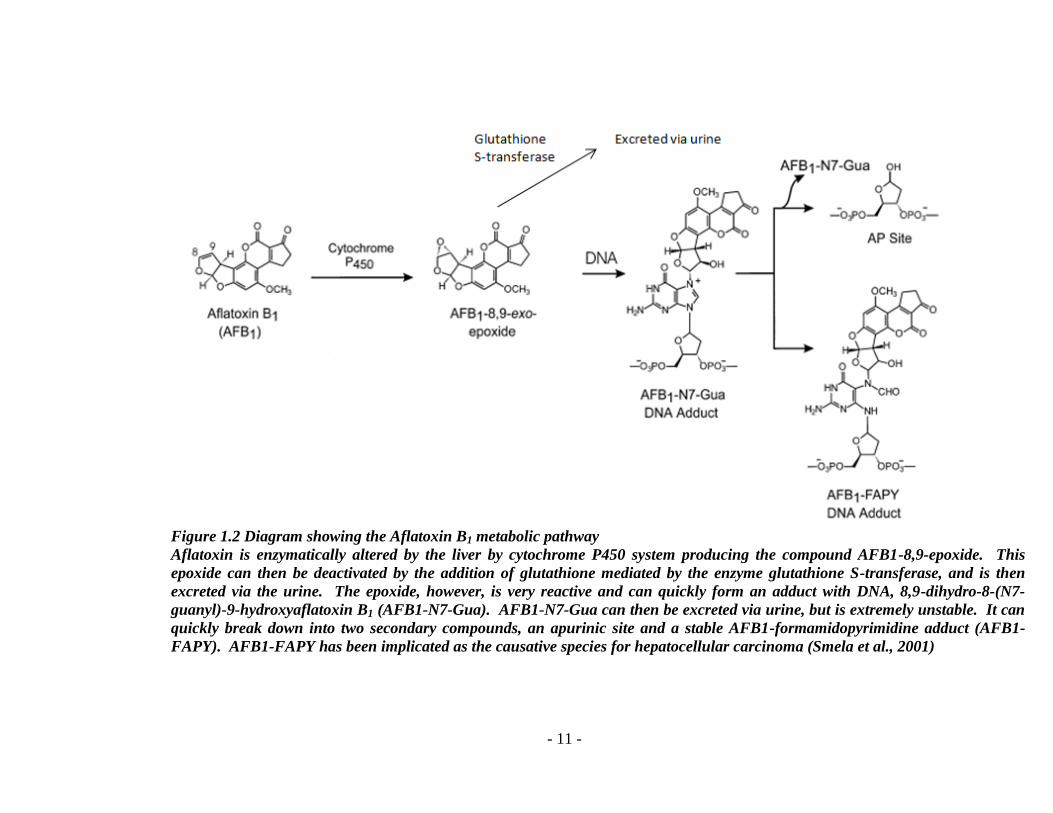
Figure 1.2 Diagram showing the Aflatoxin B1 metabolic pathway
Aflatoxin is enzymatically altered by the liver by cytochrome P450 system producing the compound AFB1-8,9-epoxide. This
epoxide can then be deactivated by the addition of glutathione mediated by the enzyme glutathione S-transferase, and is then
excreted via the urine. The epoxide, however, is very reactive and can quickly form an adduct with DNA, 8,9-dihydro-8-(N7-
guanyl)-9-hydroxyaflatoxin B1 (AFB1-N7-Gua). AFB1-N7-Gua can then be excreted via urine, but is extremely unstable. It can
quickly break down into two secondary compounds, an apurinic site and a stable AFB1-formamidopyrimidine adduct (AFB1-
FAPY). AFB1-FAPY has been implicated as the causative species for hepatocellular carcinoma (Smela et al., 2001)

- 12 -
1.6 p53
p53 is a transcription factor that plays a role in many anti-cancer mechanisms. It regulates
the cell cycle, promotes DNA repair and initiates apoptosis (or programmed cell death).
P53 consists of 3 domains, a C-terminus from amino acids 280 – 390, which is the domain
that allows the molecule to self-oligomerise to form tetramers, the middle region, consisting
of amino acids 80 – 290 that is the DNA binding region, and the remainder, the N-terminal
region, which is the part that confers transcription activation capabilities (Wang et al.,
1994).
Aflatoxin causes a mutation in the third position of codon 249, where an arginine is
converted to a serine. This amino acid convertion is a „loss-of-function‟ mutation, and
destroys the ability of the p53 molecule to bind with DNA. Molecules that have these
mutations bind to wild type p53 molecules and then prevent them from activating
transcription. If there is a mutation in the gene encoding p53, tumour suppression is
drastically compromised. In fact, a mutation in this gene is implicated in 50% of all human
cancers (Smela et al., 2001).
1.7 Hepatitis B
Studies with transgenic animals have shown that Hepatitis B virus (HBV) infection and
AFB1 exposure act synergistically in the development of hepatocellular carcinoma (HCC)
(Kew, 2003). Another study has shown that a person is three times more likely to develop
HCC when they test positive for AFB1-N7-Gua and are seven times more likely when they
are infected with HBV. However, when a person tests positive for both AFB1-N7-Gua and
HBV, they are sixty times more likely to develop the disease (Smela et al., 2001). This
explains why in areas that both HBV and aflatoxin consumption are prevalent,
predominantly in the developing world, instances of HCC are high. For example, in
Mozambique and in some provinces in China 65-75% of males and 30-55% of females of
all cancer deaths are HCC, compared to 2% in the United States (Sell, 2003).
- 13 -
The mechanism for synergism effect between HBV and AFB1 is still not fully understood.
Several hypotheses have been suggested (Kew, 2003). These include, the involvement of
the 17kDa HBV X protein (HBx), which is required for the establishment of the virus. It is
thought that this protein inhibits nucleotide excision repair, allowing the persistence of
DNA-AFB1 adducts and thus allowing an increased frequency of mutations (Smela et al.,
2001). Another suggestion is that the HBV may induce cytochrome P450 production,
which would increase the amount of AFB1 conversion into the more reactive AFB1-8,9-
epoxide (Kew, 2003).
1.8 Other diseases associated with AFB1
AFB1 is characteristically associated with hepatic carcinoma, but it has also been implicated
in tumourogenesis of the lung following both ingestion and inhalation of the toxin
(Donnelly al., 1996; Desai al., 2003). Whereas cytochrome P450 plays the major role in
the bioactivation of AFB1 in the liver, in the lung the main mediators in the conversion of
AFB1 to the epoxide are lipoxygenase and prostaglandin H synthase.
AFB1 has also been implicated in other diseases, for example Reye‟s syndrome (Trauner et
al., 1984) and Kwashiorkor (Hendriekse et al., 1982). Reyes‟s syndrome is a children‟s
disease that attacks all organs of the body, but in particular the liver and brain. If left
untreated this disease may progress into a deep coma, and finally death. Fatality of this
disease is common, up to as many as 40% of all cases. Kwashiorkor, again, is a childhood
disease, most common in developing countries, and is caused by inadequate intake of
proteins. Symptoms include an extended abdomen and a reddish discolouration to the hair.
Although this disease can be treated simply by adding protein to the diet, mortality can be
as high as 60% or can result in arrested mental development.
Aflatoxin has also been strongly linked to immunosupression, and has been shown in many
livestock animals. Poultry (chickens and turkeys), pigs and lambs in particular are at risk
from immunosuppression caused by aflatoxins (Devegowda and Murphy, 2005; Smith et
al., 2005). Although the mechanisms of how aflatoxins do this is unknown, studies have
shown that animals fed with aflatoxins show a decrease in specific antibody production and
- 14 -
the phagocytic activity of macrophages also falls. A reduction in both humoral and cell
mediated immunity decreases the resistance to infectious diseases. This is most relevant for
people in the developing world where depressed immunity caused by dietary aflatoxin
intake increases the risk of contracting infectious diseases such as HIV and tuberculosis.
Reduced immunity to animals can lead to reduced weight and growth and reduced egg and
milk production These have implications for the farmer e.g. losses in productivity.
Aflatoxin has also been shown to be teratogenic in rats, mice and hamsters, promoting
miscarriage and, thus, reducing normal birth rates.
1.9 Aflatoxin prevention
Aflatoxin contamination, under favourable conditions, is unavoidable. However, several
methods can help reduce the amount of aflatoxin generated. The simplest way of reducing
exposure to aflatoxins is improved storage, as most contamination occurs post-harvest. An
intervention study in West Africa showed that by employing simple post-harvest methods,
a drastic reduction in the blood marker aflatoxin-albumin was observed (Turner et al.,
2005). These methods included basic procedures to reduce fungal growth, such as hand
sorting, sun drying on mats, storage in natural-fibre bags and using wooden pallets to raise
the bags from the ground.
Aflatoxin can be reduced in animal feeds by either physical or chemical means. Physical
methods include heat, microwaves, gamma rays, X-rays, UV light and adsorption.
Adsorption methods involve the addition of inert chemicals to feed that are able to
physically bind to aflatoxin (Philips et al., 1999). The binding prevents the aflatoxin from
becoming absorbed across the intestinal tract, and the aflatoxins, therefore, are passed out
of the body via the faeces. Adsorbents include some aluminosilicates (Scheideler, 1993),
polymeric glucomannan (a compound extracted from yeast cell walls) (Karaman et al,
2005), and chlorphyllin, a chemical closely related to chlorophyll (Simonich et al, 2007).
AFB1 also binds to a number of different strains of lactic acid bacteria (LAB) (Haskard et
al., 2001; Gratz et al., 2004). LAB are probiotic bacteria found in healthy intestinal
- 15 -
microflora and have a positive effect on the removal of mutagens in the gut. AFB1 binds
non-covalently and extra-cellularly to the cell wall polysaccaride and peptidoglycan. This
also has potential for future applications to remove AFB1 from animal feed. The most
successful way, however, of reducing aflatoxins in feed is ammoniation which reduces 95 –
98% of AFB1. This method, however, is used only for animal feed, and is not used for
food to be consumed by humans. Methods used in developing countries to reduce aflatoxin
contamination include par boiling rice and roasting pistachios in lemon juice. Diet can also
be important – both vitamin A (retinol), zinc, iron and selenium seem to alleviate the
effects of aflatoxin B1. A low protein diet also has been shown to reduce the
carcinogenicity of AFB1. In a study using Fischer rats, Youngman et al. (1992) compared
aflatoxin-induced liver tumour development with rats fed a 5% (w/v) casein diet compared
with those fed a 20% (w/v) casein diet. The experiment showed that animals fed with the
high protein diet had an approximately six times greater risk of developing a tumour on the
liver. This research seems to contradict findings that a low protein diet in humans actually
accelerated aflatoxin carcinogenesis in the case of people suffering from Kwashikor. It has
been shown, however, that a low protein diet enhances the acutely toxic aflatoxin lesion but
depresses the carcinogenic lesion (Appleton et al., 1983).
Chemoprotection is also being examined as a means to reduce AFB1-induced HCC in areas
with high instances of hepatitis B, as well as high AFB1 contamination risk. An example of
this is the anti-schistosomal drug Oltipraz (4-methyl-5-[N-2-pyrazynil]-1,2-dithiole-3-
thione) (Bammler et al., 1999). Rats treated with Oltipraz have shown resistance to the
development of liver tumours (Buetler et al., 1996). Although the mechanism is largely
unknown, experiments have been undertaken with marmosets, as they have similar
oxidative profiles to humans (Bammler et al., 2000). Results have shown that Oltipraz
reduces AFB1 activation by inhibiting cytochrome P450 and decreasing AFB1-DNA adduct
formation, and it also slightly induces glutathione S-transferase. These three mechanisms
in combination can all protect against AFB1-induced mutagenicity.
- 16 -
1.10 Legislation and regulatory limits for aflatoxins
In an attempt to limit exposure to aflatoxins many countries (approximately 100) have
imposed regulatory limits for aflatoxins levels in both food and animal feed. Limits are
selected to ensure adequate protection against the toxin, but are also designed to minimise
the large negative impact on trade. Regulations are based on the known toxicology of the
toxin. The Joint FAO/WHO Expert Committee on Food Additives (JECFA) has recently
evaluated the toxicity of aflatoxin. The typical end result of this is a regulation based on
the Provisional Tolerable Weekly/Daily Intake (PTW/DI), which has been evaluated using
the No Observable Adverse Effect Level (NOAEL). The NOAEL is based on animal
toxicology studies, incorporating an uncertainty factor of 100 – an extrapolation of 10 from
animals to humans, and then a factor of 10 for the variation of an individual. However, in
the case of aflatoxins, when their carcinogenicity has been proven, the level of the
contaminant has to be As Low As Reasonably Achievable (ALARA). The ALARA
principle is applied when the contaminant is ubiquitous and cannot fully be removed from
the food. The aim is to exclude as much of the toxin as possible from the food supply
(FAO Corporate Document Repository, 2004).
International limits for aflatoxins have yet to be harmonised, but the Codex Alimentarius
Commission has suggested guidelines. The Food and Agriculture Organization of the
United Nations (FAO), and the World Health Organization (WHO) established the Codex
Alimentarius jointly in 1963 to protect consumers‟ health and fair trade, and to help
establish coordinated regulations. In addition to the Codex regulations, many countries
have set their own limits. However, there can be quite a large discrepancy between the
regulatory limits in different countries (Figures 1.3 and 1.4). For example, limits for food
for direct human consumption can range between 1 and 20 parts per billion (ppb) for
aflatoxin B1 and between 0 and 35 ppb for total aflatoxins.

- 17 -
Figure 1.3 Graph showing the worldwide limits for aflatoxin B1 in food
The limits for aflatoxin B1 worldwide range from 1ng/g to 20ng/g. The most general
limit for aflatoxin B1 in food worldwide is 2ng/g (FAO Corporate Document Repository,
2004)
The regulations of some countries are more comprehensive than others (Table 1.2). For
example Australia and New Zealand have only one specific regulatory limit set, for peanuts
and tree nuts at 15μg/kg total aflatoxins. All other foods have been set at 5μg/kg. The
most complete set of regulations including coverage of the largest range of foodstuffs and
feed was set by the EU. This was most recently updated in 2006 when new regulations
were set By the European Commission for aflatoxin B1 in infant formula. It was set at 0.05
µg/kg (Commission Regulation (EC) No 1881/2006).
Worldwide limits for aflatoxin B1 in food
1
29
21
5
2
3
0 5 10 15 20 25 30 35
1
2
5
10
15
20
Co
ncen
trati
on
(u
g/k
g)
Number of countries
Co
nc
en
tra
tio
n (
ng
/g)

- 18 -
Figure 1.4 Graph showing the worldwide limits for total aflatoxins in feed
The limits for total aflatoxins worldwide range from 0ng/g to 35ng/g. The most general
limit for aflatoxin B1 in food worldwide is 4ng/g (FAO Corporate Document Repository,
2004)..
Some countries (such as the US and Canada, following Codex guidelines) have set limits
for total aflatoxins only, whereas other countries (for example members of the EU) have
regulations for both total aflatoxins and aflatoxin B1.
Apart from Europe other countries from the same geographical area have similar limits. In
Latin America, for example, the aflatoxin regulations have been harmonized through a
trading block of countries, MERCOSUR (Mercado Comun del Sur), which comprises
Argentina, Brazil, Paraguay and Uruguay, although other countries also follow these
regulations. Brazil and Uruguay have applied additional regulations to certain matrices.
Africa has 15 countries that have regulatory limits set for mycotoxins, most of which
include limits for aflatoxins.
Worldwide limits for total aflatoxin in food
0 10 20 30 40
0
1
3
4
5
10
15
20
30
35
Co
nc
en
tra
tio
n (
ug
/kg
)
Number of countries
Co
nc
en
tra
tio
n (
ng
/g)

- 19 -
ASEAN (Association of Southeast Asian Nations), consisting of Brunei Darussalam,
Cambodia, Indonesia, Lao People‟s Democratic Republic, Malaysia, Myanmar, the
Philippines, Singapore, Thailand and Vietnam, do not have harmonised regulations. These
countries all have specific regulations, the most strict of which was set by Singapore.
Milk and milk products, including infant formulae, are a staple food for babies and young
children, who are highly susceptible to the adverse effects of AFB1. Some countries,
therefore, have enforced stringent regulatory limits to protect those most at risk. The
lowest limits that have been set for AFB1 have been for infant formula by the EU. The
limits have currently been set at 0.1ppb (0.1μg/kg).

20
Table 1.2 Comparison between worldwide aflatoxin regulations
Regulatory limits for aflatoxin can vary greatly between different foods and at different places around the world. This table
highlights how greatly the regulations can vary (FAO Corporate Document Repository, 2004)..

21
1.11 Methods of Analysis
The establishment of regulatory limits for aflatoxin has necessitated reliable and sensitive
analytical methods of detection and analysis. Several official or regulatory laboratories
have already validated numerous methods. These organisations include the Association of
Official Analytical Chemists (AOAC), the International Union of Pure and Applied
Chemistry (IUPAC), International Organisation for Standardisation (ISO), and its European
counterpart the European Committee for Standardisation (CEN).
The first methods that were validated to test for mycotoxins used thin layer
chromatography (TLC). Aflatoxin has a natural fluorescence, and so can be detected using
UV light. These methods are simple and cheap, but they are insensitive and lack precision
(repeatability and reproducibility). They have been overtaken by other chromatographic
methods, such as High Performance Liquid Chromatography (HPLC) (improved by
derivatisation with bromine) (Dunne et al., 1993; Zhang et al., 2004; Seuva et a.l, 2005),
HPLC/MS (HPLC/mass spectrometry) (Biancardi et al., 2005) LC-MS/MS (Liquid
Chromatography/Mass Spectrometry/Mass Spectrometry) and GC/MS (gas
spectrometry/MS) (Sforza et al., 2005; Cavaliere et al., 2006). These methods are more
sensitive than TLC, but are time consuming, labour intensive and require skilled training.
They also require high consumption of hazardous solvents, and, so, are often expensive.
Therefore, they are unsuitable for the analysis of large numbers of samples.
More recently, however, the advent of immunoassays has had a significant impact on
aflatoxin detection and quantification. Immunassays are simple, quick and cheap to apply
for routine monitoring of aflatoxin contamination. These can then be checked by an
analytical method, such as HPLC. Immunological assays can come in many different
formats – e.g. ELISA (enzyme-linked immunosorbant assay) (Reddy et al., 2000;
Gathumbi et al., 2003) and lateral flow strips (Sibanda et al., 1999; Blesa et al., 2003).
These methods are ideal for screening large numbers of samples, but they can suffer from
matrix interference depending on the food type being tested and they lack the sensitivity of
22
detecting aflatoxin B1 as low as the regulatory limits, especially for limits as low as 0.1ppb
for infant formula.
Another immunological method that have become increasingly popular is the use of
immunoaffinity columns (IAC‟s) (Stroka et al., 2000; Senyuva et al., 2005; Castegnaro et
al., 2006; Ip et al., 2006). Immunoaffinity columns have been used for aflatoxin isolation
from complex matrices prior to analysis. They consist of antibodies immobilised onto a
stationary phase (e.g. sepharose). When a sample is passed through the column all the
aflatoxin binds to the antibodies and remains in the column. The other components from
the sample, however, are washed through the column and discarded. The aflatoxins are
then eluted from the column with a solvent, resulting in a pure solution of aflatoxin, which
can then be quantified using HPLC or GC methodology. IAC‟s are simple to use and
drastically reduce sample preparation time. One drawback, however, is that they can be
relatively expensive and generally cannot be re-used efficiently.
There are also several automated systems in development that can detect and quantify
aflatoxins that are not yet commercially available, each utilising a different innovative
technology. These include optical waveguide lightmode spectropscopy (Adanyi et al.,
2007), sol particle immunoassay (Brenn-Struckhofova et al., 2007), fluorescence
polarisation (Nasir et al., 2002), affinity electrochemistry (Mascini et al., 2001), fluid
based-bioaerosols and surface plasmon resonance (SPR) (Daly et al., 2000; Maragos et al.,
2002; Dunne et al., 2005). Surface plasmon resonance was chosen as the sensor detection
system for the study of aflatoxin determination in this research.
1.12 Surface Plasmon Resonance
Surface Plasmon Resonance (SPR) is an optical technique that can measure biomolecular
interactions, allowing detection and quantification of specific analytes in a solution.
Although several commercial systems are available, the most universal is BiacoreTM
, who
have established a clear leadership in SPR technology, holding approximately 90% of the
market (Figure 1.5).
23
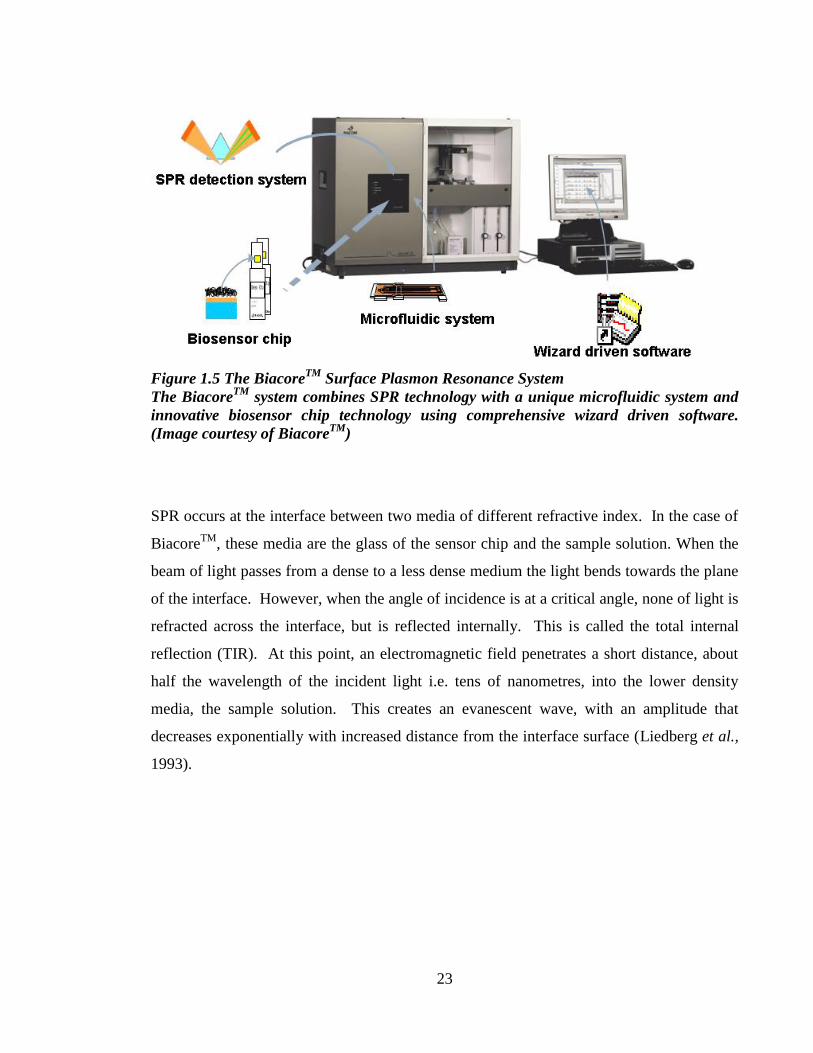
Figure 1.5 The BiacoreTM
Surface Plasmon Resonance System
The BiacoreTM
system combines SPR technology with a unique microfluidic system and
innovative biosensor chip technology using comprehensive wizard driven software.
(Image courtesy of BiacoreTM
)
SPR occurs at the interface between two media of different refractive index. In the case of
BiacoreTM
, these media are the glass of the sensor chip and the sample solution. When the
beam of light passes from a dense to a less dense medium the light bends towards the plane
of the interface. However, when the angle of incidence is at a critical angle, none of light is
refracted across the interface, but is reflected internally. This is called the total internal
reflection (TIR). At this point, an electromagnetic field penetrates a short distance, about
half the wavelength of the incident light i.e. tens of nanometres, into the lower density
media, the sample solution. This creates an evanescent wave, with an amplitude that
decreases exponentially with increased distance from the interface surface (Liedberg et al.,
1993).

24
Figure 1.6 Surface Plasmon Resonance
When a sample is passed through the flow channel specific antigens (if present in the
sample) will bind to the antibody coated surface. This causes a shift in the resonance
angle of the refracted polarised light shone onto the chip. This change in angle is directly
proportional to the amount of bound antigen. (Image courtesy of BiacoreTM
)
If the interface is covered with a thin layer (50nm) of a metal (usually gold), and the light is
p-polarized and monochromatic, under conditions of TIR, photons react with the free
electron cloud in the metal and are converted into surface plasmons, the particle name of
electron density waves.
The evanescent wave field penetrates the sample solution. It is, therefore, sensitive to
solute concentration at that point and the binding of molecules from the sample onto the
gold surface can cause changes in the refractive index. This is measured as a change in
resonance angle and is directly proportional to the amount of biomolecules bound. The
shift in resonance angle is directly proportional to the mass increase on the chip surface.
The change of angle, or the response, is measured in arbituary units, Resonance Units (RU),
where 1 RU is equivalent to a shift in angle of 0.0001º (Huang et al., 2007). For most
proteins this is a change in concentration of 1pg/mm2
on the sensor surface.

25
1.13 Sensor Surface
In the BiacoreTM
system, the sensor surface is a removable, re-usable sensor chip,
consisting of a glass surface coated with a thin layer of gold (50nm) at the interface
between the glass and the buffer (Figure 1.7). A variety of other metals can be used for
SPR. To be suitable for SPR a metal‟s conduction electrons must be able to resonate with
light at a particular wavelength, generally in the visible and near infrared parts of the
spectrum, as there are a number of detectors readily available for these regions.
Appropriate metals include aluminium, silver, copper, sodium, indium and gold. Gold has
been chosen as the ideal candidate as it is inert and resistant to oxidation, while still
allowing the attachment of antibodies. It also produces a strong SPR signal in the near-
infrared region.
Figure 1.7 BiacoreTM
CM5 Sensor Chip
The sensor chip consists of gold-coated glass surface. A linker layer is coated onto the
gold. In the case of the CM5 chip it is carboxymethylated dextran. The dextran layer
then facilitates the attachment of the coupling surface. In this assay the coupling
surface consists of the aflatoxin B1 derivative aflatoxin B1-oxime-ethylenediamine.
To measure binding of molecules at the sensor surface one of the binding partners must be
immobilised onto the gold surface, which is facilitated through covalent attachment. The
most commonly used and versatile chip, the Sensor Chip CM5, is coated with a 100–200nm
carboxymethylated dextran layer. This dextran hydrogel layer is hydrophilic and allows

26
attachment of molecules via amine, thiol, aldehyde, hydroxyl or carboxyl groups, without
causing them to denature (Shankaran et al., 2007). The sensor surface is generally very
stable, which allows it to be reused hundreds of times whilst still maintaining high
precision and accuracy in many cases.
1.14 Microfluidic System
Another feature of the BiacoreTM
system is the unique microfluidic system, which allows a
continuous and controlled flow of liquid over the sensor surface. When the sensor chip is
docked in the instrument, it is pressed against the integrated microfluidic cartridge (IFC)
and four flow cells are formed, which range in size from 20 to 60nl, depending on the
model of the instrument. The analyte is then able to flow continuously at a constant
concentration over any one of the flow cells. The sample volumes can be in the range of 5
to 450μl and with a flow rate of between 1 and 100 μl/min. This system has numerous
advantages. These include the exclusion of air from the chip surface thus preventing
protein denaturation or sample evaporation, low sample consumption and the removal of
the necessity for washing steps.
The models Biacore-Q and Biacore-1000 only allow the monitoring of one flow cell at a
time. Biacore 2000 and Biacore 3000, however, allow a sample to pass over the four flow
cells sequentially, following the response from all four flow cells in parallel. This means
that four different assays can potentially be performed on one sample in the same run.
1.15 Surface Plasmon Resonance Sensorgrams
The association and disassociation of analytes in the sample binding to the sensor chip
surface is followed, in “real-time”, on a graph, called a sensorgram. The sensorgram
measures changes in response units (RU) over time, where one thousand RU is equivalent
to approximately 1ng of analyte bound to the chip surface.
When a sample is injected over the chip surface, there is an interaction between the
molecules in the sample and the flow cell surface. If the binding molecules are present,
27
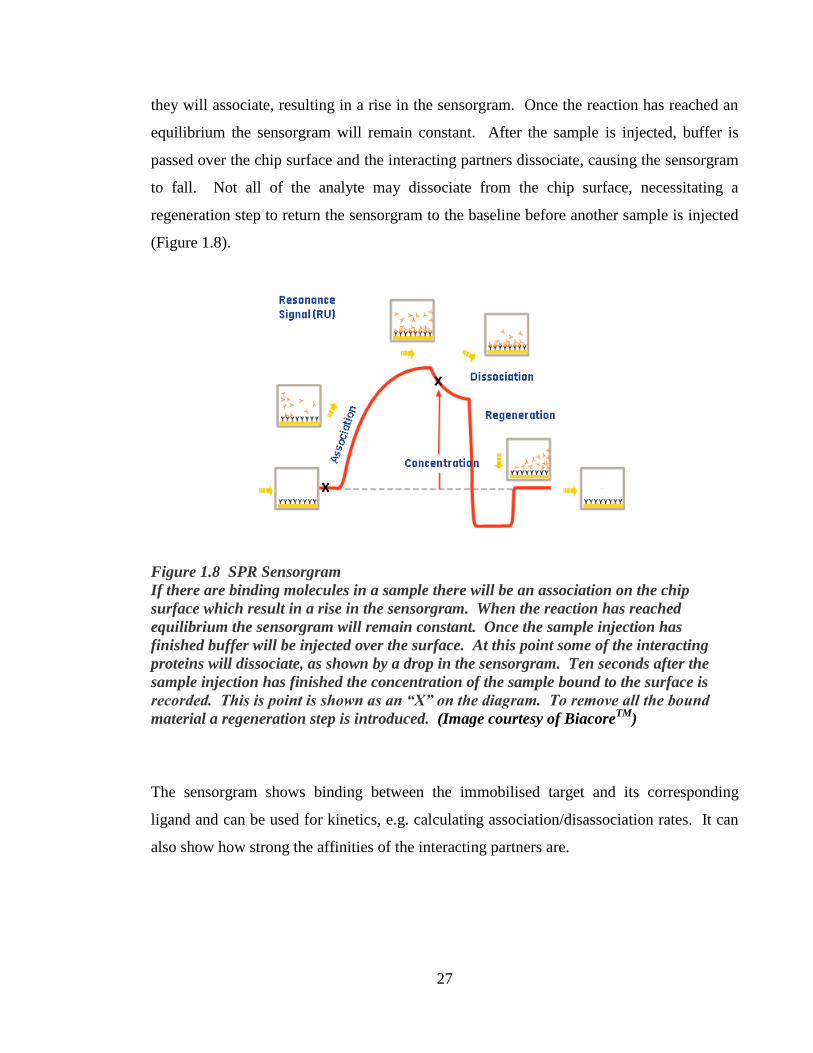
they will associate, resulting in a rise in the sensorgram. Once the reaction has reached an
equilibrium the sensorgram will remain constant. After the sample is injected, buffer is
passed over the chip surface and the interacting partners dissociate, causing the sensorgram
to fall. Not all of the analyte may dissociate from the chip surface, necessitating a
regeneration step to return the sensorgram to the baseline before another sample is injected
(Figure 1.8).
Figure 1.8 SPR Sensorgram
If there are binding molecules in a sample there will be an association on the chip
surface which result in a rise in the sensorgram. When the reaction has reached
equilibrium the sensorgram will remain constant. Once the sample injection has
finished buffer will be injected over the surface. At this point some of the interacting
proteins will dissociate, as shown by a drop in the sensorgram. Ten seconds after the
sample injection has finished the concentration of the sample bound to the surface is
recorded. This is point is shown as an “X” on the diagram. To remove all the bound
material a regeneration step is introduced. (Image courtesy of BiacoreTM
)
The sensorgram shows binding between the immobilised target and its corresponding
ligand and can be used for kinetics, e.g. calculating association/disassociation rates. It can
also show how strong the affinities of the interacting partners are.
28
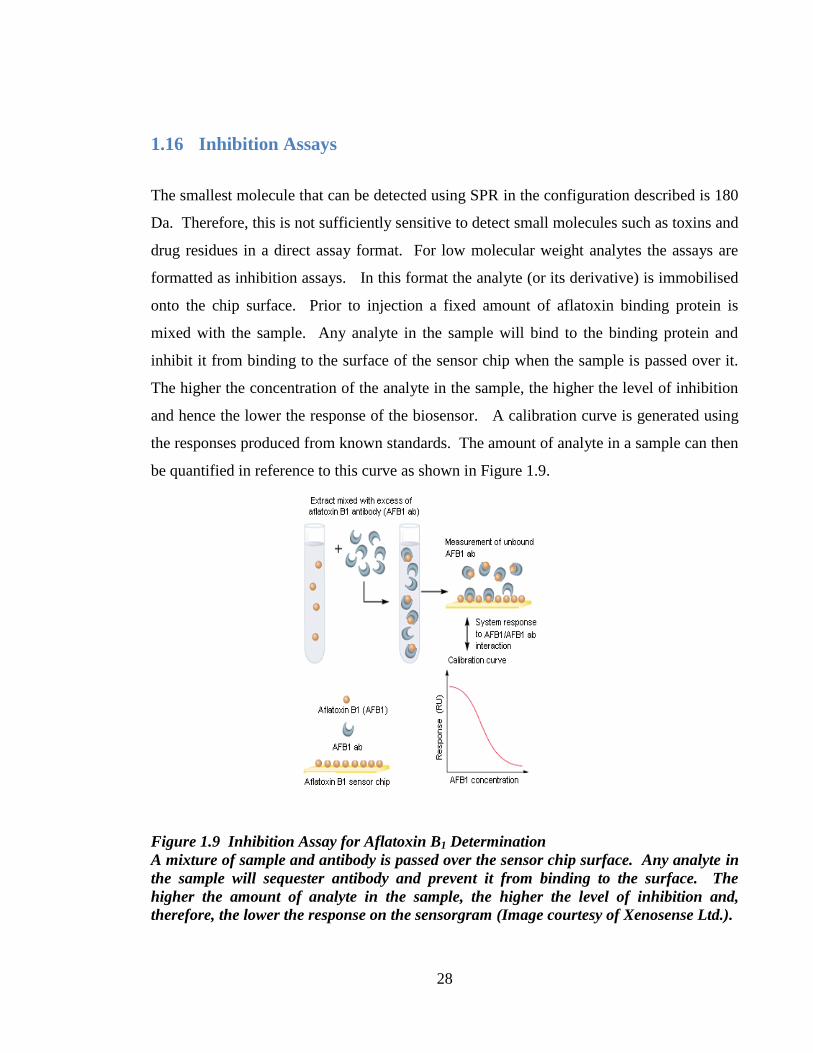
1.16 Inhibition Assays
The smallest molecule that can be detected using SPR in the configuration described is 180
Da. Therefore, this is not sufficiently sensitive to detect small molecules such as toxins and
drug residues in a direct assay format. For low molecular weight analytes the assays are
formatted as inhibition assays. In this format the analyte (or its derivative) is immobilised
onto the chip surface. Prior to injection a fixed amount of aflatoxin binding protein is
mixed with the sample. Any analyte in the sample will bind to the binding protein and
inhibit it from binding to the surface of the sensor chip when the sample is passed over it.
The higher the concentration of the analyte in the sample, the higher the level of inhibition
and hence the lower the response of the biosensor. A calibration curve is generated using
the responses produced from known standards. The amount of analyte in a sample can then
be quantified in reference to this curve as shown in Figure 1.9.
Figure 1.9 Inhibition Assay for Aflatoxin B1 Determination
A mixture of sample and antibody is passed over the sensor chip surface. Any analyte in
the sample will sequester antibody and prevent it from binding to the surface. The
higher the amount of analyte in the sample, the higher the level of inhibition and,
therefore, the lower the response on the sensorgram (Image courtesy of Xenosense Ltd.).
29
1.17 Binding Protein used in SPR assays
Binding proteins are proteins that are known to bind to a specific target protein. The
sensitivity and the specificity of an assay is largely dependant on the specificity and
strength of the binding protein to the target. Other requisites for the binding protein are
that it must be stable and robust, and that it can be immobilised onto the chip surface.
The binding proteins most often used in bioassays are antibodies. Antibodies are useful
tools as they can be easily raised against a particular target and are capable of very specific
recognition and high affinities. The basic structure of an antibody is depicted in fig 1.10.
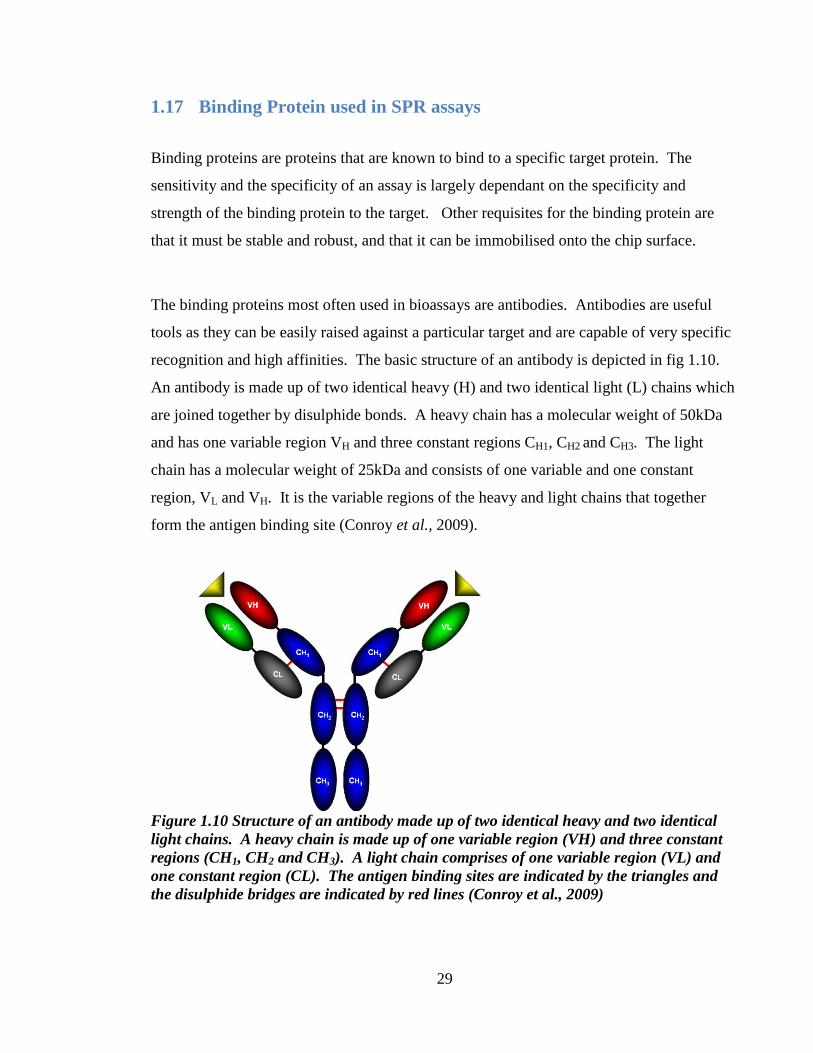
An antibody is made up of two identical heavy (H) and two identical light (L) chains which
are joined together by disulphide bonds. A heavy chain has a molecular weight of 50kDa
and has one variable region VH and three constant regions CH1, CH2 and CH3. The light
chain has a molecular weight of 25kDa and consists of one variable and one constant
region, VL and VH. It is the variable regions of the heavy and light chains that together
form the antigen binding site (Conroy et al., 2009).
Figure 1.10 Structure of an antibody made up of two identical heavy and two identical
light chains. A heavy chain is made up of one variable region (VH) and three constant
regions (CH1, CH2 and CH3). A light chain comprises of one variable region (VL) and
one constant region (CL). The antigen binding sites are indicated by the triangles and
the disulphide bridges are indicated by red lines (Conroy et al., 2009)

30
Antibodies used in assays can either be polyclonal, monoclonal or recombinant.
Polyclonal antibodies are produced when an antigen is injected into a suitable host, e.g.
mouse, rabbit, goat or rat. This induces the B-cells of the immune system to produce
antibodies specific for that antigen. Each B-cell produces a slightly different antibody,
either with different specificities or targeting different epitopes on the antigen. Therefore,
when serum from the animal is removed and purified it will contain a mixture of antibodies,
with varying affinities for the original injected antigen (Conroy et al., 2009).
Monoclonal antibodies, however, are derived from a single B-cell and, so, are identical. In
the generation of monoclonal antibodies B-cells from the spleen or the lymph nodes of an
animal that was immunised with the antigen several times, are removed. The B-cells are
then fused, either by electroporation or using polyethylene glycol, to myeloma tumour
cells. Myeloma tumour cells are cancerous B-cells that are able to grow indefinitely, but
have lost the ability to produce antibodies. When the two cells are fused, a hybridoma cell
is produced, which is capable of reproducing quickly and indefinitely, generating large
amounts of identical antibody to the target antigen (Maragos et al., 2000).
The use of recombinant antibodies, however, has become increasingly more popular due to
advantages over both monoclonal and polyclonal antibodies. The production of
recombinant antibodies, for example, does not necessarily require the use of animals to
produce an antibody library. Naïve libraries can be produced using pooled blood samples
from humans. However, for certain applications immunisation of animals is necessary
where antibodies to the required target are not naturally found in the blood. This is the case
for toxins such as aflatoxins and would generate an immune library that would contain
more antibodies specific to the target. Other advantages of recombinant antibodies are that
they are theoretically far quicker than either monoclonal or polyclonal to produce, and can
also be used for antigens unsuitable for conventional antibody production, for example if
the antigens are non-immunogenic or are extremely toxic to the animal. However, the
primary advantage of utilising recombinant antibody technology is that the engineered
antibody fragments can be manipulated to improve their sensitivity, cross-reactivity and
robustness.
31
Recombinant antibodies are artificially produced through the manipulation of genetic
material. RNA, extracted from B-lymphocytes, is reverse transcribed and amplified by
PCR to produce a synthetic library of recombinant antibodies. Several types of
recombinant antibody can be made, including single chain antibody fragments (scFv) and
Fab fragments (Morea et al., 1997).
To generate an antibody to a specific antigen an antibody library must go through several
rounds of screening. An example of a robust high-throughput screening procedure is phage
display. Phage display was first described by Smith and co-workers in 1985 (Smith, 1985).
They had discovered that when a protein is cloned into the PIII gene of the filamentous
phage M13 it will be displayed on the phage coat surface as a fusion protein. A library of
antibody fragments of up to 1010
can be cloned into the phage genome (Hoogenboom,
2005).
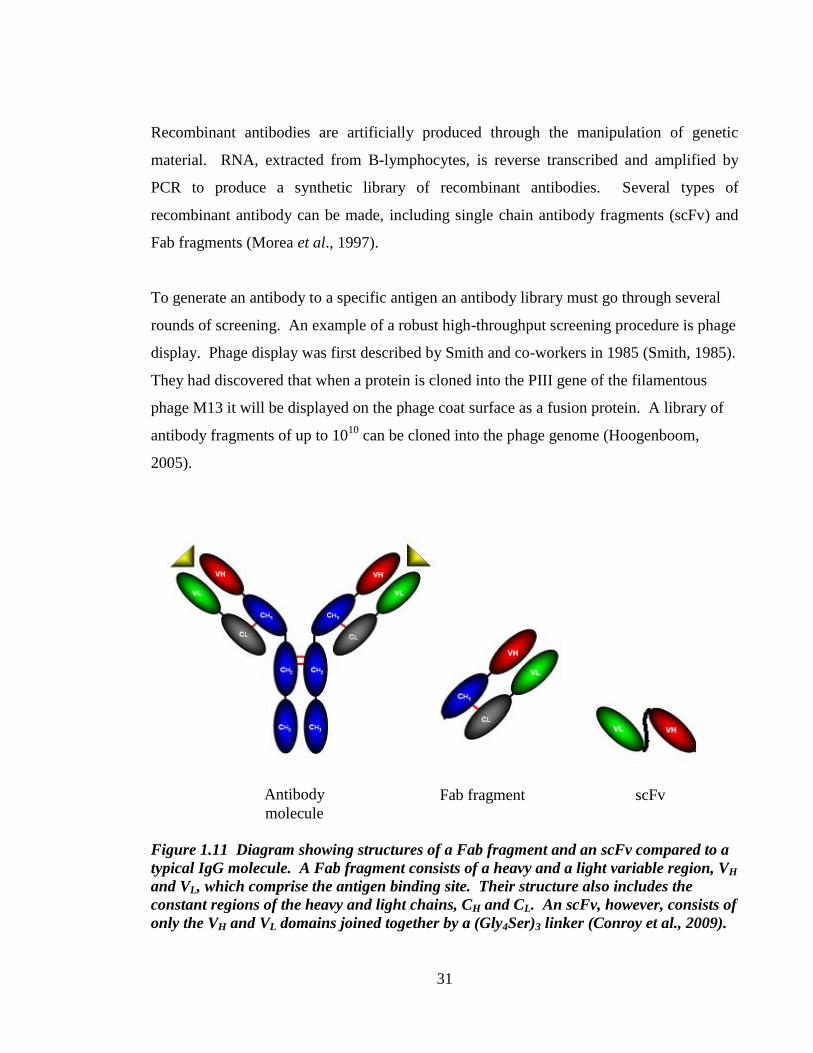
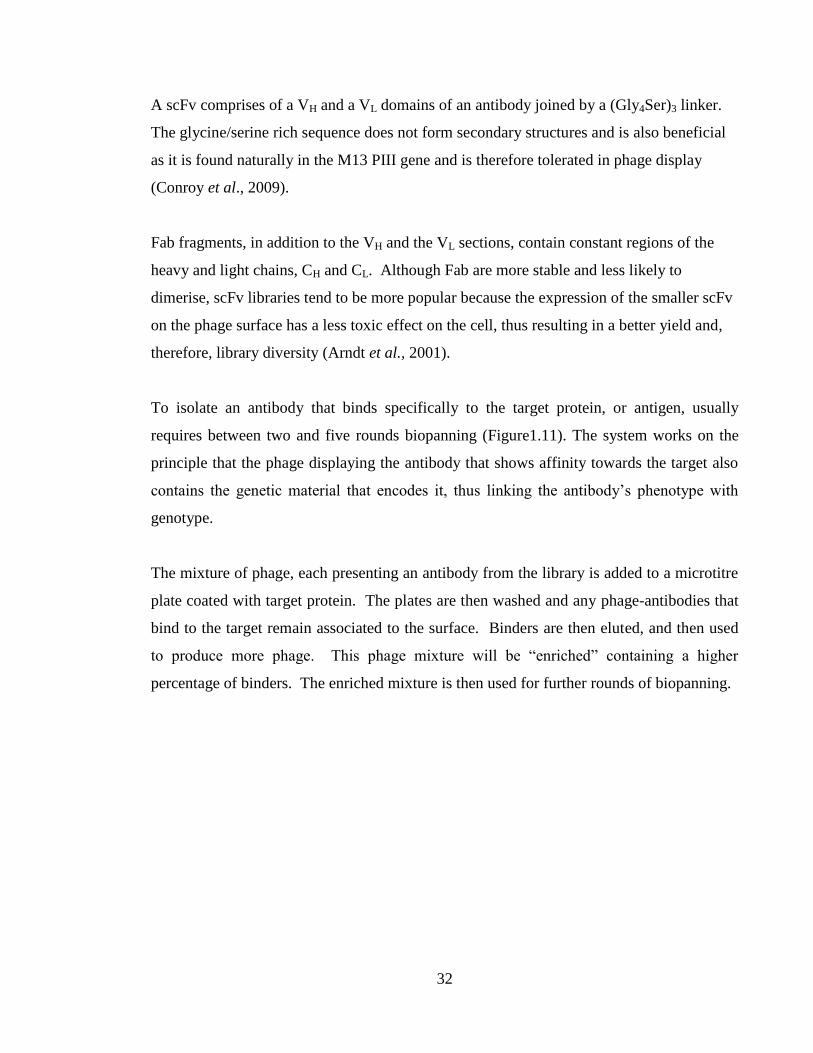
Figure 1.11 Diagram showing structures of a Fab fragment and an scFv compared to a
typical IgG molecule. A Fab fragment consists of a heavy and a light variable region, VH
and VL, which comprise the antigen binding site. Their structure also includes the
constant regions of the heavy and light chains, CH and CL. An scFv, however, consists of
only the VH and VL domains joined together by a (Gly4Ser)3 linker (Conroy et al., 2009).
Antibody
molecule
Fab fragment scFv
32
A scFv comprises of a VH and a VL domains of an antibody joined by a (Gly4Ser)3 linker.
The glycine/serine rich sequence does not form secondary structures and is also beneficial
as it is found naturally in the M13 PIII gene and is therefore tolerated in phage display
(Conroy et al., 2009).
Fab fragments, in addition to the VH and the VL sections, contain constant regions of the
heavy and light chains, CH and CL. Although Fab are more stable and less likely to
dimerise, scFv libraries tend to be more popular because the expression of the smaller scFv
on the phage surface has a less toxic effect on the cell, thus resulting in a better yield and,
therefore, library diversity (Arndt et al., 2001).
To isolate an antibody that binds specifically to the target protein, or antigen, usually
requires between two and five rounds biopanning (Figure1.11). The system works on the
principle that the phage displaying the antibody that shows affinity towards the target also
contains the genetic material that encodes it, thus linking the antibody‟s phenotype with
genotype.
The mixture of phage, each presenting an antibody from the library is added to a microtitre
plate coated with target protein. The plates are then washed and any phage-antibodies that
bind to the target remain associated to the surface. Binders are then eluted, and then used
to produce more phage. This phage mixture will be “enriched” containing a higher
percentage of binders. The enriched mixture is then used for further rounds of biopanning.
33
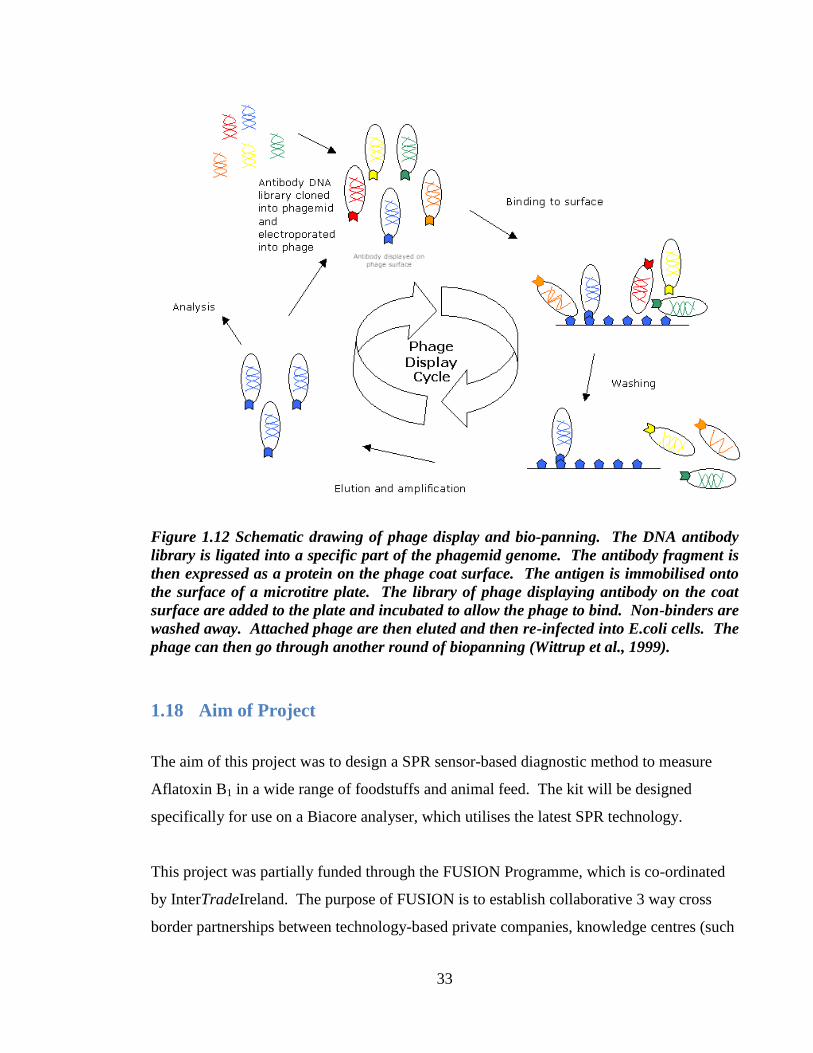
Figure 1.12 Schematic drawing of phage display and bio-panning. The DNA antibody
library is ligated into a specific part of the phagemid genome. The antibody fragment is
then expressed as a protein on the phage coat surface. The antigen is immobilised onto
the surface of a microtitre plate. The library of phage displaying antibody on the coat
surface are added to the plate and incubated to allow the phage to bind. Non-binders are
washed away. Attached phage are then eluted and then re-infected into E.coli cells. The
phage can then go through another round of biopanning (Wittrup et al., 1999).
1.18 Aim of Project
The aim of this project was to design a SPR sensor-based diagnostic method to measure
Aflatoxin B1 in a wide range of foodstuffs and animal feed. The kit will be designed
specifically for use on a Biacore analyser, which utilises the latest SPR technology.
This project was partially funded through the FUSION Programme, which is co-ordinated
by InterTradeIreland. The purpose of FUSION is to establish collaborative 3 way cross
border partnerships between technology-based private companies, knowledge centres (such

34
as universities and colleges) and recent graduates. The strategy is to facilitate technology
and knowledge transfer from universites to businesses, in order to introduce innovation,
increase their capabilites, and, thus, gain competitive advantage. This project was a joint
venture between Xenosense Ltd and Dublin City University.
XenoSense Ltd. is a Belfast based biotech company which develops and manufactures in
vitro diagnostic kits for use in food safety and quality assurance applications. The kits have
been designed specifically for use on optical biosensors produced by the Swedish company,
BiacoreTM
, which harness innovative SPR and sensor chip technology. Xenosense
currently has a repertoire of 13 kits that fall into two categories – vitamins and drug
residues.
Xenosense, as a new and expanding company, is eager to explore and break into different
market sectors. The global market share for mycotoxins is estimated at approximately £75
–100 million, with rapid diagnostic methods accounting for 10 – 20% of this (CAST report,
2003). This is a fairly new market, the average annual growth is high at 10%. Aflatoxin B1
was chosen to be the pilot assay for development as it is the most well known mycotoxin
and has the most complete regulatory limits compared to other mycotoxins. There are
already a number of competitors in the market. However, due to changing legislation
demanding increased testing and the ability to detect lower levels, this sector is growing
fast. There is niche in this market for high-throughput, automated systems that are sensitive
enough to meet the demands of the recently lowered regulatory limits. This project, to
develop an assay for aflatoxin B1, will be a springboard into this market, and will give
Xenosense the opportunity to expand their portfolio further still, by producing other kits to
detect different mycotoxins.
1.19 Objectives
The overall objectives for the experimental research of the project could be summarized as
follows.

35
1. Development of a sensor chip surface
A previous study had shown the most effective way to immobilise aflatoxin B1 onto the
sensor chip surface. The first objective was to recreate this and prove the efficacy by
injecting over the surface an excess of antibody specific to aflatoxin B1.
2. Prove the feasibility of an aflatoxin B1 assay in buffer
The next objective was that a standard curve for aflatoxin B1 could be generated in a buffer
system.
3. Evaluation of different antibodies that are specific to aflatoxin B1
Antibodies were supplied to us by Professor Richard O‟Kennedy, School of Biotechnology,
Dublin City University as part of the FUSION programme. These antibodies had to be
tested individually to determine which one would be most suitable for the assay. A series
of curves had to be set up using all four antibodies added in various percentage fractions,
and different injection times, to determine the most sensitive antibody and assay conditions.
4. Choose which food matrices to investigate
Aflatoxins contaminate a large and diverse range of foodstuffs. Ultimately this assay is to
be marketable and therefore matrices chosen depend on a number of factors. For example,
what other tests are currently available on the market, what the unique selling point of the
assay will be and what matrices would be beneficial to existing customers of Xenosense
Ltd.
5. Produce a sensitive and reliable assay for each matrix
A quick and simple extraction method would then need to be developed for each matrix.
To do this the matrix is spiked with a known amount of aflatoxin B1 and then extracted.
The amount recovered could be calculated by running the extract against the aflatoxin B1
standard curve.

36
6. Validation
The final objective for this product was to validate the assay(s). This would be required if
the test was to go on the market.

Chapter 2:
Materials
and
Methods

36
2.1 Suppliers
Table 2.1 List of suppliers for raw materials, consumables and equipment
Supplier Address
Albion Chemicals Albion House, Rawdon Park, Green Lane, Yeadon LS19
7XX, UK.
BD Plastipak Edmund Halley Road, Oxford OX4 4DQ, UK.
BDH 603a Dalamal Chambers, New Marine Lines, Mumbai,
400 020, India.
Biacore AB Rapgatan 7, SE754 50, Uppsala, Sweden.
BOC Group Prince Regent Road, Belfast BT5 6RW, Northern Ireland
Chromacol 3 Mundells Industrial Centre, Welwyn Garden City, Herts
AL7 1EW, UK.
Denver Instruments Robert-Bosch-Breite 10, 37079 Gottingen, Germany.
Eppendorf Barkhausenweg 1, 22339 Hamburg, Germany.
Fermentek Yatziv25, POB47120, Jerusalem 97800, Israel.
Gilson 3000 Parmenter Street, P.O. Box 620027, Middleton
WI53562-0027, USA.
Greiner 7 Rue Leo Lagrange, F-27950 Saint Marcel, France.
Kimberley Clark P.O. BOX 619100, Dallas, Texas, USA.
KNF Neuberg D-79112 Freiberg, Germany.
Nalgene Ridderstraad 26, B3040 Neerijse, Belgium.
Prolabo 54, rue Roger Salengro, 94126 Fontenay-sous-bois Cedex,
France.
R-Biopharm Rhone West of Scotland Science Park, Unit 3.06, Kelvin
Campus, Glasgow G20 0SP, Scotland.
Scientific Industries Inc Bohemia, New York, 11716, USA.
Sigma Aldridge Fancy Road, Poole, Dorset BH12 4QH, UK.
Stuart Scientific Beacon Road, Stone, Staffordshire ST15 0SA, UK.
Techne 3 Terri Lane, Suite 10, Burlington, NJ 08016, USA.

37
Vicam 313 Pleasant Street, Watertown, MA 02472, USA.
Whatman Springfield Mill, James Whatman Way, Maidestone, Kent
ME14 2LE, UK.
Wishart Group Milewater House, Mill Road, Ballyclare, County Antrim,
BT39 9DY.
2.2 Materials
2.2.1 Chemicals
Table 2.2 List of chemicals used with the supplier and the catalogue number
Chemical Supplier Catalogue number
Acetone HPLC grade BDH 15296 6P
Acetonitrile HPLC grade BDH 15285 6K
Aflatoxin B1 Fermentek AF
Bovine Serum Albumin (BSA) Sigma Aldridge 054KD607
Chloroform HPLC grade BDH 152835F
Cyclohexane HPLC grade BDH 1528965
Di-sodium hydrogen
orthophosphate anhydrous, GPR
BDH 301584L
Ethylenediamine Biacore AB 22-0526-55
Ethanol (min 99.7%, v/v), 25L Albion Chemicals Se 3033
Guanidine hydrochloride (99%,
w/v)
Sigma Aldridge G4505
HBS Biacore AB 22-0527-06
HBS EP+ Biacore AB BR-1006-69
Hydrochloric acid (2.0M) Merck HC753278
Methanol (HPLC grade) BDH 15250
Monoclonal anti-Aflatoxin B1
antibody (mouse-derived)
Sigma A9555

38
N,N'-dicyclohexyl-carbodiimide Biacore AB 22-0526-54
N-hydroxysuccinimide Biacore AB 22-0526-53
Nitrogen (“oxygen-free”) BOC Size W
O-(carboxymethyl)-hydroxylamine
hemi-hydrochloride
Sigma Aldridge A4508
Pyridine Prolabo 27 197.238
Sodium azide, AnalaR BDH K35580906 605
Sodium chloride, AnalaR BDH 102415K
Sodium hydrogen carbonate Sigma Aldridge 236527
Sodium hydroxide, 0.1M, (ConvoL),
6pk
BDH 18043 5A
Sodium hypochlorite solution GPR BDH 3016965
Sodium phosphate monobasic Sigma Aldridge S0751-100G
2.2.2 Preparation of Buffers and Reagents
0.1M 10X Phosphate Buffered Saline (PBS), pH 7.4,
Sodium phosphate monobasic 2.3g
Di-Sodium hydrogen 11.5g
Sodium chloride 87.5g
900ml of ddH2O was added and stirred until all salts had dissolved. The pH was adjusted
to 7.4 by addition of 1M HCl and then more ddH2O added to a final volume of 1l.
0.1M NaOH:20% (v/v) acetonitrile regeneration solution
1M Sodium hydroxide 100μl
Acetonitrile 200 μl
ddH2O 700 μl

39
6M Guanidine hydrochloride, pH 4
Guanidine hydrochloride 114.64g
ddH2O 180ml
Adjust the pH to 4.0 with 1M HCl, then add ddH2O to a final volume of 200ml.
Antibody storage solution
BSA 0.5g
Sodium azide 0.195g
HBS buffer 200ml
HBS-EP (produced by BiacoreTM
)
0.01M HEPES, pH 7.4
0.15M NaCl
2mM EDTA
0.005% (v/v) Surfactant P20
2.2.3 Consumables
Table 2.3 List of consumables and details of where they were purchased
Consumable Supplier Catalogue number
„Easi-extract‟ aflatoxin
immunoaffinity columns
R-Biopharm Rhone RP70N
Aflatest immunoaffinity
columns
Vicam G1024
Anotop 25 inorganic
membrane filter (0.2μm)
Whatman 6809-2024
96 well plate Greiner M2186
Foil plate sealers Biacore AB N/A
7mm vials Gilson 2 9508 32

40
4ml glass vial (6mm) Chromacol 45V
2ml plastic microtube Sarstedt 72.694
4ml plastic Vial (6mm) Nalgene 215-0246
2ml syringes BD Plastipak 300185
CM5 sensor chips
(Certified)
Biacore AB 22-0310-03
Latex gloves Kimberley Clark 112-0150
Pipettes tips 100-5000µl Eppendorf 022492080
Pipettes tips 50-1000 µl Eppendorf 022491555
Pipettes tips 2-200 µl Eppendorf 022491539
2.2.4 Equipment
Table 2.4 List of equipment and details of where they were purchased
Equipment Supplier
Analytical balance (3 figure) IR-403 Denver Instruments
Analytical balance (4 figure) Mettler
Toledo
Wishart Group
Biacore Q instrument Biacore
Concentrator (DRI Block DB 3D) Techne
Magnetic stirrer Stuart Scientific
pH meter (Ultra basic benchtop) Denver Instruments
Pipettes (2-20μl, 20-200μl, 200-1000μl
and 500-5000μl)
Eppendorf
Roller Mixer SRT2 Stuart Scientific
Vacuum manifold Vac Master
Vacuum pump ICNF Neuberg
Vortex Scientific Industries Inc
Refrigerated Centrifuge (5810R) Eppendorf

41
2.3 Methods
2.3.1 Assay Development Methodology
2.3.1a Preparation of aflatoxin B1-oxime-ethylenediamine
1. Fifty mg aflatoxin B1 was dissolved in 10mls of pyridine and 80mg
carboxymethyloxime hydrochloride added.
2. The pyridine was evaporated under a stream of nitrogen and gentle heating to
produce a brown oil. 9ml chloroform was added to the oil, followed by 1ml pyridine.
3. The flask was then placed on ice and 32mg N,N'-dicyclohexyl-carbodiimide (DCC)
and 20mg N-hydroxysuccinimide (NHS) added. The reaction mixture was then
stirred overnight at 4C.
4. The next day it was decanted into an eppendorf tube. It was then centrifuged on a
benchtop microfuge at 18000g for 10 minutes, the pellet discarded and the solvent
evaporated under a stream of nitrogen and gentle heating, and kept to one side.
5. The remaining brown oil in the flask was dissolved in 2ml pyridine with 24mg DCC
and 12mg NHS.
6. The reaction was stirred for the rest of the day and overnight at room temperature.
7. The mixture was again centrifuged at 18000g on a benchtop microfuge for 10
minutes and the pellet was discarded.
8. The solvent was added to the residue from step 4, and the solvent again was
evaporated under nitrogen with gentle heating. This resulted in the formation of a
brown residue.
9. Five ml of ethanol was added to the residue, and then a solution of NaHCO3 and 50µl
ethylendiamine in 1ml water was added drop wise. The reaction mixture was stirred
all day and overnight at room temperature.
10. The ethanol was then evaporated under a stream of nitrogen and gentle heating
(70°C).
42
11. Two ml of methanol was added to the end product and it was purified by preparative
TLC. It was then dissolved in chloroform: methanol (7:3), and finally, the solvent
was removed using a rotary evaporator. The final product was a brown residue.
2.3.1b Immobilisation of aflatoxin B1derivative, aflatoxin B1-oxime-ethylenediamine, onto
sensor chip surface through amine coupling
1. EDC (1-ethyl-3-(-3-dimethylamino propyl) carbodiimide hydrochloride) and NHS
were mixed together 50:50. 50µl was added onto a research grade sensor chip. It
was left on at room temperature for 30 minutes, and then removed with tissue
without touching the surface.
2. Fifty µl of derivative was made up to a concentration of 2mg/ml with 0.1M borate
buffer, pH 8.5, and incubated in darkness overnight. The solution was then removed
with tissue paper.
3. Fifty µl ethanolamine was added to the chip. After a 30 minute incubation at room
temperature, the solution was again removed with tissue paper. Finally, the chip was
washed with double deionised water and dried over a stream of nitrogen.
2.3.1c Optimisation of the immobilisation of aflatoxin B1 derivative, aflatoxin B1-oxime-
ethylenediamine onto sensor chip surface through amine coupling
1. EDC (1-ethyl-3-(-3-dimethylamino propyl) carbodiimide hydrochloride) and NHS
were mixed together 50:50. 50µl was added onto a research grade sensor chip. It
was left on at room temperature for 30 minutes, and then removed with tissue paper
without touching the surface.
2. Fifty µl of derivative was made up to a concentration of 2mg/ml with a 50:50 mix of
borate buffer/CTAB (cetyl trimethyl ammonium bromide solution) and incubated in
darkness overnight. The solution was then removed with tissue paper.
3. Fifty µl ethanolamine was added to the chip. After a 30 minute incubation at room
temperature, the solution was again removed with tissue paper. Finally the chip was
washed with water and dried over a stream of nitrogen.
43
2.3.2 Compound Feed (IRMM Reference Material) Extraction Methodology
2.3.2a Simple methanol extraction of aflatoxin B1 from compound feed
1. One g aliquots of sample (9.3ng/g) were added to 10ml of 100% (v/v) methanol.
2. The samples were vortexed and centrifuged for 10 minutes at 2000g.
3. Eight ml of the samples were removed and the solvent evaporated in a concentrator
(Techne) at 70°C over a steam of nitrogen. An oily residue was produced and this
was then reconstituted in 1ml of HBS.
4. The samples were then diluted 1 in 2, 1in 3 and 1in 4 with HBS. A calibration curve
was produced using known amounts of aflatoxin B1 dissolved in HBS buffer. The
calibrants were 0, 0.5, 1, 2.5, 5, 10, 2.5 and 50ng/g of aflatoxin B1 and they were
prepared in duplicate.
5. The calibrants and samples were then run on the Biacore Q biosensor. The assay
conditions consisted of an antibody fraction of 30% (antibody and sample are mixed
together by the biosensor at a ratio of 30:70) and an injection time of 480 seconds as
these were found to be the optimal conditions. The regeneration solution was 10mM
NaOH and 20% (v/v) acetonitrile, with a 20 second injection time.
2.3.2b Extraction of aflatoxin B1 from compound feed using “Mycosep” SPE (solid
phase extraction) columns from Romer Laboratories
1. One gram of compound feed (9.3ng/g) was added to an acetonitrile/water solution
(8.4ml acetonitrile to 1.6ml water), vortexed and put on a roller mixer for 30
minutes.
2. The sample was centrifuged at 2000g for 10 minutes and 8ml was removed.
3. The sample was then passed through the Mycosep column.
4. Four ml of the eluate was them removed and evaporated over heat (70°C) and under
a stream of nitrogen.

44
5. The sample was then reconstituted in 1ml HBS to make up a final concentration of
3.72ng/g. The sample was analysed against a calibration curve made up in either
HBS buffer or blank extract. The calibrants were 0, 0.5, 1, 2.5, 5, 10, 2.5 and 50ng/g
of aflatoxin B1 and they were prepared in duplicate.
6. The calibrants and samples were then run on the Biacore Q biosensor. The assay
conditions constitute an antibody fraction of 30% (i.e. the sample volume to antibody
volume is 70 to 30) and an injection time of 480 seconds. The regeneration solution
was 10mM NaOH and 20% (v/v) acetonitrile, with a 20 second injection time.
2.3.2c Extraction of aflatoxin B1 from compound feed using “Easi-extract aflatoxin”
immunoaffinity columns from R-Biopharm Rhone
The extraction procedure was followed as described in the protocol supplied with the
columns. An acetonitrile extraction is recommended for compound feed.
1. Three 1g samples (2 blank and one low-level aflatoxin” sample (9.3ng/g)) were
added to 10ml 60/40 acetonitrile/water solution. The samples were vortexed and put
on a shaker for 30 minutes.
2. They were then centrifuged at 2000g for 10 minutes.
3. Two ml was removed and added to 48ml PBS, pH 7.4.
4. The columns were conditioned by passing 20ml of PBS through.
5. The diluted samples were then passed through the columns and then washed with
20ml distilled water.
6. The aflatoxin B1 was then eluted by passing 1.5ml 100% (v/v) methanol through the
column.
7. The samples were dried in a concentrator at 70°C over a stream of nitrogen.
8. The samples were then resuspended in 1ml HBS. The sample was analysed against a
calibration curve made up in blank sample extract. The calibrants were 0, 0.5, 1, 2.5,
5, 10, 2.5 and 50ng/g of aflatoxin B1.
9. The calibrants and samples were then run on the Biacore Q biosensor. The assay
conditions constitute an antibody fraction of 30% (antibody and sample are mixed
45
together by the biosensor at a ratio of 30:70) and an injection time of 480 seconds.
The regeneration solution was 10mM NaOH and 20% (v/v) acetonitrile, with a 20
second injection time.
2.3.2d Extraction of aflatoxin B1 from compound feed using “Aflatest”
immunoaffinity columns from Vicam
1. One g of compound feed sample (two blank samples to make up the calibration
curve, one low-level IRMM sample (9.3ng/g aflatoxin B1) and one blank sample that
had been spiked at 10ng/g) was added to 5ml 80% (v/v) methanol.
2. The samples were filtered using Millex PVDF filters. 3ml was then removed and
12ml of distilled water added.
3. 10ml was then passed through the columns.
4. The columns were washed with 10ml distilled water, and then the aflatoxin eluted
using 1.5ml 100% (v/v) methanol and collected in a test-tube.
5. The sample was then evaporated over nitrogen in a concentrator at 70°C and
reconstituted in 1ml HBS.
6. The calibration curve produced by reconstituting known amounts of aflatoxin B1 in
blank sample instead of HBS-EP. The calibrant concentrations were 0, 0.5, 1, 2.5, 5,
10, 2.5 and 50ng/g of aflatoxin B1.
7. The calibrants and samples were then run on the Biacore Q biosensor. The assay
conditions constitute an antibody fraction of 30% (antibody and sample are mixed
together by the biosensor at a ratio of 30:70) and an injection time of 480 seconds.
The regeneration solution was 10mM NaOH and 20% (v/v) acetonitrile, with a 20
second injection time.
46
2.3.3 Infant Formula Extraction Methodology
2.3.3a Methanol extraction of aflatoxin B1 from infant formula
1. Five 1g aliquots of infant formula were weighed out. Two were spiked with
aflatoxin B1. One sample was spiked with 25μl of a 400ng/ml standard, which is
equivalent to 10ng/g. The other was spiked with 25μl of a 40ng/ml standard, which
is equivalent to 1ng/g. The remaining samples were used for the calibration curve.
2. Ten ml of 100% methanol was added to each sample, which were then vortexed and
put on the roller for 30 minutes.
3. The samples were then centrifuged for 10 minutes at 2000g.
4. The supernatant was removed and filtered through a Millex PVDF filter.
5. A volume of supernatant (7.5ml) was removed and then blown down on the
concentrator at 70ºC over nitrogen.
6. The samples were then reconstituted in 1ml HBS.
7. Calibrants were made up in blank sample extract as before. The calibrant
concentrations were 0, 0.5, 1, 2.5, 5, 10, 2.5 and 50ng/g of aflatoxin B1.
8. The calibrants and samples were then run on the Biacore Q biosensor. The assay
conditions constitute an antibody fraction of 30% (antibody and sample are mixed
together by the biosensor at a ratio of 30:70) and an injection time of 480 seconds.
The regeneration solution was 10mM NaOH and 20% (v/v) acetonitrile, with a 20
second injection time.

47
2.3.3b Methanol extraction of aflatoxin B1 from infant formula with a cyclohexane
step
1. The above experiment was repeated from points 1 to 6.
2. One ml of cyclohexane was then added, vortexed and then incubated at 37 ºC for 15
minutes. After centrifugation at 18000g on an Eppendorf refridgerated centrifuge for
10 minutes, two separate phases had formed.
3. The bottom HBS layer was carefully removed so as not to disturb the top layer, and
the samples filtered again with the Millex filter.
4. The blank samples were combined and used to make the calibration curve. The
calibrants and samples were then run on the Biacore Q biosensor, conditions as
described in the previous assay (experiment 2.3.3a).
2.3.3c Extraction of aflatoxin B1 from compound feed using “Easi-extract aflatoxin”
immunoaffinity columns from R-Biopharm Rhone
1. Four 1g infant formula samples were weighed out.
2. One sample was spiked with 25μl of a 400ng/ml standard, which is equivalent to
10ng/g. The other was spiked with 25μl of a 100ng/ml standard, which is equivalent
to 2.5ng/g. The other two blank samples were be used for the calibration curve.
3. A volume (12.5ml) of 80% (v/v) methanol were added to the samples, vortexed for 2
minutes, put on a roller mixer for 30 minutes and then centrifuged at 2000g for 10
minutes.
4. Two ml was removed and added to 16ml of PBS, pH 7.4.
5. The columns were conditioned by passing 20ml of PBS through them.
6. The diluted samples were then passed through the columns and then washed with
20ml distilled water.
7. The samples were eluted from the columns as before with 1.5ml 100% (v/v) MeOH,
which was then blown down over nitrogen to dryness.

48
8. The samples were reconstituted in 1ml HBS. The two blank samples were combined
and used construct the calibration curve. The calibrant concentrations were 0, 0.5, 1,
2.5, 5, 10, 2.5 and 50ng/g of aflatoxin B1.
9. The calibrants and samples were then run on the Biacore Q biosensor, with
conditions as described in the previous assay (experiment 2.3.3a).
2.3.3d Acetonitrile extraction of aflatoxin B1 from infant formula
1. Five 1g samples of infant formula samples were weighed out, and one was spiked at
10ng/g aflatoxin B1.
2. Ten ml of 100% (v/v) acetonitrile was added to each sample, vortexed vigorously,
put on a roller mixer for 30 minutes and then centrifuged at 2000g for 10 minutes.
3. The solvent was then filtered using Millex PVDF filters. 5ml was removed and
blown down over nitrogen at 60C.
4. The samples were then resuspended in 1ml HBS and vortexed vigorously.
5. 1ml of cyclohexane was then added to each sample, vortexed and then incubated at
37C for 15 minutes. The samples were then centrifuged at 18,000g and the bottom
layer removed with a syringe.
6. The cyclohexane step was repeated for a second time. The samples were filtered
again using Millex PVDF filters.
7. The blank samples were combined and used to make a calibration curve.
8. The calibrants and samples were then run on the Biacore Q biosensor, with
conditions as described in the previous assay (experiment 2.3.3a).
2.3.3e Acetic acid precipitation of the proteins in infant formula
1. Six 1g samples of infant formula were weighed out and two spiked with 1ng and
10ng of aflatoxin B1. The four remaining blank samples are to be used for the
calibration curve.
49
2. Seven ml of deionised water and 1ml of 3% (v/v) acetic acid were added to the
samples. The samples were then made up to 10ml with more deionised water,
vortexed and then put on a roller mixer for 30 minutes.
3. The samples were centrifuged at 2500g for 15 minutes and 5ml was then removed.
4. Five ml was ethyl acetate was then added, put on a roller mixer for 30 minutes and
centrifuged again for 15 minutes at 2500g.
5. The ethyl acetate layer was then removed and then evaporated in the concentrator at
70C over a stream of nitrogen.
6. The samples were then reconstituted in 1ml HBS and washed twice with
cyclohexane, as described in 2.3.3d. They were then filtered using the Millex PVDF
filters.
7. The calibrants and samples were then run on the Biacore Q biosensor, with
conditions as described in the previous assay (experiment 2.3.3a).
2.3.3f Hydrochloric acid precipitation of the proteins in infant formula
1. One g aliquots of infant formula were added to 8ml 100% (v/v) methanol and 2ml
0.1M hydrochloric acid, vortexed and then put on a roller mixer for 30 minutes.
2. The samples were then centrifuged for 10 minutes at 2500g. Eight ml of the
supernatant was removed and 8ml of deionised water was added and mixed together.
3. Four ml of hexane was added and the samples were incubated at 37˚C for 10
minutes.
4. The samples were centrifuged for 10 minutes at 2500g and 14ml of the bottom layer
removed.
5. Eight ml of chloroform was added, and the samples were vortexed and then
centrifuged at 2500g for 10 minutes
6. Six ml of the chloroform layer was then removed and blown down at 60˚C over a
stream of nitrogen.
7. The samples were then reconstituted in 1ml HBS-EP.
8. The calibrants and samples were then run on the Biacore Q biosensor. Conditions
were as described in the previous assay (experiment 2.3.3a).

50
2.3.3g Extraction of aflatoxin B1 from compound feed using “Easi-extract aflatoxin”
immunoaffinity columns from R-Biopharm Rhone using acetonitrile instead of
methanol in the extraction step.
1. Five 1g aliquots of infant formula were weighed. Two were spiked with
aflatoxin B1. One sample was spiked with 25μl of a 400ng/ml standard, which
is equivalent to 10ng/g. The other was spiked with 25μl of a 40ng/ml
standard, which is equivalent to 1ng/g. The remaining samples were used for
the calibration curve.
2. Ten ml of 100% (v/v) acetonitrile was added to each sample, which were then
vortexed and put on the roller for 30 minutes.
3. The samples were then centrifuged for 10 minutes at 2000g.
4. The supernatant was removed and filtered through a Millex PVDF filter.
5. A volume of supernatant (7.5ml) was removed and then blown down on the
concentrator at 70ºC over nitrogen.
6. The samples were then reconstituted in 1ml HBS.
7. Calibrants were made up in blank sample extract as before. The calibrant
concentrations were 0, 0.5, 1, 2.5, 5, 10, 2.5 and 50ng/g of aflatoxin B1.
8. The calibrants and samples were then run on the Biacore Q biosensor. The
assay conditions consisted of an antibody fraction of 30% (antibody and
sample are mixed together by the biosensor at a ratio of 30:70) and an
injection time of 480 seconds. The regeneration solution was 10mM NaOH
and 20% (v/v) acetonitrile, with a 20 second injection time.
51
2.3.4 Maize extraction methodology
2.3.4a Extraction of aflatoxin B1 from maize using the AOAC (Association of Official
Analytical Chemists) recommended “best food”(BF) method for corn.
1. One g aliquots of maize were weighed out and one sample was spiked with aflatoxin
B1 at a concentration of 10ng/g.
2. Ten ml of 55% (v/v) methanol/water added. The sample was then vortexed and put
on the roller mixer for 30 minutes.
3. Five ml was removed and added to 5ml of hexane. It was then placed on a roller
mixer for 15 minutes and centrifuged at 2000g for 10 minutes.
4. 2.5ml of the methanol phase was removed and 10ml of chloroform added. The
volume of sample was again put on the roller mixer for 30 minutes and then
centrifuged at 2000g for 10 minutes.
5. Finally, 5ml was removed and concentrated on the concentrator over a stream of
nitrogen. The sample was then reconstituted in 1ml of HBS.
6. Calibrants were made up in blank sample extract as before. The calibrant
concentrations were 0, 0.5, 1, 2.5, 5, 10, 2.5 and 50ng/g of aflatoxin B1.
7. The calibrants and samples were then run on the Biacore Q biosensor. The assay
conditions consisted of an antibody fraction of 30% and an injection time of 480
seconds. The regeneration solution was 10mM NaOH and 20% (v/v) acetonitrile,
with a 20 second injection time.
2.3.4b Aflatoxin B1 extraction from maize using “Easi-extract aflatoxin” immunoaffinity
columns from R-Biopharm Rhone
1. Three maize samples of 1g were weighed out. One was spiked with aflatoxin to a
concentration of 10ng/g and two were blanks to make the calibration curve (two
blanks were required to make up the volume required for the calibration curve).
2. Five ml of 80% (v/v) methanol was added, vortexed and then put on the roller mixer
for 30 minutes.
52
3. The sample was centrifuged at 2000g for 10 minutes, 2ml was removed and sixteen
ml of PBS was added.
4. The R-Biopharm Rhone IAC were pretreated by passing 20ml of PBS through them.
5. The samples were then passed though the columns at a speed of 1-2 drops per
second. The columns were then washed with 20ml deionised water to remove any
impurities.
6. The aflatoxins were then eluted using 2 applications of 1.5ml 100% (v/v) methanol.
7. The samples were then evaporated to dryness on a concentrator over a stream of
nitrogen. Finally the samples were reconstituted in 1ml HBS.
2.3.4c Amylase treatment of maize samples before they are t through“Easi-extract
aflatoxin” immunoaffinity columns from R-Biopharm Rhone
1. Three 1g samples were weighed and to each 1ml deionised water and 0.125g of
amylase were added. The amylase was added to break down any starch that is
present in the sample. One of the samples was spiked at 20ng/g of aflatoxin B1, the
other two were left blank as they were to be used for the calibration curve.
2. The samples were then incubated at 37C for 30 minutes.
3. Four ml of methanol (100% (v/v)) was then added to make a final concentration of
80% (v/v). The sample was then vortexed, put on the roller mixer for 30 minutes,
centrifuged at 2000g for 10 mins and 2mls solvent removed.
4. The 2mls solvent was then passed through the IAC as described in 2.3.4b
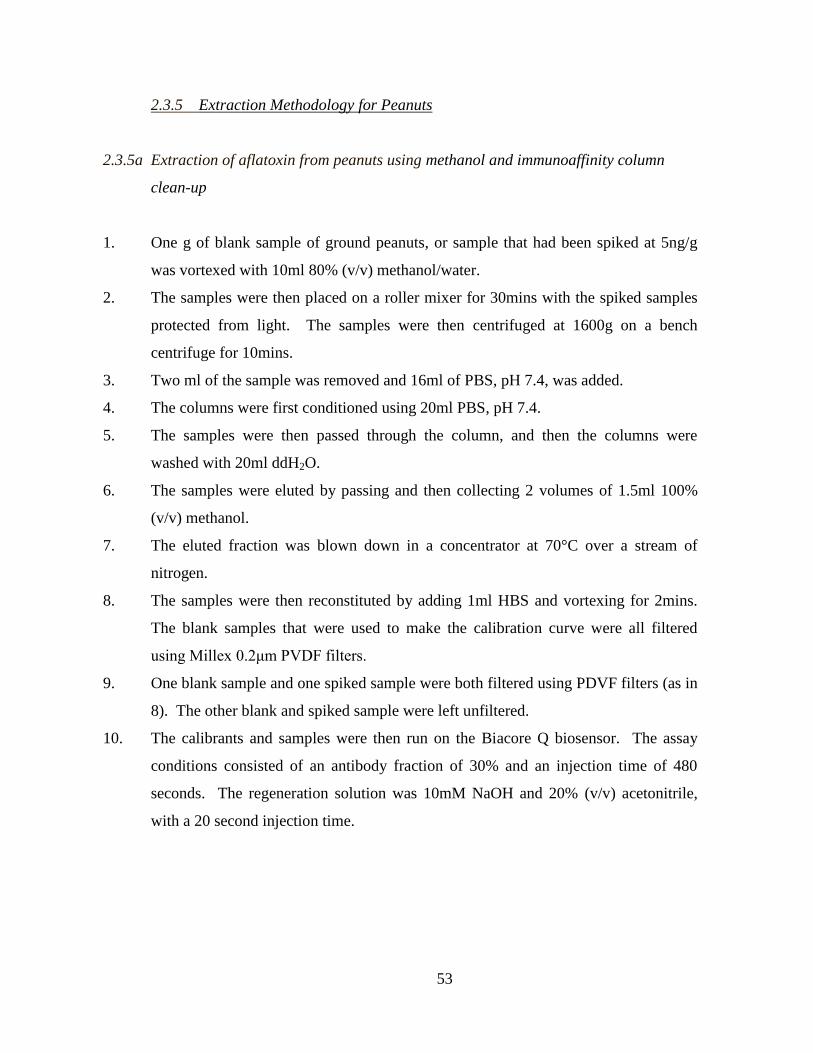
53
2.3.5 Extraction Methodology for Peanuts
2.3.5a Extraction of aflatoxin from peanuts using methanol and immunoaffinity column
clean-up
1. One g of blank sample of ground peanuts, or sample that had been spiked at 5ng/g
was vortexed with 10ml 80% (v/v) methanol/water.
2. The samples were then placed on a roller mixer for 30mins with the spiked samples
protected from light. The samples were then centrifuged at 1600g on a bench
centrifuge for 10mins.
3. Two ml of the sample was removed and 16ml of PBS, pH 7.4, was added.
4. The columns were first conditioned using 20ml PBS, pH 7.4.
5. The samples were then passed through the column, and then the columns were
washed with 20ml ddH2O.
6. The samples were eluted by passing and then collecting 2 volumes of 1.5ml 100%
(v/v) methanol.
7. The eluted fraction was blown down in a concentrator at 70°C over a stream of
nitrogen.
8. The samples were then reconstituted by adding 1ml HBS and vortexing for 2mins.
The blank samples that were used to make the calibration curve were all filtered
using Millex 0.2μm PVDF filters.
9. One blank sample and one spiked sample were both filtered using PDVF filters (as in
8). The other blank and spiked sample were left unfiltered.
10. The calibrants and samples were then run on the Biacore Q biosensor. The assay
conditions consisted of an antibody fraction of 30% and an injection time of 480
seconds. The regeneration solution was 10mM NaOH and 20% (v/v) acetonitrile,
with a 20 second injection time.

54
2.3.5b Acetonitrile extraction of aflatoxin B1 from peanuts followed by an
immunoaffinity column cleanup
1. One g of blank sample or sample that had been spiked at 5ng/g was vortexed with
10ml 60% (v/v) methanol/water.
2. The samples were then mixed on a roller for 30mins with the spiked samples
protected from light. The samples were then centrifuged at 1600g for 10mins.
3. Two ml of the sample was removed and 48ml of PBS, pH 7.4, was added.
4. The columns were first conditioned using 20ml PBS, pH 7.4.
5. The samples were then passed through the column, and then the columns were
washed with 20ml ddH2O.
6. The samples are eluted by passing and then collecting 2 aliquots of 1.5ml 100% (v/v)
methanol.
7. The methanol was blown down in a concentrator at 70°C over a stream of nitrogen.
8. The samples were then reconstituted by adding 1ml HBS and vortexing for 2mins.
The blank samples that were used to make the calibration curve were all filtered
using Millex 0.2μm PVDF filters.
9. One blank sample and one spiked sample were filtered using the PDVF filters. The
other blank and spiked sample were left unfiltered.
10. The calibrants and samples were then run on the Biacore Q biosensor. The assay
conditions consisted of an antibody fraction of 30% and an injection time of 480
seconds. The regeneration solution was 10mM NaOH and 20% (v/v) acetonitrile,
with a 20 second injection time.
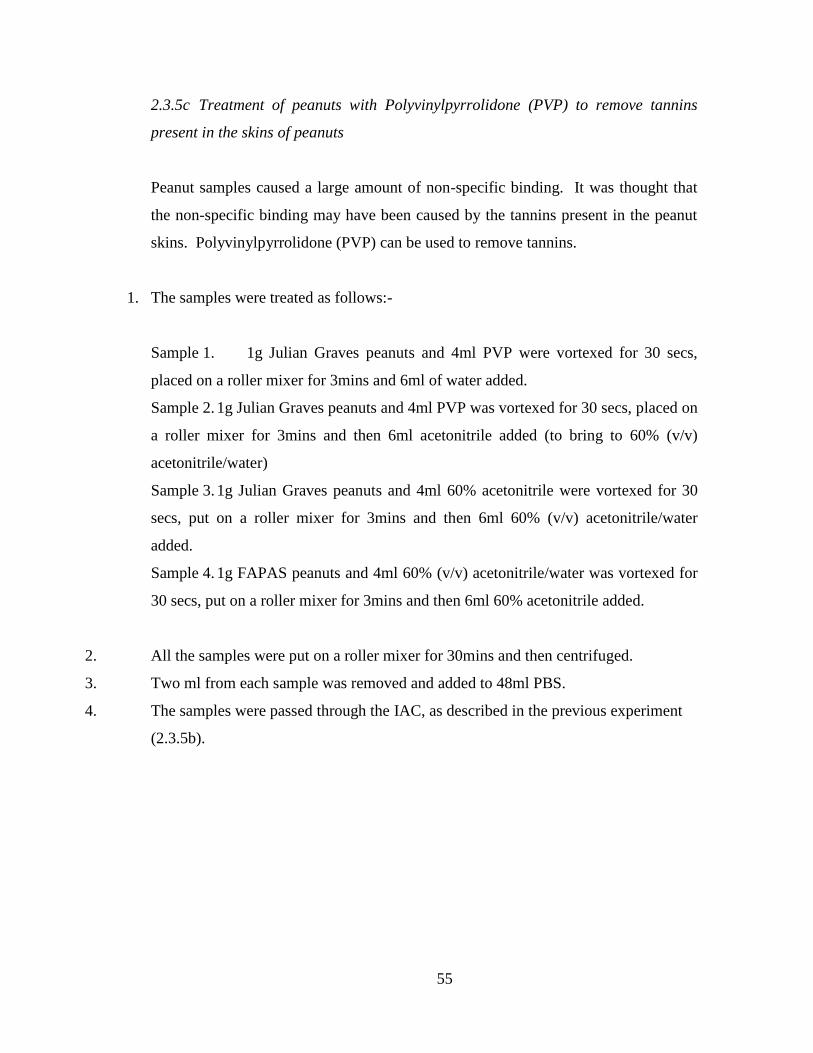
55
2.3.5c Treatment of peanuts with Polyvinylpyrrolidone (PVP) to remove tannins
present in the skins of peanuts
Peanut samples caused a large amount of non-specific binding. It was thought that
the non-specific binding may have been caused by the tannins present in the peanut
skins. Polyvinylpyrrolidone (PVP) can be used to remove tannins.
1. The samples were treated as follows:-
Sample 1. 1g Julian Graves peanuts and 4ml PVP were vortexed for 30 secs,
placed on a roller mixer for 3mins and 6ml of water added.
Sample 2. 1g Julian Graves peanuts and 4ml PVP was vortexed for 30 secs, placed on
a roller mixer for 3mins and then 6ml acetonitrile added (to bring to 60% (v/v)
acetonitrile/water)
Sample 3. 1g Julian Graves peanuts and 4ml 60% acetonitrile were vortexed for 30
secs, put on a roller mixer for 3mins and then 6ml 60% (v/v) acetonitrile/water
added.
Sample 4. 1g FAPAS peanuts and 4ml 60% (v/v) acetonitrile/water was vortexed for
30 secs, put on a roller mixer for 3mins and then 6ml 60% acetonitrile added.
2. All the samples were put on a roller mixer for 30mins and then centrifuged.
3. Two ml from each sample was removed and added to 48ml PBS.
4. The samples were passed through the IAC, as described in the previous experiment
(2.3.5b).

56
2.3.5d Optimised assay for the extraction of aflatoxin from peanuts
1. Fifty g quantities of peanuts were weighed out and 500ml of 80% (v/v)
methanol/water added.
2. Samples were shaken vigorously and put on a roller mixer for 30 minutes.
3. The samples were then centrifuged at 2000g on a bench centrifuge for 10 minutes,
2ml removed and mixed with 14ml PBS, pH 7.4.
4. The “Easi-extract aflatoxin” columns were first conditioned using 20ml PBS, pH 7.4.
5. The samples were then passed through the column, and then the columns were
washed with 20ml ddH2O.
6. The samples are eluted by passing and then collecting 2 aliquots of 1.5ml 100% (v/v)
methanol.
7. The methanol was blown down in a concentrator at 70°C over a stream of nitrogen.
8. The samples were then reconstituted by adding 1ml HBS and vortexing for 2mins.
9. The calibrants for the calibration curve were made out of blank sample as follows:-
Amount and concentration of aflatoxin B1 added to
blank sample
Calibrant
concentration
(ng/g blank
sample)
40µl 125ng/ml aflatoxin B1 + 960µl blank sample 25
40µl 50ng/ml aflatoxin B1 + 960µl blank sample 10
40µl 25ng/ml aflatoxin B1 + 960µl blank sample 5
40µl 12.5ng/ml aflatoxin B1 + 960µl blank sample 2.5
40µl 5ng/ml aflatoxin B1 + 960µl blank sample
1
40µl 2.5ng/ml aflatoxin B1 + 960µl blank sample 0.5
40µl HBS + 960µl blank sample 0
10. The calibrants and samples were then filtered using Whatman anatop filters.

57
11. The calibrants and samples were then run on the Biacore Q biosensor. The optimised
assay conditions consisted of an antibody fraction of 20% and an injection time of
600seconds. The regeneration solution was 10mM NaOH and 20% (v/v) acetonitrile,
with a 20 second injection time.
2.3.6 General Methodology
2.3.6a Decontamination of consumables and glassware that have come into contact
with aflatoxin
Aflatoxin B1 is a toxic substance. Therefore, several precautions had to be carried
out when handling it. Protective clothing and gloves were worn at all times.
Standards were made up in a fume cupboard whilst wearing a mask. Aflatoxin B1 is
sensitive to light and therefore was stored in vials that were protected form sunlight.
1. All materials and reagents that have been contaminated with aflatoxin were soaked in
a solution of 5% (v/v) sodium hypochlorite for at least 30 minutes.
2. The 5% (v/v) sodium hypochlorite is then removed, and the materials are then
soaked in 5% (v/v) acetone for another 30 minutes.
3. Glassware was then washed as per normal practice.
4. The consumable materials (i.e. pipette tips, eppendorfs, centrifuge tubes) were
disposed of with normal lab wast

Chapter 3:
Assay
Development
And
Feasibility

59
3.1 Format of aflatoxin B1 assay using a Biacore Q biosensor
Aflatoxin B1 is a small molecule, with a molecular weight of 312 Da, which when binding
to the chip surface would not create a large enough change in resonance to facilitate easy
detection in complex matrices. The aflatoxin B1 assay, therefore, was formatted as an
inhibition assay, where the amount of antibody binding to the surface is measured.
In an inhibition assay the chip surface is immobilised with the analyte or a derivative of the
analyte. In this assay a derivative of aflatoxin B1 is immobilised to the chip surface. A
fixed amount of the recombinant antibody is mixed with the sample prior to injection.
Aflatoxin B1 present in the sample will bind to the antibody and therefore inhibit it from
binding to the surface of the sensor chip. The higher the concentration of the analyte in the
sample, the more antibodies will bind to it, causing a higher level of inhibition. This
produces a lower response of the biosensor. A calibration curve is generated using the
responses produced from known standards. The amount of aflatoxin B1 in a sample can
then be quantified in reference to this curve (Van der Gaag et al., 2003).
.
3.2 Development of a sensor chip for the aflatoxin B1 assay
Zhanna Samaonova was a previous employee of Xenosense Ltd, and had previously carried
out a study to determine the most efficient way of immobilising aflatoxin B1 onto the chip
surface. Direct immobilisation of aflatoxin B1 was compared to the immobilisation of
several aflatoxin B1 derivatives and immobilisation methods. These included aflatoxin B1-
hydrazone (2 hour and overnight immobilisations), aflatoxin B1-oxime (immobilised with
hydrazine, ethylendiamine, jeffamine or 1,6-hexanediamine), an aflatoxin B1-BSA or an
aflatoxin B1 amine derivative (both amine coupling immobilisation) and aflatoxin B1-
oxime-ethylenediamine (2 hour or overnight amine coupling immobilisation). The
derivative that showed optimal immobilisation was aflatoxin B1-oxime-ethylenediamine.
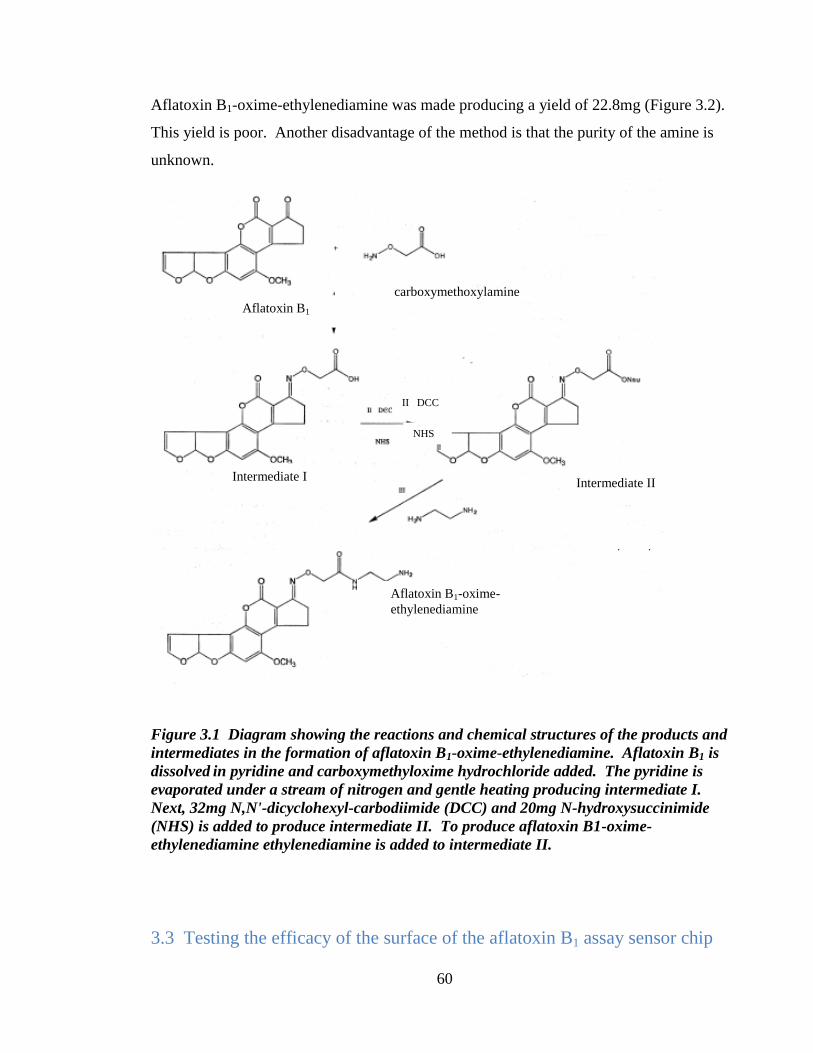
60
Aflatoxin B1-oxime-ethylenediamine was made producing a yield of 22.8mg (Figure 3.2).
This yield is poor. Another disadvantage of the method is that the purity of the amine is
unknown.
Figure 3.1 Diagram showing the reactions and chemical structures of the products and
intermediates in the formation of aflatoxin B1-oxime-ethylenediamine. Aflatoxin B1 is
dissolved in pyridine and carboxymethyloxime hydrochloride added. The pyridine is
evaporated under a stream of nitrogen and gentle heating producing intermediate I.
Next, 32mg N,N'-dicyclohexyl-carbodiimide (DCC) and 20mg N-hydroxysuccinimide
(NHS) is added to produce intermediate II. To produce aflatoxin B1-oxime-
ethylenediamine ethylenediamine is added to intermediate II.
3.3 Testing the efficacy of the surface of the aflatoxin B1 assay sensor chip
Aflatoxin B1
Intermediate I Intermediate II
Aflatoxin B1-oxime-
ethylenediamine
II DCC
NHS
carboxymethoxylamine

61
Aflatoxin B1-oxime-ethylenediamine was immobilised onto the chip surface. To determine
the efficiency of immobilisation, the maximum binding capacity, Rmax, was calculated. This
was achieved by first injecting a regeneration solution over the surface, which is strong
enough to remove all unbound molecules, but will not destroy the binding of the derivative
with the surface of the chip. In the case of the aflatoxin assay, the most efficient
regeneration solution was found to be 10mM NaOH/20% (v/v) acetonitrile. An excess of
antibody was then passed over the chip surface over a long injection time of 20 minutes
with a flow rate of 5μl/min.
If the immobilisation was successful, the resulting sensorgram should show binding to the
surface equivalent to several thousand RU. This is shown in figure 2.2. As a control an
unrelated antibody was also passed across the surface to confirm that the binding was
specific (sensorgram not shown).
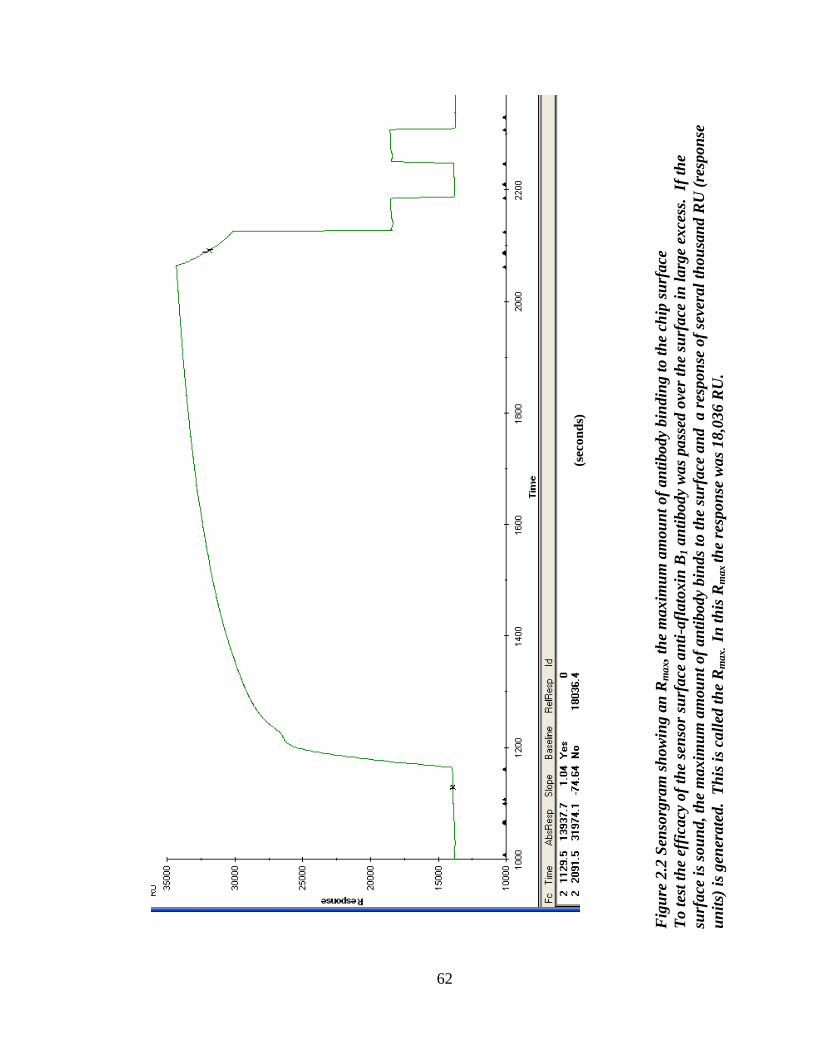
62
(sec
on
ds)
Fig
ure
2.2
Sen
sorg
ram
sh
ow
ing a
n R
ma
x, th
e m
axim
um
am
ou
nt
of
an
tibody
bin
din
g t
o t
he
chip
su
rface
To t
est
the
effi
cacy
of
the
sen
sor
surf
ace
an
ti-a
flato
xin
B1 a
nti
body
was
pass
ed o
ver
the
surf
ace
in
larg
e ex
cess
. I
f th
e
surf
ace
is
sou
nd, th
e m
axim
um
am
ou
nt
of
an
tibody
bin
ds
to t
he
surf
ace
an
d a r
espon
se o
f se
vera
l th
ou
san
d R
U (
resp
on
se
un
its)
is
gen
erate
d. T
his
is
call
ed t
he
Rm
ax
. I
n t
his
Rm
ax
the
resp
on
se w
as
18,0
36 R
U.

63
3.4 Evaluation of the feasibility of the aflatoxin B1 assay
Initially the feasibility of the assay had to be proved by generating a standard curve in
buffer. The buffer used with Biacore was HBS-EP. The standards for the calibration curve
were made up from a stock solution of 1mg aflatoxin B1 (Fermentek, Israel) in 1ml 100%
(v/v) methanol, and the antibody was a mouse monoclonal anti-aflatoxin B1 antibody
produced in mouse from Sigma.
A calibration curve was produced for aflatoxin B1 in a buffer system. This would indicate
that an assay using food matrices may be feasible.
Figure 3.3 Aflatoxin B1 calibration curve in HBS buffer
A calibration curve for Aflatoxin B1 was produced in buffer using the calibration points
0ng/ml (as shown by 0.001ng/ml in the table as it is not possible to give a value of
0ng/ml), 0.5ng/ml, 1.0ng/ml, 2.5ng/ml, 5ng/ml and 10ng/ml of Aflatoxin B1. A
calibration curve was produced, demonstrating that the assay works in a buffer system.
The table above shows the cycle number, the concentration of aflatoxin in ng/ml that was
passed over the surface in that cycle and the respose in arbitrary response units (RU). It
also shows whether the data quality was good and shows the calculated concentration of
the sample when the response is read off the calibration curve. The coefficient of
variation is also calculated between two samples of the same concentration. However,
more than two samples would be needed for a more accurate measure of the CV.
64
3.5 Evaluation of the anti-aflatoxin B1 antibodies for use in an assay using a
Biacore Q biosensor
Antibodies were supplied to us by Professor Richard O‟Kennedy, School of Biotechnology,
Dublin City University as part of the FUSION programme. These antibodies were produced
using phage display technologies. They were a monomeric (400), a dimeric (500) and 2
Fab fragments (D11 and G6). The four recombinant antibodies were compared to a
commercial monoclonal anti-aflatoxin B1 antibody.
A series of curves were set up using all four antibodies added in various percentage
fractions, and comparing different injection times, to determine the most sensitive antibody
and assay conditions. The antibody to sample ratio for each antibody was either 30/70 (v/v)
or 50/50(v/v) and the injection times were 120 secs, 240 secs and 480 secs. The standards
used in the curve were 0, 0.5, 1, 2.5, 5, 10, 25 and 50ng/g of aflatoxin B1.
To determine which antibody is the most sensitive, and what concentration and contact time
were optimal, the midpoint of the curve was calculated. This was done by halving the
difference between the highest and the lowest responses on the curve and reading off the
curve to give a concentration of aflatoxin. The lower the midpoint, the more sensitive the
curve is. Another important factor is that the range of the curve is sufficient. It should
have a range of 400-600RU.
The results are shown in Table 3.1. The Fab G6 was found to be the most sensitive for use
with the biosensor, using an antibody fraction of 30% (antibody and sample are mixed
together by the biosensor at a ratio of 30:70) and an injection time of 480 secs. It also had a
good range at these parameters from 32.9 to 451.3RU.
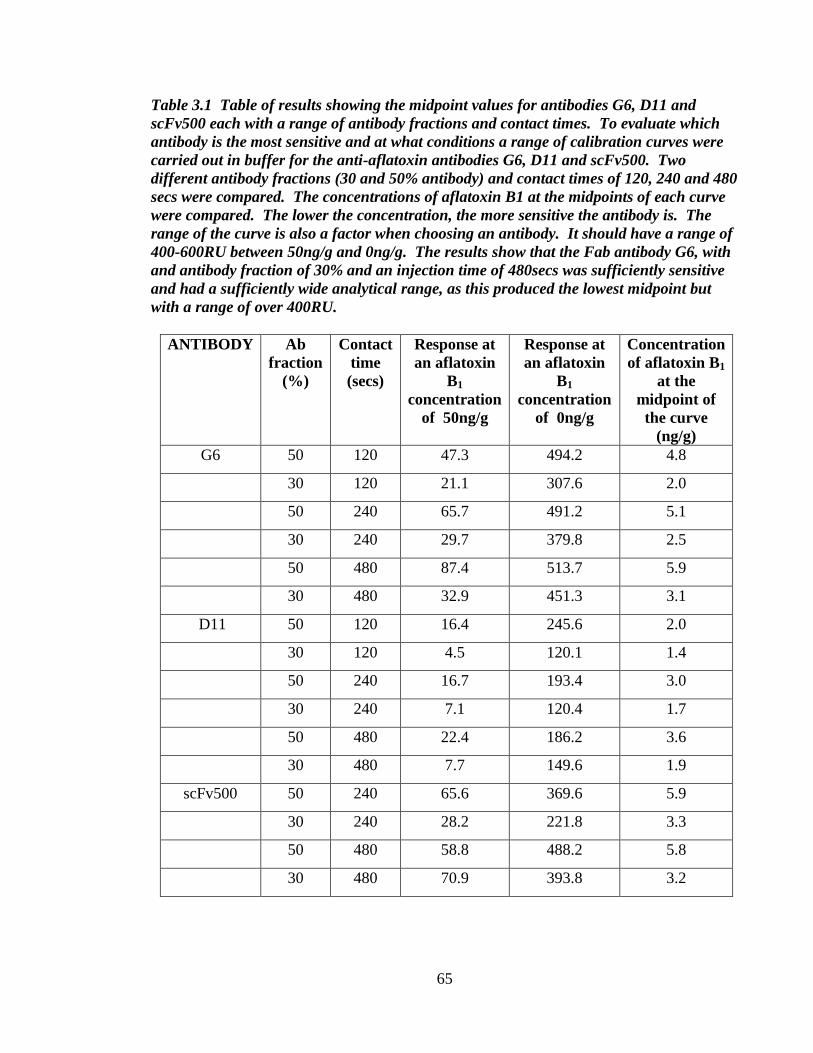
65
Table 3.1 Table of results showing the midpoint values for antibodies G6, D11 and
scFv500 each with a range of antibody fractions and contact times. To evaluate which
antibody is the most sensitive and at what conditions a range of calibration curves were
carried out in buffer for the anti-aflatoxin antibodies G6, D11 and scFv500. Two
different antibody fractions (30 and 50% antibody) and contact times of 120, 240 and 480
secs were compared. The concentrations of aflatoxin B1 at the midpoints of each curve
were compared. The lower the concentration, the more sensitive the antibody is. The
range of the curve is also a factor when choosing an antibody. It should have a range of
400-600RU between 50ng/g and 0ng/g. The results show that the Fab antibody G6, with
and antibody fraction of 30% and an injection time of 480secs was sufficiently sensitive
and had a sufficiently wide analytical range, as this produced the lowest midpoint but
with a range of over 400RU.
ANTIBODY Ab
fraction
(%)
Contact
time
(secs)
Response at
an aflatoxin
B1
concentration
of 50ng/g
Response at
an aflatoxin
B1
concentration
of 0ng/g
Concentration
of aflatoxin B1
at the
midpoint of
the curve
(ng/g)
G6 50 120 47.3 494.2 4.8
30 120 21.1 307.6 2.0
50 240 65.7 491.2 5.1
30 240 29.7 379.8 2.5
50 480 87.4 513.7 5.9
30 480 32.9 451.3 3.1
D11 50 120 16.4 245.6 2.0
30 120 4.5 120.1 1.4
50 240 16.7 193.4 3.0
30 240 7.1 120.4 1.7
50 480 22.4 186.2 3.6
30 480 7.7 149.6 1.9
scFv500 50 240 65.6 369.6 5.9
30 240 28.2 221.8 3.3
50 480 58.8 488.2 5.8
30 480 70.9 393.8 3.2

Chapter 4:
Matrices
and
Sample
Extraction

66
4.1 Introduction
The range of commodities that are affected by aflatoxins is very broad as contamination can
occur at any time from pre-harvest, from storage and during transportation (Kabak et al.,
2006). Cereals such as maize, rice and wheat, and nuts (e.g. peanuts, brazil nuts and
pistachios) can be affected at any stage of the farming cycle, whilst spices and dried fruit
are most likely to become contaminated when stored. Aflatoxins can withstand high
temperatures and, therefore, can also be present in processed foods. Recently, in
September 2006, snacks containing rice flour contaminated with aflatoxins were withdrawn
from several large retailers in the UK (RASFF, Rapid Alert System for Food and Feed).
Another product that was associated with aflatoxin contamination is peanut butter when
made from contaminated peanuts. Milk and milk products may also have aflatoxin
contamination due to metabolism of ingested aflatoxins by dairy cows.
Aflatoxins can be extracted from food matrices using a number of different solvents,
including methanol, acetonitrile, chloroform, acetone and DMSO. However, pure solvents
are not as efficient as solvents that have been diluted with water. The ratios of solvent to
water are critical, as are the solvent to matrix ratio (Whitaker et al., 1986). Also, some
solvents work best for different matrices. For example, R-Biopharm Rhone recommend an
80% (v/v) methanol extraction for nuts, figs, maize and cereals, whereas for spices,
compound feed and herbs a 60% (v/v) acetonitrile solution is advised.
Solvent extraction, however, can be problematic because other impurities from the matrix
are often extracted along with the aflatoxin. These impurities may also bind non-
specifically to the surface of the sensor chip. Non-specific binding (NSB) can, therefore,
lead to false results. A popular way of reducing NSB is the use of clean-up columns. SPE
(solid phase extraction) columns or immunoaffinty columns (IAC) are frequently used to
isolate an analyte from a matrix and also to concentrate the samples (Stroka et al., 2000;
Senyuva et al., 2005; Ip et al., 2006; Turner et al., 2009).
67
SPE columns contain a matrix, which is known as the solid phase. The extraction process
works on the premise that the analyte of interest has a far greater affinity for the matrix than
the impurities in a sample. Once the sample has been extracted, using a suitable solvent
and passed through the SPE column, the analyte has a stronger affinity to the solid phase
than the rest of the matrix. Therefore, the impurities are washed away, and the purified
analyte can be eluted from the column. A variety of different stationary phases can be
used, depending on the charge of the analyte of interest. Most are based on a bonded silica
material derivatised with a functional group to confer a positive or negative charge (Turner
et al., 2009). The main disadvantage of SPE is that the matrix may contain impurities that
have the same charge as the analyte. These too will be adsorbed on to the solid phase, and
so the analyte may not be pure.
In contrast, IACs are also based on a column filled with a matrix. This matrix, however,
contains antibodies that have affinity specifically for the analyte of interest. Therefore
when a sample is passed through the column only the analyte binds to the surface, washing
away all other impurities. Therefore, the advantage of this system is that the eluate
contains a pure solution of the analyte. A disadvantage is that these columns can be very
expensive (Castegnaro et al., 2006).
The purpose of this project was to develop a diagnostic kit to test for aflatoxins in a range
of foodstuffs that will be launched as a product alongside the other food testing kits
developed and manufactured by Xenosense Ltd. The matrices chosen are dependant on a
number of factors. For example, what is the unique selling factor of this test? What tests
are there already available on the market? At the beginning our tests will be targeted at
existing customers, which include Nestle, Kraft and Analyscen. Therefore, it is very
important that the commodities that are within the capabilities of testing by the kit coincide
with the interests of potential customers.
68
4.2 Compound Feed (IRMM Reference Material)
4.2.1.Introduction
The first matrix to be investigated was a reference material. The reference material was
compound feed, which was commercially available from Sigma Aldridge. Spiked samples
can sometimes behave differently than real samples, so it was decided to try to optimise the
assay using real samples first. The reference material was purchased from the Institute for
Reference Materials and Measurements (IRMM). Two samples were bought that had been
certified to contain 0 ng/g (blank) and 9.3 ng/g aflatoxin B1.
4.2.2 Results
The most common extraction solvent for aflatoxin B1 is methanol. Therefore a simple
methanol extraction was carried out using compound feed reference material that contained
9.3 ng/g aflatoxin B1. The sample was run against a standard curve made from aflatoxin B1
in HBS-EP buffer. The sample, however, gave reading that were “off-scale”, showing
major interference effects from the matrix.
To remove the matrix effects from the sample the use of solid phase extraction (SPE)
columns and immunoaffinity columns (IAC) was investigated.
“Mycosep” SPE columns, purchased from Romer Laboratories, were evaluated initially as
they were considerably less expensive than the immunoaffinity columns. The first
extraction was read off a standard curve that had been created using HBS-EP buffer. The
results showed apparent recoveries of about 1000%. This would suggest that, again, there
was interference from the sample matrix. The experiment was then repeated. This time,
however, the standard curve was constructed using blank sample extract instead of buffer.
The reasoning for this is that the sample and the calibration curve are directly comparable.
However, the calibration points obtained were erratic, and a calibration curve was not

69
generated, so that it was impossible to determine the concentration of aflatoxin B1 in the
sample from the constructed standard curve. This was, again, due to matrix interference.
In an attempt to remove matrix interference immunoaffinity columns were tested. There
are many IAC specific to aflatoxins available. “Easi-extract aflatoxin” IAC are mentioned
frequently in papers and other published documents and were, therefore, first to be
evaluated
The calibration curve was made using a blank sample extract. On this occasion the curve
showed little matrix interference. The concentration of the sample when it was read off the
curve was 9.3 ng/g. The compound feed was certified as containing aflatoxin B1 at a
concentration of 9.3 ng/g. This gives a recovery of 100.5%. The experiment was then
repeated to prove that the results could be replicated. The recovery from the certified
compound feed sample was 9.08 ng/g, which is 98%. These results are shown in Figure
4.1. This shows that the “easi-extract aflatoxin” IAC are very effective in sample clean-up.

70
Figure 4.1 Aflatoxin B1 in compound feed reference material assay using “Easi-extract
aflatoxin” immunoaffinity columns commercially available from R-Biopharm Rhone
The table above shows the cycle number, the concentration of aflatoxin in ng/ml that was
passed over the surface in that cycle and the respose in arbitrary response units (RU). It
also indicates whether the data quality was good and shows the calculated concentration
of the sample when the response is read off the calibration curve. The coefficient of
variation is also calculated between two samples of the same concentration.
Aflatoxin B1 was extracted from compound feed using“Easi-extract aflatoxin”
immunoaffinity columns. The feed had been certified to contain aflatoxin B1 at a
concentration of 9.3 ng/g. Using a calibration curve that had been created using blank
extracted sample, the calculated recovery of aflatoxin B1 from the sample was given as
9.08 ng/g, which is 98%. The coefficient of variation (% CV) was 4.4.
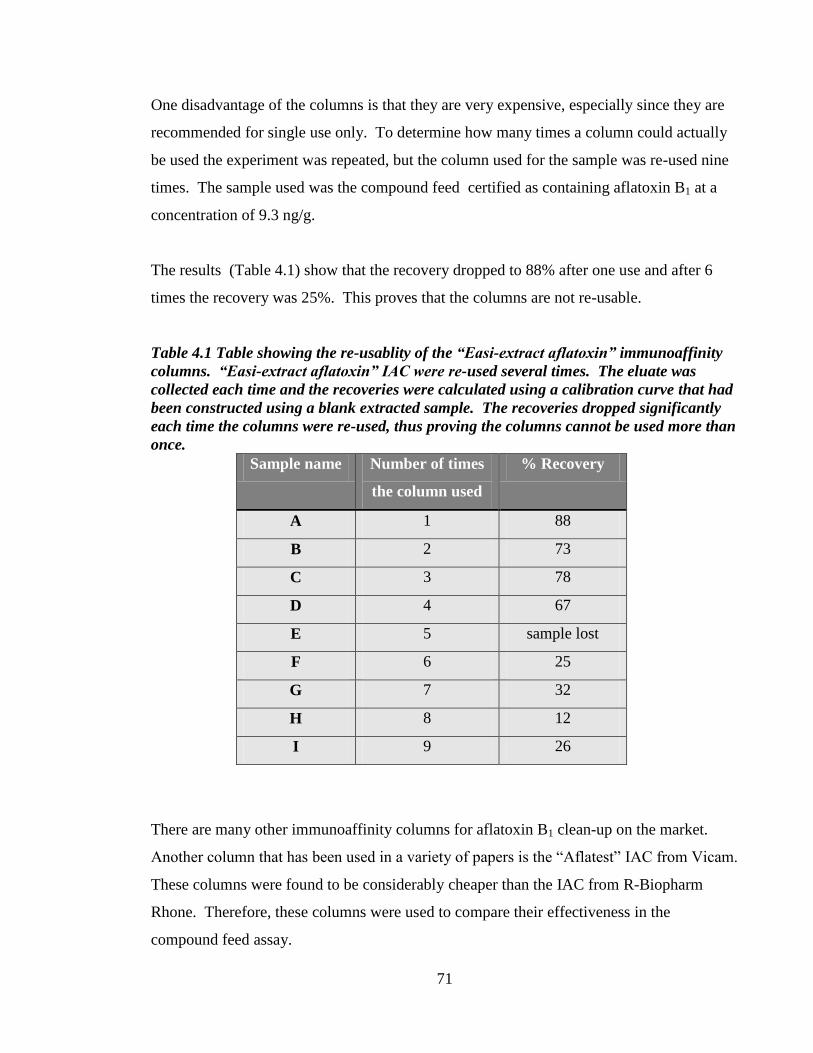
71
One disadvantage of the columns is that they are very expensive, especially since they are
recommended for single use only. To determine how many times a column could actually
be used the experiment was repeated, but the column used for the sample was re-used nine
times. The sample used was the compound feed certified as containing aflatoxin B1 at a
concentration of 9.3 ng/g.
The results (Table 4.1) show that the recovery dropped to 88% after one use and after 6
times the recovery was 25%. This proves that the columns are not re-usable.
Table 4.1 Table showing the re-usablity of the “Easi-extract aflatoxin” immunoaffinity
columns. “Easi-extract aflatoxin” IAC were re-used several times. The eluate was
collected each time and the recoveries were calculated using a calibration curve that had
been constructed using a blank extracted sample. The recoveries dropped significantly
each time the columns were re-used, thus proving the columns cannot be used more than
once.
Sample name Number of times
the column used
% Recovery
A 1 88
B 2 73
C 3 78
D 4 67
E 5 sample lost
F 6 25
G 7 32
H 8 12
I 9 26
There are many other immunoaffinity columns for aflatoxin B1 clean-up on the market.
Another column that has been used in a variety of papers is the “Aflatest” IAC from Vicam.
These columns were found to be considerably cheaper than the IAC from R-Biopharm
Rhone. Therefore, these columns were used to compare their effectiveness in the
compound feed assay.
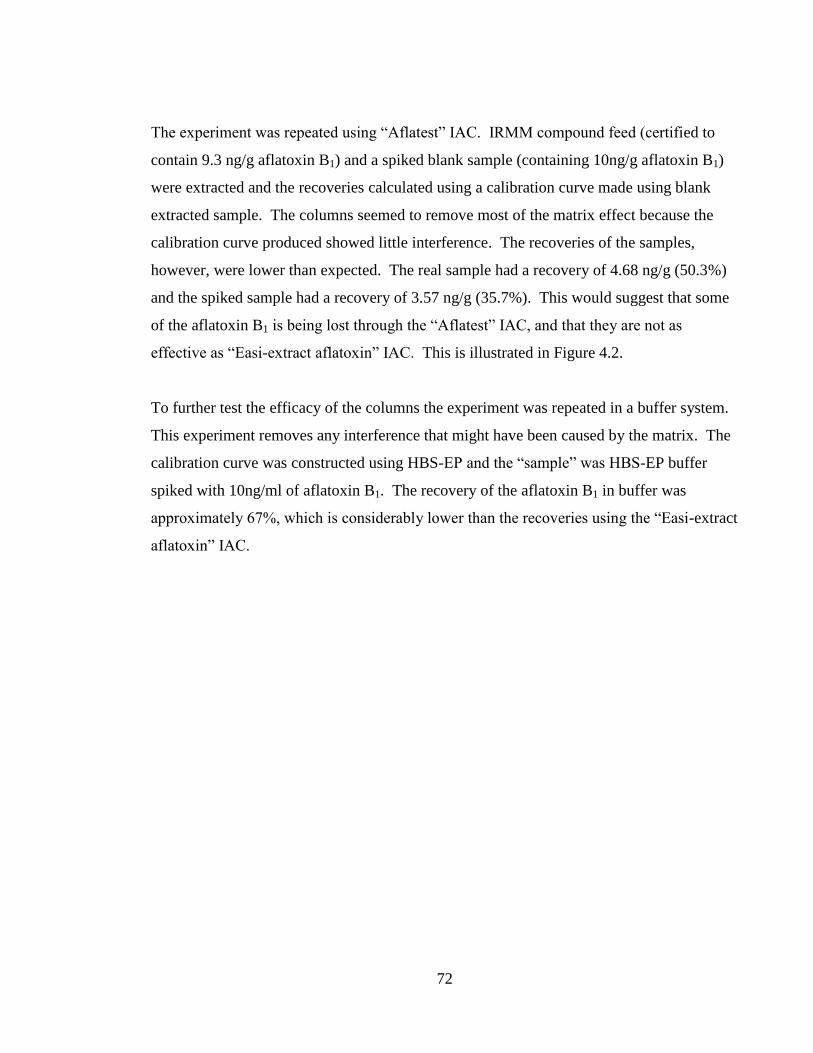
72
The experiment was repeated using “Aflatest” IAC. IRMM compound feed (certified to
contain 9.3 ng/g aflatoxin B1) and a spiked blank sample (containing 10ng/g aflatoxin B1)
were extracted and the recoveries calculated using a calibration curve made using blank
extracted sample. The columns seemed to remove most of the matrix effect because the
calibration curve produced showed little interference. The recoveries of the samples,
however, were lower than expected. The real sample had a recovery of 4.68 ng/g (50.3%)
and the spiked sample had a recovery of 3.57 ng/g (35.7%). This would suggest that some
of the aflatoxin B1 is being lost through the “Aflatest” IAC, and that they are not as
effective as “Easi-extract aflatoxin” IAC. This is illustrated in Figure 4.2.
To further test the efficacy of the columns the experiment was repeated in a buffer system.
This experiment removes any interference that might have been caused by the matrix. The
calibration curve was constructed using HBS-EP and the “sample” was HBS-EP buffer
spiked with 10ng/ml of aflatoxin B1. The recovery of the aflatoxin B1 in buffer was
approximately 67%, which is considerably lower than the recoveries using the “Easi-extract
aflatoxin” IAC.
73
Figure 4.2 Aflatoxin B1 in compound feed reference material assay using “Aflatest”
immunoaffinity columns commercially available from Vicam.
Aflatoxin B1 was extracted from compound feed using“Easi-extract aflatoxin”
immunoaffinity columns. Samples used were IRMM compound feed (certified to contain
9.3 ng/g aflatoxin B1) and a spiked blank sample (containing 10ng/g aflatoxin B1). The
real sample had a recovery of 4.68 ng/g (50.3%) and the spiked sample had a recovery of
3.57 ng/g (35.7%).
74
4.3 Infant Formula
4.3.1 Introduction
The feasibility of the aflatoxin assay had been proven with matrix using the compound feed
reference material. The first matrix chosen to investigate was infant formula. Infant
formula has regulatory limits set by the EU at 0.05ng/g. These limits are the lowest set by
the EU for aflatoxin B1 in any food. The reason why the limits are so low is that the food is
designed for consumption by babies who would be extremely vulnerable towards aflatoxin
toxicity. In addition, there are currently no rapid tests available in the market able to detect
such low concentrations. This would be a unique selling point for the kit and the reason
why infant formula was chosen as the first matrix to examine in detail.
4.3.2 Results
To minimise cost for budgetary and commercial feasibility it was decided to first
investigate sample preparations that did not use expensive IACs. The simplest extraction
procedure involved using methanol. A simple methanol extraction was carried out using
infant formula that had been spiked with aflatoxin B1. The calibration curve was
constructed using calibrant that had been made from blank infant formula that had gone
through the same methanol extraction as the spiked sample.
Unfortunately, when the calibrants were analysed there was too much interference from the
matrix and a calibration curve could not be generated. Infant formula contains a high
perventage of fat, which could bind to the chip surface. The experiment was, therefore,
repeated except that an additional cyclohexane step was introduced. Cyclohexane is used
to remove fat from the sample. Results are shown in Figure 4.3.
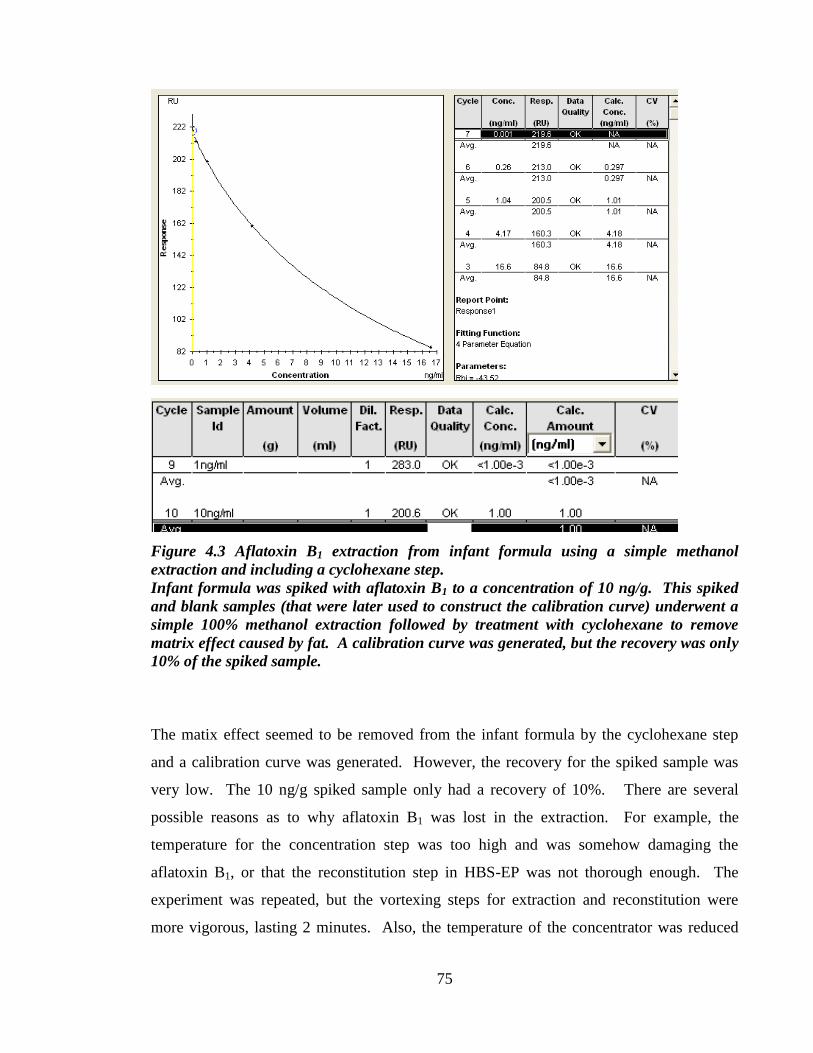
75
Figure 4.3 Aflatoxin B1 extraction from infant formula using a simple methanol
extraction and including a cyclohexane step.
Infant formula was spiked with aflatoxin B1 to a concentration of 10 ng/g. This spiked
and blank samples (that were later used to construct the calibration curve) underwent a
simple 100% methanol extraction followed by treatment with cyclohexane to remove
matrix effect caused by fat. A calibration curve was generated, but the recovery was only
10% of the spiked sample.
The matix effect seemed to be removed from the infant formula by the cyclohexane step
and a calibration curve was generated. However, the recovery for the spiked sample was
very low. The 10 ng/g spiked sample only had a recovery of 10%. There are several
possible reasons as to why aflatoxin B1 was lost in the extraction. For example, the
temperature for the concentration step was too high and was somehow damaging the
aflatoxin B1, or that the reconstitution step in HBS-EP was not thorough enough. The
experiment was repeated, but the vortexing steps for extraction and reconstitution were
more vigorous, lasting 2 minutes. Also, the temperature of the concentrator was reduced

76
from 70 to 60˚C. The recoveries were only slightly improved, increasing from 10% to
16%. Therefore, other extraction methods had to be investigated.
Acetonitrile is another solvent that is recommended for aflatoxin B1 extraction. The
methanol extraction method, which included the cyclohexane washes, was repeated using
acetonitrile instead of methanol. There was a slight improvement in the recoveries (the 10
ng/g spike had a recovery of 26%), but they were still very low. The experiment was
repeated without the cyclohexane washes to determine whether the aflatoxin B1 was lost
along with the fat in the sample. The calibrants, however, made from “blank-extracted”
sample had too much matrix interference and a satisfactory calibration curve could not be
generated.
Infant formula also contains a high percentage of protein. It was possible that the aflatoxin
was binding to the proteins in the matrix and was then being removed. Therefore, several
methods were performed to precipitate out the proteins. The first method used acetic acid.
This experiment was repeated using either ethyl acetate or chloroform as the extraction
solvents. Again, the recoveries were low. Both solvents had recoveries of 13% for samples
spiked at 10ng/g. Hydrochloric acid was then used to precipitate the proteins instead of
acetic acid. A sample spiked with 4 ng/g aflatoxin B1 was added to a mixture of 100%
methanol and 0.1M hydrochloric acid. After the protein precipitation, a hexane wash was
completed to remove fat from the sample. The aflatoxin B1 was then extracted using
chloroform. However, the recovery was only 15%.
Excellent results had previously been achieved for aflatoxin B1 extraction from compound
feed using “Easi-extract aflatoxin” IAC from R-Biopharm Rhone. The use of these
columns had been avoided because they were so expensive, but, because of the failure of
simple solvent extraction to yield good recoveries, the columns were assessed for use in the
infant formula assay.
Two blank infant formula samples were spiked with aflatoxin B1, one at 2.5 ng/g and the
other at 10ng/g. An 80% methanol extraction was first carried out and then the samples
77
were put through the “Easi-extract aflatoxin” IAC. A calibration curve was constructed
using blank samples that had also been put through the IAC. The results showed, however,
that again, the recoveries were low being 24% for the 2.5ng/g spike and only 13% for the
10 ng/g spiked sample.
R-Biopharm Rhone recommends both methanol and acetonitrile as solvents for aflatoxin B1
extraction. The experiment was repeated using 100% acetonitrile for the extraction solvent
instead of 80% methanol. The IAC were conditioned, samples added and washed as
before. This time, however, the 10 ng/g spike had an apparent recovery of 137%. It is
impossible to have recoveries over 100%, so the results are too high. However, of major
concern, was the sensitivity of the curve. The regulation limits for aflatoxin B1 in infant
formula are 0.05 ng/g. Therefore, this assay must be sensitive enough to detect to these
levels. In order to increase the sensitivity of the assay the experiment was repeated using a
smaller extraction volume. R-Biopharm Rhone recommend an extraction volume of 10ml.
In order to increase the sensitivity of the assay, however, 5ml of 100% acetonitrile were
used. Two spiked samples were used in this assay (1 ng/g and 5 ng/g). Although the
recoveries for the 5ng/g spike were promising (the recoveries were an average of 78%),
those for the 1ng/g were erratic. One of the recoveries was 100.4% but the other was
384%. The reason for this is that the sensitivity of the curve at this concentration is very
poor. This is not acceptable for an infant formula assay as it has to be able to detect levels
down to 0.05 ng/g. It seemed very unlikely, therefore, that even with the use of IAC, that a
calibration curve of this sensitivity can be achieved. The outcomes of the various
approaches are summarized in Table 4.2. Hence, it was decided to concentrate on other
potential matrices of commercial relevance that might be more feasible for assay
development.
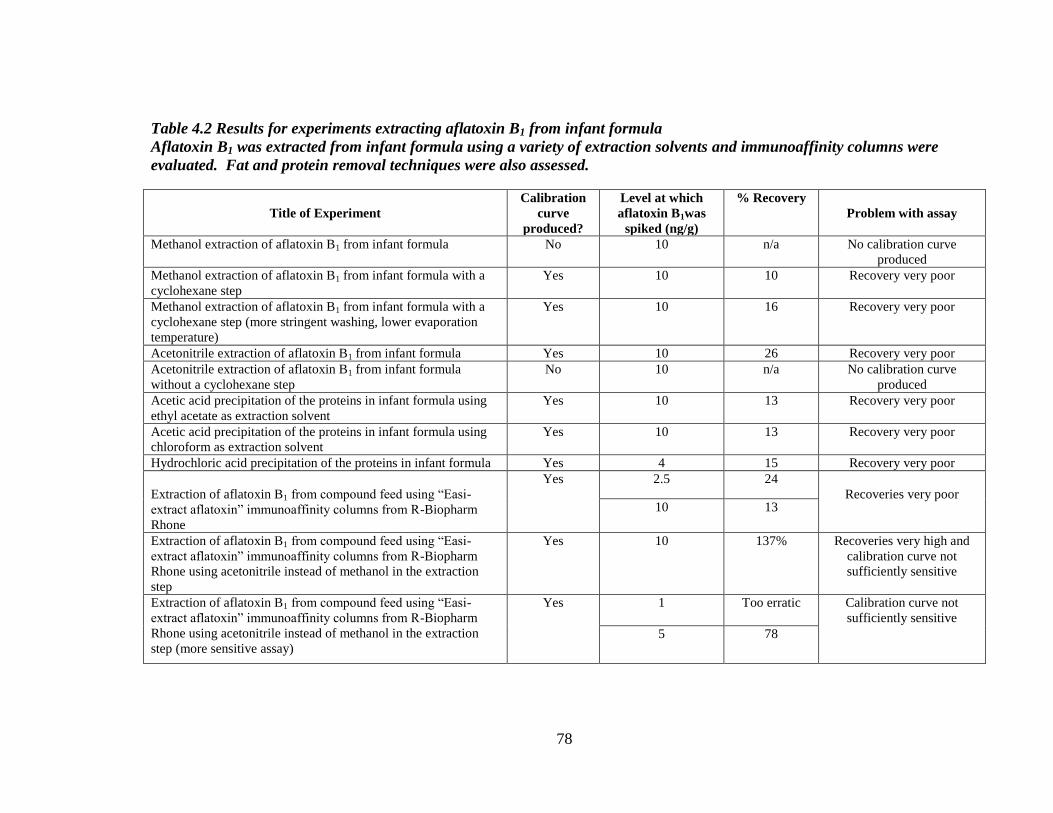
78
Table 4.2 Results for experiments extracting aflatoxin B1 from infant formula
Aflatoxin B1 was extracted from infant formula using a variety of extraction solvents and immunoaffinity columns were
evaluated. Fat and protein removal techniques were also assessed.
Title of Experiment
Calibration
curve
produced?
Level at which
aflatoxin B1was
spiked (ng/g)
% Recovery
Problem with assay
Methanol extraction of aflatoxin B1 from infant formula No 10 n/a No calibration curve
produced
Methanol extraction of aflatoxin B1 from infant formula with a
cyclohexane step
Yes 10 10 Recovery very poor
Methanol extraction of aflatoxin B1 from infant formula with a
cyclohexane step (more stringent washing, lower evaporation
temperature)
Yes 10 16 Recovery very poor
Acetonitrile extraction of aflatoxin B1 from infant formula Yes 10 26 Recovery very poor
Acetonitrile extraction of aflatoxin B1 from infant formula
without a cyclohexane step
No 10 n/a No calibration curve
produced
Acetic acid precipitation of the proteins in infant formula using
ethyl acetate as extraction solvent
Yes 10 13 Recovery very poor
Acetic acid precipitation of the proteins in infant formula using
chloroform as extraction solvent
Yes 10 13 Recovery very poor
Hydrochloric acid precipitation of the proteins in infant formula Yes 4 15 Recovery very poor
Extraction of aflatoxin B1 from compound feed using “Easi-
extract aflatoxin” immunoaffinity columns from R-Biopharm
Rhone
Yes 2.5 24
Recoveries very poor 10 13
Extraction of aflatoxin B1 from compound feed using “Easi-
extract aflatoxin” immunoaffinity columns from R-Biopharm
Rhone using acetonitrile instead of methanol in the extraction
step
Yes 10 137% Recoveries very high and
calibration curve not
sufficiently sensitive
Extraction of aflatoxin B1 from compound feed using “Easi-
extract aflatoxin” immunoaffinity columns from R-Biopharm
Rhone using acetonitrile instead of methanol in the extraction
step (more sensitive assay)
Yes 1
Too erratic Calibration curve not
sufficiently sensitive
5 78
4.4 Maize
4.4.1 Introduction
The FAO has estimated that 25% of grains and cereals worldwide have been contaminated
by mycotoxins. This includes aflatoxins. Cereals and grains are both major constituents of
the human food chain and the main food-stuff fed to livestock. Therefore, cereals
contaminated with aflatoxins can have a huge adverse impact on animal husbandry, as they
have been shown to reduce immunity, decrease fertility, decrease weight gain, cause a
reduction in milk production and, when contamination is high enough, mortality. It is of
great significance for dairy cows, where aflatoxin is metabolised and then excreted via the
milk in the form of aflatoxin M1. Thus, control of aflatoxin contamination of cereals is
essential for production economics, animal health, food safety and product quality.
A cereal that is at high risk of aflatoxin contamination is maize. Maize is the major cereal
for both human and livestock consumption in many African and South-East Asian diets,
and in North America it is the staple food for livestock. Therefore, control of aflatoxin
levels in corn is crucial and it was for this reason that it was chosen as the next sample
matrix. In addition, it was thought that sample preparation would be easier than that for
infant formula as it is not as complex a matrix. The lowest regulatory limits for the
detection of aflatoxin B1 in corn was set by the EU and is 2ppb (Commission Regulation
(EC) No 2174/2003 of 12 December 2003).
4.4.2 Results
The AOAC recommends the “Best Food” (BF) method for the extraction of aflatoxins from
corn. The method involves a 55% (v/v) methanol/water extraction, followed by a hexane
step and then a final chloroform extraction. The calibration curve was generated using
extracted blank sample. A calibration curve was formed. However, the background was
very high caused by interference from the matrix and the sample reading was of the scale.
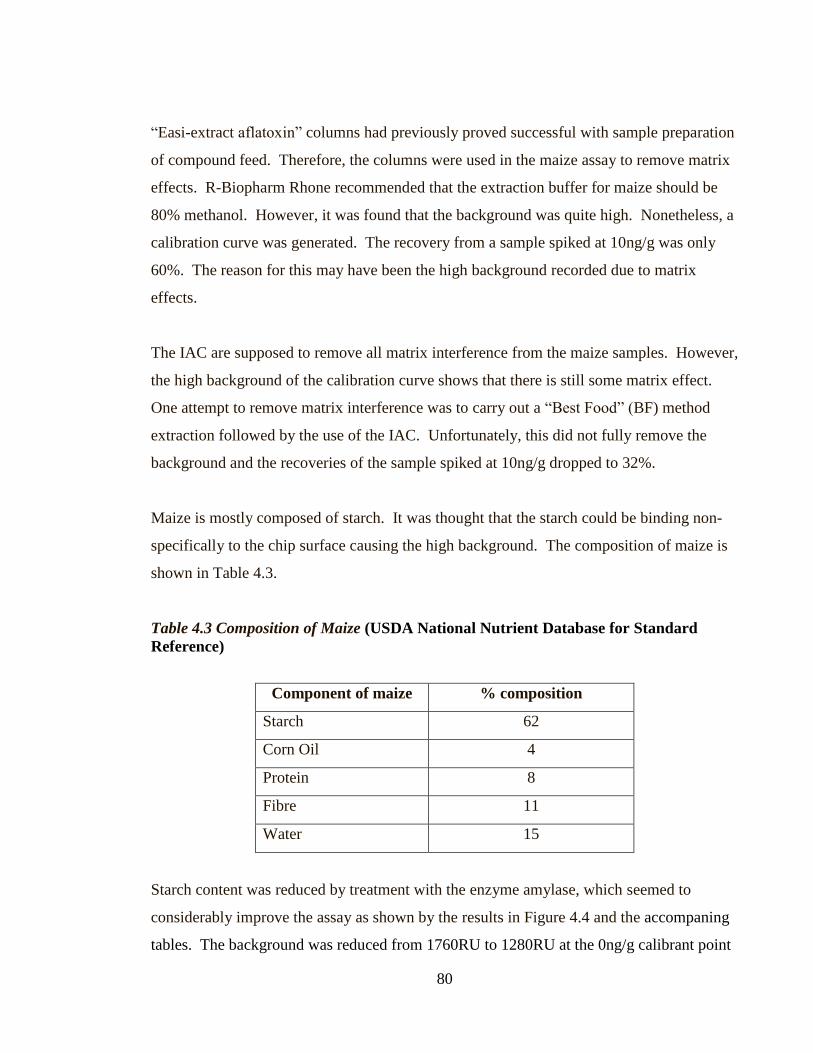
80
“Easi-extract aflatoxin” columns had previously proved successful with sample preparation
of compound feed. Therefore, the columns were used in the maize assay to remove matrix
effects. R-Biopharm Rhone recommended that the extraction buffer for maize should be
80% methanol. However, it was found that the background was quite high. Nonetheless, a
calibration curve was generated. The recovery from a sample spiked at 10ng/g was only
60%. The reason for this may have been the high background recorded due to matrix
effects.
The IAC are supposed to remove all matrix interference from the maize samples. However,
the high background of the calibration curve shows that there is still some matrix effect.
One attempt to remove matrix interference was to carry out a “Best Food” (BF) method
extraction followed by the use of the IAC. Unfortunately, this did not fully remove the
background and the recoveries of the sample spiked at 10ng/g dropped to 32%.
Maize is mostly composed of starch. It was thought that the starch could be binding non-
specifically to the chip surface causing the high background. The composition of maize is
shown in Table 4.3.
Table 4.3 Composition of Maize (USDA National Nutrient Database for Standard
Reference)
Component of maize % composition
Starch 62
Corn Oil 4
Protein 8
Fibre 11
Water 15
Starch content was reduced by treatment with the enzyme amylase, which seemed to
considerably improve the assay as shown by the results in Figure 4.4 and the accompaning
tables. The background was reduced from 1760RU to 1280RU at the 0ng/g calibrant point

81
of the curve. The range of the calibration curve had also improved with a drop of 300RU
between 0 and 50ng/g. The larger the drop in the calibration curve, i.e. the greater the
difference in RU, the more sensitive the assay will be. Finally, the recoveries had also been
greatly improved. The apparent recovery for a 20ng/g spike was 111%.
In conclusion, it would seem that it was the starch present in the maize that was binding
non-specifically to the surface of the chip. The starch was successfully broken down by the
amylase treatment, thus reducing the background and resulting in acceptable recoveries.
Figure 4.4 Aflatoxin B1 extraction from maize with 55% (v/v) methanol/water, followed
by a hexane step and then a final chloroform extraction after the maize had been treated
with amylase.
Maize was spiked with aflatoxin B1 to a concentration of 10 ng/g. After an amylase
treatment to remove starch, the sample was then extracted with 55% (v/v)
methanol/water, followed by a hexane step and then a final chloroform extraction. The
recovery was found to be 111% and the coefficient of variation was 5.0%
82
4.5 Peanuts
Peanuts are very susceptible to mould growth and, therefore, it is a commodity that is
notorious for aflatoxin contamination. The lowest regulatory limits that have been set for
aflatoxin B1 in peanuts are by the EU and are 2ppb (2ng/g).
The first extraction procedure attempted for the peanut assay using the “Easi-extract
aflatoxin” immunoaffinity columns (IAC) was one recommended for peanuts in the
protocol of the kit. This involved an extraction step using 80% (v/v) methanol/water. The
peanuts used were reference material purchased from FAPAS (Food Analysis Performance
Assessment Scheme). They had been tested and certified as blank peanut samples.
Controls to determine whether the use of filters was needed in the assay were also included.
Half the blank sample and half the spiked sample were filtered using the PVDF
(Polyvinylidene Fluoride) filters and the other half remained unfiltered. This was to
determine whether non-specific binding to the chip surface could be removed by the use of
filters.
A calibration curve was generated, but there is still some background present. In buffer, the
zero calibration gave a response of 648RU, whilst in extract the response was 1356RU.
The filters did remove some non-specific binding as shown when comparing the samples
that have been filtered to those that had not. However, the recoveries were poor. An
average of 2.0ng/g was recovered, which was a 40% recovery. A possible reason for this
was that the high background was “masking” some of the recovery i.e. the background was
so high that the specific binding cannot be differentiated from the non-specific. Peanuts
contain high amounts of fats, which are known to associate with the surface of the Biacore
chip. Fat binding to the surface produces a characteristic bend in the sensorgram, which
was seen in this experiment. Removal of fat from a sample can be achieved by
incorporating a cyclohexane wash into the protocol, but when this was incorporated into the
previous experiment the background actually increased.

83
Another extraction process described in the R-Biopharm Rhone protocol involved using
60% (v/v) acetonitrile/water instead of 80% (v/v) methanol/water. This extraction was
carried out in the hope that less matrix effect would be extracted along with the aflatoxin.
The background was significantly reduced using acetonitrile instead of methanol for the
extraction solvent, the recoveries, however, were very poor. The samples had been spiked
with the equivalent of 5ng/g and the recovery was 1.21ng/g, which is 24.2%. Interestingly,
there did not seem to be too much difference between the filtered and unfiltered samples.
This suggests that the filters were unnecessary and the experiment was repeated without
filters. Both spiked and real samples were used. The real sample from FAPAS, which
contained 2.06ng/g of aflatoxin B1 was also included in this experiment.
The sample spiked with 5ng/g aflatoxin also showed good recovery (88%). However, with
the 2.5ng/g spike had very poor recovery. The most worrying outcome of the experiment,
however, was the responses from the real samples. The real samples had responses of over
2000RU. When the samples were extracted they had also looked different, with the real
samples producing a reddish liquid. FAPAS were contacted to discover what was
responsible for the differences between the blank and the positive samples were. The blank
samples had in fact been treated differently. The blank sample had been blanched, the skin
removed and milled with flour. The positive samples had only been milled, without the
addition of flour. Since the blank sample was not 100% peanut it should not be used for the
calibration curve. Although there is no guarantee that commercially bought peanuts are
aflatoxin-free, it was decided that a sample of these should be used for the calibration curve
as they would be 100% peanut. The peanuts chosen were bought from a health food shop
called “Julian Graves”. The reason for the high matrix effect was thought to be because the
peanut skins contain tannins, which are known to bind to the sensor chip surface. Other
assays have used PVP to remove tannins to great effect
The Julian Graves sample showed considerably more matrix effect than the FAPAS sample
(1500-1600RU compared to approximately 800RU). This shows that the matrix effect is
indeed caused by the peanut skins. The treatment of the peanuts with the PVP seemed to
add to the matrix effect with both samples treated with PVP showing responses double that

84
than the untreated sample. It was then decided to filter the samples and test then with
manual injections. Millex GS filters were selected as they had been used to remove PVP in
previous assays. This time all matrix effect were removed, including the sample that had
not been treated with PVP. It was concluded that the use of PVP was unnecessary, and that
a simple filtration step would suffice. However, Millex GS filters were known to sequester
aflatoxin. Therefore, a range of filters had to be evaluated.
Six different filters were evaluated, to determine their effectiveness at removing matrix
effects. The possibility that filters might sequester aflatoxin was also investigated. To test
if the matrix was removed, the peanut extract was filtered and the filtrate compared to HBS
when run against a calibration curve. Blank HBS and HBS that had been spiked at a
concentration of 5ng/g were also treated using the different filters. These too were
compared to a calibration curve in HBS, and this enabled the calculation of recoveries.
The results are shown in Table 4.4. They show that filters do remove the matrix
interferences from the samples. The response for the peanut extract without filtering was
3346RU. This shows a high level of non-specific binding to the surface when compared to
the response of buffer alone (630RU). The Millex GV filters remove approximately half
the non-specific binding (NSB), but the aflatoxin recovery is only 14%. The Millex GV
and the Millex PVDF remove all the NSB, but the aflatoxin is completely removed from
the sample by the filters. The Ministart columns remove about half the NSB and the
recovery was only 61%. The Target filters removed all the NSB, but the recovery was only
59%. The best performing filters were both from Whatman. The Whatman CA w/GMF
filters eliminated all NSB and the recovery was 84%. The best results, however, were
using the Whatman Anotope filters which removed all NSB and had apparent recoveries of
112%. This test was performed only once. It was thought that further tests were not
necessary as the experiment was designed only to give a quick comparison between the
filters. The Whatman Anotope filters were found to be the most suitable for use in the
aflatoxin/peanut assay.

85
Table 4.4 Table showing the efficacy of a range of different filters in removing matrix
effect from peanuts whilst not sequestering aflatoxin B1.
Filter Sample Type Response (RU) Recovery
No filter
Peanut extract 3346 N/A
HBS 630 N/A
HBS spiked with 10ng/g aflatoxin 123 160%
Millex GV
Peanut extract 1757 N/A
HBS 578 N/A
HBS spiked with 10ng/g aflatoxin 501 14%
Millex GS
Peanut extract 663 N/A
HBS 683.7 N/A
HBS spiked with 10ng/g aflatoxin 686 0%
Millex PVDF
Peanut extract 681 N/A
HBS 686 N/A
HBS spiked with 10ng/g aflatoxin 684 0%
Ministart
Peanut extract 1761 N/A
HBS 663 N/A
HBS spiked with 10ng/g aflatoxin 556.8 61%
Target
Peanut extract 739 N/A
HBS 687 N/A
HBS spiked with 10ng/g aflatoxin 277 59%
Whatman
Anatop
Peanut extract 657 N/A
HBS 676 N/A
HBS spiked with 10ng/g aflatoxin 169 112%
Whatman CA
w/GMF
Peanut extract 1082 N/A
HBS 643 N/A
HBS spiked with 10ng/g aflatoxin 215 84%
86
The assay with the acetonitrile extraction was then repeated using Whatman Anatop filters,
as they had been proven to remove the matrix effect, whilst not removing aflatoxin B1. In
this experiment, the Whatman filters removed all NSB, producing a good curve. However,
the recoveries for the 20ng/g spike are only 69% and the the aflatoxin was completely lost
for the 10ng/g spike. The protocol for peanuts described in the protocol for the Easi-extact
columns had recommended a methanol extraction. Therefore, the experiment was repeated
replacing the 60% (v/v) acetonitrile/water with 80% (v/v) methanol/water.
The recoveries, however, in this experiment were reading too high. The 20ng/g spike was
off the scale, the 10ng/g spike had an apparent recovery of 190%, while the 2ng/g spike had
an apparent recovery of 400%. The reasons for this are not known. In order for the assay
to be as comparable as possible, all samples and calibrants should be treated in exactly the
same manner. One difference between the samples and the calibrants is that all the sample
is put through the filters, but the calibrants are only spiked after filtering. The next
experiment, therefore, was to spike the blank sample before filtering. Two experiments
were carried out. The first had peanut samples spiked at 10ng/g, and second experiment
had samples spiked at 10, 5 and 2ng/g.
The first experiment, with a spiked sample of 10ng/g, had a recovery of 74%, which is an
improvement on previous experiments. The recoveries for the 10ng/g spike in the second
experiment were again approximately 70% and the 5ng/g spike had a recovery of 106%.
However the 2ng/g spike had the disappointing recovery of 31%. This would suggest that
the sensitivity of the curve is at 5ng/g. This is not sensitive enough as this assay has to
have a limit of detection less than 2ng/g because the regulatory limits are at this level. The
sensitivity of the assay had to be improved. To improve the sensitivity of an assay the
conditions of the experiment can be altered by changing the percentage antibody fraction
and the injection time. Previously the sensitivity of the assay had been optimized in an
HBS buffer system, and the optimal conditions were an antibody fraction of 30% and an
injection time of 8 minutes. However, a calibration curve in buffer will often be different
than that produced using sample extract. A sample after extraction will frequently have
87
some components present that will contribute to some level of matrix effect. Therefore, it
is better to create a calibration curve using standards of the sample matrix, which would
then account for any matrix effect there is in the sample. In this case the matrix is peanut,
and the standard samples were produced by following the same extraction procedure for
that of the samples. This is described in 2.3.5d.
This experiment was therefore repeated using peanut extract. The previous assay
conditions had been an antibody fraction of 30% and an injection time of 8 minutes. To
improve the sensitivity other conditions were carried out (30% antibody fraction, 10 minute
injection time; 30% antibody fraction, 8 minute injection time; 20% antibody fraction, 10
minute injection time; 10% antibody fraction, 8 minute injection time; 10% antibody
fraction, 10 minute injection time). The results are shown in Figure 4.5.
The optimization experiment showed that the most sensitive curve, still maintaining a good
range, was an antibody fraction of 20% and an injection of 10 minutes. The more sensitive
a curve is, the lower the midpoint will be. This is shown in figure 4.5., where there was the
largest drop between 0.0 and 0.1ng/g for these conditions compared to the others showing
the most sensitivity at this point in the calibration curve.

88
Figure 4.5 Optimisation of the aflatoxin B1 assay in peanuts.
To improve the sensitivity of the assay, different antibody injection times and percentage
fractions were compared using a calibration curve constructed using blank peanut
sample.
100
200
300
400
500
600
700
0 0.2 0.4 0.6 0.8 1 1.2 1.4 1.6 1.8 2
Aflatoxins in peanuts: sensitivity optimisation (expt 070705aft)
Ab 30%, injection 8 min
Ab 30%, injection 10 min
Ab 20%, injection 8 min
Ab 20%, injection 10 min
Ab 10%, injection 8 min
Ab 10%, injection 10 min
Aflatoxin Concentration
(ng/ml)
Res
ponse
(RU
)
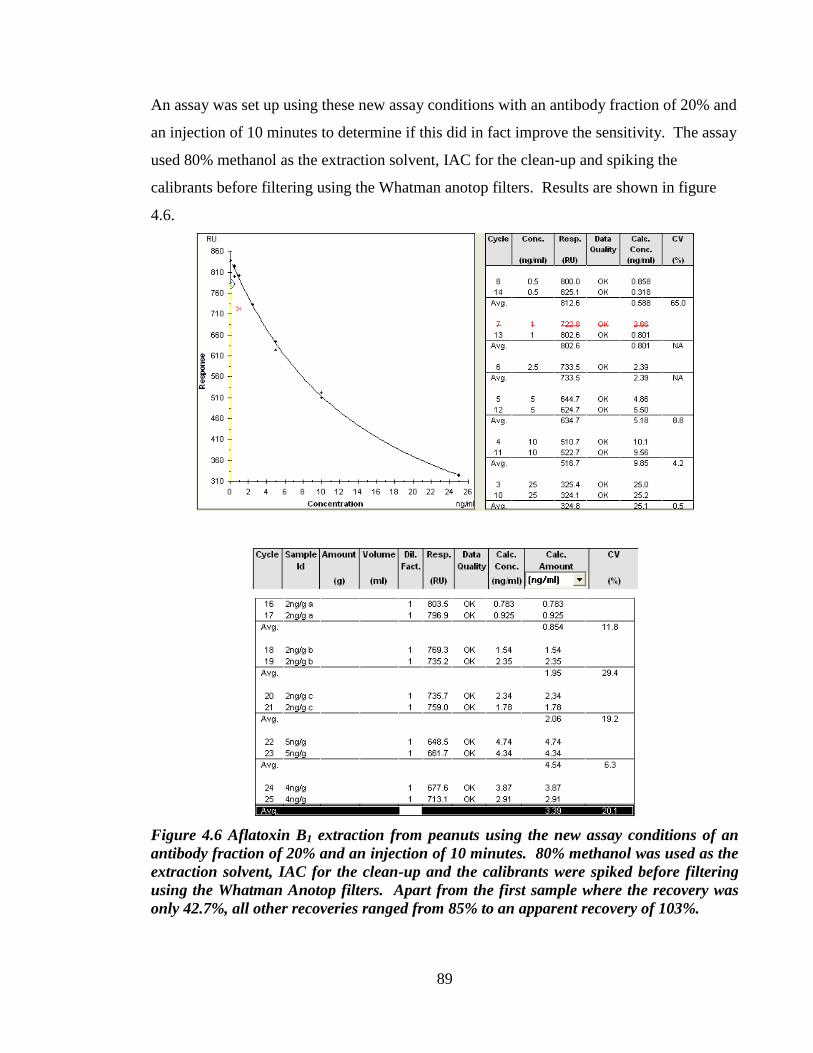
89
An assay was set up using these new assay conditions with an antibody fraction of 20% and
an injection of 10 minutes to determine if this did in fact improve the sensitivity. The assay
used 80% methanol as the extraction solvent, IAC for the clean-up and spiking the
calibrants before filtering using the Whatman anotop filters. Results are shown in figure
4.6.
Figure 4.6 Aflatoxin B1 extraction from peanuts using the new assay conditions of an
antibody fraction of 20% and an injection of 10 minutes. 80% methanol was used as the
extraction solvent, IAC for the clean-up and the calibrants were spiked before filtering
using the Whatman Anotop filters. Apart from the first sample where the recovery was
only 42.7%, all other recoveries ranged from 85% to an apparent recovery of 103%.
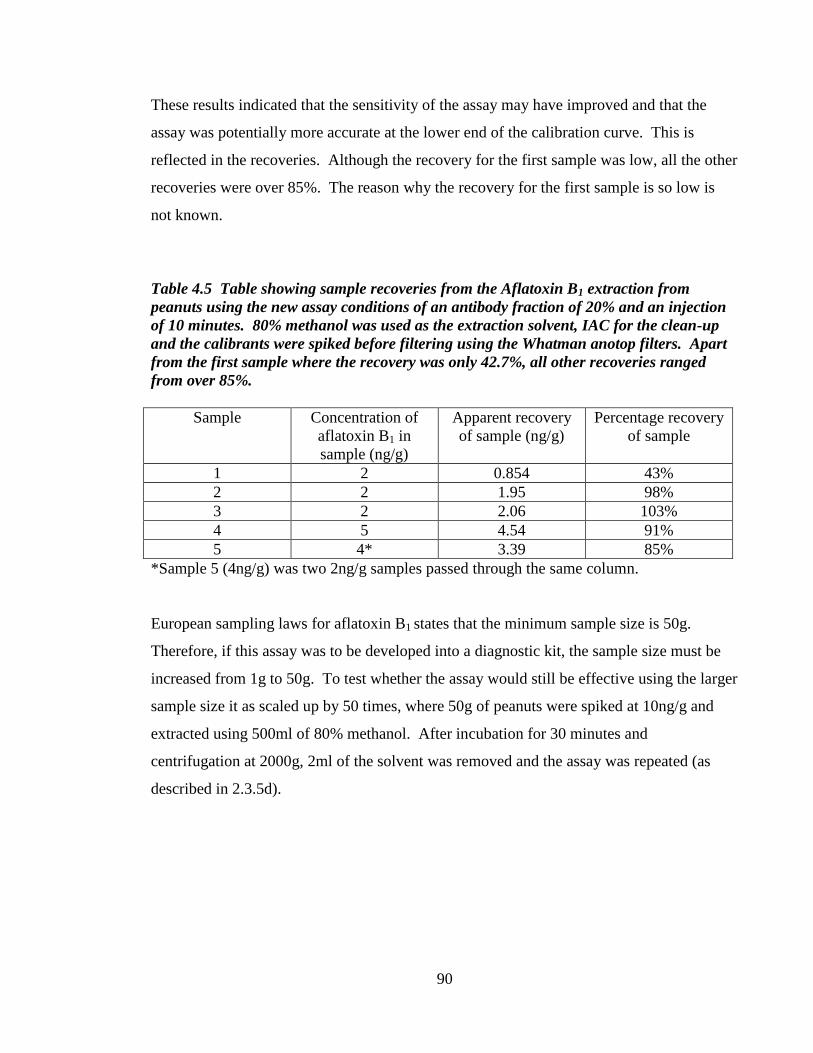
90
These results indicated that the sensitivity of the assay may have improved and that the
assay was potentially more accurate at the lower end of the calibration curve. This is
reflected in the recoveries. Although the recovery for the first sample was low, all the other
recoveries were over 85%. The reason why the recovery for the first sample is so low is
not known.
Table 4.5 Table showing sample recoveries from the Aflatoxin B1 extraction from
peanuts using the new assay conditions of an antibody fraction of 20% and an injection
of 10 minutes. 80% methanol was used as the extraction solvent, IAC for the clean-up
and the calibrants were spiked before filtering using the Whatman anotop filters. Apart
from the first sample where the recovery was only 42.7%, all other recoveries ranged
from over 85%.
Sample Concentration of
aflatoxin B1 in
sample (ng/g)
Apparent recovery
of sample (ng/g)
Percentage recovery
of sample
1 2 0.854 43%
2 2 1.95 98%
3 2 2.06 103%
4 5 4.54 91%
5 4* 3.39 85%
*Sample 5 (4ng/g) was two 2ng/g samples passed through the same column.
European sampling laws for aflatoxin B1 states that the minimum sample size is 50g.
Therefore, if this assay was to be developed into a diagnostic kit, the sample size must be
increased from 1g to 50g. To test whether the assay would still be effective using the larger
sample size it as scaled up by 50 times, where 50g of peanuts were spiked at 10ng/g and
extracted using 500ml of 80% methanol. After incubation for 30 minutes and
centrifugation at 2000g, 2ml of the solvent was removed and the assay was repeated (as
described in 2.3.5d).

91
Figure 4.7 Aflatoxin B1 extraction from peanuts using an increased sample size of 50g.
80% methanol was used as the extraction solvent, IAC for the clean-up and the
calibrants were spiked before filtering using the Whatman anotop filters.
The results of the experiment using the increased sample size of 50g were promising. The
apparent recoveries of the samples spiked with 2ng/g of aflatoxin B1 were 1.76 and 1.91ng,
which are 88% and 96%, respectively (Figure 4.7). However, the percentage coefficient t
of variation between some of the points in the calibration curve were high (53.3 for the
0.5ng spike). Ideally these should be below 10. The reason for this was because the
trendplot of the baseline had risen over the course of the experiment (figure 4.8). The
baseline trendplot records the response after the regeneration solution has passed over the
surface.
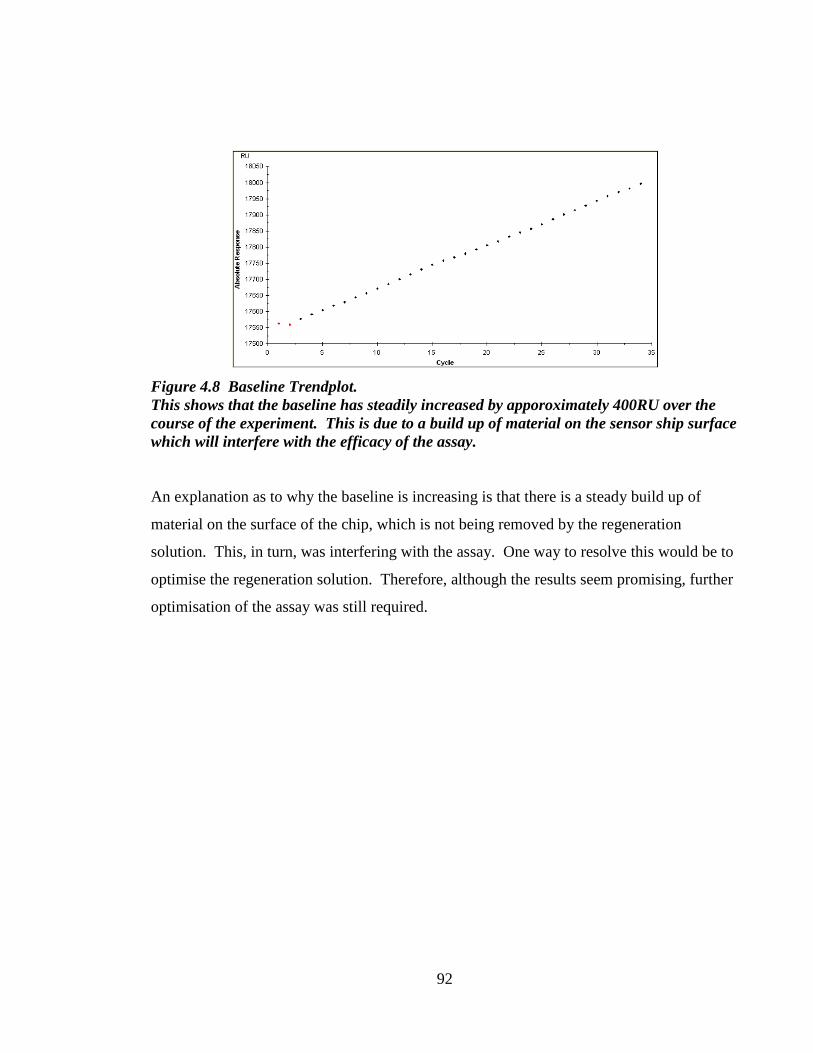
92
Figure 4.8 Baseline Trendplot.
This shows that the baseline has steadily increased by apporoximately 400RU over the
course of the experiment. This is due to a build up of material on the sensor ship surface
which will interfere with the efficacy of the assay.
An explanation as to why the baseline is increasing is that there is a steady build up of
material on the surface of the chip, which is not being removed by the regeneration
solution. This, in turn, was interfering with the assay. One way to resolve this would be to
optimise the regeneration solution. Therefore, although the results seem promising, further
optimisation of the assay was still required.

Chapter 5:
Discussion
and
Conclusions
5.1 Aflatoxin B1 Detection and Quantification
Aflatoxin B1 is a mycotoxin, a toxic secondary metabolite produced from the toxigenic
filamentous fungi Aspergillus flavus and Aspergillus parasciticus. Aflatoxin B1 is
produced in hot and humid tropical conditions and is known to contaminate a wide range of
crops, including nuts (peanuts, almonds, pistachio, walnuts and brazil nuts), cereals (maize,
wheat, rice, oats, sorgam) and spices (chilli, black pepper, turmeric, ginger).
Aflatoxin B1 is highly toxic and primarily targets the liver and has a positive association
with human hepatocellular carcinoma. Aflatoxin B1 contamination can occur at anytime
throughout the farming process, including storage and transportation, which makes
aflatoxin contamination a worldwide problem. Therefore, approximately 100 countries
have imposed regulatory limits for aflatoxin B1 in order to limit exposure. The limits that
have been set for aflatoxin B1 are low, primarily due its possible carcinogenic effects. The
lowest regulations that have been set are to protect the most susceptible to aflatoxin B1
toxicity, and these are for infant formula, which was set by the EU in 2006 at 0.05ng/g.
The imposture of strict regulatory limits for aflatoxin B1 has necessitated the development
of reliable, sensitive analytical methods to detect and quantify aflatoxin B1. Several official
regulatory organisations, for example Association of Official Analytical Chemists (AOAC),
the International Union of Pure and Applied Chemistry (IUPAC), International
Organisation for Standardisation (ISO), and its European counterpart, the European
Committee for Standardisation (CEN), have validated numerous methods. Many of these
methods use a chromatographic technique, such as gas chromatography (GC), high-
performance liquid chromatography (HPLC), liquid chromatography with mass
spectrometry (LC-MS) or tandem mass spectrometry (LC-MS/MS). Although these
methods are sensitive enough to detect aflatoxin B1 to the regulatory limits, they are not
without disadvantages. All use large quantities of hazardous solvents and require skilled
training to execute. They are also time consuming and labour intensive, and are therefore
not suitable for testing large numbers of samples. They are also very expensive.

95
These disadvantages have necessitated the development of new diagnostic techniques for
aflatoxin B1. The assays must be reliable, simple to use and sensitive enough to detect to
the lowest regulatory limits. They have to be sufficiently robust to use on the many
different types of food affected by aflatoxin B1, have a high-throughput capacity, be able to
test many samples quickly and accurately, and they must also be cost effective.
The purpose of this study was to develop a diagnostic kit for aflatoxin B1 using Surface
Plasmon Resonance (SPR). SPR is an innovative optical technique that measures
biomolecular interactions on the surface of a sensor chip. The biomolecular interactions are
between the analyte of interest (in this case aflatoxin B1) and its binding partner. In this
assay the binding partner is an antibody. The association and disassociation of aflatoxin B1
with its antibody can be followed in “real-time” on a graph called a sensorgram. Other
advantages of SPR are that it is label-free, it is high-throughput, its associated software is
windows-led and straightforward to use, it does not use large volumes of solvents and is
both accurate and sensitive.
5.2 Assay development and feasibility
To determine the feasibility of an assay several aspects have to be considered. The first
was the format of the assay. When the molecule to be tested is small (less than 312 Da), as
is the case for aflatoxin B1, the assay has to be an inhibition assay as the change in
resonance when the molecule binds to the surface would otherwise be negligible.
The second parameter was the efficacy of the chip surface. In an inhibition assay, the
analyte or a derivative of the analyte is immobilised onto the chip surface. The analyte or
derivative may not be orientated correctly (i.e. with its epitope easily accessible) on the

96
surface, and therefore the surface should be tested by performing an Rmax (section 3.3).
This is when antibody is passed across the surface in large excess. If the immobilisation is
successful, the response should be several thousand RU. In the case of the aflatoxin B1
assay, the most effective surface was with the aflatoxin B1-oxime-ethylenediamine
derivative immobilised.
Thirdly, the assay should work in a buffer system. Although the Rmax may indicate that
there is binding of the antibody to the surface, a standard curve has to be generated to
enable analyte quantification. A curve was produced for the aflatoxin B1 assay in an HBS-
EP buffer system using aflatoxin B1 standards (0, 0.5, 1.0, 2.5, 5.0 and 10ng/g of aflatoxin
B1).
Finally, the sensitivity of the antibody is extremely important. Regulatory limits for
aflatoxin B1 have been set as low as 0.05 ng/g. These limits were set by the EU for infant
formula. For the assay to be feasible the antibody must be sensitive enough to detect
aflatoxin B1 to these levels. Several antibodies were evaluated for this assay. The most
sensitive was found to be the Fab antibody, G6.
5.3 Aflatoxin B1 assay with compound feed (IRMM Reference Material) as
the sample matrix
The first matrix that was investigated was compound feed as it could be bought as a
certified reference material from Sigma Aldridge. Two samples were purchased, one that
had been certified to contain no aflatoxin B1 (blank) and another containing 9.3ng/g
aflatoxin B1.
A simple methanol extraction was first attempted. There was, however, too much
interference from the sample matrix and a calibration curve using blank extracted sample
could not be generated. To remove the interference, a solid phase extraction column,
“Mycosep” from Romer Laboratories was used in the sample clean-up. Unfortunately,
97
there was still non-specific binding of the matrix onto the chip surface, and a calibration
curve could not be produced.
The immunoaffinity columns “Easi-extract Aflatoxin” from R-Biopharm Rhone were then
evaluated. Their use reduced the interference and a calibration curve was generated. Also,
the recoveries for the certified compound feed sample were excellent. The compound feed
had been certified to contain 9.3ng/g aflatoxin B1. When read off the calibration curve the
compound feed appeared to contain 9.35ng/g. This was a recovery of 100.5%. The
experiment was repeated, and again the recoveries were excellent at 98%.
The major disadvantage of using immunoaffinty columns, however, is that they were very
expensive, especially since it was proven that they could not be re-used. Cheaper
“Aflatest” IAC columns, were therefore sourced from Vicam. However, their performance
was disappointing. Although the matrix effect was again removed, the recoveries were
poor at only 50%.
Overall, the preliminary assays using compound feed were promising. The feasibility of
the assay, extracting Aflatoxin B1 from a real sample, had been demonstrated. However,
there were problems with interferences from the matrix resulting in non-specific binding to
the Biacore chip surface. The most effective way of resolving this problem was to use
immunoaffinity columns. The use of these columns, however, would result in assay costs
that were potentially prohibitive.
5.4 Aflatoxin B1 assay with infant formula as the sample matrix
The next matrix chosen for investigation was infant formula. The lowest regulatory limits
for aflatoxin B1 in any food have been set for infant formula by the EU at 0.05ng/g. There
are no rapid methods on the market at present that are sufficiently sensitive to detect
aflatoxin B1 to these levels. This would be a unique selling point for the kit, and for this
reason infant formula was chosen as the matrix to investigate.
98
Simple extraction procedures were first examined. Unfortunately, as previously found with
compound feed, there were problems with matrix interference. Infant formula has a high
fat content, and it was perceived that it may be the fat that is binding to the surface of the
chip. A cyclohexane step was introduced to remove the fat from the sample. The non-
specific binding to the chip surface was removed and a calibration curve generated, but the
recoveries, however, were poor at approximately 10%. In addition, the aflatoxin B1 seemed
to be removed from the sample along with the fat.
Further attempts to reduce matrix interference were carried out by precipitating out
proteins. These too resulted in low recoveries.
Promising results had been achieved for compound feed using “Easi-extract aflatoxin”
immunoafinity columns. Therefore, these columns were utilised in the clean-up of the
assay for infant formula. Recoveries were satisfactory for samples spiked with aflatoxin B1
at 5ng/g (the average recovery was 78%). The recoveries of samples spiked at 1ng/g,
however, were erratic. This was because the sensitivity at this point of the curve was poor.
Unfortunately, with regulatory limits of 0.05ng/g for infant formula, the sensitivity of the
curve at this point must be better in order to detect and quantify accurately. However,
despite very significant efforts, it was not possible to achieve a calibration curve sensitive
enough to test for aflatoxin B1 in infant formula to the regulatory limits. The assay,
therefore, was obsolete, and it was decided to focus on a different matrix (or matrices) that
had regulatory limits for aflatoxin B1 within the performance characteristics of the assay.
5.5 Aflatoxin B1 assay with maize as the sample matrix
The infant formula and compound feed assays both had problems with matrix interference
binding to the surface of the chip. Unlike infant formula, maize does not have a high fat
content which was the possible cause of non-specific binding to the chip surface.
Compound feed is composed of up to 30 different ingredients, including vitamins, minerals,
fermentation products e.g. ash and antibiotics, which all could cause matrix effects. Maize
was chosen to investigate primarily because it was thought that it, out of all other matrices,
99
it might have the least problems with matrix effects. The reduction in matrix effects would
therefore negate the need for immunaffinity columns.
With maize the AOAC recommends a 55% (v/v) methanol/water extraction followed by a
hexane step and then a chloroform extraction. Again, however, matrix interferences gave
rise to a background that was too high. This matrix effect was still evident even after an
additional clean-up step using “Easi-extract aflatoxin” immunoaffinity columns. Maize is
composed of 62% starch, which could be the root cause of the matrix effect. Therefore, an
amylase treatment step was introduced to the method in an attempt to remove non-specific
binding. After amylase treatment, there was an 80% (v/v) methanol/water extraction
followed by clean-up using the “Easi-extract aflatoxin” immunoaffinity columns. This
additional step did reduce the background from 1760RU to 1280RU, but this is still
approximately double the background with buffer alone. In spite of this, a calibration curve
was still generated and the recovery for a 20ng/g aflatoxin B1 spiked sample was 111%.
The purpose of the immunoaffinity column was to remove all matrix from a sample
producing a pure and concentrated solution of aflatoxin B1. Unfortunately we found that in
the case of maize that some interference was still remaining in the sample that bound non-
specifically to the sensor chip surface. The assay was therefore problematic. There was
pressure to produce a marketable assay as quickly as possible and so a new matrix, peanuts,
was chosen to investigate.
5.6 Aflatoxin B1 assay with peanuts as the sample matrix
The final matrix examined in this study was peanuts. “Easi-extract aflatoxin”
immunoaffinity columns were used for sample clean-up to remove matrix interferences.
Two extraction methods were recommended by the immunoaffinity column kit, 80% (v/v)
methanol/water and 60% (v/v) acetonitrile/water. The methanol extraction still resulted in
a high degree of matrix non-specific binding. Although the background with the
acetonitrile extraction was reduced, the recoveries were poor at approximately 24%. There
was also a difference between the backgrounds of samples that had been filtered compared
100
to the backgrounds of unfiltered samples. An evaluation of six different filters was carried
out, first on their effectiveness on removing matrix effect and secondly on whether or not
any aflatoxin B1 was removed from the sample and sequestered by the filter. There were
huge differences between the filters. Some removed all matrix interferences , whilst others
only removed half (see table 4.5.1). Some of the filters also removed all of the aflatoxin
B1. The best performing filters were the Whatman Anotop filters, which removed all of the
non-specific binding but none of the aflatoxin B1.
The peanut assay was repeated using these filters. A methanol extraction was performed
before clean-up using immunoaffinity columns. Also, the calibrants were spiked before
extraction. Three different spiked samples were assessed. They were spiked at 10, 5 and
2ng/g. The recoveries were 70%, 106% and 31%, respectively. This would suggest that
the sensitivity of the calibration curve is at 5ng/g as the readings were most accurate around
this point. The regulatory limits set for aflatoxin B1 in peanuts is 2ng/g. Therefore the
assay was not sensitive enough.
The assay conditions were optimised to improve the sensitivity of the calibration curve.
The assay conditions were altered slightly, which greatly improved the recoveries of the
samples spiked at 2ng/g. Although the first sample had a recovery of only 43%, the other
two samples spiked at 2ng/g had recoveries of 98% and 103%. For all three samples, this
had an average recovery of 81%.
Sampling laws for aflatoxin B1 state that the minimum sample size is 50g. Keeping all
conditions the same, the assays were scaled up from 1g to 50g of peanuts. In this assay two
50g samples were spiked at 2ng/g. The recoveries were excellent at 88% and 96%.
5.7 Comparison of assay with current market leaders
The global market share for mycotoxin testing is estimated at approximately £75 –100
million, with rapid diagnostic methods accounting for 10 – 20% of this (Council for
Agricultural Science and Technology (CAST) report, 2003). This is a fairly new market

101
and, therefore, the average annual growth is high at 10%. Aflatoxins, and aflatoxin B1 in
particular, are the best known and studied mycotoxins and are proven to be the most
carcinogenic. Therefore, most mycotoxin diagnostic kits on the market are for aflatoxin B1
or total aflatoxins. They also have the most complete regulatory limits compared to other
mycotoxins.
There are, however, already a number of competitors on the market, but due to changing
legislation demanding increased testing and the ability to detect lower levels, this sector is
growing fast. There is, therefore, a niche in the market for high-throughput, automated
systems that is sensitive enough to meet the demands of the lowering regulatory limits.
Aflatoxin B1 testing generally falls into two groups. The first is analytical chromatographic
methods. These methods, such HPLC, TLC, HPLC/MS and GC/MS are reliable, sensitive
and quantitative. These conventional analytic methods, however, are time consuming,
labour intensive and require skilled training. They also require high consumption of
hazardous solvents, and, so, are often expensive. These tests would be too expensive and
time consuming to analysis large numbers of samples, but can be used as confirmatory
tests.
Table 5.1 Table showing analytical laboratory techniques for aflatoxin analysis and their
relative advantages and disadvantages Method Advantages Disadvantages
TLC - Simple
- Cheap
- Rapid
Separation may be
unsatisfactory
Poor precision
Needs confirmation
HPLC - Sensitive
- Selective
- Easy to automate
- Compounds may require
derivatisation
- Method requires skilled end-
user
- Expensive
HPLC/MS - Provides high level of confirmation
- Multi-analyte detection
- Very sensitive
- Expensive
- Specialist expertise required.
GC/MS - Very sensitive - Expensive
- Specialised expertise
required
- Compounds must be volatile.

102
The second type of aflatoxin B1 tests are antibody-based. These diagnostic tests, such as
ELISAs and lateral flow tests (“dipstick” tests), are now taking over the mycotoxin testing
market. They are commercially available in a kit form and are a simpler, quicker and
cheaper means to routinely monitor aflatoxin contamination. The main disadvantage of
immunological kits is that they are not quantitative and therefore the results may still
require confirmation by an analytical method, such as HPLC. Other disadvantages are
false positives or false negatives and they may have matrix interference problems.
There are currently a number of these kits on the market. The main market leaders are r-
Biopharm, Romer, Diffchamp, Neogen and Charm, who between them share 60 –70% of
the market share.
Romer (www.romerlabs.com)
Romer Labs is a world leader in the development of mycotoxin test kits. It has a wide and
comprehensive portfolio of different tests for aflatoxins, each designed for specific
analyses, depending on the number of samples to be analysed, the matrix or whether or not
it is to be quantitative of qualitative. All assays are both AOAC and USDA/GIPSA
approved. They currently have four kits on the market that test for aflatoxins.
i) AgraQuant ELISA kits for total aflatoxin
This kit tests for total aflatoxins in grain, nuts, cottonseeds, cereals and other commodities
such as animal feeds. It has two quantitation ranges, 1-20ppb and 4-40ppb (with limits of
detection 1 and 3ppb, respectively).
ii) FluoroQuant Total Aflatoxin test kit
FluoroQuant is a rapid, quantitative fluorometric test kit for total aflatoxin specially
formulated for the needs of the grain industry. It has a limit of detection of 1ppb and can be
used to test corn, wheat, soybeans, raw peanuts, rice and cottonseed.

103
iii) AflaCup Kit for total aflatoxins
AflaCup is a test designed for single sample testing. It has detection level of 10ppb, but is a
qualitative test, giving only yes/no answers.
iv) AgriStrip lateral flow kit
This a one step lateral flow immunochromatographic assay to determine the presence of
aflatoxins B1, B2, G1 and G2. The strips are designed for in-situ testing at grain elevators
and peanut buying points. The strips have cut off levels at 4, 10 and 20 ppb. Again, this
is a qualitative test, giving only yes/no answers. The test involves comparison by eye, so
results would be somewhat open to interpretation.
Charm (www.charm.com)
Charm Sciences have recently achieved approval from the USDA/GIPSA for their aflatoxin
test. No other test has ever received approval for such a comprehensive list of
commodities. These are corn, corn flour, corn germ meal, corn gluten meal, corn meal,
corn screenings, corn soy blend, cracked corn, distillers dried grains, flaking corn grits,
milled rice, popcorn, rough rice, sorghum, soybeans and wheat. The procedure includes a
sample extraction and a ten minute incubation with a test strip. The strip is then inserted
into a reader, which then displays and records the reading. The limit of detection is 2ppb,
and the range is 0-100ppb.
R-Biopharm Rhone (www.r-biopharm.com)
In addition to marketing several IAC for aflatoxin sample clean-up, R-Biopharm Rhone
also produce kits for aflatoxin detection and/or quantification. They currently have two
ELISAs on the market to test for aflatoxins.

104
i) AflaPlate
This is a quantitative ELISA for the analysis of aflatoxin B1. It has a limits of detection of
1ppb and the test matrices include maize, nuts and animal feed.
ii) Aflacard B1 and Aflacard total
These are qualititative screening cards for the detection of either aflatoxin B1 or total
aflatoxins, working in the same was as a lateral flow immunoassay. They have a detection
limit of 2ppb and gives a yes/no answer by way of a colour change, and, so, the results are
open to interpretation.
Diffchamp
Diffchamp also has an ELISA on the market that tests for and quatifies aflatoxin B1. It tests
matrices such as cerals, peanuts, maize, wheat, nuts, figs, spices, tea, cocoa and animal
feeds. It has the lowest detection limit on the market of 0.5ppb and the test can also be
automated using the transia Elisamatic II.
The number of competitors is high, but there is still a niche in the market that necessitates
the development of this assay using the Biacore SPR system. The main selling point
Xenosense has for this kit is product innovation, and it will be the only kit on the market
that is fully automated. This will allow analysis of large numbers of samples and in a short
time. The hope is that the final assay will be more reliable and robust than other
quantitative techniques, with little inter or intra laboratory variation in results due to the
reduction in operator handling of samples.
Aflatoxin assays have been developed on other analysers, harnessing different technologies,
for example optical waveguide lightmode spectropscopy (Adanyi et al., 2007), sol particle
immunoassay (Brenn-Struckhofova et al., 2007), fluorescence polarisation (Nasir et al.,

105
2002), affinity electrochemistry (Mascini et al., 2001), fluid based-bioaerosols and surface
plasmon resonance (SPR) (Daly et al., 2000; Maragos et al., 2002; Dunne et al., 2005).
However, only Biacore has the capability of producing and manufacturing commercial kits
for the assay. Thirteen kits are presently on the market that test for either vitamins or drug
residues using the Biacore system. Xenosense, with its current repertoire of kits, therefore,
has a strong customer base, and some of these customers have also expressed an interest in
the Aflatoxin B1 kit. Customers include industrial end users in the food industry, such as
Nestle, Fonterra and Wyeth Nutrition; and regulatory end users, e.g. Livmedelsverket
(Sweden), Department of Livestock Development (Thailand), Central Sciences
Laboratories (UK) and Teagasc (Ireland). These customers will have already bought the
biosensors to use with either vitamin or drug residue kits.
5.8 Conclusions
The purpose of this study was to develop such an assay that combines the use of innovative
technologies of surface plasmon resonance and recombinant antibody manipulation. The
hope was to develop a user friendly assay that could be marketed as a kit for use on the
BiacoreTM Q biosensor.
Four different types of food matrix where investigated – compound feed (IRMM certified
material), infant formula, maize and peanuts. The first material investigated, compound
feed, proved that the assay was feasible in this matrix. The certified reference material
used in the assay had recoveries of over 98%.
The infant formula assay was disappointing. The regulatory limits for infant formula are
the lowest limits that have been set for aflatoxin B1 and were set by the EU at 0.05ng/g. At
present there are no rapid tests on the market that can detect aflatoxin B1 to these levels.
This would be the unique selling point of this kit. Unfortunately, the assay was not
sensitive enough to detect and quantify aflatoxin B1 to 0.05ng/g.

106
The third matrix examined was maize. This assay proved problematic due to matrix
interference. There was non-specific binding of the maize matrix to the chip surface
despite the use of immunoaffinity columns.
The most promising matrix investigated was peanuts. Recoveries of over 80% were
achieved even when the whole process was scaled up to test aflatoxin B1 in sample sizes of
50g. However, further optimisation of the aflatoxin B1 assay in peanuts was still required.
The trendplot for the baseline showed there was a steady increase as the assay progressed.
This is indicative of build-up on the chip surface showing that the regeneration stage is not
stringent enough. Addition research into different regeneration solutions and regeneration
injection times is required before going to the validation stage.
The assay has two major disadvantages. The disadvantages are the labourious extraction
process and the reliance on immunoaffinity columns. Simple extraction procedures were
attempted, but all four foodstuffs in this study had problems with matrix effect causing non-
specific binding to the chip surface. This resulted in backgrounds so high that either the
required calibration curves could not be generated or the true recoveries were masked.
Immunoaffinity columns are extremely expensive and cannot be re-used. Although the use
of the columns could be recommended along with the kit they would cause the price per
analysis to become too high and I found that despite the use of the columns the extraction
procedure was still very time consuming. This would defeat two of the fundamental goals
of the kit, i.e. that it should be more cost effective and it should be high-throughput. The
only solution to this problem may be to improve the chip surface. This, however, would
require the investigation to start again at the feasibility stage. Unfortunately, this was
beyond the scope of this project. The reason for this was that, unfortunately, due to the
economic downturn, Xenosense Ltd. ceased operating. Xenosense had been bought over
by Biacore, which, in turn had been purchased by GE Healthcare. Global loses by GE
Healthcare necessitated closures of many departments, including Xenosense.
Overall, however, this study has shown that an aflatoxin B1 assay is possible using a
Biacore Q biosensor. Two matrices have shown great promise – peanuts and compound

107
feed. Although some areas of the assay need further optimisation, namely the improvement
of the chip surface and the development of a simpler extraction process, the investigation so
far has proved feasibility. Following optimisation, the next stages of the research would be
validation of the assay.

Chapter 6:
Bibliography
108
Adanyi, N., Levkovets, I. A., Rodriguez-Gil, S., Ronald, A., Varadi, M., Szendro, I.
(2007), Development of immunosensor based on OWLS technique for determining
Aflatoxin B1 and Ochratoxin A, Biosensors and Bioelectronics, 22, 797-802.
Aguilar F., Hussain S.P., Cerutti P. (1993), Aflatoxin B1 induces the transversion of G-
-T in codon 249 of the p53 tumor suppressor gene in human hepatocytes, Proceedings
of the National Academy of Sciences of the United States of America, 90, 8586-8590.
Appleton B. S., Campbell T. C. (1983), Effect of high and low dietary protein on the
dosing and postdosing periods of aflatoxin B1-induced hepatic preneoplastic lesion
development in the rat, Cancer Research, 43(5), 2150-2154.
Arndt K. M., Muller K. M., Pluckthun, A. (2001), Helix-stabilized Fv (hsFv) antibody
fragments: substituting the constant domains of a Fab fragment for a heterodimeric
coiled-coil domain, Journal of Molecular Biology, 312, 221–228.
Badea M., Micheli L., Messia M. C., Candigliota Y., Marconi E., Mottram T., Velasco-
Garcia M., Moscone D., Palleschi, G. (2004), Aflatoxin M1 determination in raw milk
using a flow-injection immunoassay system, Analytica Chimica Acta, 520, 141-148.
Battacone G., Nudda A., Cannas A., Cappio Borlino A., Bomboi G., Pulina G. (2003),
Excretion of aflatoxin M1 of dairy ewes treated with different doses of aflatoxin B1,
Journal of Dairy Sciences, 86, 2667-2675.
Bedard L.L., Alessi, M., Dacey, S., Massey T.E. (2005), Susceptibility to aflatoxin B1-
induced carcinogenesis correlates with tissue-specific differences in DNA repair activity
in mouse and in rat, Cancer Research, 65, 1265-1270.
Bedard L.L., Massey T.E. (2006), Aflatoxin B1-induced DNA damage and its repair,
Cancer Letters, 241(2),174-83.
Benedetti S., Iametti S., Bonomi F., Mannino S. (2005), Head space sensor array for
the detection of aflatoxin M1 in raw ewe's milk, Journal of Food Protection, 68(5),
1089-1092
Bennett W.J., Klich M. (2003), Mycotoxins, Clinical Microbiological Reviews, 16(3),
497-516.
Biancardi A., Gasparini M., Dall'asta C., Marchelli R. (2005), A rapid multiresidual
determination of type A and type B trichothecenes in wheat flour by HPLC-ESI-MS,
Food Additives and Contaminants, 22(3), 251-258.
Bintvihok A., Thiengnin S., Doi K., Kumagai S. (2002), Residues of aflatoxins in the
liver, muscle and eggs of domestic fowl, The Journal of Veterinary Medical Science,
64(11), 1037-1039.
Biselli S., Hummert, C. (2005), Development of a multicomponent method for
Fusarium toxins using LC-MS/MS and its application during a survey for the content of
T-2 toxin and deoxynivalenol in various feed and food samples, Food Additives and
Contaminants, 22(8), 752-760.

109
Blesa J., Soriano J.M., Molto J.C., Marin R., Manes J. (2003), Determination of
aflatoxins in peanuts by matrix solid-phase dispersion and liquid chromatography,
Journal of Chromatography A, 1011, 49-54.
Blesa J., Soriano J.M., Molto J.C., Marin R., Manes J. (2004), Limited survey for the
presence of aflatoxins in foods from local markets and supermarkets in Valencia, Spain,
Food Additives and Contaminants, 21(2), 165-171.
Brammler T. K., Slone D. H., Eaton D. L. (2000), Effects of diet
ary oltipraz and ethoxyquin on aflatoxin B1 biotransformaton in non-human primates,
Toxicological Sciences, 54, 30-41.
Brenn-Struckhofova, Z., Cichna-Mark M., Bohm C., Razzazi-Fazeli E. (2007),
Selective sample cleanup by reusable Sol-Gel immunoaffinity columns for
determination of deoxynivalenol in food and feed samples, Analytical Chemistry, 79,
710-717.
Bucio-Villalobos C.M., Guzan-de-pena D., Pena-Cabriales J. (2001), Aflatoxin
synthesis in corn fields in Guanajuato, Mexico, Revista Iberoamericana de Micología
18, 83-87.
Cardona T.D., Ilangantilek S.G., Noomhorm A. (2000) Aflatoxin research on grain in
Asia - its problems and possible solutions. Mycotoxin prevention and control in
foodgrains, a collaborative publication of the UNDP/FAO Regional Network Inter-
Country Cooperation on Preharvest Technology and Quality Control of Foodgrains
(REGNET) and the ASEAN Grain Postharvest Programme, FAO corporate document
repository http://www.fao.org/docrep/x5036e/x5036E00.htm
CAST Report, (2003), Mycotoxins: Risks in Plant, Animal, and Human Systems,
Richard, J.L., Payne, G.A. (eds.). ISBN 1-887383-22-0.
Castegnaro M., Tozlovanu M., Wild C., Molinie A., Sylla A., Pfohl-Leszkowicz
(2006), Advantages and drawbacks of immunoaffinity columns in the analysis of
mycotoxins in food, Molecular Nutrition and Food Research 50(6), 480-487.
Cavaliere C., Foglia P., Guarino C., Marzioni F., Nazzari M., Samperi R. (2006),
Liquid chromatography/ tandem mass spectrometric confirmatory method for
determining aflatoxin M1 in cows milk. Comparison between electrospray and
atmospheric pressure photoionization sources, Journal of Chromatography A, 1101, 69-
78.
Celik I., Oguz H., Demet O., Donmez H. H., Boydak, M., Sur, E. 2000, Efficacy of
polyvinylpolypyrrolidone in reducing the immunotoxicity of aflatoxin in growing
broilers, British Poultry Science, 41, 430-439.
110
Conroy P.J., Hearty S., Leonard P., O‟Kennedy R.J., (2009), Antibody production,
design and use for biosensor-based applications, Seminars in Cell and Developmental
Biology, 20, 10-26.
Coulombe R.A. (1993), Biological Action of Mycotoxins, Journal of Dairy Science, 76,
880-891.
Creppy E.E. (2002), Update of survey, regulation and toxic effects of mycotoxins in
Europe, Toxicology Letters, 127, 19-28.
Crews H., Alink., Andersen R., Braesco V., Holst B., Maiani G., Ovesen L., Scotter
M., Solfrizzo M., Van der berg R., Verhagen H., Williamson G. (2001), Production and
analytical applications of scFv antibody fragments, British Journal of Nutrition, 86(1),
S5-S35.
Daly S.J., Dillon P.P., Manning B.M., Dunne L., Killard A, O'Kennedy R. (2001),
Production and analytical applications of scFv antibody fragments, Analytical Letters
34(11), 1799-1827.
Daly S.J., Dillon P.P., Manning B.M., Dunne L., Killard A, O'Kennedy R. (2002),
Production and characterisation of murine single chain Fv antibodies to aflatoxin B1
derived from a pre-immunised antibody phage display library system, Food and
Agricultural Immunology, 14, 255-274.
Daly S.J., Keating G.J., Dillon P.P., Manning B.M., O'Kennedy R., Lee H.A., Morgan
M.R.A. (2000), Development of surface plasmon resonance-based immunoassay for
Aflatoxin B1, Journal of Agricultural and Food Chemistry, 48(11), 5097-5104.
Desai M. R., Ghosh S.K. (2003), Occupational exposure to airborne fungi among rice
mill workers with special reference to aflatoxin-producing A. flavus strains, Annals of
Agricultural and Environmental Medicine 10, 159-162
Diamond D., Principles of chemical and biological sensors. Wiley-interscience
publication, 1999.
Diaz D., The Mycotoxin Blue Book. Nottingham University Press, 2005.
Diaz S., Moreno M.A., Dominguez L., Suarez G., Blanco J.L. (1993), Application of a
diphasic dialysis technique to the extraction of aflatoxins in dairy products, Journal of
Dairy Science, 76, 1845-1849.
Domijan A-M., Peraica M., Cvjetkovic B., Turicin S., Jurjevic Z., Ivic D. (2005),
Mould contamination and co-occurrence of mycotoxins in maize grain in Croatia, Acta
Pharmacologica Sinica, 55, 349-356.
Dominguez L., Blanco J.L., Gomez-Lucia E., Rodriguez E.F., Suarez G. (1987),
Determination of aflatoxin M1 in milk and milk products contaminated at low levels,
Journal of the Association of the Official Analytical Chemists, 70(3), 470 472.
Donnelly P. J., Stewart R. K., Ali S. L., Conlan A. A., Reid,
111
K. R., Petsikas D., Massey T. E. (1996), Biotransformation of aflatoxin B1 in human
lung, Carcinogenesis, 17(11), 2487-2494.
Dunne C., Meany M., Smyth M. (1993), Multimycotoxin detection and clean-up
methods for aflatoxins, ochratoxin and zearlenone in animal feed ingredients using
high-performance liquid chromatography and gel permeation chromatography, Journal
of Chromatography A, 629(2), 229-235.
Dunne L., Daly S., Baxter A., Haughey S., O‟Kennedy R. (2005), Surface Plasmon
Resonance-Based immunoassay for the detection of aflatoxin B1 using single-chain
antibody fragments, Spectroscopy Letters, 38(3), 229-245.
Egner P. A., Wang J-B., Zhu Y-R., Zhang B-C., Wu, Y., Zhang Q-N., Qian G-S.,
Kuang S-Y., Gange S. J., Jacobson, L. P., Helzlsouer K. L., Bailey, G.S. Groopman, J.
D., Kensler T. W. (2001), Chlorophylin intervention reduces aflatoxin -DNA adducts in
individuals at high risk for liver cancer, Proceedings of the National Academy of
Sciences (USA), 98(25), 14601-14606.
Ehrlich K. C., Montalbano B .G., Cotty P. J. (2005), Divergent regulation of aflatoxin
production at acidic pH by two Aspergillus strains, Mycopathologia 159, 579-581.
Essigmann J.M., Croy R.G., Bennett R.A., Wogan G.N. (1982), Metabolic activation
of aflatoxin B1: patterns of DNA adduct formation, removal, and excretion in relation to
carcinogenesis, Drug Metabolism Reviews, 13(4), 581-602
Etzel R.A. (2002), Mycotoxins. Journal of American Medical Association, 287(4),
425-427.
FAO Corporate Document Repository (2004), Worldwide regulations for mycotoxins
in food and feed in 2003, www.fao.org/docrep/007/y5499e/y5499e00.htm
Fernandez P.V., Partriarca A., Locani O., Vaamonde G. (2001), Natural co-occurrence
of aflatoxin and cyclopiazonic acid in peanuts grown in Argentina. Food Additives and
Contaminants, 18(11), 1017-1020.
Gathumbi J. K., Uslerber E., Ngatia T. A., Kangethe E. K., Martbauer E. (2003),
Application of immunoaffinty chromatography and enzyme immunoassay in rapid
detection of aflatoxin B1 in chicken liver tissues, Poultry Science, 82, 585-90
Gong Y., Hounsa A, Egal S., Turner P.C., Sutcliffe A.E., Hall A.J., Cardwell K., Wild
C.P. (2004), Postweaning exposure to aflatoxin results in impaired child growth: a
longitudinal study in Benin, West Africa., Environmental Health Perspectives, 112(13),
1334.
Gong Y.Y., Cardwell K., Hounsa A., Egal S., Turner P.C., Hall A.J., Wild C.P. (2002),
Dietary aflatoxin exposure and impaired growth in young children from Benin and
Toga: cross sectional study, British Medical Journal, 325, 20-21.
112
Gratz S., Mykkanen H., Ouwehand A.C., Juvonen R., Salminen, S. El-Nezami H.
(2004), Intestinal mucus alters the ability of probiotic bacteria to bind aflatoxin B1 in
vitro, Applied and Environmental Microbiology, 70(10), 6306-6308
Groopman J.D., Wang J.S., Scholl P. (1996), Molecular biomarkers for aflatoxins:
from adducts to gene mutations to human liver cancer. Canadian Journal of Physiology
and Pharmacology, 74, 203-209
Guo Y., Breeden L. L., Zarbyl H., Preston B. D., Eaton D. L. (2005), Expression of a
human cytochrome P450 in yeast permits analysis of pathways for response to and
repair of aflatoxin-induced DNA damage, Molecular and Cellular Biology, 25(14),
5823-5833.
Hage D. S. (1999), Affinity chromatography A review of clinical applications, Clinical
Chemistry, 45(5), 593-615.
Haskard C.A., El-Nezami H.S., Kankaanpaa P.E., Salminen S., Ahokas J.T. (2001),
Surface binding of aflatoxin B1 by lactic acid bacteria. Applied Environmental
Microbiology, 128(2), 3086-3091.
Henke S. E., Gallardo,V. C., Martinez, B., Balley, R. (2001), Survey of aflatoxin
concentrations in wild bird seed purchased in Texas, Journal of Wild Diseases, 37(4),
831-835.
Hoogenboom H.R., de Bruine A.P., Hufton S.E., Hoet R.M., Arends J.W., Roovers
R.C. (1998), Antibody phage display technology and its applications,
Immunotechnology, 4, 1-20.
Hoogenboom H.R., (2005), Selecting and screening recombinant antibody libraries.
Nature Biotechnology, 23, 1105–1116.
Horn B.W., Dorner J.W. (1999), Regional Differences in production of aflatoxin and
cyclopiazonic acid by soil isolates of Aspergillis flavus along a transect within the
United States, Applied and Environmental Microbiology, 65(4), 1444-1449.
Huang Y-Y., Hsu H-Y., Huang C-J C., (2007) A protein detection technique by using
surface plasmon resonance (SPR) with rolling circle amplification (RCA) and nanogold-
modified tags, Biosensors and Bioelectronics, 22, 980–985
Huff W.E., Doerr J.A., Wabeck C.J., Chaloupka G.W., May J.D., Merkley J.W. (1984),
The individual and combined effects of aflatoxin and ochratoxin A on various
processing parameters of broiler chickens, Poultry Sciences, 63(11), 2153-2161.
Huff W.E., Kubena L.F., Harvey R.B., Hagler W.M. Jr, Swanson S.P., Phillips T.D.,
Creger C.R. (1986), Individual and combined effects of aflatoxin and deoxynivalenol
(DON, vomitoxin) in broiler chickens, Poultry Sciences, 65(7), 1291-1298.
Ip S-P., Che C-T., (2006), Determination of aflatoxins in Chinese medicinal herbs by
high-performance liquid chromatography using immunoaffinty column clean-up
improvement of recovery, Journal of Chromatography A, 1135, 241-244.
113
Jodlbauer J., Maier N.M., Linder W. (2002), Towards ochratoxin A selective
molecularly imprinted polymers for solid-phase extraction, Journal of Chromatography
A, 945(1-2), 45-63.
Karaca H., Nas, S. (2006), Aflatoxins, patulin and ergosterol contents of dried figs in
Turkey, Food Additives and Contaminants, 23(5), 502-508.
Karaman M., Basmacioglu H., Ortatatli M., Oguz H. (2005), Evaluation of the
detoxifying effect of yeast glucomannan on aflatoxicosis in broilers as assessed by gross
examination and histopathology, British Poultry Science, 46(3), 394-400.
Keating G.J., Quinn J.G. O'Kennedy R. (1999), Immunoassay for the determination of
7-hydroxycoumarin in serum using 'real-time' biosensor analysis, Analytical Letters
32(11), 2163-2176.
Kew M. C. (2003), Synergistic interaction between aflatoxin B1 and hepatitus B virus
in hepatocarcinogenesis, Liver International, 23(6), 405-409.
Kihara T., Matsuo T., Sakamoto M., Yamamoto Y., Tanimura T. (2000), Effects of
prenatal aflatoxin B1 exposure on behaviours of rat offspring, Toxicological Sciences,
53, 392-399.
King J. W. (1998), Analytical supercritical fluid techniques and methodology:
Conceptualization and reduction to practice, Journal of the Association of the Official
Analytical Chemists, 81(1), 9-17.
Kirby G.M., Chemin I., Montesano R., Chisari F.V., Lang M.A., Wild C.P. (1994),
Induction of specific cytochrome p450s involved in aflatoxin B1 metabolism in
Hepatitus B virus transgenic mice, Molecular Carcinogenisis, 11, 74-80.
Kirk G. D., Turner P. C., Gong Y., Lesi O. A., Mendy M., Goedert J. J., Hall A. J.,
Whittle H., Hainaut P., Montesano R., Wild C. P. (2003), Hepatocellular carcinoma and
polymorphisms in carcinogen-metabolizing and DNA repair enzymes in a population
with aflatoxin exposure and hepatitus B virus endemicity, Cancer Epidemiology,
Biomarkers and Prevention, 14(2), 373-379.
Krska R., Welzig E., Berthiller F., Molinelli A, Mizaikoff B. (2005), Advances in the
analysis of mycotoxins and its quality assurance, Food Additives and Contaminants,
22(4), 345-53.
Kuang S-Y., Jackson P.E., Wang J-B., Lu P-X., Munoz A., Qian G-S., Kensler T.W.,
Groopman J.D. (2004), Specific mutations of hepatitus B virus in plasma predict liver
cancer development, Proceedings of the National Academy of Sciences(USA), 101(10),
3575-3580.
Lane K.S. (1999), Aflatoxin, tobacco, ammonia and the p53 tumour-suppressor
gene:cancer's missing link? Medscape General Medicine, 1(2), 1999.
114
Liedberg B., Lundström I., Stenberg E. (1993), Principles of biosensing with an
extended coupling matrix and surface plasmon resonance, Sensors and Actuators B:
Chemical, 11, 63-72.
Leung M. C. K., Diaz-Llano, G., Smith, T. K. (2006), Mycotoxins in pet food: A
review on worldwide prevalence and preventative strategies, Journal of Agricultural and
Food Chemistry, 54, 9623-9635.
Lewis L., Onsongo M., Njapau H., Schurz-Rogers H., Luber G., Kieszak S., Nyamongo
J., Backer L., Dahiye A.M., Misore A., DeCock K., Rubin C., and Kenya Aflatoxicosis
investigation Group (2005), Aflatoxin contamination of the commercial maize products
during an outbreak of acute aflatoxicosis in Eastern and Central Kenya, Environmental
Health Perspectives, 113(12), 1763-1783.
Lian M., Lui Y., Yu S-Z., Qian G-S., Wan S-G., Dixon K. R. (2006), Hepatitis B virus
x gene and cyanobacteria toxins promote aflatoxin B1-induced hepatotumorigenesis in
mice, World Journal of Gastroenterology, 12(19), 3065-3072.
Logrieco A., Arrigan D.W.M., Brengel -Pesce K., Siciliano P., Tothill I. (2005), DNA
arrays, electronic noses and tongues, biosensors and receptors for rapid detection of
toxigenic fungi and mycotoxins: A review, Food Additives and Contaminants, 22(4),
335-344.
Lu B., Smyth M.R., O'Kennedy R. (1996), Oriented immobilization of antibodies and
its applications in immunoassays and immunosensors, Analyst, 12, 29R-32R0.
Lu B., Smyth M.R., O'Kennedy R. (1996), Immunological activities of IgG antibody on
pre-coated Fc receptor surfaces, Analytica Chimica Acta, 331, 97-102.
Luo R.H., Zhao Z.X., Zhou X.Y. Gao, Z.L., Yao J.L. (2005), Risk factors for primary
liver carcinoma in Chinese population, World Journal of Gastroenterology, 11(28),
4431-4434.
Madden C. R., Finegold M. J., Slagle B. L. (2002), Altered DNA mutation spectrum in
aflatoxin B1-treated transgenic mice that express the hepatitus B virus X protein,
Journal of Virology, 76(22), 11770-1174.
Magliulo M., Mirasoli M., Simoni P., Lelli R., Portanti O., Roda A. (2005),
Development and validation of an ultrasensitive chemiluminescent enzyme
immunoassay for aflatoxin M1 in milk, Journal of Agricultural and Food Chemistry
53(9), 3300-3305.
Mahoney N.A., Rodriguez S.B. (1996), Aflatoxin Variability in Pistachios, Applied
and Envornmental Microbiology, 62, 1197-1202.
Maragos C., McCormick S. P. (2000), Monoclonal antibodies for the mycotoxins
deoxynivalenol and 3-acetyl-deoxynivalenol, Food and Agricultural Immunology, 12,
181-192.
115
Maragos C.M., Thompson V.S. (1999), Fibre-optic immunosensor for mycotoxins,
Natural Toxins, 7(6), 371-376.
Maragos C.M. (2002), Novel Assays and sensor platforms for the detection of
Aflatoxins, Advances in Experimental Medicine and Biology, 504, 85-93.
Marin D.E., Taranu I., Bunaciu R.P., Pascale F., Tudor D.S., Avram N., Sarca M.,
Cureu R.D., Criste R.D., Suta V., Oswald I.P. (2002), Changes in performance, blood
parameters, humoral and cellular immune responses in weanling piglets exposed to low
doses of aflatoxin, Journal of Animal Sciences, 80, 1250-125.
McGlynn K.A., Hunter K., LeVoyer T., Roush J., Wise P., Michielli R.A., Shen F-M.,
Evans A.A., London W.T., Buetow K.H. (2003), Susceptibility to aflatoxin B1-related
primary hepatocellular carcinoma in mice and humans, Cancer Research, 263, 4594-
4601.
McLean, M., Dutton, M. F. (1995), Cellular interactions and metabolism of aflatoxin
an update, Pharmacology and Therapeutics, 65, 163-192.
Moghaddam A., Lobersli I., Gebhardt K., Braunagel M., Marvik O.J. (2001), Selection
and characterisation of recombinant single chain antibodies to the hapten aflatoxin B1
from naïve recombinant antibody libraries, Journal of Immunological Methods, 254,
169-181.
Morea V., Tramontano A., Rustica M., Chothia C., Lesk A.M. (1997), Antibody
structure, prediction and redesign, Biophysical Chemistry, 68, 9-16.
Moss M.O. (1998), Recent studies of Mycotoxins, Journal of Applied Microbiology
84, 62S-76S.
Mossobo M.M., Adams S., Roach J.A., Trucksess M.W. (1996), Analysis of
trichothecene mycotoxins in contaminated grains by gas chromatography/matrix
isolation/Fourier transformn infrared spectroscopy and gas chromatography/mass
spectrometry, Journal of Association of Official Analytical Chemists International,
79(5), 1116-1123.
Nasir M.S., Jolley M.E. (2002), Development of a fluoroscence polarization assay for
the determination of aflatoxins in grain, Journal of Agricultural and Food Chemistry,
50(11), 3116-3121.
Ngetich J. (2010) Kenya: New Cure for Aflatoxin Maize Still Miles Away from
Farmers. Daily Nation on the web http://allafrica.com/stories/201006151320.html
Ngundi M. M., Shriver-Lake L. C., Moore, M. H., Ligler, F.S., Taitt, C. R. (2006),
Multiplexed detection of mycotoxins in foods with regenerable array, Journal of Food
Protection, 69(12), 3047-51.
Niessen M.J.F., Wichers J.H., Lee H.A., Alcocoer M., Morgan M.R.A., van
Amerongen A. (1998), Rapid sol particle immunoassay for the detection of aflatoxin in
food products. pp. 23-29, In V. Gaukel and W. E. L. Spiess (ed.), Proceedings, part 3,
116
of the third Karlsruhe Nutrition Symposium, European Research toward Safe and Better
Foods, Karlsruhe, Germany.
O'Kennedy, R., Finlay, J.J., Leonard, P., Hearty, S., Brennan, J., Stapleton, S.
Townsend S., Darmaninsheehan, A., Baxter, A. and Jones, C. (2010), Applications of
Sensors in Food and Environmental Analysis. Sensors for Chemical and Biological
Applications, CRC Press, Taylor and Francis Group, Bocan Raton, Fl., USA, 195-232.
Olsson J., Borjesson T., Lundstedt T., Schnurer J. (2002), Detection and quantification
of ochratoxin A and deoxynivalenol in barley grains by GC-MS and electronic nose,
International Journal of Food Microbiology, 72(3), 203-214.
Ono E.Y., Ono M.A., Funo F.Y., Medinal A.E., Oliveira T.C., Kawamura O., Ueno Y.,
Hirooka E.Y. (2001), Evaluation of fumonisin-aflatoxin co-occurrence in Brazilian corn
hybrids by ELISA. Food Additives and Contaminants, 18(8), 719-729.
Park J.W., Kim E.K., Schon D.H., Kim Y.B. (2002), Natural co-occurrence of
aflatoxin B1 and ochratoxin A in barley and corn foods from Korea, Food Additives
and Contaminants, 19(11),1073-1080.
Park J. W., Kim Y-B. (2006), Effect of pressure cooking on aflatoxin B1 in Rice,
Agriculture and Food Chemistry, 54, 2431-2435.
Perez M., Henke S.E., Fedyniche A.M. (2001), Detection of aflatoxin-contaminated
grain by three granivorous bird species, Journal of Wildlife Diseases, 37(2), 358-361.
Philips T.D. (1999), Dietary clay in the chemoprevention of aflatoxin-induced disease,
Toxicological Sciences, 52(supp), 118-126.
Pier A. C. (1992), Major biological consequences of aflatoxicosis in animal production,
Journal of Animal Science, 70, 3964-3967.
Piermarini, P., Micheli L., Ammida, N. H. S., Palleschi, G., Moscone, D. (2006),
Electrochemical immunosensor array using a 96-well screen printed microplate for
aflatoxin B1 detection, Biosensors and Bioelectronics, 22(7), 1434-1440
Polson C., Sarkar P., Incledon B., Raguvaran V., Grant, R. (2003), Optimization of
protein precipitation based upon effectiveness of protein removal and ionization effect
in liquid chromatography-tandem mass spectrometry. Journal of Chromatography B
785, 263-275.
Quist C.F., Bounous D.I., Kilburn J.V., Nettles V.F. Wyatt R.D. (2000), The effect of
dietary aflatoxin on wild turkey poults, Journal of Wildlife Diseases, 36(3), 434-444.
Rich R.L., Day Y.S.N., Morton T.A., Myszka D.G. (2001), High-resolution and high-
throughput protocols for measuring drug/human serum albumin interactions using
Biacore, Analytical Biochemistry, 296, 197–207.
Sangare-Tigori,B., Moukha S., Kouadio H. J., Betbeder A-M., Dano D. S., Creppy E.
E. (2006), Co-occurrence of aflatoxin B1, fumonisin B1, ochratoxin A and zearalenone
117
in cereals and peanuts from Côte d'Ivoire, Biosensors and Bioelectronics, 21, 2298-
2305.
Scheideler S.E. (1993), Effects of various types of aluminosilicates and aflatoxin B1 on
aflatoxin toxicity, chick performance, and mineral status, Poultry Sciences, 72(2), 282-
288.
Sell S. (2003), Mouse Models to Study the Interaction of Risk Factors for Human Liver
Cancer, Cancer Research, 263, 7353-7362.
Senyuva H.Z., Gilbert J. (2005), Immunoaffinity cleanup with liquid chromatography
using post column bromination for determination of aflatoxins in hazelnut paste:
interlaboratory study, Journal of Association of Official Analytical Chemists
International, 88(2), 526-535.
Sforza S., Dall'Asta C., Marchelli R. (2005), Recent advances in Mycotoxin
determination in food and feed by hyphenated chromatographic techniques and mass
spectrometry, Mass Spectrometry Review, 25, 54–76.
Shankaran D R., (2007), Trends in interfacial design for surface plasmon resonance
based immunoassays, Journal of Physics D: Applied Physics, 40, 7187-7200.
Shapira R., Paster N., Menasherov M., Eyal O., Mett A., Meiron T., Kuttin E.,
Salomon R. (1997), Development of polyclonal antibodies for detection of aflatoxigenic
molds involving culture filtrate and chimeric proteins expressed in E. coli. Applied and
Environmental Microbiology, 63(3), 990-995.
Sharma R.P. (1993), Immunotoxicity of Mycotoxins, Journal of Dairy Science, 76,
892-897.
Sibanda L., De Saeger S., Van Peteghem C. (1999), Development of a portable field
immunoassay for the the detection of aflatoxin M1 in milk, International Journal of
Food Microbiology, 48, 203-209.
Simonich M.T., Egner P.A., Roebuck B.D., Orner G.A., Jubert C., Pereira C.,
Groopman J.D., Kensler T.W., Dashwood R.H., Williams D.E., Bailey G.S. (2007),
Natural chlorophyll inhibits aflatoxin B1-induced multi-organ carcinogenesis in the rat,
Carcinogenesis, 28(6), 1294-1302.
Smela M.E., Currier S.S., Bailey E.A., Essigmann J.M. (2001), The chemistry and
biology of aflatoxin B1 from mutational spectrometry to carcinogenesis,
Carcinogenesis, 22(4), 535-545.
Smela M. E., Hamm, M. L., Henderson, P. T., Harris, C. M., Harris, T. M., Essigmann
J. M. (2002), The aflatoxin B1 formamidopyrimidine adduct plays a major role in
causing the types of mutations observed in human hepatocellular carcinoma,
Proceedings of the National Academy of Sciences (USA), 99(10), 6655-6660.
Smith G.P., (1985), Filamentous fusion phage: novel expression vectors that display
cloned antigens on the virion surface. Science, 228, 1315–1317.
118
Snerr H., Vogel, R. F., Niessen, L. (2002), A biosensor-based immunoassay for rapid
screening of deoxynivalenol contamination in wheat, Food and Agricultural
Immunology, 14, 313-321.
Sorensen L.K., Elbaek T.H. (2005), Determination of mycotoxins in bovine milk by
liquid chromatography tandem mass spectrometry, Journal of Chromatography B,
820(2), 183-196.
Sotomayer R.E., Washington M., Ngyen L., Nyang'anyi R., Hinton D.M., Chou M.
(2003), Effects of intermittent Exposure to aflatoxin B1 on DNA and RNA Adduct
formation in Rat liver: dose response and temporal patterns, Toxicological Sciences,
73, 329-338.
Srivastava V. P., Bu-Abbas A., Alaa-Basuny, Al-Johar W., Al-Mufti S., Siddiqui K. J.
(2001), Aflatoxin M1 contamination in commercial samples of milk and dairy products
in Kuwait, Food Additives and Contaminants, 18(11), 993-997.
Stroka J., Petz M., Joerissen U., Anklam E. (1999), Investigation of various extractants
for the analysis of aflatoxin B1 in different food and feed matrices, Food Additivess
and Contaminants, 16(8), 331-338.
Stroka J., van Otterdijk, R., Anklam, E. (2000), Immunoaffinity columns clean-up
prior to thin layer chromatography for the detection of aflatoxins in various food
matrices. Journal of Chromatography A, 904, 251-256.
Taylor S. L., King, J. W., Richard, J. L., Greer, J. I. (1993), Analytical-scale
supercritical fluid extraction of aflatoxin B1 from field-inoculated corn. Journal of
Agriculture and Food Chemistry, 41, 910-913.
Thirumala Devi K., Miller J.S., Reddy G., Reddy D.V.R., Mayo M.A. (2001), Phage-
displayed peptides that mimic aflatoxin B1 in serological reactivity. Journal of Applied
Microbiology, 90, 330-336.
Toteja G. S., Mukherjee A., Diwakar S., Singh P., Saxena B. N., Sinha K. K., Sinha A.
K., Kumar N., Nagaraja K. V., Bai G., Krishna Prasad C. A., Vanchinathan S., Roy R.,
Sarkar S. (2006), Aflatoxin B1 contamination of parboiled rice samples collected from
different states of India A multi-centred study, Food Additives and Contaminants,
23(4), 411-414.
Trauner D. A. (1984), Reye's Syndrome, Western Journal of Medicine, 141(2), 206-
209.
Tudos A., J., Lucas-Van den Bos, E. R., Stigter, E. C. A. (2003), Rapid surface
plasmon resonance-based inhibition assay of deoxynivalenol, Journal of Agriculture
and Food Chemistry, 51, 5843-5848.
Turner P.C., Sylla A., Gong Y.Y., Diallo M.S., Sutcliffe A.E., Hall A.J., Wild C.P.
(2005), Reduction in exposure to carcinogenic aflatoxins by postharvest intervention

119
measures in west Africa: a community based intervention study, The Lancet, 365,
1950-1956.
USDA National Nutrient Database for Standard Reference,
http://www.nal.usda.gov/fnic/foodcomp/search/
Van der Gaag B., Spath S., Dietrich H., Stigter E., Boonzaaijer G., Van Osenbruggen
T., Koopal K. (2003), Biosensors and multiple mycotoxin analysis, Food Control, 14,
251-254.
Van Eijkeren J. C. H., Bakker M. I., Zeilmaker M. J. (2006), A simple steady-state
model for carry-over of afltoxins from feed to cows milk, Food Additives and
Contaminants, 23(8), 833-838.
Vargas E.A., Preis R.A., Castro L., Silva C.M.G. (2001), Co-occurrence of alfatoxins
B1, B2 G1, G2, zearalenone and fumonisin B1 in Brazilian corn, Food Additives and
Contaminants, 18(11), 981-986.
Wang P., Reed M., Wang Y., Mayr G., Stenger J. E., Anderson M. E., Schwedes J. F.,
Tegtmeyer P. (1994), p53 domains structure, oligomerization and transformation,
Molecular and Cellular Biology, 14(8), 5182-5191.
Whitaker T.B., Springer J., Defize P.R., deKoe W.J., Coker R. (1995), Evaluation of
sampling plans used in the United States, United Kingdom, and The Netherlands to test
raw shelled peanuts for aflatoxin, Journal of Association of Official Analytical
Chemists International, 78(4), 1010-1018.
Wittrup K.D. (1999), Phage on display, Tibtech, 17, 423-424.
Yabe K., Nakamura M., Hamasaki T. (1999), Enzymatic Formation of G-Group
Aflatoxins and Biosynthetic Relationship between G- and B-Group Aflatoxins,
Carcinogenesis, 13(9), 1607-1613.
Youngman L. D., Campbell, T. C. (1992), Inhibition of aflatoxin B1-induced gamma-
glutamyltranspeptidase positive (GGT+) hepatic preneoplastic foci and tumors by low
protein diets evidence that altered GGT+ foci indicate neoplastic potential,
Carcinogenesis, 13(9), 1607-1613.
Yuan Q., Pestka J.J., Hespenheide B.M., Kuhn L.A., Linz J.E., Hart L.P. (1999),
Identification of mimitope peptides which bind to the mycotoxin deoxynivalenol-
specific monoclonal antibody, Applied Environmental Microbiology, 65(8), 3279-
3286.
Zhang X.H., Chen J.M. (2004), Comparison between the post-column derivatization
with bromine by HPLC and the fluorometric analysis for determination of aflatoxins in
medicinal herbs and plant extracts, Yao Xue Xue Bao, 39(12), 997-1000.
Zollner P., Mayer-Helm B. (2006), Trace mycotoxin analysis in complex biological
and food matrices by liquid chromatography-atmospheric pressure ionisation mass
spectrometry, Journal of Chromatography A, 1136, 123-169.

120