development of an ammonia reduction after-treatment
TRANSCRIPT

Graduate Theses, Dissertations, and Problem Reports
2017
Development of an Ammonia Reduction After-Treatment Systems Development of an Ammonia Reduction After-Treatment Systems
for Stoichiometric Natural Gas Engines for Stoichiometric Natural Gas Engines
Saroj Pradhan
Follow this and additional works at: https://researchrepository.wvu.edu/etd
Recommended Citation Recommended Citation Pradhan, Saroj, "Development of an Ammonia Reduction After-Treatment Systems for Stoichiometric Natural Gas Engines" (2017). Graduate Theses, Dissertations, and Problem Reports. 6447. https://researchrepository.wvu.edu/etd/6447
This Dissertation is protected by copyright and/or related rights. It has been brought to you by the The Research Repository @ WVU with permission from the rights-holder(s). You are free to use this Dissertation in any way that is permitted by the copyright and related rights legislation that applies to your use. For other uses you must obtain permission from the rights-holder(s) directly, unless additional rights are indicated by a Creative Commons license in the record and/ or on the work itself. This Dissertation has been accepted for inclusion in WVU Graduate Theses, Dissertations, and Problem Reports collection by an authorized administrator of The Research Repository @ WVU. For more information, please contact [email protected].

Development of an Ammonia Reduction After-treatment
Systems for Stoichiometric Natural Gas Engines
Saroj Pradhan
Dissertation submitted to the
Benjamin M. Statler College of Engineering and Mineral Resources
at West Virginia University
in partial fulfillment of the requirements for the degree of
Doctor of Philosophy
in
Mechanical Engineering
Arvind Thiruvengadam, Ph.D., Chair
Marc C. Besch, Ph.D.
Mario Perhinschi, Ph.D.
Bharadwaj Shathiamoorthy, Ph.D.
Ross Ryskamp, Ph.D.
Department of Mechanical and Aerospace Engineering
Morgantown, West Virginia
2017
Keywords: stoichiometric natural gas engines, three-way catalyst, SCR, ammonia emission,
after-treatment modelling, artificial intelligence techniques, lean-burn spark ignited
Copyright 2017 Saroj Pradhan

ABSTRACT
Development of an Ammonia Reduction After-treatment Systems for Stoichiometric Natural Gas Engines
Saroj Pradhan
Three-way catalyst (TWC) equipped stoichiometric natural gas vehicles have proven to
be an effective alternative fuel strategy that shows significant low NOx emissions characteristics.
However, recent studies have shown the TWC activity to contribute to elevated levels of tailpipe
ammonia (NH3) emissions. Although a non-regulated pollutant, ammonia is a potent pre-cursor
to ambient secondary PM formation. Ammonia is an inevitable byproduct of fuel rich operation
that results in lowest NOx slip through the TWC after-treatment system.
The main objective of the study is to develop a passive Ammonia Reduction Catalyst
(passive-ARC) based NH3 reduction strategy that results in an overall reduction of ammonia as
well as NOx emissions. The study investigated the characteristics of Fe-based and Cu-based
zeolites SCR catalysts in storage and desorption of ammonia at high exhaust temperature
conditions, that are typical of stoichiometric natural gas engines. Continuous measurements of
NOx and NH3 before and after the SCR systems were conducted using a Fourier Transform
Infrared Spectrometry (FTIR) gas analyzer. Results of the investigation showed that both, the
Fe- and Cu zeolite SCRs adsorbed above 90% of TWC generated NH3 emissions below 350-
375°C SCR temperatures. Desorption or slipping of NH3 was observed at exhaust gas
temperatures exceeding 400°C. In terms of NOx conversions, Fe-zeolite showed efficiency
between 50-80% above temperatures of 300-350°C while Cu-zeolite performed well at lower
SCR temperature from 250°C and above with a conversion efficiency of greater than 50%.
In order to efficiently reduce both NOx and NH3 simultaneously over longer durations
it was found that an engine-based air fuel ratio operation strategy for the passive-ARC system
must be developed. To this extent, the study extended its objectives to develop an engine-based
control strategy that results in stoichiometric ammonia production operation followed by brief
lean operation to regenerate the saturated ammonia reduction catalyst using high NOx slip
through TWC. The study presents comprehensive results of ammonia storage characteristics of
SCRs pertaining to stoichiometric natural gas engine exhaust as well as an advanced engine
control strategy approach to simultaneously reduce both NOx and NH3 using an alternating air
-fuel ratio approach.

iii
ACKNOWLEDGEMENT
From the very first day my parents held my hands and dropped me off at kindergarten
back in Kathmandu, to finally wrapping up the final chapters of academic career at WVU, this
long journey far away from home wouldn’t even have been possible without all their sacrifices,
endless support and unconditional love. Thank you, dad and mom, for believing in me. Also, I
would like to thank my loving sister, Srijana, for all your support and motivation.
I would like to express my extreme appreciation to my advisor, mentor, and friend Dr.
Arvind. Your support and encouragement has been a tremendous guidance in this last 5 years
of mine. And, our buddy Dr. Besch or Marc Sir!, truly a most humble, friendly, caring, and
knowledgeable person I have ever met in my life. This CAFEE journey wouldn’t have been the
same without both of you. I have learned and experienced so much working and shadowing
from you guys, and never would forget my first days of refuse-truck testing when I got the true
flavor of LA.
I would like to thank rest of my committee: Dr. Perhinschi, for your insightful
comments and your wonderful AI class which has helped me accomplish lot of task within this
work. And, Dr. Ross and Dr. Bharadwaj, also my two good old friends for providing me
guidance and support not only for this work but in other research work.
Furthermore, a special thanks to my buddies Beeko Berk and Paul Pragalath for all the
support in this work, and in all the other projects we have tackled together. I am also grateful
to Brad, Richard and Jason for helping me in the lab and guiding me towards the right tools
necessary to complete this work on time. I am also thankful to all my work colleagues for helping
me in the projects and giving me, five years of fun filled moments in CAFEE.
I also thank you Mridul Gautam for your guidance and inspirational speeches which has
helped me a lot in growing my confidence, and I always aim to follow your footsteps. A very
special thanks to Dan for all your support and motivation you gave us over the CAFEE years.
And finally, last but not the least, my special gratitude goes to all the people who has
been a part of this journey and my life. I can’t thank you all enough for the care, support and
encouragement.

iv
TABLE OF CONTENT
ABSTRACT ................................................................................................................................. ii
ACKNOWLEDGEMENT.......................................................................................................... iii
LIST OF FIGURES .................................................................................................................... vi
LIST OF TABLES ....................................................................................................................... x
CHAPTER 1 Introduction .................................................................................................. 1
1.1 PROBLEM STATEMENT ........................................................................................................................ 3 1.2 OBJECTIVE ............................................................................................................................................. 4
CHAPTER 2 Literature Review .......................................................................................... 6
2.1 THREE-WAY CATALYST REACTIONS ................................................................................................. 6 2.2 AMMONIA EMISSION CHARACTERISTICS IN STOICHIOMETRIC NATURAL GAS VEHICLES
WITH TWC .......................................................................................................................................................... 8 2.3 HEALTH AND ENVIRONMENTAL EFFECTS OF AMMONIA EMISSIONS ...................................... 12 2.4 USE OF SCR TECHNOLOGY FOR NH3 STORAGE AND REDUCTION ......................................... 13 2.5 NH3-SCR OPERATION MECHANISM ............................................................................................... 15 2.6 NH3-SCR ACTIVITY DEPENDENCY ................................................................................................ 17 2.7 CONTROL STRATEGIES USED IN SCR APPLICATIONS ................................................................. 19
2.7.1 Traditional SCR control methods ............................................................................................... 19 2.7.2 Model-based SCR control ............................................................................................................. 20 2.7.3 Control approach using Artificial Intelligence Techniques ..................................................... 22
2.8 CONTROL-ORIENTED MODEL BASED ON PHYSICAL NOX AND NH3 SENSORS ..................... 23 2.9 SUMMARY ............................................................................................................................................. 27
CHAPTER 3 Experimental Setup .................................................................................... 29
3.1 TEST ENGINE SPECIFICATION ......................................................................................................... 29 3.2 ENGINE LABORATORY SETUP .......................................................................................................... 30 3.3 GASEOUS EMISSION MEASUREMENT SYSTEM USING FTIR ANALYZER ................................... 31 3.4 GASEOUS MEASUREMENT SYSTEM USING CVS METHOD .......................................................... 33 3.5 ENGINE LEAN-ON OPERATION CONTROL SETUP ...................................................................... 34
CHAPTER 4 Approach ..................................................................................................... 37
4.1 BASELINE AFTER-TREATMENT EVALUATION ............................................................................... 37 4.1.1 Transient test cycles ....................................................................................................................... 38 4.1.2 Steady-state test matrix .................................................................................................................. 39
4.2 TWC+SCR AFTER-TREATMENT SYSTEM EVALUATION ............................................................. 40 4.2.1 Types of SCR formulation ............................................................................................................ 41 4.2.2 SCR evaluation test matrix ........................................................................................................... 42
4.3 FUZZY-LOGIC BASED CONTROL METHOD .................................................................................... 43 4.3.1 Fuzzification ................................................................................................................................... 45 4.3.2 Membership function .................................................................................................................... 45 4.3.3 Inference engine ............................................................................................................................. 47 4.3.4 De-fuzzification .............................................................................................................................. 49 4.3.5 Fuzzy logic control summary ....................................................................................................... 50
4.4 MODEL-BASED ESTIMATOR METHODS .......................................................................................... 51 4.4.1 Post-TWC NH3 estimation method ........................................................................................... 52 4.4.2 Post-SCR NH3 estimation method ............................................................................................. 55 4.4.3 SCR kinetic analysis ....................................................................................................................... 56

v
4.4.4 Steady-state estimator for SCR modeling................................................................................... 58 4.4.5 Model parameter identification method ..................................................................................... 60
CHAPTER 5 Results and Discussion ............................................................................... 62
5.1 BASELINE ENGINE AND AFTER-TREATMENT EVALUATION ..................................................... 62 5.1.1 Transient evaluation ...................................................................................................................... 62 5.1.2 Steady-state evaluation .................................................................................................................. 69
5.2 TWC+SCR AFTER-TREATMENT EVALUATION ............................................................................ 70 5.3 AMMONIA ADSORPTION/DESORPTION EVALUATION (SCR 4) ................................................. 77
5.3.1 Engine performance evaluation during lean-ON Modes ........................................................ 88 5.3.2 Lean-ON duration evaluation ...................................................................................................... 90
5.4 REGENERATION CONTROL USING FUZZY-LOGIC ...................................................................... 91 5.5 POST-TWC NH3 ESTIMATION USING ANN ................................................................................. 96 5.6 SCR MODEL CALIBRATED TO EXPERIMENTAL DATA ............................................................... 108
CHAPTER 6 Conclusions ............................................................................................... 112
6.1 EXPERIMENTAL FINDINGS ............................................................................................................ 112 6.2 RECOMMENDATIONS ...................................................................................................................... 113 6.3 CONTRIBUTIONS .............................................................................................................................. 114
REFERENCES ........................................................................................................................ 116
APPENDIX A FTIR Specification ................................................................................. 123
APPENDIX B Fuzzy Logic Controller Design and Program Code ............................... 124

vi
LIST OF FIGURES
Figure 1. Effect of AFR sweep on NH3 formation over a TWC fir gasoline engine source (Li et al.
2010) .......................................................................................................................................................................... 8
Figure 2. NH3 emission from a transit bus natural gas vehicle (Veh 4) over UDDS test
(Thiruvengadam et al. 2016) .................................................................................................................................. 9
Figure 3. NOx and NH3 emissions (g/bhp-hr) from five vocational natural gas vehicles
(Thiruvengadam et al. 2016) ................................................................................................................................ 10
Figure 4. Light-off curves corresponding to fresh versus aged TWC with different formulation
(González-velasco et al. 2000) ............................................................................................................................ 11
Figure 5. Ammonia storage capacity for two SCR formulation as a function of temperature (Eijnden et
al. 2009)................................................................................................................................................................... 16
Figure 6. NOx conversion efficiency for vanadium-based and metal-exchanged zeolite-based SCR
activity at varying temperatures under standard-SCR conditions (Kröcher 2007) ..................................... 17
Figure 7. Schematic of a NOx-ZrO2 sensor (Blanco-Rodriguez 2014) ....................................................... 24
Figure 8. Performance of NOx sensor NH3 cross-sensitivity factor using different error estimation
designs (Zhang, Wang, and Wang 2015) ........................................................................................................... 25
Figure 9. Schematic of NH3 sensor based on non-equilibrium electrochemical sensing principle (Moos
et al. 2002) .............................................................................................................................................................. 26
Figure 10. Baseline Cummins ISL-G test cell setup ........................................................................................ 30
Figure 11. Cummins ISL-G (TWC+SCR) test cell setup ............................................................................... 31
Figure 12. Schematic diagram of an FTIR interferometer (Sanchonx 2017) .............................................. 32
Figure 13. FTIR sampling setup ......................................................................................................................... 33
Figure 14. Schematic of dilute gaseous measurement system using CVS method ..................................... 34
Figure 15. Manual lean-ON hardware control setup ...................................................................................... 35
Figure 16. Schematic of manual lean-ON control setup for intercepting on-board O2 sensor signal to
the ECU .................................................................................................................................................................. 36
Figure 17. Schematic of the experimental setup for the baseline (engine + TWC) evaluation ................ 37
Figure 18. FTP normalized speed and torque profiles ................................................................................... 38
Figure 19. WHTC normalized speed and torque profiles .............................................................................. 38
Figure 20. Normalized distribution of engines operating points for the FTP and WHTC cycles .......... 39
Figure 21. 20 engine operating modes for steady-state evaluation ............................................................... 40
Figure 22. Schematic of the experimental setup for the (engine + TWC + SCR) evaluation .................. 41
Figure 23. Transient bus real-world engine operation and 8-mode steady-state from clustering method
.................................................................................................................................................................................. 43
Figure 24. Flow-chart showing the fuzzy-logic based controller for controlling the passive-ARC
regeneration status ................................................................................................................................................ 44
Figure 25. Membership function shapes for three input linguistic variables and its values ...................... 46
Figure 26. Membership function for output variable ...................................................................................... 47
Figure 27. 48 inference rule based matrix for fuzzy-logic output ................................................................. 48
Figure 28. De-fuzzification of the fuzzy-logic output using middle of maximum method ...................... 49
Figure 29. Schematic of model-based NH3 estimation approach for the fuzzy-logic based controller .. 52
Figure 30. Example flow model architecture of ANN with seven inputs, three hidden layers and one
output ...................................................................................................................................................................... 53
Figure 31. MATLAB’s Neural-Network view .................................................................................................. 54

vii
Figure 32. Schematic of ammonia storage distribution and CSTR model of SCR catalyst ...................... 58
Figure 33. Schematic for model parameter identification .............................................................................. 60
Figure 34. Averaged NOx, NH3, CO and THC emission concentration before and after the TWC
system over transient (FTP cycle) tests ............................................................................................................. 65
Figure 35. Averaged NOx, NH3, CO and THC emission concentration before and after the TWC
system over transient (WHTP cycle) tests ........................................................................................................ 65
Figure 36. Engine transient operating (FTP-1 test) profiles showing engine speed (rpm), engine torque
(ft-lbs), engine power (bhp) and averaged TWC temperature (ºC)............................................................... 66
Figure 37. NOx and NH3 concentration before and after the TWC system over transient (FTP-2 test)
operating condition ............................................................................................................................................... 67
Figure 38. NO2 and N2O concentration before and after the TWC system over transient (FTP-1 test)
operating condition ............................................................................................................................................... 68
Figure 39. Averaged post-TWC NOx and NH3 concentration for temperature bins from FTP and
WLTC cycles .......................................................................................................................................................... 69
Figure 40. Concentration counter plots from 20 steady-state mode tests represented under engine
speed and torque region; (a) pre-TWC NOx (b) post-TWC NOx, (c) post-N2O and (d) post-TWC
NH3 ......................................................................................................................................................................... 70
Figure 41. Profiles of NOx and NH3 concentration before and after the evaluated SCR over the FTP
cycle (SCR 3) .......................................................................................................................................................... 72
Figure 42. Cumulative profile of inlet NH3, NH3 storage and NH3 slippage from the evaluated SCR 3
over the FTP cycle ................................................................................................................................................ 73
Figure 43: Comparison of averaged percent NOx conversion efficiency as a function of temperature
over the FTP cycle ................................................................................................................................................ 74
Figure 44: Comparison of averaged percent NH3 slip as a function of temperature over the FTP cycles
.................................................................................................................................................................................. 76
Figure 45. Average NOx conversion efficiency and NH3 slippage for all five SCR catalyst over the
entire three repeated FTP cycles ........................................................................................................................ 77
Figure 46: Mode 1 [engine speed = 751 rpm, engine torque = 247 ft-lbs]; comparing pre-and-post
NOx and NH3 concentrations; includes lean-ON period (300-596 seconds) ............................................ 80
Figure 47: Mode 2 [engine speed = 851 rpm, engine torque = 84 ft-lbs]; comparing pre-and-post NOx
and NH3 concentrations; includes lean-ON period (480-700 seconds) ....................................................... 81
Figure 48: Mode 3 [engine speed = 1249 rpm, engine torque = 316 ft-lbs]; comparing pre-and-post
NOx and NH3 concentrations; includes two lean-ON periods (2040-2280 seconds & 2970-3034
seconds) .................................................................................................................................................................. 83
Figure 49: Mode 4 [engine speed = 1296 rpm, engine torque = 37 ft-lbs]; comparing pre-and-post
NOx and NH3 concentrations; includes lean-ON period (310-550 seconds) ............................................ 83
Figure 50: Mode 5 [engine speed = 1480 rpm, engine torque = 597 ft-lbs]; comparing pre-and-post
NOx and NH3 concentrations; includes two lean-ON periods (65-122 seconds & 774-1010 seconds) 85
Figure 51: Mode 6 [engine speed = 1521 rpm, engine torque = 162 ft-lbs]; comparing pre-and-post
NOx and NH3 concentrations; includes two lean-ON periods (412-419 seconds & 460-479) ............... 86
Figure 52: Mode 7 [engine speed = 1575 rpm, engine torque = 337 ft-lbs]; comparing pre-and-post
NOx and NH3 concentrations; includes two lean-ON periods (182-789 seconds & 1245-1464 seconds)
.................................................................................................................................................................................. 87
viii
Figure 53: Mode 8 [engine speed = 1611 rpm, engine torque = 683 ft-lbs]; comparing pre-and-post
NOx and NH3 concentrations; includes three lean-ON periods (90-219 seconds, 577-752 seconds &
1211-1362 seconds) .............................................................................................................................................. 87
Figure 54. Comparison of brake specific fuel consumption between baseline operation versus lean-ON
operation ................................................................................................................................................................ 89
Figure 55. Comparison of varying lean-ON periods (Mode 3) ..................................................................... 91
Figure 56. Ammonia Slip (AS), Rate of Ammonia Slip (RAS), and NOx Slip (NOS) Membership
Function ................................................................................................................................................................. 92
Figure 57. Fuzzy-logic controller response for steady-state Mode 8 (SCR 4) ............................................. 94
Figure 58. Fuzzy-logic controller response for steady-state Mode 3 (SCR 4) ............................................. 94
Figure 59. Fuzzy-logic controller response for transient FTP cycle (SCR 3) .............................................. 95
Figure 60. Transient FTP profile of the seven input variables ...................................................................... 96
Figure 61. Results for measured versus estimated NH3 concentration using number of neurons and
Levenberg-Marquardt training function ............................................................................................................ 98
Figure 62. Comparison of measured and estimated NH3 concentration using different number of
neurons and Bayesian Regularization training function ................................................................................. 99
Figure 63: Comparison of MSE using EWMA filter with different filtering periods .............................. 101
Figure 64. Comparison of measured and estimated NH3 concertation applying the EWMA filter (Filter
Period = 6) ........................................................................................................................................................... 101
Figure 65. Comparison of measured and estimated NH3 concentration; (Number of Inputs = 9,
Number of Neurons = 40, Fitting Function = Bayesian Regularization, EWMA with Period = 6) .... 102
Figure 66. Comparison of number of moles of NH3 per catalyst volume (moles/m3) calculated from
actual versus estimated NH3 concentration. ................................................................................................... 103
Figure 67. Difference between actual and estimated number of moles of NH3 per catalyst volume ... 103
Figure 68. Comparison of actual versus estimated NH3 concertation using validation FTP Data Set 1
................................................................................................................................................................................ 104
Figure 69 Comparison of actual versus estimated NH3 concertation using validation FTP Data Set 2
................................................................................................................................................................................ 105
Figure 70. Comparison of actual versus estimated number of moles of NH3 per catalyst volume
(moles/m3) for FTP Data Set 1 ........................................................................................................................ 105
Figure 71. Comparison of actual versus estimated number of moles of NH3 per catalyst volume
(moles/m3) for FTP Data Set 2 ........................................................................................................................ 106
Figure 72. Comparison of actual versus estimated number of moles of NH3 per catalyst volume
(moles/m3) periods for FTP Data Set 2 using three different EWMA filtering ...................................... 107
Figure 73. Difference between actual versus estimated number of moles of NH3 per catalyst volume
(moles/m3) periods for FTP Data Set 2 using three different EWMA filtering ...................................... 107
Figure 74. Comparison of post-SCR NOx, post-SCR NH3 and NH3 storage ratio predicted by 3-state
SCR model storage ratio for steady-state Mode 1 (baseline operation); Initial ammonia storage ratio =
0.15 ........................................................................................................................................................................ 109
Figure 75. Comparison of post-SCR NOx, post-SCR NH3 and NH3 storage ratio predicted by 3-state
SCR model for steady-state Mode 1 (baseline operation); Initial ammonia storage ratio = 0.7; ........... 109
Figure 76. Comparison of post-SCR NOx, post-SCR NH3 and NH3 storage ratio predicted by 3-state
SCR model for steady-state Mode 1 (baseline operation); Initial ammonia storage ratio = 0.15; Ω as
identified parameter ............................................................................................................................................ 110
Figure 77. MATLAB®’s Fuzzy-Logic Toolbox (FL Main Design Interface) ............................................ 124

ix
Figure 78. MATLAB®’s Fuzzy-Logic Toolbox (FL Membership Function Design Interface) ............. 124
Figure 79. MATLAB®’s Fuzzy-Logic Toolbox (FL Inference Rule Design Interface) ........................... 125
Figure 80. MATLAB®’s Fuzzy-Logic Toolbox (FL Rule Viewer) .............................................................. 125

x
LIST OF TABLES
Table 1. Test Engine and After-treatment Specification ................................................................................ 29
Table 2. List of five experimented SCR catalyst for ammonia reduction evaluation ................................. 41
Table 3. List of linguistic variables and linguistic values ................................................................................ 45
Table 4. Neural-Network Training Parameters ................................................................................................ 55
Table 5. GA Optimization Algorithm Criteria’s .............................................................................................. 61
Table 6. Transient Test Matrix............................................................................................................................ 63
Table 7. Summary results from transient test cycles with baseline setup, CVS measured brake specific
emission values ...................................................................................................................................................... 64
Table 8. Test matrix from the five SCR evaluation study .............................................................................. 71
Table 9. Steady-State mode test for SCR 4, engine and SCR temperature operating conditions ............ 78
Table 10. Summary comparison between baseline operation versus lean operation over eight steady-
state modes............................................................................................................................................................. 88
Table 11. Comparison of performance using different number of neurons and Levenberg-Marquardt
training function .................................................................................................................................................... 97
Table 12. Comparison of performance using different number of neurons and Bayesian Regularization
training function .................................................................................................................................................... 97
Table 13. Comparison of performance for four different number of neurons with Bayesian
Regularization training function and additional two first derivative input parameters ........................... 100
Table 14. Reaction rate identified parameters in the three state SCR model ............................................ 108
Table 15. Reaction rate identified parameters in the three state SCR model ............................................ 111
Table 16. FTIR Specification from Manufacturer ......................................................................................... 123

1
CHAPTER 1 Introduction
Considering today’s in-use emission control devices that aid modern heavy-duty vehicles
to comply with stringent USEPA emissions and CO2 greenhouse standards, natural gas fueled
vehicles utilizing three-way catalyst (TWC) technology are known to provide better fuel
consumption and lower tailpipe emission benefits when compared to the SCR equipped diesel
counterparts (D. W. Stanton 2013). However, natural gas engines are precisely controlled to
operate at a narrow stoichiometric combustion regime to effectively and simultaneously convert
major toxic emissions such as nitrogen oxides (NOx), carbon monoxide (CO) and hydrocarbons
(HC) in the TWC system. This has notably limited natural gas vehicles to operate the majority
of their activity close to stoichiometric ratio, hence, leaving less room for fuel reduction
improvements.
Efficiently converting the three major pollutants simultaneously from natural gas
engine’s exhaust stream over a TWC is commonly achieved by dithering the air-fuel ratio (AFR),
a periodical switch between rich and lean combustion window operation (Defoort, Olsen, and
Willson 2004). During the lean window, the three-way catalyst formulation is able to oxidize
HC and CO, and during the rich window favors redox reactions to reduce oxides of nitrogen
(Shi et al. 2015). In addition to the standard reactions, studies have shown that under rich
operating conditions, oxygen deficiency in the exhaust also promotes other two kinds of
reactions known as water gas-shift and steam reforming reactions (Barbier and Duprez 1994).
In such events, CO which is not oxidized due to lack of oxygen reacts with water vapor (H2O)
to form CO2 and hydrogen (H2). Further, under suitable conditions, the H2 molecules react with
available NO and CO in the exhaust stream to form ammonia (NH3), considered as a precursor
emission (Suarez-Bertoa, Zardini, and Astorga 2014).
Gas-phase NH3 is also considered to be a critical atmospheric pollutant contributing to
the formation of airborne particulate matter (Renner and Wolke, 2008). These secondary
formed particles in the atmosphere have been studied by many researchers and institutions, and
tend to show risk factors pertaining to human health (Suarez-Bertoa et al., 2014). As stated by
International Agency for Research on Cancer, a part of the World Health Organization (WHO),
particulate matter are the major constituents of outdoor air pollution and can cause cancer in
humans (IARC, 2013). In addition to human health effects, secondary ammonia also impacts

2
terrestrial vegetation (Krupa, 2003), and threatens ecosystem health by contributing to critical
amount of nitrogen in remote ecosystems (Sun et al., 2016).
Numerous emission measurement conducted in laboratories, on-road in-use tests,
roadside/tunnel studies by means of remote sensing methods and more have indicated high
levels of tailpipe NH3 emissions from both gasoline and natural gas vehicles equipped with a
TWC after-treatment system operating under stoichiometric combustion regime (Huai et al.
2003; Livingston, Rieger, and Winer 2009; Quiros et al. 2016). An emission inventory report
published in August of 2000 by the South Coast Air Quality Management District estimated
that mobile sources were the third largest source of NH3 emissions in the greater Los Angeles
area, apart from agricultural and livestock waste sources, and accounted for approximately 18%
of the inventory. Similarly, a study conducted around the same time period showed that motor
vehicles accounted for about 6% in North Carolina and 14% in San Joaquin Valley
(Battye Viney P., Roelle, Paul A. 2003). In Europe, a report published by the European
Environment Agency’s road transport sector showed an increase of 378% in ammonia emission
between 1990 and 2010.
Elevated levels of NH3 emission from natural gas vehicles could be attributed to several
factors that promotes NH3 formation. Aging of the TWC over extensive vehicle operation has
evidently shown to be one of the major contributor. Indeed, recent studies conducted by WVU
have indicated high NH3 emission from such natural gas vehicles, and also reporting vehicle age
attributing in varying levels of NH3 being emitted (Thiruvengadam et al. 2016). The
deterioration of vehicle components and aging of the after-treatment system, as illustrated by
the researchers, have shown to play a significant role in the operating characteristics of the TWC
system. In specific to three-way catalyst performance, studies have shown that degradation of
catalyst over time affects the chemical and/or thermal mechanisms of the catalyst material being
used (Matam et al. 2012), and tend to influence oxidation storage capacity (Sabatini et al. 2016),
emission conversion efficiencies, and light-off temperatures (Nagashima et al. 2000).
Although, a non-regulated pollutant in the US, increasing trend in NH3 emission from
mobile sources, especially in urban areas and densely populated cities have received critical
concerns over the years. In the heavy-duty transportation sector, natural gas-fueled vehicle
population share a significantly lower market than the diesel-fueled vehicles. However, market
studies have shown substantial penetration of natural gas-fueled vocational vehicles within
urban areas, especially in the US (Delgado and Muncrief 2015). In vocational application captive

3
fleets such as transit buses, refuse trucks, food/beverage delivery trucks and similar types,
natural gas fueled vehicles are trending upward, attributed to the increasing number of fueling
stations and vehicle procurement incentive programs at different federal and state levels.
According to a conference paper presented by Stanton, a 11.9% average annual growth rate is
projected between 2011 and 2040 for natural gas vehicles in the US (D. Stanton, Charlton, and
Vajapeyazula 2013). As a result, such a trend could potentially increase vehicular NH3 emissions
within major populated cities causing immediate as well as long term urban air quality
degradation.
The above highlights pose a critical need to monitor NH3 emission from stoichiometric
natural gas vehicles and develop strategies to capture or abate tailpipe NH3 emissions. In
addition, NH3 reduction pathways can also lead to further reduction in NOx and GHG
emissions, to potentially meet more stringent future regulations. The USEPA has initiated
rulemakings for low-NOx emission standards, and if in force, the new standard would require
all heavy-duty vehicles to meet 0.02 g/bhp-hr NOx regulation starting 2024 (USEPA 2016).
This would force vehicle manufactures to reduce NOx emissions by almost 90% from the
current standards, and would require significant advancement in emission control strategies and
technologies.
1.1 Problem Statement
The study investigates the application of coupling an ammonia reduction technology to
an existing stoichiometric natural gas after-treatment system downstream of the three-way
catalyst (TWC) in order to reduce observed precursor-NH3 emissions. According to current
industry practices, SCR systems have proven effective in reducing NOx emission by supplying
of precisely controlled NH3, to aim selective reduction reactions over the catalyst. However,
conversion performance of SCR system differs based on the catalyst formulation, where
temperature and NH3 storage capability plays a critical role. The study considers investigating
the characteristics and effects of different zeolite based SCR catalyst formulation on NH3
storage and NOx conversion efficiency operated over dynamic loading of a commercially used
heavy-duty stoichiometric natural gas engine equipped with a TWC system.
A SCR system outlet of the TWC has mostly been explored for gasoline applications, as
a lean-burn combustion strategy. This work however, demonstrates an active engine control
regeneration approach to simultaneously reduce NOx and NH3, while at the same time obtain

4
fuel reduction benefits. The regeneration process is initiated by precise control of air-fuel ratio,
alternating between rich (NH3 production mode) and lean (NH3 regeneration mode) modes,
where the ammonia absorbed during the normal stoichiometric operation in the SCR brick
could be regenerated with the effect of high NOx slip through the TWC. The approach involves
continuous monitoring of the SCR activity via utilizing additional NH3 and NOx sensors.
1.2 Objective
The global objective of this study is to demonstrate the applicability of an SCR system
similar to one used in diesel application, to be used as an added Ammonia Reduction System
(passive-ARC) that can store NH3 generated by the TWC system and then regenerated by brief,
high NOx events when shifting the engine to lean-burn combustion. The theory behind the
approach also leads to a pathway in further reducing overall NOx emissions and improve fuel
consumption benefits for stoichiometric natural gas engines. The study is divided into two
specific aims to achieve the global objective, and are provided as follows:
Specific Aim 1: Investigate NOx and NH3 reduction characteristics of different SCR
catalyst over stoichiometric natural gas engine operating conditions. In summary, the specific aim
is to identify a suitable system that performs well in ammonia storage capacity and NOx
conversion characteristics over the wide operating conditions of a stoichiometric natural gas
engine, and under the central hypothesis that a SCR catalyst is considered to be an adequate passive
NH3 reduction system. The hypothesis was tested by performing SCR catalyst evaluation
experiments over engine dynamometer procedure. Evaluation criteria included NOx conversion
and NH3-slippage over different temperature ranges, emission constituent levels, and engine
operating conditions. The SCR catalyst can then be used as a passive-ARC with a dual purpose
of storing NH3 under specific conditions and then utilize the stored NH3 as a reducing agent in
a strategic event of brief, lean-burn, high-NOx for ammonia regeneration (purge) which leads
to the second specific aim of the study.
Specific Aim 2: Develop a SCR performance controlling technique consisting of a
decision-making control feature, designed for actively regenerate ammonia stored within the
catalyst by alternating between rich (NH3 production) and lean (NH3 regeneration using NOx
reduction) modes with real-time feedback sensing based on either a physical sensor or from
model-based estimation approach. Furthermore, the specific aim will also consider sensor

5
reduction evaluation in conjunction to model-based control approach with SCR activity
estimation methods focused on real-time, in-ECU application.

6
CHAPTER 2 Literature Review
Three-way catalyst equipped stoichiometric natural gas vehicles have proven to be an
effective alternative fuel strategy that has shown superior low NOx benefits in comparison to
diesels equipped with SCR. However, in recent years, studies evaluating tailpipe emissions have
shown the TWC activity to contribute to elevated levels of tailpipe ammonia emissions.
Although a non-regulated pollutant, ammonia is a potent pre-cursor to ambient secondary PM
formation. Ammonia is an inevitable catalytic byproduct of TWC during that results also
corresponds to lowest NOx emissions. This chapter will focus on NH3 formation in the TWC,
along with its known effects on the environment and human health. Also, an extensive review
of available SCR technology utilizing NH3 will be presented. Additionally, a review will also be
done on several types of after-treatment control strategies. In summary, the literature gathered
for the study focuses on available research in the scientific and industry community that would
potentially help in achieving the studies objectives.
2.1 Three-way catalyst reactions
The exhaust stream from a natural gas combustion primarily comprises of unburned
hydrocarbons (HC), carbon monoxide (CO) and oxides of nitrogen (NOx). These emissions are
effectively controlled with the help of commonly used three-way catalyst system, which uses
combination of platinum (Pt), rhodium (Rh), and palladium (Pd) as the active catalytic
substances. Studies have shown that natural gas vehicles operated over stoichiometric
combustion provide better performance over the older technology vehicles equipped with
oxygen catalyst operated with lean-burn combustion in order to meet the more stringent 2010
NOx emission standards from the USEPA (Karavalakis et al. 2016). With the adequately
designed three-way formulation, the catalyst promotes two kinds of reactions, oxidation
reaction in the presence of oxygen to reduce HC and CO (given by Equation (1 and Equation
(2), and reduction reaction to reduce NOx with presence of CO (given by Equation (3).

7
CO + ½ O2 CO2 (1)
CH4 + 2O2 CO2 + H2O (2)
NO + CO 2N2 + CO2 (3)
Simultaneous reduction via the above-mentioned reaction of the three major gases in
the natural gas exhaust is achieved via frequently varying the air-fuel ratio (AFR) of the engine
combustion between rich and lean mixture, a commonly known strategy as fuel-dithering. This
process have shown to be an effective approach in achieving greater efficiency in reducing NOx
and CO during slightly rich operation and HC during slight lean operation (Defoort, Olsen, and
Willson 2004). From a fuel-dithering optimization study for natural gas engine showed that the
optimal dithering lambda-midpoint resides in slightly rich combustion, and precise control of
frequency and amplitude of the fuel dithering tend to affect the overall performance
characteristics of the TWC system (Shi et al. 2015).
In addition to the major chemical mechanism, two more reactions, water-gas shift
reaction and steam reforming reactions have also known to commonly occur over the TWC
system. Under suitable rich operating conditions of the engine when there is oxygen deficiency
in the exhaust stream, favors unoxidized CO and HC to form CO2 and hydrogen (H2) (Barbier
and Duprez 1994; Ohtsuka 2015), and expressed by Equation ((4) and ((5) below. Precursor
NH3 is then generated over the catalyst in the presence of molecular H2 with available NO and
CO (Nagashima et al. 2000), expressed mainly by the Equation (6) and (7).
CO + H2O CO2 + H2 (4)
CH4 + 2H2O CO2 + 4H2 (5)
2NO + 5H2 2NH3 + 2H2O (6)
2NO + 2CO + 3H2 2NH3 + 2CO2 (7)
From the above-mentioned reaction mechanisms, it shows that NH3 formation over the
TWC is a chain effect of species and their kinetic behavior, and significantly impacted by varying

8
AFR, either fuel rich combustion or oxygen rich combustion. Hence, different operating
conditions lead to NH3 formation at different levels, which are reviewed in more details in the
following sections.
2.2 Ammonia emission characteristics in stoichiometric natural
gas vehicles with TWC
Ammonia formation mechanism have not been well studied in stoichiometrically
operated heavy-duty natural gas engines equipped with a TWC system, however there have been
multiple studies evidently showing high ammonia emission levels from such engine
configuration and similar TWC system used in gasoline applications. These studies have shown
that the characteristics in ammonia production is significantly dominated by engine operating at
different AFR regime mainly to meet the required load demands and hence, directly affecting
the amount of NH3 being produced over the catalyst (Defoort, Olsen, and Willson 2004). Figure
1 shows an example of how AFR impacts the dynamics of different species along with NH3
emission observed after a TWC operated in a gasoline engine application. According to the
chart, the highest levels of TWC out NH3 occurs close to stoichiometric region in a typical
gasoline engine exhaust.
Figure 1. Effect of AFR sweep on NH3 formation over a TWC fir gasoline engine source (Li et al. 2010)

9
From the point of power demand during on-road activity, driving behavior have shown
as an influenceable factor in higher ammonia emissions seen from natural gas and gasoline
sourced engines. Detailed emission measurement studies have shown that aggressive driving
patterns or hard acceleration events result in high NH3 peaks in the exhaust (Huai et al. 2003).
Sudden power demand with high acceleration corresponds to have richer AFR indicating
sharper excursions in NH3 produced after the TWC. Recent studies conducted by WVU, also
tend to evidently report such cycle trends in peak NH3 emissions (Thiruvengadam et al. 2016).
The study measured NH3 concentration using Fourier Transform Infrared Spectroscopy (FTIR)
analyzer from various natural gas transit buses and the study reported elevated levels of NH3
concentration, as high as 800 ppm, mainly produced during acceleration events as depicted in
the Figure 2 (NH3 formation observed only when the vehicle is in motion). In addition, studies
have also shown high levels of NH3 emissions due to significant change in road grade, in
instances where NH3 emission factors almost doubled when the road grade was increased from
0 to 7% (Sun et al. 2016).
Figure 2. NH3 emission from a transit bus natural gas vehicle (Veh 4) over UDDS test
(Thiruvengadam et al. 2016)
In extension to the aforementioned WVU study that also tested similar natural gas
vehicles having different accumulated vehicle mileage evidently showed higher brake-specific
NH3 emissions, indicating vehicle age as a crucial factor. Figure 3 obtained from the study
presents brake specific NOx and NH3 emissions for five different natural gas vehicles with two
specific types of vocational application (Thiruvengadam et al. 2016). All five vehicles equipped
with TWC system as the after-treatment technology were tested on a heavy-duty chassis

10
dynamometer over the Urban Dynamometer Driving Schedule (UDDS) cycle. Results from the
study highlights the fifth vehicle (Veh 5 as referred in the Figure 3) having the highest
accumulated mileage, emitted the highest amount of NH3 emissions when compared to the
other four vehicles. The brake-specific NOx results obtained from this vehicle also appeared to
exceed the 0.2 g/bhp-hr USEPA 2010 NOx regulation levels for heavy-duty vehicle which was
still considered to be below its useful life standards (USEPA 2011). The chart also shows result
obtained from the fifth vehicle tested over real-world driving conditions which produced similar
amounts of NH3 emission than the same vehicle tested over the chassis cycle but exhibit lower
than 0.2 g/bhp-hr of NOx level.
Figure 3. NOx and NH3 emissions (g/bhp-hr) from five vocational natural gas vehicles (Thiruvengadam et al. 2016)
Thiruvengadam et al. indicated degradation of emission control, such as the aging of an
on-board feedback oxygen sensor could potentially cause sluggish response in the actual oxygen
measurement, which in return affects the fuel dithering. And, this imbalance in engine operation
control of the air-fuel ratio for the optimum TWC performance could lead to variability in
tailpipe NH3 emissions (Thiruvengadam et al. 2016). A study by Wang et. al specifically studied
the impact of oxygen sensor degradation on air-fuel ratio and emissions, and reported that a
small shift in the signal from the oxygen sensor, for example, weather its upward, downward or
even a slight delay in the sensor response, would deviate the conversion of the HC, CO and
NOx to either increase or decrease (Dongliang Wang et al. 2011).
0
50k
100k
150k
200k
250k
0.0
0.1
0.2
0.3
0.4
0.5
0.6
Veh 1 Veh 2 Veh 3 Veh 4 Veh 5 Veh 5 (In-Use)
Odo
mete
r [m
iles]
g/b
hp
-hr
NOx
NH3
ODO
Goods Movement NG Vehicles
Transit Bus NG Vehicles

11
Additionally, extensive experimental studies have also shown degradation of TWC due
to catalyst aging, and are typically caused under chemical and/or thermal process of the TWC
over repeated use in time, affecting the overall performance of the catalyst. Matam et al. studied
the thermal and chemical aging in a model TWC with Pd/Al2O3 for compressed natural gas
vehicles exhaust and results showed that thermal aging leads to simply physical modification
such as decreased surface area and dispersion of the catalyst material (Matam et al. 2012). The
authors also highlights that physical modification clogs support pores along fouling of Pd
nanoparticles. On the other hand, chemical aging was shown to be more detrimental than
thermal aging for TWC performance, drastically decreasing the efficiency. The performance
activity for a TWC to start converting CO, HC and NOx above a certain efficiency greatly
depends upon the light-off temperatures of catalyst material used, and such effect has been
widely researched. For example, from a thermal aging study for a typical (Pd-Pt-Rh)
combination based TWC, significant differences were observed in performance between fresh
and aged catalyst (González-velasco et al. 2000). In this study it was shown that the light-off
temperatures tend to shift towards a higher temperature with an aged catalyst and also
considerably degrades performance in NOx conversion, as referred to the bottom right chart in
Figure 4.
Figure 4. Light-off curves corresponding to fresh versus aged TWC with different formulation (González-velasco et al. 2000)

12
Similarly, Sanatini et al. characterized the effects of aging on TWC, and reported aging
substantially affects the oxygen storage dynamics of the catalyst and hence, affects the overall
performance and formation of high NH3 emissions (Sabatini et al. 2016). The study mentions
the importance of monitoring the oxygen concentration after the TWC to better understand the
oxygen storage dynamics and proposes using a post lambda sensor as a good aging indicator. In
order to better optimize oxygen storage capacity of the catalyst, loading interaction between Pt-
Rh and Pd-Rh in the TWC have contributed to be a major factor in achieving high performance
even after extensive thermal aging (Nagashima et al. 2000). In addition to formulation loading,
optimization of the substrate material such as alumina and Ce, also helps in compensating the
high mobility of Pt at the high aging temperatures. Effects of Sulfur poising have also been
studied for TWC activity which shown the degrade the TWC performance. Ohtsuka et. al
examined Pt-Rh/CeO2-Al2O3 TWC aged with SO2 under 400-500ºC temperatures operating
conditions, and presented results indicating significant decrease in performance activity,
especially CH4 conversion (Ohtsuka 2015).
2.3 Health and environmental effects of ammonia emissions
Gas-phase ammonia has shown to contribute to the formation of airborne particulate
matter (Renner and Wolke 2008). Research in this area has indicated that ammonia in ambient
air neutralizes nitric and sulfuric acid to form ammonia nitrate (NH4NO3) and sulfate
(NH4)2SO4, a two important components contributing to airborne fine particles or PM2.5
(Tengyu Liu Boguang Wang, Xiang Ding, Wei Deng, Sujun Lü, Yanli Zhang 2014). These
secondary formed particulate matter in the atmosphere have been examined by many
researchers and institutions, and tend to show risk factors pertaining to human health (Suarez-
Bertoa, Zardini, and Astorga 2014). As has been stated by International Agency for Research
on Cancer, a part of the World Health Organization (WHO), particulate matter are the major
constituents of outdoor air pollution and can cause cancer in humans (IARC 2013). In addition
to human health effects, secondary ammonia also impact terrestrial vegetation (Krupa 2003),
and threatens ecosystem health by contributing to critical amounts of nitrogen in remote
ecosystems (Sun et al. 2016).
Although studies have shown that exposure to ammonia at environmental concertation
is unlikely to have direct adverse effects on human health, however, exposure to high
concentration could cause irritation of the eyes, nose and throat as well as burning of the skin

13
from direct contact. Ammonia, even at low concentrations, when released into air gives
unpleasant odor, but most notably harm vegetation, particularly at high concentrations (Krupa
2003). On the other hand, ammonia in water bodies causes more serious harm due to the toxicity
to aquatic organisms.
2.4 Use of SCR technology for NH3 storage and reduction
The use of SCR catalyst technologies have widely been investigated and proven to be
an effective technology in removing NOx emissions from modern automotive vehicles
equipped with compression ignited diesel engines (Tennison, Lambert, and Levin 2004; Johnson
2009; D. W. Stanton 2013; Nova Enrico 2014; Delgado and Muncrief 2015; Franco S.
Francisco; German, John; Mock, Peter 2014). As widely adopted technology to reduce majority
of the engine-out NOx emissions, large numbers of heavy-duty vehicle manufactures have also
utilized engine-based control strategies in addition with the SCR system (D. Stanton, Charlton,
and Vajapeyazula 2013). Engine-based strategy such as the exhaust gas recirculation (EGR)
technology has provided manufactures in further meeting the stringent NOx emission standards.
Several studies have also demonstrated coupled after-treatment configurations with use
of a SCR system downstream of the TWC, typically in spark ignited direct gasoline engines to
achieve lean-burn fuel consumption benefits with NOx emission reductions (V. Y. Prikhodko
et al. 2016; Li et al. 2010; Theis, Kim, and Cavataio 2015; Guralp et al. 2011). Researchers Guralp
et al. demonstrated using a passive ammonia SCR system on an underfloor (U/F) SCR for
storage of ammonia which is produced by the close-coupled TWC systems (Guralp et al. 2011).
The study looked into oxygen tolerance and temperature requirements for the added SCR under
stoichiometric conditions using a lab reactor experiment, and found that oxygen concentration
was an important factor in order to get efficient NOx reduction over the catalyst. Based on the
findings that NOx reduction efficiency was very low in the absence of oxygen, researchers
experimented rich pulses operation where the SCR catalyst was able to store the ammonia
produced on the close-coupled TWC and during lean pulse, NO was reduced by ammonia-SCR
reaction over SCR catalyst. The study was also looked with use of combining with Deceleration
Fuel Cut-Off (DFCO) and lean-idle (LI) operation strategies with the passive-SCR integration
for fuel consumption improvement. The result indicated that in urban section of the FTP fuel
consumption improved by 8.9% and additional improvement with a total of 11.1% when lean-
idle strategy also enabled. The work also highlights the benefits of using passive-SCR for

14
stoichiometric application where the TWC can benefit from PGM loading requirements,
performance improvement under varying operating strategies, increasing flexibility of air-fuel
control and simplicity in the control techniques.
Study conducted by Prikhodko et al. demonstrated a 2.0L lean burn gasoline direct
injection (GDI) engine utilizing a TWC system as an onboard NH3 producer, acquired during
periodic rich engine operation and subsequently storing NH3 over a SCR (Cu-based) catalyst
(V. Y. Prikhodko et al. 2016). The stored NH3 in the catalyst brick was then allowed to react
with brief high levels of unreacted NOx slipped through the TWC during lean combustion
operation. The study presented results of NOx conversion greater than 99% with the added
passive SCR system and fuel consumption benefit ranging between (6-11%) under certain
engine condition when compared with its baseline stoichiometric operation. On the other hand,
Prikhodko et al also studied a hybrid LNT+SCR system used to control NOx from a light-duty
diesel engine with in-cylinder regeneration controls (J. P. and V. Prikhodko 2009). The results
from the study showed that the NH3 formation increased strongly with extended regeneration
of the LNT and cycling he control to lean-rich parameters enables controlling the ratio of NOx
reduction between LNT and SCR catalysts. Additionally, the stored NH3 after multiple lean-
rich cycles can enable continued NOx reduction by the SCR the lean-rich period stops, assisting
in better optimization during transient operation.
General Motors (GM) have published few different papers demonstrating passive
ammonia-SCR system (PASS) indicating a potential low cost, simple and urea-free-system to
enable the implementation of lean-burn gasoline engines (Li et al., 2010, Kim, Perry, Viola, Li,
& Narayanaswamy, 2011). In the paper published by Li et al. showed NOx conversion efficiency
greater than 85% with passive SCR system for a 2.2L GDI engine. The experiments were
evaluated with two kinds of zeolite-based SCRs, Cu- and Fe- tested over New European Driving
Cycles (NEDC). On the other hand, the study published by Kim et al., indicated that the PASS
needs to be adequately optimized for the PGM loading and oxygen storage control for HC/CO
control during both stoichiometric and rich operations. Some of the key parameters the authors
mentions are the TWC wash-coat formulation that maximizes the efficiency of ammonia
generation under mildly rich operating conditions, SCR formulation that maximizes NH3
storage and thermal stability at temperature greater than 400ºC. Comparison on ammonia yield
and response time of a TWC and Pd/Al2O3 catalyst combined with a passive SCR catalyst under
dynamic engine operating conditions has also been investigated. It was observed that the yield

15
of ammonia under rich condition was able to be maximized by using minimal valve overlap and
an advanced spark timing, and additionally, use of low lambda values reduced the oxygen
content of the exhaust gas, raising the H2 content resulting in increasing trend of the rate of NO
conversion into ammonia. A study performed by Ford Motor Company also demonstrated a
TWC but combining a lean-NOX trap (LNT) and a SCR catalyst for lean NOx control (Theis,
Kim, and Cavataio 2015). The study showed equivalent NOx conversion and lower NH3
emissions, however, the approach resulted in higher fuel consumption due to LNT purge
requirement and/or to generate NH3 for the SCR as compared to TWC+SCR only system.
Additionally, the study also examined effect of sulfur poisoning on the combine configuration,
and indicates that the SCR catalyst does not significantly get affected by sulfur poisoning, but
the NH3 production and steam reforming capability of the TWC significantly degrades by sulfur
during continuous operations at temperature near 500ºC. The authors also indicate that the
closed coupled configuration would tend to remain in desulphated state with events caused
from hot rich conditions during cold start, accelerations, and high load operations.
2.5 NH3-SCR operation mechanism
The basis of SCR application in diesel exhaust and, the main chemical reaction that
occur over the SCR catalyst are provided by three main mechanisms. The first reaction provided
by Equation (8), interpreted as “standard-SCR” (Koebel, Elsener, and Madia 2001), between
NH3, NO and O2, where four mole of NH3 reacts with four mole of NO and one mole of O2
to produce N2 and H2O. However, due to low availability of oxygen present in a typical
stochiometric operated natural engine’s exhaust, the reaction would occur at much slower rate,
and potentially hinder NO to NH3 selective reduction reaction.
4NH3 + 4NO + O2 4N2 + 6H2O (8)
Subsequently, a faster known reaction (Bosch and Janssen 1988) between the reducing
agent NH3, and mixture of an even ration of 1:1 between NO2 and NO is given by Equation
(9). This reaction is also recognized as “fast-SCR” reaction.
2NH3 + NO + NO2 2N2 + 3H2O (9)

16
Conversely, the reaction is slower when NO2/NOx ratio exceeds 50% (Bosch and
Janssen 1988), and such reaction, solely with NO2 is provided by the following Equation (10).
8NH3 + 6NO2 7N2 + 12H2O (10)
In the SCR system, the ammonia decomposes on the catalyst surface and reacts with
NOx. The unreacted NH3 is stored in the catalyst through adsorption and the stored ammonia
is either further reacted with NOx and oxidized with O2 or desorbs from the surface. The
potential adsorption, desorption, oxidation and NOx conversion capability of the SCR catalyst
to the ammonia depends on temperature, surface area and catalyst loading (Haga et al. 2015).
For example, the amount of NH3 that can be stored in a SCR catalyst, decreases with rise in
catalyst bed temperature. Additionally, the storage capacity as a function of temperature also
tend to differ with the type catalyst formulation used. Eijnden et. al. showed zeolite based SCRs
can store higher levels of NH3 at lower temperatures than for a Vanadium based catalyst SCR,
and also indicates a non-linear behavior of storage with respect to temperature, as depicted in
Figure 5 (Eijnden et al. 2009).
Figure 5. Ammonia storage capacity for two SCR formulation as a function of temperature (Eijnden et al. 2009)

17
2.6 NH3-SCR activity dependency
The main target of the SCR system is the conversion efficiency of NOx, and this
efficiency highly depends upon multiple factors such as type of ammonia storage ratio, catalyst
material, NO-to-NO2 ratio, and most importantly the catalyst temperatures at which the
reaction takes place inside the SCR system (Keuper et al. 2011). Additionally, it presents that
above mentioned parameters have interdependency within each other for optimum SCR
functionality.
As reviewed earlier, the effect of temperature on SCR efficiency also depends on the
type of catalyst coating used. Different catalysts-based material within the SCR system have
varying light-off temperatures along with different temperature ranges for optimum catalyst
activity. Figure 6 compares the catalytic activity of iron-based (Fe), copper-based (Cu) and
vanadium-based (V) coated catalysts given by the symbols (), () and (•), respectively.
Figure 6. NOx conversion efficiency for vanadium-based and metal-exchanged zeolite-based SCR activity at varying temperatures under standard-SCR conditions
(Kröcher 2007)
A similar pathway could be approached towards a lean-burn natural gas engine
application, and catalyst formulations plays a vital role in the overall performance of converting
ammonia and NOx emissions. Based on different SCR formulation, the performance due to
lean-burn catalytic operation can be varied with temperature, in changing the catalysts light-off
temperatures (the minimum temperature at which the catalyst starts aiding the selective reaction)
and the optimum conversion temperature ranges, where the catalyst effectively reacts in
converting the targeted component (Colombo, Nova, and Tronconi 2010). In specific to heavy-

18
duty diesel market, Cu-zeolite and Fe-zeolite based and V-based are the two commonly used
base metal SCRs that are adopted (Skaf et al. 2014). However, the Cu-zeolite based catalyst
formulation are more dominantly used than compared to the other two due to its observed
lower temperature performance suitable for after-treatment activity seen in modern heavy-duty
diesel vehicles (Kamasamudram et al. 2010). In terms of their performances at different active
temperature ranges, Cu-zeolite based have operating range between (150-450°C), Fe-zeolite
based have between (350-600°C), and V-based have between (300-450°C) (Majewski 2005). On
the other hand, natural gas SI engines are typically known to operate at high combustion
temperatures resulting in high exhaust stream temperatures. From a recent on-road study
conducted by WVU with a 2013 CNG vehicle, show exhaust temperatures as high as 600°C
measured right after the TWC (Quiros et al. 2016). The zeolite-based SCRs seems more suitable
in high exhaust temperature activity of natural gas engines; however, it is to be noted that the
ammonia is a precursor of TWC reaction and its known to be generated irrespective to the after-
treatment state. Consequently, the ammonia storage capacity of the select SCR would be
considered as an important factor in selecting the right formulation of a passive reduction
system. A study performed by Frobert et al. indicated that the exhaust temperature, NO2/NOx
ratio, and air mass flow were the three main parameters that influenced the ammonia storage
characteristics (Frobert et al. 2009). Studies have also shown ammonia storage capacity tend to
be higher at lower catalyst temperatures and decreases as temperature increases (Li et al. 2010).
Li et al. specifically highlights results for Cu-zeolite based catalyst observing higher ammonia
storage capacity as compared to the Fe-zeolite based catalyst, however, both catalyst showed
ammonia storage at their lowest levels and an initiation of increasing trend in NH3 slippage
(desorption) at temperatures of 400°C and above.
In contrast to any specific SCR catalyst, the NH3 adsorption and desorption
characteristics highly depends upon factors like the gaseous concentration, catalyst surface
temperature and the exhaust flow rates (Zhao et al. 2011; Colombo et al. 2012; I. Nova 2011;
Keuper et al. 2011). Additionally, the SCR systems are highly nonlinear in behavior due to
transient operations, reaction kinetics and the nature of thermal effects on the catalyst brick
along with the catalysis processes occurring at different time scales (Figura et al., 2016)
(McKinley and Alleyne 2009; Skaf et al. 2014). In regards to different time scales, author Skaf
et al. distinguishes three time scales for an SCR system from a control point of view of NH3
dosing in their study (Skaf et al. 2014). From the three-time scale explained, the fastest time

19
scale (referred to as Quasi stationary) occurs during the transport and reaction in the gas phase,
which typically takes fraction of a second. The medium time scale (referred to as short term) is
due to catalyst state, where effects from NH3 coverage and substrate temperature dynamics
plays a role. And, then the third-time scale (referred to as long term) happens over long period
of time due to sensor and actuator drifts and catalyst aging. Therefore, various control
approaches have been exploited and implemented especially in performance of diesel after-
treatment devices which are oriented around the dynamics of the type catalyst system used and
the performance targeted.
2.7 Control strategies used in SCR applications
In effective utilization of urea-SCR control technology, several advanced control
techniques have been developed and studied for active urea dosage rates which are aimed at
highest NOx conversion targets and minimum NH3 slippage. Development of such SCR
controls related task require satisfying some of the key challenges of the complex after-treatment
system. The sections below reviews some of the control strategies and the development in the
research area of SCR control. The review also illustrates some of the control challenges,
especially in today’s modern heavy-duty after-treatment configuration and complexity of the
systems working together to keep NOx emissions below the enforced limits.
2.7.1 Traditional SCR control methods
The control techniques typically involve either a feedforward open-loop control or
feedback closed-loop control or combination of both architecture to improve the overall SCR
performance (Haga et al. 2015; Chavannavar 2014). As described by Haga et al., the open-loop
control technique which are considered as the conventional method in SCR control uses
variables obtained from model based state estimation generally summarized in table lookups or
maps which are defined either during offline (requiring calibration time) or even online (real-
time learning/adaptive) basis. These methods are simple and less complex to implement but
usually lack measurement error compensations causing inconsistency in catalyst performance
over its usage time (Skaf et al. 2014). Plus, majority of the open-loop control strategies are based
on the stoichiometric assumption of the SCR catalyst surface reactions which are limited due to
the fact that not all the reactions taking place on the surface are known or have been identified
(Chi 2009).

20
On the other hand, closed-loop control technique uses feedback from its output
quantity signal and, hence the control output becomes a function of the desired output error
compensation, giving a dynamic control over more transient system response. Closed-loop
based SCR control methods have become the prime technique in modern heavy duty after-
treatment technologies but are known to have its own challenges mainly due to its nature of
dependency in measuring accurate output signals as most of the time delivered from physical
sensors (Willems et al. 2007). Willems et al. mentions some of the major aspects that limits the
proper applicability of the SCR performance controlling technique which are seen from slow
catalyst dynamics, cross-sensitivity of the NOx and NH3 sensor to respective species, and time
delay in the urea dosage system. The author also discusses relevant control strategies conducted
via using combination of closed-loop along with open-loop control schemes as an integrated
controller where the open-loop control kicks in as a fallback strategy in the case of feedback
sensor failure. With similar approaches seen in SCR control systems, conventional controllers
such as close-loop Proportional-Integral-Derivative (PID) controller mechanism have also
widely been designed and implemented for error regime compensation along with including
feedforward and adaptive compensator to overcome some of the inherent variability in the
signal sources, model and hardware aging effects (Ong et al. 2010).
Furthermore, design challenges may include additional complexity underlying the
dynamic changing process of the system and, eventually require rigorous tuning/calibration of
the PID parameters of the control response, taking into account the control stability and the
nonlinearity dependency on the temperature of the catalyst. The robustness of the closed-loop
urea-SCR controllers greatly depends upon the feedback signal and its response to different
transient behavior, in case of occurrence of over-dosage of urea and therefore, proper NH3 slip
detection is critical.
2.7.2 Model-based SCR control
The characteristics of the SCR dynamics due to reaction kinetics, different catalyst state
at different time scales, and strong nonlinearities originated from chemical reaction and
temperature affect the adequacy of the control behavior. In a paper published by the Jiri Figura
(Figura et al. 2016), the author briefly reviews different model-based estimators from numerous
literature survey and identifies important set of features where the estimators have to satisfy in
order to adequately characterize the SCR system and its performance. For example, the

21
estimator needs to have moderate stability under feasible operating conditions, good steady-
state and transient estimation, robustness to modeling uncertainties and measurement over
different ambient and temperature conditions along with cost-effectiveness and low
computational complexity. The author also mentions some of the proposed techniques in study
and development of estimation of NOx concentration and NH3 coverage ratio. A better
dynamic operation model-based control has been shown using a state estimation via NH3
coverage ratio, which is not directly measurable but can be estimated from kinetic model.
Model-based SCR control strategy based on estimating the state of the SCR system has
been an effective methods in reducing design complexity, usually witnessed in classical
controller methods (Herman et al. 2009). The state feedback and state estimation control feature
with linear and nonlinear observer techniques have shown SCR control benefits than relying
only on inlet-out SCR NOx and NH3 values, and in majority has led to sensor reduction.
However, depending upon the inaccuracy of state estimation, such approach are known to
sensitive to disturbance and error accumulation which causes variation in the SCR control (Skaf
et al. 2014),. Simplified models on state estimation with assuming linearized SCR system, in
order to predict gas phase NH3 slip and catalyst ammonia coverage ratio has also been studied
(Upadhyay and Van Nieuwstadt 2006; Devarakonda, Johnson, and Parker 2012). Although such
approach works well within a narrow operating conditions of the SCR, their accuracies are
limited due to presence of nonlinearities, uncertainties and high variable disturbance (Skaf et al.
2014). Likewise, there have multiple studies using nonlinear models to estimate internal species
along with NH3 coverage ratio. Studies have shown to use different estimation technique using
non-linear models, such as sliding mode observer design for estimation of NH3 coverage ratio
with incorporating temperature and inlet and out NOx sensors signals but require a mid-catalyst
NH3 sensor to give robustness against the NH3 cross-sensitivity (M.-F. Hsieh and Wang 2011).
Similarly, Chen et al. proposed an alternative design which did not require the NH3 sensor and
estimated the mid-catalyst NH3 concentration with minimum NH3 cross sensitivity (Chen and
Wang 2015). Some studies have also utilized using Extended Kalman Filter (EKF) technique as
the nonlinear model estimator with different outlet sensor configuration with and without
considering NOx sensor cross sensitivity to NH3 (M. F. Hsieh and Junmin Wang 2010; Figura
et al. 2016). Numerous model-based studies have been considered with or even without using
physical sensors such as the NOx and NH3 sensors as these sensors tend to add cost to the
overall system (Chen and Wang 2014).

22
2.7.3 Control approach using Artificial Intelligence Techniques
Currently, artificial intelligent techniques have been gaining lot of attraction in
developing automotive virtual sensors mainly in the area of on-board after-treatment
diagnostics, delivering similar accuracy, dynamic performance and faster time response (Arsie
et al., 2013). Few examples of fuzzy-logic usage in automotive applications are: fault diagnosis
for engine vacuum leak detection (Lu et al., 1998), control methods for plug-in hybrid electric
vehicles (Ivanov, 2015), vehicle speed controller (Altrock, 1997), and more famously used in
active vehicle suspension systems (Jinzhi et al., 2002). Some vehicle manufactures have also
used it as engine-control solution in ECU architecture replacing some of the loop-up-tables
(Altrock, 1997). A study published by Jinzhi et al. also demonstrated using fuzzy-logic controller
with combination of other artificial technique such as GA-based optimization method for PID
tuning and NN for parameter estimation (Jinzhi et al., 2002).
Similarly, fuzzy-logic decision-making strategy has also been efficiently utilized for after-
treatment controls (Niewiadomski and Kacprowicz, 2014, Meierjurgen et al., 2013, Theodore,
2008). In the field of SCR control development, Fuzzy-Logic (FL) based control algorithm has
also been widely utilized in urea-dosage application (Soliman et al., 1998). In a thesis research,
carried out by Theodore R. Adams from WVU (Theodore, 2008), studied a controller design
developed for an open loop non-sensor based fuzzy logic urea dosage controller with employing
development of urea injection maps. The study presented results with more than 50% NOx
reduction over two different transient cycles with maximum NH3 slippage of 10ppm and less.
In a another study aimed at complete sensorless SCR system approach, two ANN was trained,
one for predicting engine out NOx using engine parameters and the other for predicting SCR
NH3 coverage ratio using a non-linear state-space plant model that simulated reduction
reactions in the SCR (Meierjurgen et al., 2013). A fuzzy-logic based controller was then
developed to control urea-dosing utilizing two inputs, consisting of the error function calculated
from the output NOx of ANN with predetermined NOx target and NH3 surface coverage
predicted from the second ANN.
The fuzzy-logic based control strategies can be designed for non-linear systems with just
basic minimum knowledge of depended multiparametric behavior of the desired system using
experimental experiences. This tends to reduce the complexity in decision-making mechanism
approach by applying data-driven engineering heuristics and makes the control logic qualitative
in nature.

23
2.8 Control-oriented model based on physical NOx and NH3
sensors
Utilizing in conjunction with one or multiple sensors in order to monitor SCR state and
activity have been common control approach, mainly in open-loop controls, in targeting
efficient NOx reduction as a result of adequate urea injection upstream of the catalyst. For
example, NH3 sensors has been used for pre-SCR ammonia concentration and mixing as a
feedback signal to controllers for urea-dosage purpose. Similarly, such method is also further
refined by including NOx signals monitoring NOx downstream of the SCR catalyst as an
additional feedback signal. Combination of using NOx sensor pre-and-post of SCR also
provides advantages, especially in the OBD applications. The flexibility and performance of the
control related task also depends upon he integrity of the sensors used, for example, cross
sensitivity of NOx sensor to NH3 play a key challenge in effective SCR activity. The following
paragraphs reviews literature on using NOx and NH3 sensor for commercial SCR control
applications and their ongoing development in widely available model-based and adaptive
control techniques.
Similar to oxygen sensors, NOx sensors have been in development from early as 1990s,
and was commercially introduced in 2002 for gasoline cars and extended onto diesel SCR system
in 2005 (Jääskeläinen and Majewski 2016). The on-board applied NOx sensors have commonly
been working under the same principle based on yttrium-stabilized ZrO2-based electrochemical
sensing and have progressed over time on measurement ranges, accuracy and durability. Figure
7 provides the common layout of the working principle of the ZrO2-based NOx sensor used in
common exhaust path. NOx sensor manufactured by NGK and in partnered with Continental,
known as the UniNOx sensor, measures ranges of 0-500ppm or 0-1500ppm depending on the
application used for, with accuracy of ±10% at 100ppm to 500ppm and ±10ppm at 0 ppm
(NGK 2017).

24
Figure 7. Schematic of a NOx-ZrO2 sensor (Blanco-Rodriguez 2014)
Current NOx sensor measurement method has a major challenge, that is such sensors
are typically cross-sensitive to other nitrogen compounds at various levels. More importantly,
cross-sensitivity due to gaseous NH3 have shown to corrupt NOx sensing measurement and
varies with temperature (Zhang, Wang, and Wang 2015). This could potentially impact SCR
urea control dependent upon NOx sensor feedback to accurately control at dynamic conditions
of the exhaust. These could also lead to over or under dosing of urea, causing either urea cost
or impact catalyst performance. There have been studies on eliminating the NOx sensor cross-
sensitivity to NH3 and estimate actual NOx concentration using cross-sensitivity correction
factors, and typically modeled using the following expression (M. F. Hsieh and Junmin Wang
2010; Marins 2000):
𝐶𝑁𝑂,𝑠𝑒𝑛𝑠𝑜𝑟 = 𝐶𝑁𝑂∗ + 𝐾𝐶𝑆𝐶𝑁𝐻3 (11)
where, 𝐶𝑁𝑂∗ is the actual NOx concentration, 𝐾𝐶𝑆 is the cross-sensitivity factor, and
𝐶𝑁𝐻3 is the actual NH3 concentration. The model is used in predicting the actual NOx
concentration using the sensor model as expressed above. The 𝐾𝐶𝑆 cross-sensitivity factor is
obtained using ammonia measurement. The authors address that the level of cross-sensitivity
factor changes and varies between sensors. It shows that sensor aging causes inaccuracy in the

25
factor, slowly with time, and becomes a challenge to develop models to adequately. Design
based on Extended Kalman Filter (EKF) was proposed in the study to estimate NOx
concentration and cross-sensitivity factor based on approximated model and the stochastic
character of signals. Results obtained on FTP75 test cycle indicated the approach to accurately
eliminate cross-sensitivity error caused by presence of ammonia and able to predict actual NOx
concentration. In a recent study, the same authors utilized a different approach to remove NOx
sensor ammonia cross-sensitivity from measurement in diesel SCR systems (Zhang, Wang, and
Wang 2015). The study evaluates using H2/H∞ approach, a design for gain-scheduling strategy
consisting of an adaptive compensation for the existing nonlinearities and the involved time-
varying parameters of the SCR model. Experiment results from the study indicated that the
proposed model performed better over the EKF on estimating the cross-sensitivity of NOx
sensor to ammonia, as shown in Figure 8. Additionally, EKF approach was also found to be
slower than the alternative proposed method.
Figure 8. Performance of NOx sensor NH3 cross-sensitivity factor using different error estimation designs (Zhang, Wang, and Wang 2015)
NOx sensors have also been used to estimate NH3 concentration without requiring NH3
sensor through cross-sensitivity correlation between NOx and NH3. A method based on two
NOx sensors with different temperature dependent NH3 cross-sensitivity characteristics at the

26
SCR outlet was proposed to estimate also the SCR-out NH3 concentration (Chen and Wang
2015).
Figure 9. Schematic of NH3 sensor based on non-equilibrium electrochemical sensing principle (Moos et al. 2002)
Application of using NH3 sensors have also been widely used for measure NH3
concentration and provided benefits in developing robust SCR feedback control. The developed
control strategies have also been used in conjunction with model-based approach in estimating
NH3 storage capacity of the SCR as such storage characteristics is not directly measurable but
including it in models benefits in state-estimation of the SCR under time and temperature
dependent non-linear dynamics of the system. There have been only limited commercially
developed NH3 sensors in market, operation based on a non-equilibrium electrochemical
sensing principle where the sensing element used co-fired zirconia and alumina layers with NH3
sensing, a Pt reference electrode and an integrated heater circuit (Moos et al. 2002). Figure 9
presents a schematic of a commercially available NH3 sensor. Typically, the NH3 sensors are
used post-SCR to detect any ammonia leak, and are designed to detect the range of ammonia in
the exhaust. NH3 sensor designed by Delphi, has a measurement range of 0 to 100ppm with a
tolerance of ±5ppm NH3 at 10 ppm range (D Wang et al. 2007). However, these sensors are
observed to be relatively insensitive to interference from nitrogen compounds and along with
HC and CO but are reported to sensitive to interference from water and oxygen (D Wang et al.
2007). According to the study conducted by Wang et. al with the Delphi NH3 sensors, the water
and oxygen tend to have inverse interference effect to the NH3 sensor. But at narrow range of
water and oxygen in the exhaust, self-compensation effect is possible and is also possible with
model based correction using air-fuel ratio and air humidity information. Ongoing work is being

27
done for NH3 sensors for real-world applications and alternative technologies are being looked
at by the industry and different research institutes.
2.9 Summary
When compared between diesel versus natural gas fueled vehicles in heavy-duty
transportation application, diesel vehicles significantly dominates the market share (Delgado
and Muncrief 2015). However, future demands in low fossil fuel dependent and low emission
emitter vehicles are causing a trending technology shift, consequently resulting in popularity in
the alternative fueled natural gas vehicles (Stanton, 2013). From a 2016 statistics data reported
by the NGV Global, the natural gas powers roughly 24.4 million vehicles worldwide and
projected to reach more than 30 million by the year 2024 (NGV Global 2017). Based on
Stanton’s review on development of efficient and clean engines to meet future GHG norms, an
estimated 11.9% average annual growth rate is projected between 2011 and 2040 in the US. The
growth in the use of heavy-duty natural gas vehicles in the US has been seen largely in centrally
fueled fleets attributed by increasing domestic fuel availability and fueling stations along with
increasing vehicle procurement incentives provided at different state and federal levels. Natural
gas vehicles equipped with TWC system have shown to produce elevated levels of precursor
ammonia emission. Gas-phase ammonia was considered to be a critical atmospheric pollutant
contributing to the formation of airborne particulate matter (Renner and Wolke, 2008),
threatening the ambient air quality and predominately effecting both human health (Krupa,
2003) and the ecosystem (Sun et al., 2016). The current regulation for heavy-duty engines
excludes ammonia emission as a regulated criterion, however for the reasons discussed above
there is critical need for ammonia reduction from heavy-duty stoichiometric natural gas vehicles.
The literature survey was conducted to identify a viable pathway in mitigating tailpipe
NH3 emission produced in stoichiometric natural gas engine. Application of SCR technologies
were reviewed in modern-heavy-duty diesel applications along with gasoline fueled engines to
increase fuel benefits from lean-burn operation. However, exhaust temperature becomes a key
challenge in maintaining overall performance of the SCR depending on the type of catalyst used.
As catalyst formulations observed to be a key factor in NOx and NH3 performance over
different temperature range, the study reviewed the three-major catalyst formulations used in
SCRs. Furthermore, the study considered reviewing different traditional and AI based SCR
control techniques which can be potentially utilized in developing active regeneration strategies

28
to lower NOx and NH3. Finally, the study reviewed NOx and NH3 sensors from both, a physical
sensor and estimator (virtual sensor) standpoint which are used for controlling the proposed
passive-ARC system activity.

29
CHAPTER 3 Experimental Setup
This chapter provides the general overview of the experimental setups, instrumentation
and specifications used during the study. All measurement of the study presented herein were
conducted at the Engine and Emissions Research Laboratory (EERL) at West Virginia
University. The EERL is a part of West Virginia University’s Center for Alternative Fuels,
Engines and Emissions (CAFEE) and the transient engine dynamometer test cell is designed
and operated according to recommendations set forth by Code of Federal Regulations (CFR),
Title 40, Part 1065 (USEPA). It is to be noted that different sections of the experiments, herein,
were conducted at different time due to unavailability in laboratory space and instruments
required for the study. The following sections outlines details in experimental setup and
procedure in order to meet the study’s objectives.
3.1 Test engine specification
The after-treatment system analysis conducted using a stoichiometric natural gas engine
on a heavy-duty engine dynamometer under controlled laboratory conditions. The study
procured a commercial natural gas engine with its stocked after-treatment configuration as
provided in Table 1 below.
Table 1. Test Engine and After-treatment Specification
Manufacturer Cummins
Model [MY] ISL-G280 [MY2008]
Capacity 8.9 Liter
Rated Power 280 hp @ 2200 rpm
Engine Hours 13,800 hrs
Fuel Type [Storage] Natural Gas [CNG]
After-treatment System Three-way catalyst (TWC)
After-treatment Strategy Stoichiometric Combustion + Cooled EGR
Engine Family 8CEXH0540LBD
NOx/PM Standards [g/bhp-hr] 0.20/0.01 USEPA 2010 compliant
The Cummins ISL-G engines have found to be heavily used in urban fleet vehicles with
major vocational application such as transit buses, refuse and food/beverage delivery trucks.
The developed Cummins natural gas engine show significant advancement over other previous
model year engines, in terms of fueling technology and after-treatment performance. The study

30
used a 2008 model year Cummins ISL-G engine with baseline specification of 280hp rated
power at 2200 rpm. The engine consisted of stoichiometrically fueling strategy with cooled EGR
and was equipped with a TWC configuration which were manufacturer certified to comply to
the USEPA 2010 emissions norms. The study also considered an older model high mileage
vehicle to investigate the ranges (NOx and NH3) of emission characteristics as observed from
WVU’s prior experience in testing natural gas vehicles. From ECU interrogation, the engine
showed approximately 13,800 hours of operation before the experimental study.
3.2 Engine laboratory setup
The procured Cummins ISL-G engine and the stocked after-treatment system
originated from a Class-8 transit bus application vehicle, and was integrated to the engine
dynamometer setup at EERL. The baseline engine experiments were conducted on a 500 HP
DC engine dynamometer capable of engine speeds up to 2500 rpm was used for the
experimental study and the baseline (engine + TWC) setup is shown by Figure 10. Due to
unavailability of the 500HP dyno during the SCR evaluation, a 300HP AC engine dynamometer
capable of engine speeds up to 3000 RPM was used for the remainder of the study. The baseline
setup with the added SCR system is shown in Figure 11.
Figure 10. Baseline Cummins ISL-G test cell setup
TWC
System
ISL-G Engine
CNG Fuel
Regulator
CNG Fuel
Tanks
Engine
Exhaust Out
Shaft linking
dyno and engine
TWC Exhaust
Out

31
The test engine was coupled with the test cell dynamometer via a universal joint
dynamometer shaft adapted to the engine flywheel. Throttle input and speed control were
provided using WVU CAFEE’s in-house engine dynamometer test cell software. CAN bus
communication with SAE J1939 protocol was used between the test cell controller and the
engine control unit ECU. The study conducted engine mapping procedure in order the map the
engine to its rated power and torque, and verify proper functionality of the engine. Constant
monitoring of the engine and after-treatment fault codes were also made to insure no fault
detection detected during operating of the integrated systems.
Figure 11. Cummins ISL-G (TWC+SCR) test cell setup
3.3 Gaseous emission measurement system using FTIR
analyzer
There are numerous methods and systems commercially available in the current market
to analyze various levels of constituents of gases in the exhaust from combustion sources. In
order to characterize the exhaust species as raw measurement, the study utilized the MultiGasTM
2030 Fourier-Transform Infrared Spectroscopy (FTIR) continuous gas analyzer. The FTIR
works in the principle of adsorption spectroscope and measures high spectral resolution data
over a wide spectral gas range which had the gas speciation capability of 20 different exhaust
Passive-
SCR
TWC

32
species at a time. The FTIR consist of two infrared beams which originates from the same
infrared source but sent to two different optical paths that varies in beam frequency, where one
beam gets reflected onto a fixed mirror and the second onto a vibrating mirror as shown in the
Figure 12. The combined beams are then passed through the gas chamber or cell where the gas
molecules absorb energy at different levels based on spectral distribution of the molecules.
Finally, the beam exiting the chamber is sent back to the detector to yield an interferogram.
Fourier-transformation, a mathematical method is then used to obtain the intensity distribution
of the interferometer as a function of frequency and wavelength. Intensity distribution in the
infrared adsorption spectra of different gases are calibrated and given by the manufacturers and
concentration of each gas measured during the continuous sampling are obtained using the pre-
loaded calibrations.
Figure 12. Schematic diagram of an FTIR interferometer (Sanchonx 2017)
The FTIR used in sampling the exhaust gases measured concentrations at 5
measurements per second (5Hz) at parts per million (ppm) level. A pre-calibrated natural gas
method obtained from the manufacture was used which typically consist of traditional emission
components with ranges observed in natural gas engine exhaust. Since, the major objective of
this study was to characterize NH3 and NOx before and after the after-treatment systems, the
FTIR additionally had the capability of also measuring complete speciation of oxides of nitrogen

33
compounds, such as NO and NO2. The analyzer did not measure monoatomic molecules such
as O2 and N2, that’s also present in the exhaust.
In order for the FTIR to continuously sample and measure emissions under transient
and steady-state engine operating conditions, a sampling setup was built to draw part of the
exhaust at a flow rate of (10-12) liters per minute and maintain the FTIR’s cell pressure close to
1atm (as per manufacturers specification). Figure 13 provides the FTIR instrument with the in-
house built sampling setup. The setup consists of a dual head diaphragm pump, which was
specifically used to minimize sample pulsation and provide low flow characteristics required by
the analyzer. The entire sampling lines carrying the exhaust gases entering and exiting the FTIR
were controlled and maintained at 191ºC temperature specification to avoid sample
condensation. Additionally, the sampling setup also included a heated filter which was
maintained at 191ºC temperature. The heated filter was used to capture any solid particles
entering the FTIR gas chamber to avoid beam obstructions. More detailed information of the
FTIR specification used in the study are provided in APPENDIX A.
Figure 13. FTIR sampling setup
3.4 Gaseous measurement system using CVS method
The study also utilized the EERL’s gaseous emission measurement system designed to
be capable of measuring continuous engine exhaust under Constant Volume Sampling (CVS)
FTIR Sample
OutFTIR
Sample In
Sample from the
Exhaust
FTIR Back
Panel
Sampling
Pump
FTIR Front
Panel
Temperature and
Flow Controller
Box
Nitrogen for
zero-air

34
method. Under this method the gaseous exhaust emission were measured on diluted basis using
a full-flow constant volume sampling dilution tunnel as recommended by the Code of Federal
Regulations, Title 40, Part 1065 (CFR40/1065/SubB 2017). The schematic of the gaseous
sampling setup using CVS system is shown in Figure 14. The diluted samples are extracted from
the dilution tunnel and routed via 191ºC maintained heated line into the gaseous emission
gaseous analyzer. Regulated gaseous emissions, including CO, THC, NOx as well as CO2, NO
and CH4 were measured using a Horiba® MEXA 7200D automotive emissions analyzer system
which is also shown in the schematic below. The analyzer uses methods such as non-dispersive
infrared (NDIR) to detect CO and CO2, chemiluminescence for NOx and NO, and heated-
flame ionization detector (HFID) for THC and CH4. The analyzer system did not have the
capability of detecting NH3 emission. CO, CO2, NO and NOx are measured using dry method
(removes water in the sample using chilled mirror maintained below sample dewpoint), whereas
THC and CH4 are measured wet. All analyzers were verified for operation as per Code of
Federal Regulations, Title 40, Part 1065, Subpart D (CFR40/1065/SubD 2017) including
manufacture’s specifications.
Figure 14. Schematic of dilute gaseous measurement system using CVS method
3.5 Engine lean-ON operation control setup
The tested stoichiometric engine used an oxygen sensor feedback signal to control the
engine AFR. Since there were no access over the engine’s ECU parameters, the study used an
external signal that was designed to provide necessary feedback signal to the ECU in order to
operate the engine into a modified AFR ratio when compared to baseline operation. This was
performed by intercepting the original O2 sensor signal using an external hardware-in-loop (H-
TPM
Filter
Holder
Vacuum Manifold
Horiba
MEXA 7200D
THC CH4
NOx NO
CO CO2
DiluteBag
Back-ground
Bag
Clean Dilution Tunnel
Var iable Speed
Blower
Sub-Sonic Venturi
CVS
Heated Probes and
Sample Lines
Mixing
Orifice
HEPA Filtered
Dilution Air
Engine
Exhaust

35
I-L) setup built for the study. The H-I-L setup basically consisted of using an Arduino DUI
board with a relay shield and a National Instrument’s (NI) multifunction I/O USB DAQ device
(provide in Figure 15). The breadboard was used to connect pins between the Arduino, NI
DAQ and the engine’s O2 sensor signal wires.
Figure 15. Manual lean-ON hardware control setup
Figure 16 presents the schematic showing the technique used in manually switch
between the modified (shown by the blue signal) and the on-board O2 sensor signal (shown by
the red signal). The Arduino board was used to code the voltage profile signal curves and a
relay switch (added Arduino’s Relay Shield) on the Arduino board was incorporated to switch
between the baseline signal and the modified signal voltages. The power to switch the relay
control was provided by NI’s USB-6009 DAQ device and manually trigger using NI’s device
monitor, also shown in the schematic (referred to Figure 16). The stoichiometric engine utilized
a narrow-band O2 sensor as a feedback signal which typically generates up to about 0.9 volts for
fuel rich mixture and about 0.1 volts for fuel lean mixture based on the exhaust oxygen content.
Although, different manufactures use different air fuel ratio strategy to dither the exhaust O2
sensor signal between the two voltages with certain amplitude and frequency, the study used
dithering method with constant voltage of 0.8V to approximate rich AFR condition and 0.2V
for lean AFR condition, which were selected based on ECU reading using Cummins INSITE
NI s
Multifunction
I/O device
Breadboard
Arduino DUE
with Relay Shield

36
engine diagnostic tool. The desired engine lean AFR operation was obtained based on the profile
of the modified signal. Providing a dithering profile with higher duration of 0.8V and a lower
duration of 0.2V converted the engine’s ECU to interpret the engine’s operation to be at rich
side, hence eventually shifting the AFR to a leaner operation. Time of 2000ms for rich-duration
and 500ms for lean-duration were found appropriate for the lean-ON operation trigger which
was also based on observing the engine stability. High engine power fluctuation due to due
fueling destabilization was the main visually inspected criteria used in maintaining the engine
stability during the lean-ON operations.
Figure 16. Schematic of manual lean-ON control setup for intercepting on-board O2 sensor signal to the ECU
ECU
NI USB-6009 DAQ Module
Lean-ON ProfileO2 Signal Wire
0.8 V
0.2 V
Rich Duration
[sec]
Lean Duration
[sec]
TWC
On-board O2 Sensor
Engine exhaust
Arduino DUE Module
User Interface for manual lean-ON off and on
control and data visuilization
Relay Switch
Voltage Trigger

37
CHAPTER 4 Approach
The study evaluated a stoichiometric natural gas engine equipped with a TWC system
for emission performance, and investigated feasible pathways required to control precursor
ammonia emission observed from such vehicles. This chapter presents and discusses the studies
approach in evaluating a 2008 Cummins ISL-G engine equipped with a stock TWC system and
analysis required to investigate a SCR system to capture NH3 emission downstream of the TWC.
To minimize slippage of NH3 from the proposed passive-ARC catalyst, the study extends its
work with an engine based control strategy. The chapter further details the studies approach in
estimating NH3 emissions after the TWC during different engine operating conditions and
NOx/NH3 and NH3 storage capacity from the stand-point of control-oriented and sensorless
based application.
4.1 Baseline after-treatment evaluation
The baseline engine performance with the TWC system was evaluated under engine’s
dynamic operation to better understand the secondary NH3 production characteristics. Figure
17 depicts the schematic of the baseline experiment setup required for conducting the baseline
engine plus TWC combined system. Inlet and outlet exhaust gas path of the TWC was
instrumented with k-type thermocouples for temperature measurement. Two FTIR analyzer
were setup to sample and measure up to 20 different exhaust constituents before and after the
TWC system. The exhaust outlet of the TWC was routed to the CVS dilution tunnel to evaluate
total emissions based on iterative carbon balance method for the baseline engine and after-
treatment configurations.
Figure 17. Schematic of the experimental setup for the baseline (engine + TWC) evaluation
Engine Out Exhaust
Engine
(Cummins ISL-G
280)
Engine
DynamometerTWC CVS Tunnel
LFEEngine
Intake Air
ΔP
T PabsCNG Fuel
Tank
FTIR Analyzer MKS MultiGasTM
FTIR Analyzer MKS MultiGasTM
Temp_pre_TWC Temp_post_TWC

38
4.1.1 Transient test cycles
For the dynamic evaluation of the baseline setup, two heavy-duty transient cycles,
Federal Transient Procedure (FTP) cycle and the World Harmonic Transient Cycle (WHTC)
were selected. The cycles consisted of 1208 seconds and 1800 seconds of engine operation for
the FTP and WHTC cycles, respectively. The normalized traces of the speed and torque profiles
are given by Figure 18 for the FTP cycle and by Figure 19 for the WHTC cycle.
Figure 18. FTP normalized speed and torque profiles
Figure 19. WHTC normalized speed and torque profiles
In the US, the FTP cycle is commonly used for regulatory emission testing of heavy-
duty engines, where the cycle was specifically designed to represents variety of heavy-duty truck
and transit bus driving conditions, typically seen in urban city roads and highways. On the other
hand, the WHTC cycles are used internationally as an engine dynamometer testing procedure,
and the cycle was designed to represents world-wild pattern of real heavy commercial vehicles.

39
The study selects these two cycles based on the two distinct characteristics observed between
the engine speed and load combinations. In specific to engine operating conditions, majority of
the FTP’s points operated at a higher speed of (70-100%) band width whereas for the WHTC
lie between engine speeds of (30-60%) band width, as depicted from the normalized points in
Figure 20. The two cycles would potentially result in different output results both in fueling and
emission characteristics. Additionally, also providing different range of temperature profiles
which would assist further in evaluating after-treatment performance. Actual engine speed in
rpm and engine torque in ft-lbs are calculated from the normalized FTP and WHTC profile
using maximum torque curves obtained during the engine mapping procedure. The motoring
torques were also corrected to simulate the actual engine friction torque obtained from the
engine-dynamometer motoring test procedure.
Figure 20. Normalized distribution of engines operating points for the FTP and WHTC cycles
4.1.2 Steady-state test matrix
For the steady-state evaluation of the engine and the after-treatment performance, the
study selected twenty mode engine operating conditions, where each mode was given four
minutes of stabilization time to reach a steady after-treatment state. A 20-mode test matrix was
developed from using methodology based on Design of Experiment (DOE) with a space-filling
design approach to obtained efficiently spaced operating points under the engines maximum
0
20
40
60
80
100
0 20 40 60 80 100
Torq
ue
Per
cent [%
]
Speed Percent [%]
HD FTP WHTC

40
torque curve (engines overall operating range). The space-filling design was generated and
analyzed using a statistical software called JMP®, where the approach efficiently characterizes
operating points for a wide area of operating modes within the engines given boundaries. Engine
speed and torque was used as two boundary parameters for the space-filling DOE design factor
which were segmented down into multiple levels after the normalization process. The design
efficiently selects a specified number of combination points (20-Mode) considering maximizing
the minimum distance between points within the space of the two-normalized speed and torque
boundaries. Figure 21 shows the 20-Mode points (labeled in circles) selected by the space-filling
DOE design under the maximum torque curve (shown by black curve in the figure). Along with
points within the engine’s operating region (area in grey), the test matrix also added four more
operating points (Mode 12, 16, 19 and 20) on the maximum torque curve.
Figure 21. 20 engine operating modes for steady-state evaluation
4.2 TWC+SCR after-treatment system evaluation
Different SCR systems downstream of the TWC exhaust were installed for the ammonia
reduction catalyst evaluation. A similar setup as described in Section 4.1 was used for the SCR
evaluation but the two FTIR’s were used to sample exhaust gases before and after the added
SCR system. Figure 22 depicts the schematic of the test setup for passive-SCR system. The

41
exhaust outlet of the SCR was routed to the CVS dilution tunnel for evaluating total emissions
of the combined engine and after-treatment configurations.
Figure 22. Schematic of the experimental setup for the (engine + TWC + SCR) evaluation
4.2.1 Types of SCR formulation
The study conducted five SCRs with three types of catalyst formulations that are
commercially used and well-studied in the field of heavy-duty diesel applications. Four canned
SCR catalysts were directly procured from two different catalyst manufacturers, i.e. Corning Inc.
and AP Exhaust. Only two type of SCR catalysts (Fe-based and V-based) were available from
the two manufactures. Since it was important for the study to also evaluate a widely used Cu-
zeolite based SCR catalyst by the heavy-duty OEMs, a stocked SCR system manufactured by
Cummins Inc. was also included in the list of tested SCRs. Based on the manufactures
specification, the Cu-zeolite based SCR catalyst which was directly procured from a heavy-duty
diesel vehicle consisted of a bigger volume catalyst. The specifications of the SCR catalysts
tested are provided in Table 2.
Table 2. List of five experimented SCR catalyst for ammonia reduction evaluation
SCR Number Manufacturer Catalyst Type Cell Density [cpsi] Volume [Lt]
SCR 1 AP Exhaust Fe- Zeolite 100 7.07
SCR 2 AP Exhaust Fe- Zeolite 400 6.39
SCR 3 Corning Fe- Zeolite 400 7.83
SCR 4 Cummins Cu- Zeolite 400 17.04
SCR 5 AP Exhaust V-based 400 6.39
Engine Out Exhaust
Engine
(Cummins ISL-G
280)
Engine
DynamometerTWC CVS Tunnel
LFEEngine
Intake Air
ΔP
T Pabs
CNG Fuel
Tank
FTIR Analyzer MKS MultiGasTM
FTIR Analyzer MKS MultiGasTM
Temp_pre_TWC Temp_post_TWCO2 Sensor
SCR
Temp_post_SCR

42
4.2.2 SCR evaluation test matrix
The study then selected one out of the five tested SCR formulation for the development
of the regeneration control logic and mode-based prediction, which are discussed in the
following sections. A specific SCR was selected based on the performance in NH3 and NOx
characteristics at different temperature ranges over the transient FTP cycle. NH3 storage
adsorption and desorption characteristics were evaluated within binned temperature ranges,
averaged over the three repeated FTP cycles. NOx conversion efficiencies were also evaluated
over the defined temperature bins.
The study further investigated the selected SCR as the passive-ARC candidate over
different steady-state operation with less number of modes as opposed to the 20-mode steady-
state experiments as detailed in the TWC evaluation. The steady-state modes were selected
representing the actual engine operation of the real world on-road vehicle activity. An on-road
data-set collected from a similar natural gas engine equipped in transit bus application conducted
for PEMS evaluation under a WVU CAFEE research program, was used to obtain specific
steady-state modes. Figure 23 depicts the engine speed and torque distribution concatenated
from multiple selected on-road tests which include low-to-medium vehicle speed urban-driving
to high-speed highway driving activity. Eight steady-state modes representing different engine
operation were picked from the engine speed-and-torque distribution based on a data clustering
method where the clustering algorithms adequately groups engine speed/toque combination
points to a desired number of groups. The k-mean clustering method was used for the grouping
of the points where the algorithm utilizes a heuristic data classification approach to gather the
data set into ‘k’ number of clusters based on the measure of single mean vector method. The
data set are assigned into the nearest mean (centroid of clusters) using the Euclidian distance as
a metric, where the sum of distances with respect to each data point in a cluster is minimized.
The result from clustering the on-road engine speed and torque distribution are shown in Figure
23, where the points (x) represent the centroid of each cluster (colored spheres), and a total of
eight clusters were selected for the study. The size and shape of the colored eclipses represent
the data density with 95% data coverage. The eight clustered central data points were considered
as the representative steady-state modes to be conducted using the same SCR evaluation setup
as discussed in the previous sections. Two-minute stabilization time was given for each mode
to have an adequate stable reading of both after-treatment temperatures and overall emission
constituents.

43
Figure 23. Transient bus real-world engine operation and 8-mode steady-state from clustering method
4.3 Fuzzy-logic based control method
This section provides the design overview of the engine-based control approach that
works on minimizing overall NOx and NH3 slippage after the passive-ARC system. With the
complexity of the approached configuration, a decision-making algorithm based on AI’s fuzzy-
logic controller was designed to trigger regeneration command for lean-operation in order to
meet two basic goals; (1) reduce ammonia slip from the passive-ARC system with induced NOx
regeneration (lean-ON modes) intervals, and (2) maintain low to zero NOx emissions over the
entire duration of operation. Hence, the controller needs to observe the SCR state in both NH3
and NOx slippage and provide a clear output for engine to operate lean air-fuel ratio.
MATLAB’s inbuilt fuzzy logic toolbox was used in order to design and setup the control
features of the fuzzy-logic algorithm (Mathworks 2016).
Under the boundaries of the above-mentioned objectives, the fuzzy-logic controller was
designed taking into consideration three input parameters; (Input-1) Ammonia Slip {AS},
(Input-2) Rate of Ammonia Slip {RAS}, and (Input-3) NOx Slip {NOS}. AS and NOS inputs
are obtained from direct measurement, whereas, the ASR is computed by taking the difference
of ammonia slip concentration between the NH3 concentration at (t) second and (t-n) second

44
in the continuous data. The “n” would be defined from observing the data’s response to avoid
high sudden peaks attributed due to signal noise. The output of the developed controller will,
hence, define the engine AFR status to either be on lean-ON status (NH3 regeneration) or lean-
OFF status (baseline operation).
The fuzzy-logic based controller consists of three main processes; fuzzification,
inferences, and de-fuzzification. Figure 24 provides the flow-chart of the fuzzy-logic’s decision-
making algorithm design for the study, and their detailed steps of the processes are discussed in
the sections below. The fundamentals and the approach used in developing the fuzzy control
were reference from MATLAB’s Fuzzy Logic ToolboxTM user’s guide (Mathworks 2016) and
handouts provided by Dr. Mario Perhinschi’s MAE565 AI Techniques in MAE class at WVU
(Perhinschi 2016). Snippets of MATLAB’s Fuzzy Logic ToolboxTM used in designing the fuzzy
logic controller are provided in APPENDIX B.
Figure 24. Flow-chart showing the fuzzy-logic based controller for controlling the passive-ARC regeneration status
SCR
Set of Inputs
{Ammonia Slip,
Rate of Ammonia Slip and
NOx Slip}
Conversion to
linguistic variables
Assigning linguistic
values
Fuzzification Inference
IF/THEN Rules
Composition of IF/
THEN rules output
Crisp Output
{Regeneration Status ON or
OFF}
De-fuzzification
Fuzzy-Logic Based
Controller

45
4.3.1 Fuzzification
Fuzzification is a process which takes crisp input from the input interface and converts
it into a fuzzy input sets. The three inputs (AS, RAS and NOS), also named as linguistic variables
in the fuzzy-logic terminology, are derived into three input domains having its own fuzzy sets,
that is defining the linguistic values for each linguistic variable and is provided in Table 3. The
linguistic values represent the nature of the linguistic variables and degree to which the crisp
measurements belong to each linguistic value is defined by membership function, as discussed
in the next section.
Table 3. List of linguistic variables and linguistic values Linguistic Variables Linguistic Values
Ammonia Slip (AS)
Negligible Slip (NS)
Small Slip (SS)
Moderate Slip (MS)
Large Slip (LS)
Rate of Ammonia of Slip (RAS)
Increasing (IR)
Constant (CR)
Decreasing (DR)
NOx Slip (NOS)
Negligible Slip (NS)
Small Slip (SS)
Moderate Slip (MS)
Large Slip (LS)
4.3.2 Membership function
In fuzzy-logic control theory, the membership function is designed to represent the
extent or degree to which a value of a linguistic variable belongs to a fuzzy set, i.e. linguistic
values. This maps the three input variables given in its respective membership function of the
linguistic values in relationship with the desired output. The shape of the membership function
is designed based on arbitrary numbers which are placed based on data range of the three
selected inputs. For this study, the values in approximating the linguistic values in shaping the
membership function is only obtained after conducting the SCR evaluation. The study elects to
utilize trapezoidal shaped membership function for the input linguistic variables. With the
trapezoidal shape, the end fuzzy sets of the linguistic values are shaped based on increasing and
decreasing type functions. Figure 25 depicts the shape of the membership function of the input
variables, indicating the trapezoidal functions with increasing and decreasing types and the
degree of overlap between the functions. On the other hand, the output function was given a

46
triangular shaped membership function. The output variable determines the regeneration status,
which is “Lean-ON” or “Regen-OFF”, and dictates a distinct mode to be on either of these
statuses. The lean-ON status was further defined to be in two separate modes, based on
dithering and defined as short-dithering (SD) and long-dithering (LD) as represented in Figure
26. As an engine-based control strategy to regenerate the passive-ARC system, the lean-ON is
set to a fixed dithering time instead of a feedback-loop based control strategy. For example, in
such event, the engine is continuously operated for a given time and the length of lean-period
is given in two types (short-dithering and long-dithering). This would potentially benefit in
transient operation which consist of hard-acceleration events, causing sudden emission peaks
and rise-rates. Additionally, this could also avoid potential control fluctuations in the controlling
the engine operation which are known to have response delays at different load demands.
Figure 25. Membership function shapes for three input linguistic variables and its values

47
Figure 26. Membership function for output variable
4.3.3 Inference engine
The inference engine of the decision-making controller generates the fuzzy commands
based on the inference rules defined in the design process using some understanding of the
after-treatment behavior. In considering the three linguistic variables and combination of (4, 3
and 4) levels of linguistic values for each linguistic variable, resulted in a total of 48 inference
rules that defined the regeneration status. All 48 input-output combinations of rules are
provided in Figure 27. Below are some examples of the decision statements (“IF-THEN” rules)
used in determining the conditions in the inference rules with respect to the three-linguistic
variable and its linguistic values to the three the outputs:
Example Rule: If ammonia slip (AS) is negligible slip (NS) and rate of ammonia is slip
(RAS) is increasing rate (IR) and NOx slip is negligible (NS), then regen status is off (Off)
Example Rule: If ammonia slip (AS) is large slip (LS) and rate of ammonia is slip (RAS)
is increasing rate (IR) and NOx slip is negligible (NS), then regen status is on and large dithering
(On-LD)
Example Rule: If ammonia slip (AS) is small slip (SS) and rate of ammonia is slip (RAS)
is increasing rate (IR) and NOx slip is small slip (SS), then regen status is on and small dithering
(On-SD)

48
Rate
of
Am
mo
nia
Sli
p (
RA
S)
IR On-SD On-LD On-LD On-LD
NS
NO
x S
lip
(N
OS
)
CR On-SD On-SD On-LD On-LD
DR Off On-SD On-LD On-LD
IR Off On-SD On-LD On-LD
SS CR Off On-SD On-SD On-SD
DR Off Off On-SD On-SD
IR Off Off Off Off
MS CR Off Off Off Off
DR Off Off Off Off
IR Off Off Off Off
LS CR Off Off Off Off
DR Off Off Off Off
NS SS MS LS
Ammonia Slip (AS)
Figure 27. 48 inference rule based matrix for fuzzy-logic output
Individual-rule based inference method was used for rule firing, to obtain the fuzzy
commands using the inference rule matrix. For given number of three inputs, we get three sets
of fuzzy input and using a composition rule method will provide in obtaining the membership
value associated to the intersection of the fuzzy set to the inputs. From fuzzy methodology of
logical operators in fuzzy sets, three definitions were considered for computing the intersection
region of the fuzzy set and are given by the relationships below:
i. Multiplicative definition:
𝑉1 ∩ 𝑉2 ∩ 𝑉3 = {𝑥 | 𝜇𝑉1∩𝑉2∩𝑉3(𝑥) = 𝜇𝑉1
(𝑥). 𝜇𝑉2(𝑥). 𝜇𝑉3
(𝑥)}
ii. Minimum definition:
𝑉1 ∩ 𝑉2 ∩ 𝑉3 = {𝑥 | 𝜇𝑉1∩𝑉2∩𝑉3(𝑥) = min [𝜇𝑉1
(𝑥), 𝜇𝑉2(𝑥), 𝜇𝑉3
(𝑥)]}
iii. Additive definition:
𝑉1 ∩ 𝑉2 ∩ 𝑉3 = {𝑥 | 𝜇𝑉1∩𝑉2∩𝑉3(𝑥) = 𝜇𝑉1
(𝑥) + 𝜇𝑉2(𝑥) + 𝜇𝑉3
(𝑥)}
The multiplicative and the minimum are the two most commonly used definitions of
intersection for control purposes, the minimum fuzzy set intersection method is the one utilized
for this study.

49
4.3.4 De-fuzzification
De-fuzzification, considered as the output interface, is the process of converting the
fuzzy commands into user defined crisp values, i.e. the regeneration status with command basic
command logic (On/Off) that can be executed by the ECU interface module. The uses the use
of fuzzification of clipped or scaled membership function for the output linguistic variables.
The study used “the middle of maximum” or basically the average of the maximum value of the
output set as the De-fuzzification method, due to the fact the only three statuses is executed by
the fuzzy output interface. The relationship of computing the states is given below by Equation
(12) and Equation (13). This entails the center of area under the curve from the aggregated
output of all the clipped fuzzy sets as depicted in Figure 28 and center of the maximum area is
selected as the regen status (example indicating fuzzy output of 0.25 with crisp output of Regen-
OFF).
𝑢∗ = 𝑐𝑖 𝑚𝑎𝑥,𝑗 𝑚𝑎𝑥 (12)
𝑑𝑖 𝑚𝑎𝑥,𝑗 𝑚𝑎𝑥 = max𝑖,𝑗
(𝑑𝑖𝑗) (13)
Figure 28. De-fuzzification of the fuzzy-logic output using middle of maximum method

50
4.3.5 Fuzzy logic control summary
In summary, the control algorithm approached consists of fuzzy-logic inferenced logic
features specifically designed to command engine based SCR regeneration using feedback from
only two sensor outputs, i.e. NOx and NH3 values after the SCR. Linguistic values of the fuzzy-
logic sets will be based on experimental profiles obtained from transient and steady-state test
conducted during the selected SCR evaluation. The analysis of this approach will focus on
validating closed-loop NH3 slip control along with meeting low NOx emission requirement.
Different regeneration duration (amount of time the engine is operated at lean AFR condition)
along with transient compensations will be looked at in order to understand the engine behavior
and the after-treatment response.
The fuzzy logic controller can also be designed with incorporating additional input
variables such as temperature and ammonia storage ratio for wider control of the regen events
even in the situation where there is no noticeable amount of ammonia slip with low levels of
NOx trace. This can be performed by monitoring the SCR’s state with estimation of high
ammonia storage conditions and brief lean-ON trigger can be initiated further extending the
control strategy under wider range of engine operation. Such approach could possibly provide
feasible robust control of a real time on-board NH3 generation and regeneration strategy.
Additionally, possibility of expanding the overall range of natural gas engine operation beyond
its tight stoichiometric regime to more lean burn operation. This leads into the work of mode-
based approach as discussed in the follow sections.

51
4.4 Model-based estimator methods
The intent of the following approach is to evaluate proposed after-treatment activity
models for estimating the state of the passive-ARC system, mainly in estimating NH3 storage
ratio along and NH3 concentration values outlet of the passive-ARC system. The study
investigates into evaluating after-treatment activity models, which can also be used as real-time
in-ECU basis for predicting NH3 concentration before and after the SCR system based on
various engine and after-treatment parameters.
Figure 29 illustrates the modeling schematic, depicting the two after-treatment models
(Model-1 and Model-2) with its input parameters (X1 to X7 shown by red arrows) and the
output parameters (Y1, Y2 and Y3) shown by the blue arrows). The Model-1 includes engine
plus the TWC as one combined system and estimates NH3 concentration post-TWC using eight
different engine and after-treatment parameters as model inputs. Whereas, Model-2 includes
only the SCR system model which will use pre-and-post SCR parameters, estimating post-SCR
NH3 slippage as the model output (Y2). Although not considered in the fuzzy-logic control
inputs, the study will also focus on estimating the NH3 storage ratio of the SCR catalyst. The
estimated NH3 (Y1) from the proposed Model-1 output is also used as input variable for Model-
2. The focus of this approach is to develop an SCR catalyst model which can be implemented
as a control-oriented model.
The study considers identifying major SCR kinetics that governs the characteristics of
reactions in both gas and solid phase species for NOx and NH3. Higher order SCR models have
shown to represent SCR systems dynamics accurately and has helped in the better control of
the urea-injection process in diesel applications. However, such approach in the vehicle
application could be computationally intensive, leading to impracticality in on-ECU real time
implementation. Therefore, these studies utilize reduce order models that were necessary to
identify the dynamic behavior of the SCR and was adequate to estimate model parameters. The
approach towards estimating NO and NH3 after the SCR is carried with step-by-step
identification of physical and chemical processes of species entering the SCR catalyst. From the
basic principle of the SCR operation, it was necessary to formulate model that uses mechanism
of ammonia of adsorption/desorption, reduction and oxidation of NO and NH3 over the
selected SCR catalyst.

52
Figure 29. Schematic of model-based NH3 estimation approach for the fuzzy-logic based controller
4.4.1 Post-TWC NH3 estimation method
Model 1 utilizes a data driven artificial neural-network (ANN) fitting methodology to
map the selected seven input parameters to estimate the NH3 concentration after the TWC
system. The ANN methods are known to be a good predictor when there is not enough
information to describe the functional form of a system response or the relationship between
the inputs and the output (De Cesare and Covassin 2011). Therefore, ANN has been a viable
tool and approach using data driven modeling in adequately predicting certain system output
even without understanding the exact mathematical and physical aspects of a system in relation
to factors influencing its complex behavior. Use of such techniques were formed from the
notion of how human brain’s networking architecture operates. Like multiple number of
Decision Making
& Regen Trigger
X4, O2 Signal [%]
TWC
Tailpipe
ENGINE
ARC
{Engine + TWC}
MODEL 1
Estimate post-TWC
NH3
X5, Pre-TWC Temp [°C]
X6, Post-TWC Temp [° C]
X1, Engine Speed [rpm]
X2, Engine Torque [ft-lbs]
X3, Engine Power [hp]
X7, NOx sensor [ppm]
{ARC System}
MODEL 2
Estimate NOx, NH3,
and ϴNH3
X7
X6
Y1, Post-TWC NH3 [ppm]
X8, Post-SCR Temp [° C]
Y2, Post-ARC NH3 [ppm]
Y3, post-ARC ϴNH3 [ppm]
INPUTS
CONTROLLER
Fuzzy Logic Based Controller Design
X9, NOx Sensor [ppm]

53
neurons in the brain transmitting information efficiently within different networks, the basic
architecture of ANN does consist of similar functional layers (analog to neurons and networks)
which process information with multiple inputs and outputs. Within such layers, there could be
multiple nodes or neurons and each neuron receives information from respective inputs or from
other neurons through networks or paths. And these paths are then modified with computed
weights through leaning process to achieve desirable outputs. In similar note, it approximates
arbitrary continuous functions with certain degree of accuracy, if the sets of dependent and
independent variables are known with adequate information of input and output data set (Prié
et al. 2015). The network of inputs-neurons-outputs or connecting input to output with hidden
layers of pathway are modeled with defined activation functions and the model can be used in
predicting the future behavior of the same system with certain accuracy.
Figure 30. Example flow model architecture of ANN with seven inputs, three hidden layers and one output
The selection of the seven input parameters were founded on the basic of influential
factors in characterizing the after-treatment system based on similar research studies and open
literatures. Figure 30 depicts the flow model of the neural-network (N-N) setup showing an
example of a network with connecting seven inputs with the single output using three hidden
layers. The study does realize that there could be additional high-impacting factors as input

54
parameters in the model which could potentially help in better estimating NH3 concentration,
but due to limited availability in ECU parameters, the study utilizes the readily available channels
and evaluates the accuracy level of prediction appropriate in using as an on-board control
feedback approach. Towards on-ECU implementation standpoint, it also becomes extremely
important in understanding the computational time utilizing such models and processing in real-
time application.
For the purpose of this study, a two-layer feed-forward function fitting network using
MATLAB®’s inbuilt ANN toolbox was used in evaluating and identifying different training
algorithms and appropriate network connection. Utilizing MATLAB’s step-by-step approach
helped to create, train and visualize models. The overview of the network flow obtained from
MATLAB®’s net is provided by Figure 31. The performance of the N-N architecture to fit the
target with the given sets of inputs depends on different network parameters. Based on work
conducted in the area of N-N, the two major parameters that tend to alter the network
performance is the size of the hidden layers and pre-defined training functions used.
Figure 31. MATLAB’s Neural-Network view
The study looks into evaluating different feed-forward based network architecture to
achieve improvements in training, if any, in the output estimation i.e. concentration of NH3
being produced by the TWC during transient and steady-state operation of the engine. The two
types of training algorithm used to evaluate the network are the Levenberg-Marquardt and
Bayesian Regularization functions. The first method, Leavenberg-Marquardt uses a
backpropagation (of errors) based algorithm to train and optimize weights and bias with
minimizing sum of square error (Mathworks 2017). Similarly, the Bayesian regularization is built
on using the Levenberg-Marquardt algorithm to optimize weight and bias values but additionally
uses error minimization technique using linear combination of squared errors and weights. Due
to the additional training computation in Bayesian Regularization backpropagation technique,

55
Levenberg-Marquardt is typically considered as a faster approach in generalizing networks. The
summary of the configuration chosen for evaluating the training of the N-N are given Table 4.
For the training of the models, the input-output data set is selected to be divided into three
subsets, training, validation and testing as also provided in the table. The present of the training
data set is used for computing the gradient and updating the network weights and biases,
whereas, the validation set is used for monitoring the error during the training process. It
essentially helps in understanding and avoiding potential overfitting of the data, if any during
the event of training and validating the input-output relationships. These are observed from the
mean-square error plots, where high deviation in the error between the training set and the
validation set starts to increase in differing paths. On the other hand, the third division, which
is the testing set’s error is not used during the training events and can be used to evaluate against
different trained models and data set. All the N-N properties in terms of training the model and
input-out fitting performance and results, will be evaluated in terms of computational time.
Table 4. Neural-Network Training Parameters
Number of Inputs 7
Size of Hidden Layers [10, 20, 30, 40]
Training Functions [Levenberg-Marquardt, Bayesian Regularization]
Data Set Division Training = 70%; Validation = 15%; Testing = 15%
As for the input-output data set, a transient FTP test is used to train the model initially
with the seven selected input parameters to estimate the transient NH3 production after the
TWC. As the computational time of neural networks are known to increase with using higher
number of input parameters, the study also considers examining the cross-correlation between
the input and output parameters to eliminate the number of inputs in the overall modelling
approach.
4.4.2 Post-SCR NH3 estimation method
Model 2 utilizes a control oriented modeling approach steered more towards a model-
based online estimation application. Due to dynamics of SCR system in NH3 storage and
reaction, it becomes crucial to better understand kinetics of SCR over the transient behavior of
the exhaust with which it gets introduced. The study approaches NH3 estimation after the SCR
catalyst from a model-based method with utilizing kinetic models over the chosen SCR catalyst.

56
From the obtained literatures as discussed SCR formulation review section system, various
reactions mechanism is important in order to describe the true behavior of the SCR in
outputting certain levels of NOx and NH3. Hence, identifying the adsorption and desorption
response of the NH3 over the catalyst surface is vital in capturing the dynamic behavior of the
system in different operating condition. The SCR system are known to be highly non-linear in
nature and the internal mechanism operates in different time scale along with its operation being
strictly varied due to changing temperatures in the exhaust. The temperature strongly influences
the rate of chemical reactions are known to depend exponential on temperature (Figura et al.
2016). From kinetic model approach, the follow section discusses the estimation of
concentration and coverage ratio of ammonia over the added SCR system for the study.
4.4.3 SCR kinetic analysis
The ammonia entering the SCR system gets adsorbed and desorbed by the SCR
substrate and the two-way adsorption and desorption of the ammonia reaction is given by the
following expression (M. F. Hsieh and Junmin Wang 2010):
𝑁𝐻3 + 𝜃𝑓𝑟𝑒𝑒 → 𝑁𝐻3∗ (14)
where, 𝜃𝑓𝑟𝑒𝑒 represents the surface that is not covered by the NH3 and has potential for
ammonia adsorption. The rate of reactions of the following above for adsorption/desorption
processes can be modeled using the Arrhenius equations and presented below:
𝑅𝑎𝑑𝑠 = 𝑘𝑎𝑑𝑠𝑒𝑥𝑝 (−𝐸𝑎𝑑𝑠
𝑅𝑇) 𝐶𝑁𝐻3(1 − 𝜃𝑁𝐻3)𝛺 (15)
𝑅𝑑𝑒𝑠 = 𝑘𝑑𝑒𝑠𝑒𝑥𝑝 (−𝐸𝑑𝑒𝑠
𝑅𝑇) 𝜃𝑁𝐻3𝛺 (16)
where, Rads and Rdes are the two reaction rates for adsorption and desorption reactions (in
mole/s), respectively. T is the temperature in K, CNH3 represent the model concentration of
ammonia in mole/m3, 𝐸𝑎𝑑𝑠 & 𝐸𝑑𝑒𝑠 are the activation energy and kads & kdes are the rate constant
from the Arrhenius reaction models. 𝜃𝑁𝐻3 are the ammonia coverage ratio which is defined by
Equation (17), where 𝑀𝑁𝐻3∗ represents the mode number of ammonia absorbed by the catalyst

57
and 𝛺 is the ammonia storage capacity of the catalyst in moles and which tend to vary with
temperature and is typically modeled by Equation (17), where S1 and S2 are the storage
parameters and positive constants. The ammonia coverage ratio goes from 0 to 1, where 0
stands for no ammonia stored and 1 stands for saturated SCR brick. V is the catalyst volume
expressed in m3.However, these parameters needs to change accordingly to capture the effect
of catalyst aging as an adaptive approach (M. F. Hsieh and Junmin Wang 2010).
𝜃𝑁𝐻3 =𝑀𝑁𝐻3
∗
𝛺 (17)
𝛺 = 𝑆1𝑒−𝑆2𝑇 (18)
The adsorbed ammonia is either desorbed as described from above mechanism or
further reacts with NOx as by the process of reduction reaction. The standard NOx reduction
reaction, as discussed in the literature reviewed Section 15, is the dominant reaction due to
presence of only NO in the exhaust. Reiterating the reaction (8) with only the adsorbed
ammonia 𝑁𝐻3∗, Equation (19) expresses the reaction between the stored NH3 over the SCR
surface and exhaust NO species in the presence of O2. The rate of reaction for the following
NOx reaction is ones again defined from the Arrhenius reaction rates provided by Equation
(20), where 𝐶𝑁𝑂 and 𝐶𝑂2 represents the mole concentration of NO and O2, respectively. All the
reaction rates were defined as a function stored ammonia (𝜃𝑁𝐻3) and gaseous NO.
4NH*3 + 4NO + O2 4N2 + 6H2O (19)
𝑅𝑟𝑒𝑑 = 𝑘𝑟𝑒𝑑𝑒𝑥𝑝 (−𝐸𝑟𝑒𝑑
𝑅𝑇) 𝐶𝑁𝑂𝐶𝑂2
𝜃𝑁𝐻3𝛺 (20)
Additionally, the adsorbed 𝑁𝐻3∗ also has the tendency to get oxidize in the presence of
O2 as expression by reaction (21). Such reactions are typically known to occur at temperatures
higher than 450ºC (Jinbiao and Fengjun 2015). The reaction rate of the NH3 oxidation is

58
provided by Equation (22), where 𝑘𝑜𝑥𝑖 is the rate constant for oxidation and 𝐸𝑜𝑥𝑖 is the
activation energy for the oxidation process.
4NH*3 + 3O2 2N2 + 6H2O (21)
𝑅𝑜𝑥𝑖 = 𝑘𝑜𝑥𝑖𝑒𝑥𝑝 (−𝐸𝑜𝑥𝑖
𝑅𝑇) 𝐶𝑂2
𝜃𝑁𝐻3𝛺 (22)
4.4.4 Steady-state estimator for SCR modeling
For solving the reaction mechanisms, the study assumes the SCR catalyst to be a
continuous stirred tank reactor (CSTR) in order to develop is simplified 0-D model (M. F. Hsieh
and Wang 2011). This assumes the SCR to be a single unit reactor with the states being
homogenous within the catalyst as depicted in Figure 32.
Figure 32. Schematic of ammonia storage distribution and CSTR model of SCR catalyst
In additional to the main assumption, the following assumptions were also made to
formulate the SCR model and are listed below (Devarakonda, Parker, and Johnson 2008):
1. All chemical kinetics over the catalyst surface are reaction control with no mass
transfer.
2. Surface phase concentration of varied species are neglected except for NH3 storage
3. NOx reaction with NH3 is assumed to be with NO only
4. Reaction rate are defined as a function of SCR inlet temperature, NH3 storage ratio
and concentration of NO at the SCR inlet.
Tin, CNO,in,CNH3,in, CO2
Exhaust Flow (F)
SCR Catalyst
Ammonia Storage
T, CNO,CNH3, CO2T, CNO,CNH3, CO2
SCR Volume (V)
Tailpipe Flow

59
Using the conservation of mass balance law and the above mentioned CSTR
assumptions, the three state model equations are expressed by the following three equations
below.
��𝑁𝑂 = ��(𝐶𝑁𝑂,𝑖𝑛 − 𝐶𝑁𝑂) − 𝑅𝑟𝑒𝑑 (23)
��𝑁𝐻3 = 𝑅𝑎𝑑𝑠 − 𝑅𝑑𝑒𝑠 − 𝑅𝑟𝑒𝑑 − 𝑅𝑜𝑥𝑖 (24)
��𝑁𝐻3 = ��(𝐶𝑁𝐻3,𝑖𝑛 − 𝐶𝑁𝐻3) + 𝑅𝑑𝑒𝑠 − 𝑅𝑎𝑑𝑠 (25)
where �� is the normalized exhaust flow rate (1/s) obtained from volumetric exhaust flowrate
(F) divided by total catalyst gas volume (V). The 𝐶𝑁𝑂,𝑖𝑛 and 𝐶𝑁𝐻3,𝑖𝑛, are NO and NH3
concentration upstream of the catalyst. The above equations are rearranged to a state-space
model form which are shown in Equation (26).
[
CNO
θNH3
CNH3
] = [
−rredCNOCO2θNH3Ω − ��CNO
−θNH3(radsCNH3 + roxdCO2 + rdesCNOCO2) + radsCNH3
−CNH3(Ωrabs(1 − θNH3) + ��) + rdesΩθNH3
] + [
00
��] CNH3,in + [
��00
] CNO,in (26)
where 𝑟𝑖 = 𝑘𝑖𝑒𝑥𝑝 (−𝐸𝑖
𝑅𝑇) , 𝑖 = 𝑎𝑑𝑠, 𝑑𝑒𝑠, 𝑟𝑒𝑑, 𝑜𝑥𝑖
The study incorporates the above mentioned three SCR mechanisms to be considered
in the control-oriented SCR model. The state coupled SCR equation model is a system of first-
order Ordinary Differential Equations (ODEs) which includes rate of reaction of dependent
variables NO and NH3 along ammonia storage ratio. The study used differential equation
solvers using MATLAB’s ODE15s method to solve the system of kinetic equations,
simultaneously (MathWorks 2017). The solver numerically solves using numerical
differentiation formulas (NDF’s) of orders 1 to 5. The time derivative reaction rate was
formulated as objective function in MATAB workspace to solve the ODE problem with given
initial values of NO, NH3 and θNH3.

60
For the model to estimate the SCR reaction outcomes, the reaction parameters (ki and
Ei) in the reaction mechanisms needs to be given, and the values are usually obtained from
conducting controlled reactor experiments and was out of the scope of the study. There exist
several literature that have looked at identifying the reaction rate parameters based on lab reactor
experiments conducted for similar SCR systems (Clark et al. 2009; Song 2013; Pant and Schmieg
2011). However, studies have also shown using optimization or search based techniques for
parameter identification (M. F. Hsieh and Wang 2011; Devarakonda, Parker, and Johnson 2008;
Song et al. 2013). The approach taken in this study is discussed in the following section by
solving the ODE model with different combination of parameters and then comparing the
obtained model values with the actual measured values.
4.4.5 Model parameter identification method
The approach uses MATLAB®’s multi-objective Genetic Algorithm (GA) method to
obtained the reaction parameters by solving the reactor model with combination of varying
values of the parameters to be optimized. The multi-objective optimization technique is used in
minimizing multiple objective functions which are subject to set of constraints. Likewise, the
model consists of three state variables as objective function that needs to be optimized for the
given set of parameters, i.e. activation energies and rate constant for each reaction. Figure 33
presents the parameter identification schematic formulated for the GA based optimization
problem in MATLAB®.
Figure 33. Schematic for model parameter identification
SCR Model
(using ODE solver)
CNOx,in, meas
CNH3, in, meas
Tin, meas
Fmeas
Cost Function (CF)CNOx,out, meas
CNH3, out, meas
Multi-objective
Optimization using GA
Pinitial
{Ei and ki }
{CFNOx and CFNH3}
Poptimized
{Ei and ki }

61
The goal here is to minimize the error between the simulated value from the model and
the measurement obtained from the experiment for a set of reaction parameters. The SCR
model calibration was targeted to match the concentration of NO and NH3 to the SCR outlet
values obtained in the steady-states experiments. The accuracy of the estimating the output
variables evaluated by calculating the cost function, defined as sum of squared of accumulated
error between the model prediction and the experimental measurement over the entire test. The
equation for the considered cost function for each output variable is expressed as:
𝐶𝑜𝑠𝑡 𝐹𝑢𝑛𝑐𝑡𝑖𝑜𝑛 𝑖 =1
𝑁∑ (𝐶𝑖,𝑠𝑖𝑚𝑢𝑙𝑎𝑡𝑒𝑑 − 𝐶𝑖,𝑚𝑒𝑎𝑠𝑢𝑟𝑒𝑑)
2𝑁
𝑡0=1
(27)
where, i in the cost function is for the two species, NO and NH3. t0 is the initial time and N is
the total time of evaluation. For the GA optimization algorithm properties, the study uses the
following default settings and are provided in the Table 5 below. Performance in changing
optimization criterions were not examined for the study.
Table 5. GA Optimization Algorithm Criteria’s
GA Criteria Name Criteria Used
Population Size 100
Initial Range Given (E’s and k’s ranges obtained from literature)
Parameter Bounds Given (E’s and k’s ranges obtained from literature)
Parent Selection Criteria Tournament (Size = 2)
Reproduction Crossover fraction with 0.8
Mutation Constraint dependent (Gaussian distribution)
Crossover Two Point
Migration Forward with last two individuals with 20 intervals
Multi-objective Algorithm Setting Distance measure with 0.35 pareto front population fraction
Stopping Criteria Time Limit = 36000 seconds Stall Generation = 50 Function Tolerance = 0.0001

62
CHAPTER 5 Results and Discussion
As the global objective of this study was to develop an ammonia reduction after-
treatment system for a heavy-duty natural gas engine which are subjected to stoichiometric
combustion operation and consequently shown to produce high precursor ammonia tailpipe
emission; the study addresses by conducting experimental evaluation on a 2008 8.9L natural gas
engine which are known to have heavy market penetration in the vocational heavy-duty
transport sector. The experiments and data analysis were performed in a sequential step and
findings are summarized as per the studies approach towards the specific objectives.
5.1 Baseline engine and after-treatment evaluation
Baseline evaluation study was conducted to obtain the performance and emission levels
of the procured 8.9L engine equipped with its stocked TWC system which were in-use
application. Both the engine and TWC together already had approximately 13,800 hours of
operating usage before the engine was installed on the engine dynamometer. The engine was
tested under both transient and steady-state operating conditions in observe the dynamic
characteristics of engine performance and composition of emission characteristics under such
engine behavior and theirs results are provided in the following sections.
5.1.1 Transient evaluation
Table 6 summarizes the transient test matrix for ten experimental tests to evaluate the
baseline setup. During the duration of the baseline testing, one of the FTIR system encountered
sampling issues, and consequently the test was conducted with only one FTIR instrument
sampling before or after the TWC system, as depicted by the test matrix in Table 6. The study
conducted additional transient tests in order to obtain adequate information of the baseline
engine and TWC setup evaluation.

63
Table 6. Transient Test Matrix Test Cycles FTIR [pre-TWC] FTIR [post-TWC] CVS System
FTP 1 Measured Measured Measured
FTP 2 Measured NA Measured
FTP 3 Measured NA Measured
FTP 4 Measured NA Measured
FTP 5 NA Measured Measured
FTP 6 NA Measured Measured
FTP 7 NA Measured Measured
WHTC 1 Measured NA Measured
WHTC 2 NA Measured Measured
WHTC 3 NA Measured Measured
Table 7 provides the summary results obtained from the carbon balanced iterative
method with gaseous samples measured using the CVS system for the ten transient test cycles.
It is to be noted that the engine was not preconditioned, and hence, each test cycle would differ
in initial engine and after-treatment temperature state which could potentially affect the TWC
temperature characteristics during the duration of the cycle. Additionally, some of the test cycles
were not tested back-to-back, and the study considered using the initial TWC out temperature
to define the test start type (i.e. cold start, warm start and hot start). In terms of total cycle work
and brake specific CO2 values for the two-separate type of transient cycles (FTP and WHTC),
the tests were repeatable with small variation, and potentially be due to test start type. Results
indicated distinct observed in brake specific NOx emissions between cold-start, warm-start and
hot-start test. Compared to cold-start test from the FTP results, the NOx emissions were on
average of 38% and 71% lower than the warm-start and hot-start test, respectively. Similarly,
from the WHTC results, the warm-start test showed on average 30% lower brake specific NOx
emission than the cold-start test. Results showed that the temperature activity of the after-
treatment TWC system does plays an important role in defining emission characteristics,
especially for NOx.

64
Table 7. Summary results from transient test cycles with baseline setup, CVS measured brake specific emission values
Test Cycles
Start Type Cycle Work
[bhp-hr]
Brake Specific Emissions [g/bhp-hr]
CO2 NOx CO THC
FTP 1 Warm-Start 19.3 442.2 0.32 2.08 1.77
FTP 2 Hot-Start 19.3 442.2 0.14 2.08 1.44
FTP 3 Warm-Start 19.2 425.8 0.35 3.68 2.75
FTP 4 Hot-Start 19.0 427.3 0.17 1.95 1.92
FTP 5 Warm-Start 19.5 429.1 0.35 2.46 2.82
FTP 6 Cold-Start 19.5 434.4 0.52 3.35 2.61
FTP 7 Cold-Start 19.5 432.5 0.59 3.10 2.69
FTP Average 19.3 433.4 0.35 2.67 2.29
FTP Std. Deviation 0.2 6.7 0.16 0.70 0.56
WHTC 1 Warm-Start 26.0 407.2 0.45 2.86 2.93
WHTC 2 Cold-Start 26.1 404.6 0.70 2.89 3.39
WHTC 3 Warm-Start 26.0 406.9 0.53 2.51 3.21
WHTC Average 26.0 406.2 0.56 2.75 3.17
WHTC Std. Deviation 0.02 1.42 0.13 0.21 0.23
The transient experiments were also instrumented to measure concentration pre-and-
post the TWC system to better understand the conversion efficiency of some of the anticipated
emission species. Figure 34 shows averaged NOx, NH3, CO and THC concentration values
calculated over the entire FTP cycles and the seven FTP test repeats. For abovementioned
species, the bar chart represents average concentration before and after the TWC system. In
summary, the TWC reduced approximately 88%, 81% and 43% of NOx, CO and THC
components on average, respectively. On the other, the TWC produced approximately 39 ppm
of NH3 on average over the test cycles with standard deviation of 3 ppm within the FTP tests.
Figure 35 includes result from the WHTC test results, showing similar trends in TWC
reduction. For these cycles, the TWC reduced 89%, 84% and 27% of NOx, CO and THC
components, respectively. The THC conversion is observed lower than the FTP cycle which
could also be due to the temperature activity of the WHTC cycle which included more low load
operations than compared to FTP cycle. The cycles average NH3 concentration was observed
to be at 61 ppm with standard deviation of 4 ppm within the WHTC tests.

65
Figure 34. Averaged NOx, NH3, CO and THC emission concentration before and after the TWC system over transient (FTP cycle) tests
Figure 35. Averaged NOx, NH3, CO and THC emission concentration before and after the TWC system over transient (WHTP cycle) tests
0
50
100
150
200
250
300
350
400
450
pre-TWC post-TWC
NOx
NO
x
[pp
m]
0
1000
2000
3000
4000
5000
6000
pre-TWC post-TWC
CO
CO
[p
pm
]
0
5
10
15
20
25
30
35
40
45
pre-TWC post-TWC
NH3
NH
3
[pp
m]
0
500
1000
1500
2000
2500
3000
3500
4000
4500
5000
pre-TWC post-TWC
CH4
CH
4 [
pp
m]
0
100
200
300
400
500
600
700
pre-TWC post-TWC
NOx
NO
x [p
pm
]
0
10
20
30
40
50
60
70
80
pre-TWC post-TWC
NH3
NH
3 [p
pm
]
0
500
1000
1500
2000
2500
3000
3500
4000
4500
5000
pre-TWC post-TWC
CO
CO
[p
pm
]
0
500
1000
1500
2000
2500
3000
3500
pre-TWC post-TWC
CH4
CH
4 [p
pm
]
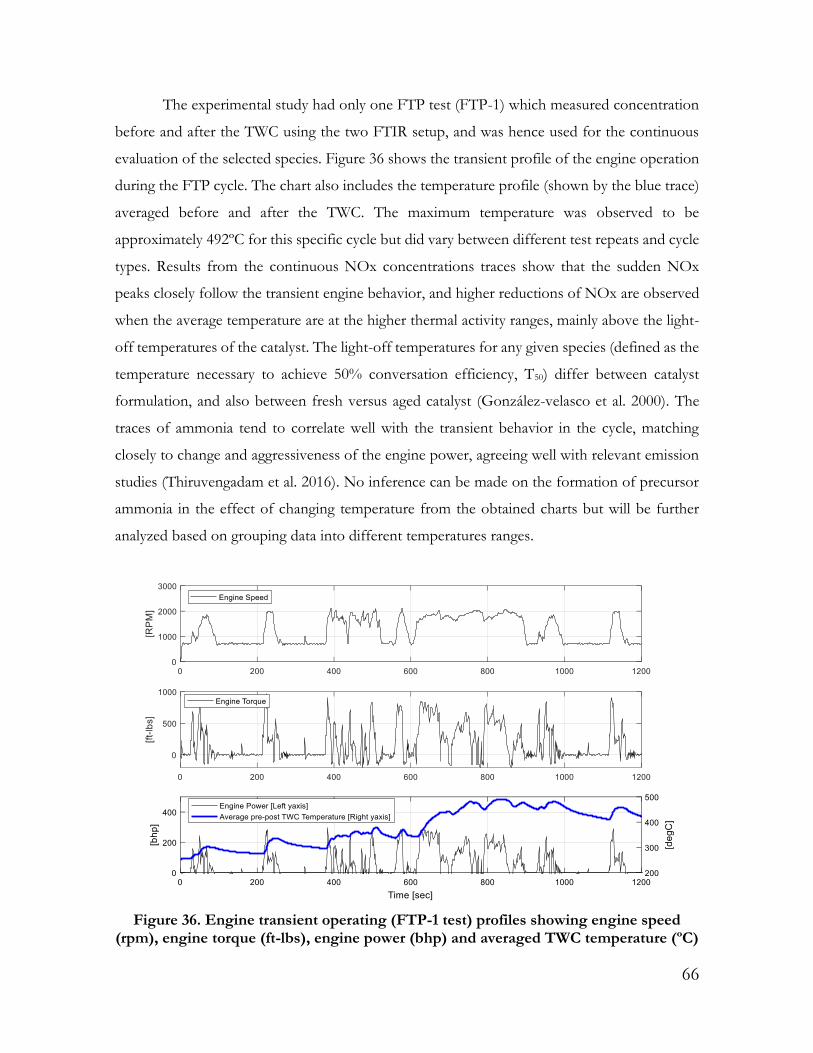
66
The experimental study had only one FTP test (FTP-1) which measured concentration
before and after the TWC using the two FTIR setup, and was hence used for the continuous
evaluation of the selected species. Figure 36 shows the transient profile of the engine operation
during the FTP cycle. The chart also includes the temperature profile (shown by the blue trace)
averaged before and after the TWC. The maximum temperature was observed to be
approximately 492ºC for this specific cycle but did vary between different test repeats and cycle
types. Results from the continuous NOx concentrations traces show that the sudden NOx
peaks closely follow the transient engine behavior, and higher reductions of NOx are observed
when the average temperature are at the higher thermal activity ranges, mainly above the light-
off temperatures of the catalyst. The light-off temperatures for any given species (defined as the
temperature necessary to achieve 50% conversation efficiency, T50) differ between catalyst
formulation, and also between fresh versus aged catalyst (González-velasco et al. 2000). The
traces of ammonia tend to correlate well with the transient behavior in the cycle, matching
closely to change and aggressiveness of the engine power, agreeing well with relevant emission
studies (Thiruvengadam et al. 2016). No inference can be made on the formation of precursor
ammonia in the effect of changing temperature from the obtained charts but will be further
analyzed based on grouping data into different temperatures ranges.
Figure 36. Engine transient operating (FTP-1 test) profiles showing engine speed (rpm), engine torque (ft-lbs), engine power (bhp) and averaged TWC temperature (ºC)
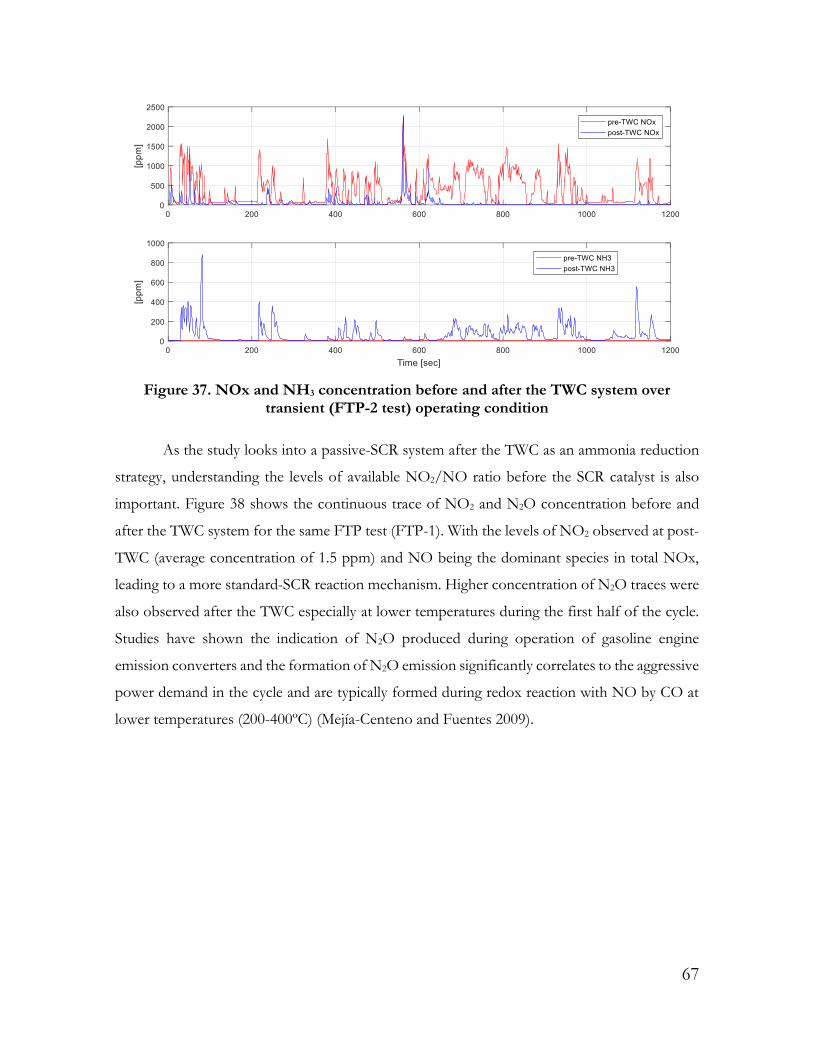
67
Figure 37. NOx and NH3 concentration before and after the TWC system over transient (FTP-2 test) operating condition
As the study looks into a passive-SCR system after the TWC as an ammonia reduction
strategy, understanding the levels of available NO2/NO ratio before the SCR catalyst is also
important. Figure 38 shows the continuous trace of NO2 and N2O concentration before and
after the TWC system for the same FTP test (FTP-1). With the levels of NO2 observed at post-
TWC (average concentration of 1.5 ppm) and NO being the dominant species in total NOx,
leading to a more standard-SCR reaction mechanism. Higher concentration of N2O traces were
also observed after the TWC especially at lower temperatures during the first half of the cycle.
Studies have shown the indication of N2O produced during operation of gasoline engine
emission converters and the formation of N2O emission significantly correlates to the aggressive
power demand in the cycle and are typically formed during redox reaction with NO by CO at
lower temperatures (200-400ºC) (Mejía-Centeno and Fuentes 2009).

68
Figure 38. NO2 and N2O concentration before and after the TWC system over transient (FTP-1 test) operating condition
Figure 39 shows the average concentration of NOx and NH3 observed after the TWC
evaluated from all the transient test cycles and grouped with respect to post-TWC temperature.
The temperature consists of six bins with bin size of 50ºC. The result indicated higher NOx
levels at lower temperature bins but with more variation in the values, and as observed from
previous cases, a downward trend was observed with increasing temperature due to better
conversion activity of the TWC at higher temperatures. On the other hand, we see a clear
inclination in the rise of NH3 levels at higher temperature bins, indicating that the amount of
NH3 formation in the TWC as a function of after-treatment temperature. The grey line with “x”
markers represents the calculated NH3 to NOx ratio (ANR) using only the averaged NOx and
NH3 values for each temperature bins. For three the temperature (200-350 ºC) bin ranges, the
ANR were calculated to be around 0.5 ratio with 1 (1:1 NH3:NOx) being observed right around
the 350-400ºC temperature region, and then quickly rising with higher temperatures.

69
Figure 39. Averaged post-TWC NOx and NH3 concentration for temperature bins from FTP and WLTC cycles
5.1.2 Steady-state evaluation
The section here presents results obtained from the testing the engine under the 20-
different steady-state modes. The results of NOx and NH3 concentration for each mode are
averaged over the two-minute stabilization period of the test and the averaged concentration
are plotted as a contour map under the engine speed and torque area, as shown by Figure 40.
The results from the steady-state modes indicate NOx produced by the engine is distinctly
higher in the upper region of low speed and high torque, and decreased at lower speed and
torque modes. This engine parameters play a big role in combustion NOx formation which are
closely related to combustion timings and fueling strategies, EGR rates which have shown to
affect in-cylinder temperatures to promote NOX formation. The post-NOx results show mainly
the TWC reduction characteristics, indicating adequate efficiency through the engine operation
to quickly reach passed the light-off temperatures. On the other hand, the formation of
ammonia is observed more in the region where higher NOx levels were observed, at low-speed
high torque engine operations, directly relating to high temperature and richer air fuel ratio
operating conditions. Further analysis showed that highest levels of N2O were observed at speed
and torque operating modes during lower exhaust temperature TWC activity.
0
1
2
3
4
5
6
7
8
0
20
40
60
80
100
120
200-250 250-300 300-350 350-400 400-450 450-500
AN
R
Ave
rage
d C
on
cen
trat
ion
[pp
m]
Temperature bins [ C]
NOx NH3 ANR

70
Figure 40. Concentration counter plots from 20 steady-state mode tests represented under engine speed and torque region; (a) pre-TWC NOx (b) post-TWC NOx, (c)
post-N2O and (d) post-TWC NH3
5.2 TWC+SCR after-treatment evaluation
This section summarizes and discusses results obtained from conducting the five SCRs with
three several types of catalyst formulation that were obtained from three separate catalyst
manufactures. Details of the catalyst evaluation test matrix are provided by Table 8. The study
evaluated all five SCR catalyst over the FTP transient cycles with three repeats for each catalyst.
Due to the size of the test matrix and availability of test time/budget, the SCRs were not tested
over the WHTC cycle and the 20-mode steady-state study. Additional experiments and analysis
were conducted for the SCR selected from the result obtained from the results obtained in this
work.

71
Table 8. Test matrix from the five SCR evaluation study SCR
Number SCR Type Test Cycle
FTIR
pre-TWC
FTIR
post-TWC
CVS
Measurement
SCR 1 Fe-Zeolite (Mfg: AP
Exhaust/ 100 cpsi)
FTP-1 Measured Measured NA
FTP-2 Measured Measured Measured
FTP-3 Measured Measured Measured
SCR 2 Fe-Zeolite (Mfg: AP
Exhaust/ 400 cpsi)
FTP-4 Measured Measured Measured
FTP-5 Measured Measured Measured
FTP-6 Measured Measured Measured
SCR 3 Fe-Zeolite (Mfg:
Corning/ 400 cpsi)
FTP-7 Measured Measured Measured
FTP-8 Measured Measured Measured
FTP-9 Measured Measured Measured
SCR 4 Cu-Zeolite
(Cummins/400 cpsi)
FTP-10 Measured Measured Measured
FTP-11 Measured Measured Measured
FTP-12 Measured Measured Measured
SCR 5 V (Mfg: AP Exhaust/
100 cpsi)
FTP-13 Measured Measured Measured
FTP-14 Measured Measured Measured
FTP-15 Measured Measured Measured
The study evaluated the five SCR catalyst type based on the NOx conversion efficiency
and NH3 storage characteristics over the transient FTP cycle. The SCRs activity in NH3 storage
and NOx reduction in the presence the stored NH3 have shown to significantly depend upon
the exhaust temperatures. It has been well observed from studies that the SCR substrate typically
holds NH3 at lower temperatures and tend to gradually desorb NH3 as temperature of the SCR
increases. Additionally, the efficient redox reactions are less likely to be observed at lower SCR
temperatures due to catalyst inactivity below minimum activation or the light-off temperatures.
And, this have shown to vary between SCR to SCR catalyst with different formulation and
geometric characteristics (Colombo, Nova, and Tronconi 2010; Nagashima et al. 2000).
Figure 41 presents an example of the SCR 3 experimented over an FTP cycle, and the
results are represented in terms of continuous NOx and NH3 concentration before and after
the selected SCR. From initial visual inspection of the NOx profiles (referred to the top chart
in the figure), its shows that NOx reduction tend to vary with temperature as commonly known
property of SCR, especially Fe-zeolite based SCRs. We observed better NOx reduction at higher
temperatures than the lower temperature seen in the first half of the FTP cycle. In addition to
the temperatures, oxygen in exhaust also plays a significant role in promoting the standard-SCR
reaction (Guralp et al. 2011). These can be observed from the high peak events during the
instant power demands, especially during first half into the FTP cycle, where due to rich air-fuel
operating conditions causes lack of lack of oxygen, and therefore inhibiting NOx reduction over

72
the catalyst. In terms of NH3 slippage or storage characteristics (referred to the bottom chart in
Figure 41), negligible slip in NH3 were observed after the SCR till 490 seconds into the FTP
cycle, indicating complete NH3 adsorption. However, as temperature increased, low
concentration of NH3 was observed, which indicates desorption, and the rate of NH3 slippage
or desorption started increasing drastically with rise in temperature (around 400ºC and above),
around 650 seconds into the cycle. Further observing the profiles indicate that the NH3 releases
by the SCR shows a slow cyclic response than compared to the inlet NH3 concentration profile,
and these could be attributed to occurrence of ammonia desorption and part of inlet gaseous
ammonia stored and slipped through the catalyst at different time periods. Additionally, the rate
of adsorption and desorption are not uniform over the catalyst surface, which could vary with
temperature dispersal within the SCR catalyst and differences in residence time due to change
in exhaust flowrates.
Figure 41. Profiles of NOx and NH3 concentration before and after the evaluated SCR over the FTP cycle (SCR 3)
The difference in the two curves (moles of NH3 entering and moles of NH3 leaving the
SCR) provides a rough understanding of how much ammonia, in moles, are stored in the SCR
catalyst at a given time and is provided by Figure 42 in moles of NH3 per catalyst volume
Start of NH3
slippage
Low NOx
reduction
Improved NOx
reduction

73
(mole/m3). The analysis also shows that the ammonia storage value levels off at around 10-15
moles/m3, indicating that the SCR can no longer absorb or store NH3 as a result of reaching
the maximum ammonia storage capacity. The NH3 storage ratio at a given time cannot be
directly measured and can only be estimated with prior knowledge the ammonia storage
capacity. The ammonia storage ratio estimation also becomes challenging due to the uncertainty
in how much ammonia had already been stored on the catalyst prior to the test and what percent
of the stored ammonia has been used via different reactions. Additional the ammonia storage
capacity of an SCR is not constant value and varies with temperature (Ciardelli et al. 2004).
Figure 42. Cumulative profile of inlet NH3, NH3 storage and NH3 slippage from the evaluated SCR 3 over the FTP cycle
Based on the above-mentioned SCR characteristics, the study chooses to evaluate the
five SCR for NOx conversion efficiency and NH3 storage over different temperature categories
(bins) observed during the transient cycle from each test. The SCR inlet temperatures were
categorized into six different ranges with a size range of 50ºC. The time-aligned concentration
of NOx and NH3 before and after the SCR were subsequently averaged within the obtained
temperature bins. Although, few tests did include data points below 200ºC and above 500ºC,
the chooses to evaluate the SCR performance only within the two given temperature ranges
where majority of data were observed.

74
Figure 43 provides the NOx conversion efficiencies obtained from the three repeated
FTP tests and averaged for the six temperature ranges as represented by the horizontal axis. On
comparing the five SCRs over different temperature ranges, SCR 1 (Fe-zeolite with 100cpsi)
clearly indicates lowest conversion of NOx, resulting in efficiencies below 20% at both lower
(200-300)ºC and higher (350-500)ºC temperature ranges. This could be attributed to the lower
cell density formulation than compared to the other four SCRs, and studies have shown by
increasing the cell density increases the SCR performance due to higher surface area (Chatterjee
et al. 2005). This effect of higher cell density is indicative by the NOx conversion performance
of SCR 2, an Fe-zeolite based SCR from the same manufacture with similar formulation but
with cell density of 400 cpsi. However, both SCRs, 1 and 2 showed lower NOx conversion
efficiency ay higher temperatures (350-500)ºC when compared to other SCRs, although, Fe-
zeolite are known to perform well at these temperatures (Kröcher 2007). The observed
performances from the two Fe-zeolite catalysts could be attributed to the wash-coat loading
amount and the specific type of proprietary zeolite used to make the catalyst that was procured
at the time of the study.
Figure 43: Comparison of averaged percent NOx conversion efficiency as a function of temperature over the FTP cycle
SCR 3, also a Fe-zeolite based catalyst (with 400 cpsi) but from a different manufacture,
indicated improved conversion efficiency than compared to the other two Fe-zeolites based
0
20
40
60
80
100
200-250 250-300 300-350 350-400 400-450 450-500
NO
x C
on
vers
ion
Eff
icie
ncy
[%
]
Temperature Bins [ C]
SCR 1 SCR 2 SCR 3 SCR 4 SCR 5

75
SCRs at higher temperature ranges. A peak of 88.5% NOx conversion was observed at the 350-
400ºC temperature range but showed gradual decrease in conversion efficiency below these
temperatures. The thermal activity of this SCR tends to agree with findings obtained in
literatures.
The Cu-zeolite based (SCR 4 with 400 cpsi) catalyst, resulted in NOx conversion
efficiencies within 40 to 60% over all evaluated temperatures ranges. However, most literatures
have shown that Cu-zeolite based SCRs tend to operate well than Fe- and V-based SCRs,
especially at lower operating temperatures (Kröcher 2007). The lower observed Cu-zeolite
performance could be significantly attributed to using a highly aged SCR catalyst obtained from
a high mileage vehicle where durability studies have indicated deterioration of the SCR
performance over time as a result of high thermal deactivation (Cavataio et al. 2008).
The last SCR evaluated, SCR 5 (V-based) catalyst, performed well on NOx conversion
efficiency over all the temperature ranges when compared to majority of other four SCRs. It
also showed the highest conversion efficiency at lower temperatures when compared against
the two zeolite based SCRs. Several studies have indicated that V-based catalyst operates at best
in temperature ranges between (250-450)ºC (Majewski 2005; Kröcher 2007), which tracks to the
result obtained in this study.
In concluding the SCR evaluation on NOx conversion performance, it is to be noted
that the study evaluated the SCR’s performance using averaged pre-and-post SCR temperatures
and concentrations over extremely dynamic behavior of the engine and after-treatment
operating conditions. Additionally, due to studies experimental limitations, the SCR properties
were not held at same input parameters, and therefore could have led to disparities in
performance curves as observed in multiple literatures. Further investigation needs to be
performed to elaborate the performance of different input variables under such temperature
ranges and conditions observed in stoichiometric natural gas exhaust downstream of a TWC.

76
Figure 44: Comparison of averaged percent NH3 slip as a function of temperature over the FTP cycles
On the other hand, Figure 44 shows the averaged ammonia slippage in percent for all
five SCR catalyst tested over the same six binned temperature ranges. Results indicate a similar
trend from all five SCRs with NH3 being absorbed at lower temperature ranges, and as
temperature increased the slippage of NH3 also showed to increase. Cu-zeolite based catalyst
(SCR 4) indicated the least percent of NH3 slip from (200-400)ºC temperature ranges when
compared to other four SCRs, and NH3 slippage was observed from 400 ºC and above. SCR 3
which showed higher conversion efficiency for NOx at higher temperatures above 400ºC
resulted in slipping 100% of NH3 entering the catalyst. The Fe-zeolite based catalyst with 400
cpsi (SCR 2) resulted in the highest NH3 slippage, specifically at lower temperatures, even
though it performed well on NOx conversion efficiency when compared to the other two Fe-
zeolite based SCRs.
Figure 45 presents the overall percent result of the NOx conversion efficiency and NH3
slippage averaged over the entire cycle test. The chart basically provides the averaged
performance of the added SCR systems to reduce NOx that wasn’t reduced by the TWC, and
capture the precursor NH3 emission that was formed during the TWC reactions. In summary,
the V-based catalyst (SCR 5) resulted in maximum NOx conversion efficiency of 76.2% on
average but with a higher NH3 slippage percent of 40.9%. On the other hand, the Fe-zeolite
with 100 cpsi (SCR 1) gave the lowest NOx reduction with average value of 18.8% but had a
0
20
40
60
80
100
200-250 250-300 300-350 350-400 400-450 450-500
NH
3 S
lip
pag
e [%
]
Temperature Bins [ C]
SCR 1 SCR 2 SCR 3 SCR 4 SCR 5

77
moderate slippage of NH3 (25.5%) when compared to other SCRs. SCR 4 (Cu-zeolite) catalyst
with average NOx reduction of 52.7% and lowest NH3 slippage percent of 17.5% was
considered for further adsorption/desorption study that was utilized for the development of
the control regeneration strategy and SCR modeling. Another reason for the study to select this
SCR was based on the overall higher temperature activity evident in stoichiometric natural gas
engines, where ammonia storage capacity and NOx conversion efficiency becomes important
factors in developing a passive-ARC system.
Figure 45. Average NOx conversion efficiency and NH3 slippage for all five SCR catalyst over the entire three repeated FTP cycles
5.3 Ammonia adsorption/desorption evaluation (SCR 4)
The NH3 storage ratio cannot be directly measured due to the process adsorption and
desorption observed at different time scales over the catalyst surface. However, the storage
behavior of the catalyst can be estimated based on prior knowledge catalyst ammonia storage
capacity and storage ratio over the SCR surface. Therefore, any steady-state mode under a given
engine operations and duration must be analyzed as time dependent rate. This section includes
a comprehensive analysis of the eight steady-state mode tests results in order to evaluate the
adsorption/desorption characteristics under stable engine operating conditions. Table 9 list the
engine operating condition along pre-and-post SCR temperatures averaged over stable ready of
each 8-steady state modes. The duration of each mode varied in total duration based on visual
SCR 1 SCR 2 SCR 3 SCR 4 SCR 5
NOx Conv. [%] 18.8 46.4 57.4 52.7 76.2
NH3 Slippage [%] 25.5 55.9 36.4 17.5 40.9
0
20
40
60
80
100
[%]

78
inspection of the FTIR concentration traces and different stabilization time under different
engine operating conditions. Each mode also includes manual control of lean-ON periods in
order to induce variation in NH3 and NOx dynamics and recognize rate of stabilize time on
various species based on lean-ON durations. The results and analysis from this study will be
used in control and model development as presented in the follow sections.
Table 9. Steady-State mode test for SCR 4, engine and SCR temperature operating conditions
Mode Engine Speed
[rpm]
Engine Torque
[ft-lbs]
Engine
Power
[bhp]
Average pre-SCR
Temperature [°C]
Average post-
SCR Temperature
[°C]
1 751 247 35.4 320.0 190.3
2 851 84 13.6 330.8 218.0
3 1249 316 75.1 508.8 403.4
4 1296 37 9.2 319.9 222.6
5 1480 597 168.3 572.6 473.4
6 1521 162 46.8 468.2 275.9
7 1575 337 101.1 554.2 433.3
8 1611 683 209.4 572.7 486.4
Figure 46 displays results from mode 1, a low speed and load engine condition operated
for 1000 second duration resulting in an average pre-SCR temperature of approximately 320°C.
For the entire duration of the mode, the catalyst absorbed ammonia without any noticeable
ammonia slippage after the SCR. Reduction of NOx is well observed in the beginning of the
mode (20 to 290 secs), with NOx conversion decreasing as SCR inlet NOx stabilizes around
550 ppm. And, this could potentially be due to low availability of NH3 stored in the catalyst, as
NH3 entering the catalyst is also low. From the stoichiometric form of NOx reduction, shows
that 1 mole of NH3 is needed to react with 1 mole of NOx. Hence, the number of mole of
ammonia used for reduction of NOx is equal to the number of moles of NOx. In a steady-state
condition where the exhaust flow rate is constant, it can be said that the different between NOx
concentration before and after the SCR should account for the number of NH3 value used in
the catalyst, assuming no reaction other than the reduction (NOx and NH3) occurs. However,
at the end of the steady-state value of NOx, at around 220 seconds, we notice traces of NO2 at
the SCR outlet and this can be interpreted from possible oxidation reactions between NH3 and
O2 or NO and O2 (Grossale, Nova, and Tronconi 2008; M. F. Hsieh and Wang 2011). It is to
be noted that, NO2 values before the SCR was observed to be close to zero, and would have

79
negligible effect in NOx reduction in the catalyst, hence, were not provided in the charts below.
At 300 seconds into the mode, the lean-ON mode was manually turned on to operate the engine
into a more leaner operation instead of stoichiometric baseline operation. The start of the lean-
ON period can be noticed from the rise of NOx before the SCR due to reduced efficiency of
TWC in converting NOx during high oxygen exhaust events. The pre-SCR NOx rises and
stabilizes around roughly 860 ppm. We observe a noticeable difference in post-SCR NOx rate
in the beginning of the lean-ON period due to NOx conversion reactions and slowly
approached the SCR inlet NOx levels. In terms of NOx split at the SCR outlet, NO remained
approximately stable but gradual rise in NO2 was observed. Concentration of NO2 increased
and stabilized close to the NO concertation value. Higher oxygen content due to lean operation
of the engine could have contributed it favor more of an oxidation reaction between NO and
O2 than compared to the reaction between NH3 and O2. The oxidation of the absorbed NH3
reactions are observed typically at temperatures higher than 450ºC (M. F. Hsieh and Junmin
Wang 2010), and the modes average pre-and-post SCR temperature was at 255ºC. At about 596
seconds, the lean-ON period was turned off, and the experiment was operated back to baseline
stoichiometric engine condition. However, only minimum to no difference in total NOx value
were observed during this period of the mode 1, but with an average approximate split of 30%
NO2 and 70% NO. In summary, the oxidation reaction was seen to be more dominant than the
reduction reaction due to low NH3 availability in the catalyst.

80
Figure 46: Mode 1 [engine speed = 751 rpm, engine torque = 247 ft-lbs]; comparing pre-and-post NOx and NH3 concentrations; includes lean-ON period (300-596
seconds)
Another similar engine operating condition, steady-state Mode 2 results are provided in
Figure 47 having on average of 10ºC higher SCR inlet temperature than the previous mode
(Mode 1). Similar to the previous modes NOx observation, Mode 2 also had higher NOx
conversion in the beginning of the mode and showing a decreasing trend as inlet NOx stabilized
around 400 seconds into the mode. The NH3 entering the SCR was observed to be significantly
low (4 ppm on average for entire 1000 second mode duration), and all NH3 produced by the
TWC was stored in the SCR catalyst. The lean-ON period was switched on at 480 seconds and
turned off at 700 seconds into the mode. Majority of the reaction could be contributed to NH3
and NO reduction reaction in presence of excess oxygen. Similar trend in rise of NO2 was
observed doe to occurrence of oxidation reaction.

81
Figure 47: Mode 2 [engine speed = 851 rpm, engine torque = 84 ft-lbs]; comparing pre-and-post NOx and NH3 concentrations; includes lean-ON period (480-700
seconds)
Figure 48, displays Mode 3, a mid-engine speed and high load condition resulting in
higher pre-SCR temperature (on average of 509°C), than compared to the previous two modes.
This mode had a higher amount of NH3 entering the SCR catalyst, where the catalyst stored
NH3 for about 530 seconds into the mode, and then NH3 desorption at observed based on the
NH3 slippage from the SCR. It is also observed that the rate of ammonia being slipped is stable
with an average value of 6 ppm till 810 seconds into the mode, and starts rising with a faster
rate to a peak of 203 ppm in roughly 170 second duration. This release or desorption
characteristics could be contributed to rise in SCR temperature, as can been depicted from the
SCR inlet temperature provided by the grey line and the sudden rise is NH3 slippage could also
be due to passing a certain desorption threshold which tend to depend on the catalyst surface
temperature. After the NH3 peak observed at around 900 seconds, the rate of desorption drops
at a slower pace till 15400 seconds and tend to stabilize in a cyclic behavior, with an average
concertation of 80 ppm. NOx reduction was well observed with almost 100% conversion by

82
the catalyst during the baseline engine operation due to availability of enough stored NH3 in the
catalyst. The lean-ON period was triggered at 2040 seconds and turned off at 2280 seconds into
the mode. During the start of lean operating condition, the pre-SCR NOx quickly rises and
stabilizes around 900 ppm, while we observe slow rise in the post-SCR NOx values due to
mainly reduction reaction occurring between stored NH3 with NO and O2. No noticeable NO2
was seen during the entire mode 3, indicating negligible oxidation of either NO or NH3. The
NH3 produced by the TWC also gradually drops in the beginning of the lean period to almost
negligible trace of NH3. On the other hand, we also observe gradual reduction in NH3 slippage
after the SCR, indicating that the NOx reduction is utilizing the stored NH3 for the conversion
reactions. Similarly, the NH3 slippage goes to almost zero slip, and starts to absorb all the NH3
being produced by the TWC ones the lean operation was shut off. At around 2850 seconds, we
notice another NH3 desorption and at around 2970 seconds when NH3 slippage reached roughly
27 ppm, based on visual inspection, the lean-ON was again switched on. In comparable manner,
as the previous lean-ON period, NOx after the TWC increased but NOx outlet of the SCR did
not increase till about 17 seconds, indicating 100% reduction within this period. The entire
mode 3 was ran for 3072 seconds at steady-state condition. Additionally, during the initial
periods of the lean-ON operation, the temperature after the TWC increased with approximately
14ºC difference, and then started dropping gradually over the period of the steady-state mode.
The lean condition operating the engine in higher air-fuel ratio caused the exhaust temperature
to slightly drop from the baseline condition.
Figure 49 presents mode 4, similar engine speed compared to the previous mode 3 but
lower torque engine operating conditions. The mode is more comparable to mode 1 and mode
2, resulting in similar trend on NOx reduction., NH3 adsorption and in NO2 reaction in the SCR
catalyst. No desorption of NH3 was observed for the tested steady-states duration.

83
Figure 48: Mode 3 [engine speed = 1249 rpm, engine torque = 316 ft-lbs]; comparing pre-and-post NOx and NH3 concentrations; includes two lean-ON periods (2040-2280
seconds & 2970-3034 seconds)
Figure 49: Mode 4 [engine speed = 1296 rpm, engine torque = 37 ft-lbs]; comparing pre-and-post NOx and NH3 concentrations; includes lean-ON period (310-550
seconds)

84
Figure 50 shows mode 5 steady-state results, which consist of higher engine speed and
load operating conditions. The average temperature before the SCR catalyst from the entire
steady-state 572.6ºC with a maximum temperature of 585ºC. It is to be noted that these elevated
temperatures at steady conditions are usually not observed in real-world dynamic operation of
the engine and only depicted under constant steady-state high load operation as performed for
under this study. For this particular mode, the lean-ON period was switched on even before the
observing any NH3 slippage after the SCR, in order to evaluate the NOx reduction with stored
NH3 before any desorption. Right after switching the lean-ON period, the NOx after TWC
indicated a sharp rise. We also observe the post-SCR NOx rise with minimum NOx reduction
and quickly following the pre-SCR NOx levels. This was primarily done to understand if the
SCR could be completely emptied (or regenerated) from the prior stored NH3 and initiate a
condition with minimal ammonia storage ratio. Accordance to experimental reactor studies,
researchers utilizes elevated temperature effect to completely desorb NH3 from the catalyst
(Ciardelli et al. 2004). However, it becomes a challenge with the engine operations and
experimental setup where NH3 dynamics and temperature after the TWC cannot be directly
controlled or held constant.
In elaborating further for mode 5, in Figure 50 , traces of NH3 desorption was observed
at 345 seconds into the mode and increased rapidly with respect to the increasing temperature.
The post-SCR NH3 slippage peaked at approximately 60 ppm and 410 seconds into the mode,
roughly taking 65 seconds from detecting NH3 slip to maximum slippage concentration. After
the NH3 peak, gradual drop in NH3 slippage was observed and reached a stabilizing
concentration within (20-25) ppm. The second lean-ON was switched on at 774 seconds into
the mode, causing the pre-SCR NH3 to drop along with the post-SCR which could be attributed
to the availability of NH3 storage instigating reduction reaction at high NOx and oxygen levels.
The lean operation was then turned off at around 1010 seconds into the mode. From the NH3
slippage trace, NH3 started to desorb at a higher rate after 90 seconds into turning the lean
operation off and stabilizing around the same level as then let NH3, approximately (20-25) ppm.
The mode showed no indication of NO2 formation in the SCR catalyst, even during the lean-
ON periods as observed in the previous modes.

85
Figure 50: Mode 5 [engine speed = 1480 rpm, engine torque = 597 ft-lbs]; comparing pre-and-post NOx and NH3 concentrations; includes two lean-ON periods (65-122
seconds & 774-1010 seconds)
Figure 51 present mode 6, a high engine speed but low load operating condition. The
average temperature for the mode was more stable at approximately 468.2ºC. It can be observed
that almost all the NOx entering the SCR is being reduced by the catalyst reaction during the
baseline operation period of the mode. For this mode, the lean-ON was switched on for just
brief periods. The first lean-ON was switched on at 412 seconds for only 7 seconds while the
second lean-ON was switched on at 460 seconds but for a longer duration, i.e. 19 seconds.
Comparing the pre-and-post NOx traces for the two lean-ON periods, the first lean-ON
indicated that the duration was short enough to avoid the post-SCR NOx peak as seen in the
second lean-ON period. However, the second lean-ON period with 19 seconds of duration was
enough to result in decreasing the NH3 slippage trend as seen by the red curve around 460
seconds on the bottom chart of Figure 51. Evaluation of different lean-ON periods on NH3
slippage rates and NOx conversion control are presented in Section 5.3.2.

86
Figure 51: Mode 6 [engine speed = 1521 rpm, engine torque = 162 ft-lbs]; comparing pre-and-post NOx and NH3 concentrations; includes two lean-ON periods (412-419
seconds & 460-479)
Figure 52 and Figure 53 displays mode 7 and mode 8, with similar high engine speed
operations but with two different load levels. Mode 8 operated at higher torque value producing
the maximum power among all other modes. Both modes showed similar characteristics in NH3
adsorption and desorption rates during baseline and lean-ON periods. However, during the first
lean-ON period in mode 7, NO2 formation was also observed after SCR (shown by the green
dashed lines). Investigating this further, it was observed that the temperatures of the inlet and
outlet of the SCR catalyst were at lower ranges (445 ºC at the inlet and 264 ºC at the outlet;
averaged temperatures during the lean-ON periods) and additional attributed to potential
oxidation reaction aiding NO2 formation in the SCR catalyst. No noticeable NO2 was observed
in any of the three lean-ON periods in the mode 8 test.

87
Figure 52: Mode 7 [engine speed = 1575 rpm, engine torque = 337 ft-lbs]; comparing pre-and-post NOx and NH3 concentrations; includes two lean-ON periods (182-789
seconds & 1245-1464 seconds)
Figure 53: Mode 8 [engine speed = 1611 rpm, engine torque = 683 ft-lbs]; comparing pre-and-post NOx and NH3 concentrations; includes three lean-ON periods (90-219
seconds, 577-752 seconds & 1211-1362 seconds)
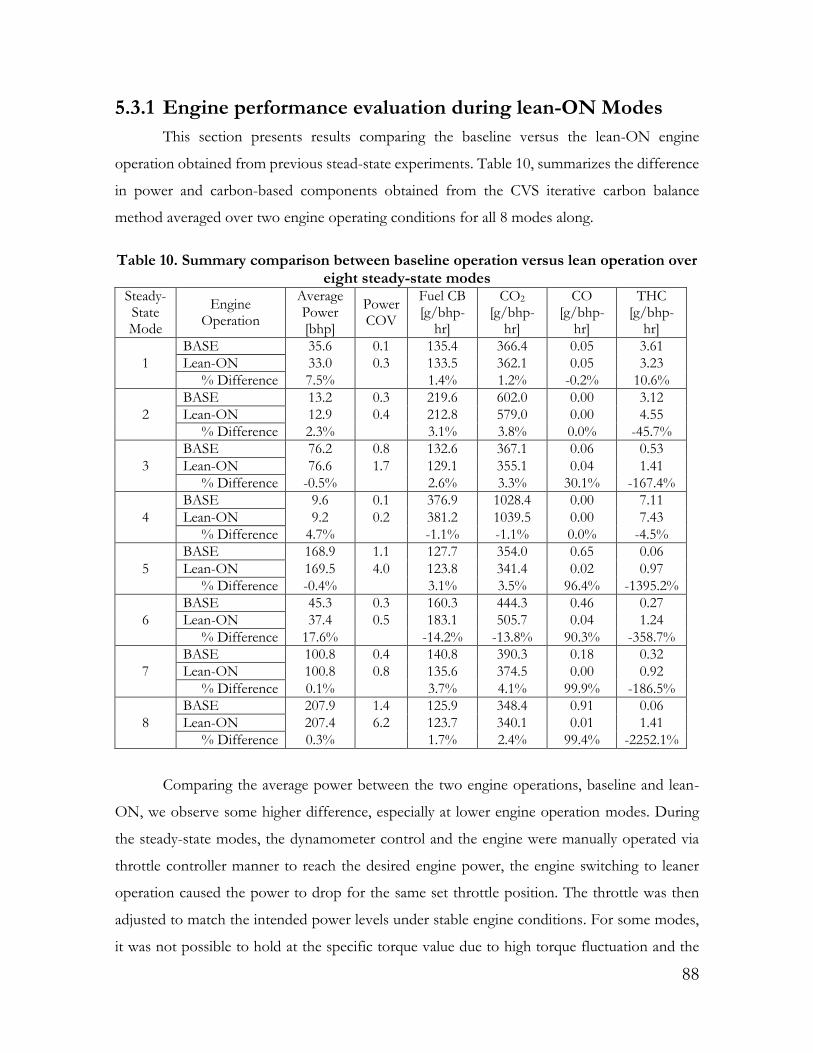
88
5.3.1 Engine performance evaluation during lean-ON Modes
This section presents results comparing the baseline versus the lean-ON engine
operation obtained from previous stead-state experiments. Table 10, summarizes the difference
in power and carbon-based components obtained from the CVS iterative carbon balance
method averaged over two engine operating conditions for all 8 modes along.
Table 10. Summary comparison between baseline operation versus lean operation over eight steady-state modes
Steady-State Mode
Engine Operation
Average Power [bhp]
Power COV
Fuel CB [g/bhp-
hr]
CO2 [g/bhp-
hr]
CO [g/bhp-
hr]
THC [g/bhp-
hr]
1
BASE 35.6 0.1 135.4 366.4 0.05 3.61
Lean-ON 33.0 0.3 133.5 362.1 0.05 3.23
% Difference 7.5% 1.4% 1.2% -0.2% 10.6%
2
BASE 13.2 0.3 219.6 602.0 0.00 3.12
Lean-ON 12.9 0.4 212.8 579.0 0.00 4.55
% Difference 2.3% 3.1% 3.8% 0.0% -45.7%
3
BASE 76.2 0.8 132.6 367.1 0.06 0.53
Lean-ON 76.6 1.7 129.1 355.1 0.04 1.41
% Difference -0.5% 2.6% 3.3% 30.1% -167.4%
4
BASE 9.6 0.1 376.9 1028.4 0.00 7.11
Lean-ON 9.2 0.2 381.2 1039.5 0.00 7.43
% Difference 4.7% -1.1% -1.1% 0.0% -4.5%
5
BASE 168.9 1.1 127.7 354.0 0.65 0.06
Lean-ON 169.5 4.0 123.8 341.4 0.02 0.97
% Difference -0.4% 3.1% 3.5% 96.4% -1395.2%
6
BASE 45.3 0.3 160.3 444.3 0.46 0.27
Lean-ON 37.4 0.5 183.1 505.7 0.04 1.24
% Difference 17.6% -14.2% -13.8% 90.3% -358.7%
7
BASE 100.8 0.4 140.8 390.3 0.18 0.32
Lean-ON 100.8 0.8 135.6 374.5 0.00 0.92
% Difference 0.1% 3.7% 4.1% 99.9% -186.5%
8
BASE 207.9 1.4 125.9 348.4 0.91 0.06
Lean-ON 207.4 6.2 123.7 340.1 0.01 1.41
% Difference 0.3% 1.7% 2.4% 99.4% -2252.1%
Comparing the average power between the two engine operations, baseline and lean-
ON, we observe some higher difference, especially at lower engine operation modes. During
the steady-state modes, the dynamometer control and the engine were manually operated via
throttle controller manner to reach the desired engine power, the engine switching to leaner
operation caused the power to drop for the same set throttle position. The throttle was then
adjusted to match the intended power levels under stable engine conditions. For some modes,
it was not possible to hold at the specific torque value due to high torque fluctuation and the

89
engine’s response to the throttle control resolution (or step in throttle position). An example of
such mode would be mode6, where a difference of 17.6% is observed between the baseline and
the lean-ON operation. On the other hand, in the event of lean-ON periods, the engine did
exhibit higher torque fluctuation than compared to the stochiometric baseline operation, and
the level of fluctuation can be interpreted based on observing the coefficient of variation (COV).
The COV for the lean operation were observed to be higher than the baseline operation and
the cause in such variation in the engine torque stabilization could depended upon different
combustion operating parameters, such as, fuel quantity, dithering profiles and/or spark
timings. The study did not have access or control over such engine parameters, and further
work needs to be done to understand the effects of engine calibration under the lean-ON
operation performed for the 8 steady-state modes. The table also provides brake specific fuel
consumption during each steady state operation calculated using the carbon balance method
from the CVS measurement system.
Figure 54. Comparison of brake specific fuel consumption between baseline operation versus lean-ON operation
The graphical representation of the percent difference comparison between the baseline
and lean-ON operation is provided in Figure 54. Due to high power differences observed in
mode 6, the fuel consumption value was excluded in calculating the overall average percent
difference between the two operating modes. By operating the engine into leaner condition
-2%
-1%
0%
1%
2%
3%
4%
5%
1 2 3 4 5 6 7 8
Mode Number
Average 2.1%

90
under the same power levels resulted on average of 2.1% lower brake specific fuel consumption.
A maximum fuel benefit of 3.7% was observed in mode 7.
On the other hand, CO emissions were significantly lower, especially at higher engine
power modes, when operating the engine in lean operation. Differences of up to 90% and above
were observed for modes (5, 6, 7 and 8). However, the comparisons also indicate significantly
higher THC emissions at these modes in lean-ON operations. It is to be noted that, both CO
and THC values are direct consequence of TWC performance and engine out exhaust
conditions due to operating the engine under lean combustion, and the SCR did not have any
effect in the change of these two species.
5.3.2 Lean-ON duration evaluation
It has been observed that switching the lean-ON operation changes the TWC output
NOx and NH3 characteristics and this simultaneously affects the dynamics of NH3 adsorption
and NOx reduction characteristics of the passive-SCR system. Additionally, amount of NOx
that can be reduced by the SCR catalyst depends up the stored NH3, as the surface reaction of
NOx reduction happens over the catalyst with prior NH3 adsorbed. Hence, the duration of the
lean-ON period significantly plays a big role in both NOx reduction and NH3 regeneration
process during dynamic conditions.
Figure 55 shows results of conducting a steady-state mode (Mode-3) with different lean-
ON duration and the effect on the SCR performance. The lean-ON periods were manually
triggered to start and stop. The duration of the lean-ON period was further calculated based on
the rise and fall of the oxygen sensor signal which indicated the engine’s response in being
operated under lean-operation. The chart depicts nine lean-ON periods and all points were
triggered when there was noticeable NH3 slip after the SCR catalyst. Lean-ON with less than 2
seconds period did not gave any change in the steady-state operation in terms of NOx and NH3
from the TWC. However, increasing the lean-ON period for above 2 seconds showed increase
in the TWC NOx, indicated by the red diamond points (⧍), with highest (1919 ppm) observed
approximately 7 seconds. The blue circles indicate average NOx reduction during the lean-ON
periods and higher reduction are observed between (2 to 3) seconds of lean-ON periods. It also
shows that as we go higher in duration the overall NOx reduction decreases, since the maximum
NOx reduction mainly occurs during the initial rise of the NOx when NOx molecules comes
in direct contact with stored NH3 and unreacted NOx tends to slip through the catalyst. On the

91
other hand, decrease in NH3 slippage response after the lean-ON trigger were only observed
for higher duration events. The points with solid fills indicate the downward trend in post SCR
NH3 concentration, followed by the consequences of the lean-ON respective lean-ON periods.
Out of all events, the duration with 3 seconds lean-ON period resulted in 25% NOx reduction
and forced a downward trend in NH3 slip. Evaluating reactions mechanism in molar balance
will better indicate the duration needed for complete regeneration. In summary, the ammonia
storage ration becomes an important parameter in control-oriented model for SCR regeneration
using lean operation events. For simplicity, the study selects 3 seconds for the short-duration
and 4 seconds for the long-duration triggers, to be used by the fuzzy logic regen trigger output
variable.
Figure 55. Comparison of varying lean-ON periods (Mode 3)
5.4 Regeneration control using Fuzzy-Logic
An inference rule based fuzzy logic controller which required two sensor signals as input
variables in order to initiate regeneration trigger modes were developed and presented in this
section. Ranges for each membership function were chosen based on experimental data for the
observed values of NH3 and NOx after the SCR catalyst. Figure 56 presents the membership
function for each three fuzzy inputs used in designing the fuzzy logic controller. The size of
0
500
1000
1500
2000
2500
0.0
0.2
0.4
0.6
0.8
1.0
0 1 2 3 4 5 6 7 8
NO
x C
oncen
trat
ion [
pp
m]
NO
x C
onver
sio
n R
atio
lean-ON Duration [secs]
NOx Conversion
pre-SCR Peak NOx

92
each membership function within each defined linguistic variable varies based on the desired
control within the data range. Finer control of the ammonia slip is expected at lower range for
observed NH3 slip and potentially regen events. The control avoids large slip of NOx and,
hence, small slip levels of rules are given to maintain excessive NOx slip. In order to avoid large
variation in calculated rate of ammonia slip (RAS) due to fluctuation in the measured
concentration, it was calculated on the larger time scale observing the difference between the
current and prior concertation at 5 seconds of time interval.
Figure 56. Ammonia Slip (AS), Rate of Ammonia Slip (RAS), and NOx Slip (NOS) Membership Function
Figure 57, Figure 58 and Figure 59 presents the controller response when making uses
of membership function and inference rules developed fuzzy logic controller. Since, it was not
possible to model the combined (engine + TWC + SCR) system response due to complexity of

93
the system behavior, controller performance was investigated qualitatively against different
obtained test data from the steady-state and transient experiments. The charts show the fuzzy-
logic controller making regeneration triggers smoothly over NH3 slip and turning off in the
events of high NOx slip or low NH3 slip with decreasing rate of slip. The highlighted region
shows the area where the controller commands the regeneration state to be ON. The y-axis on
the right indicates the fuzzy output obtained from using middle of maximum method in the
membership function leading to crisp output of either be at regen-OFF, regen-ON with short-
dithering (0.625 fuzzy output), and on with long dithering (0.875 fuzzy output) modes. It’s well
observed that lean-ON periods would change the SCR behavior and the dynamic behavior of
very test would completely be different if the engine was operated with the fuzzy-logic
controller, based on feedback obtained from the two sensors. Additionally, the controller is a
time-based looped controller, meaning the control would turn on the regen event for a fixed
duration, either (SD or LD) and then operate back to a feedback loop observing the sensor
values.
The fuzzy-logic control was not validated on an actual test experiment, and hence, the
true nature of the controller performance on SCR regeneration would be inconclusive. The
controller needs to be tested, evaluated and fine-tuned with the help of hardware-in-loop (H-I-
L) setup which can be powered by the Arduino-DUE board as built in this study for the manual
lean-ON evaluation. The author recommends future validation for complete evaluation of the
controller performance over real-world conditions. This method can be seen as a viable choice
in stoichiometric natural gas engine operation to further meet fuel and emission standards with
scope of lean operation regime.

94
Figure 57. Fuzzy-logic controller response for steady-state Mode 8 (SCR 4)
Figure 58. Fuzzy-logic controller response for steady-state Mode 3 (SCR 4)

95
Figure 59. Fuzzy-logic controller response for transient FTP cycle (SCR 3)

96
5.5 Post-TWC NH3 estimation using ANN
This section summarizes the results obtained from utilizing ANN technique to estimate
post-TWC NH3 concentration using different engine parameters as training inputs. For the
input data set, two combined transient FTP tests were used to train the model initially with
seven different inputs and the measured NH3 concentration as the network output. The data
set consisted of 23,980 data points which is equivalent to 23,980 seconds of the transient cycle
measured. Figure 60 presents the input profile for all seven inputs used in training and evaluating
the AN-N model.
Figure 60. Transient FTP profile of the seven input variables

97
The selected network was trained with different network properties and resulted were
evaluated based on the estimated performance of the output parameter, i.e. NH3 concertation
after the TWC. Table 11 and Table 12, presents results obtained from training the input-output
network using two different training functions (Levenberg-Marquardt and Bayesian
Regularization). The tables also include using these training function with different number of
neurons. The results clearly show that with increasing neurons, we get better estimation of the
output, provided by the R-squared number (indicates how the close the data fitted to a linear
regression line) and Mean Square Error (MSE) number (indicates the quality of the estimation).
However, with computational time to train the network increases due to added neurons through
the network. It is also known that increasing the neurons increases the possibility of over
training and over fitting the dataset, and to avoid certain circumstances, the errors were
compared between the training, validation and test performances during each training iterations.
Further training would stop if six consecutive errors would increase between the trained and
validated errors. When comparing the performance between the two training functions,
Bayesian Regularization provide slightly better performance, especially at lower number of
neurons. The computational time for this function was significantly higher than Levenberg-
Marquardt.
Table 11. Comparison of performance using different number of neurons and Levenberg-Marquardt training function
Number of Neurons 10 20 30 40
R-squared 0.799 0.850 0.899 0.916
Overall MSE 578.4 422.2 278.3 235.2
Number of Iterations 50 68 134 109
Training Time [sec] 2.8 7.9 32.5 36.9
Table 12. Comparison of performance using different number of neurons and Bayesian Regularization training function
Number of Neurons 10 20 30 40
R-squared 0.844 0.889 0.902 0.916
Overall MSE 432.6 301.0 272.9 231.4
Number of Iterations 300 300 300 300
Training Time [sec] 16.0 40.7 64.5 104.5

98
Figure 61 and Figure 62, shows the estimated continuous traces of the NH3
concentration for Levenberg-Marquardt and Bayesian Regularization training functions,
respectively. The figures also provide the residual charts for visualization differences between
the actual and the measured. Examining the continuous traces, we see that the estimated NH3
concentration follows well with the actual measured curves (shown by the black line), but with
observed noise. The trained network was able estimate better for the first few peaks seen from
the profiles, especially when using 40 number of neurons (as depicted from the residual plots).
Figure 61. Results for measured versus estimated NH3 concentration using number of neurons and Levenberg-Marquardt training function

99
Figure 62. Comparison of measured and estimated NH3 concentration using different number of neurons and Bayesian Regularization training function
The study also evaluated performance of ANN using additional model inputs. The first
derivatives of the pre-and-post TWC temperatures were calculated as using as inputs in the
training a network with Bayesian Regularization and the four-same number of neurons as used
earlier for the evaluation. The study uses these inputs in order to identify and estimate any
additional correlation that would provide the formation of NH3 from in TWC system. Table 13
provides the performance with adding the two temperature derivatives as input to training of
the model. The result indicates slight improvement in the R-squared and MSE compared to
previous values. Adding the additional inputs resulted in taking more time in training the
network.

100
Table 13. Comparison of performance for four different number of neurons with Bayesian Regularization training function and additional two first derivative input
parameters
Number of Neurons 10 20 30 40
R-squared 0.858 0.896 0.919 0.921
Overall MSE 399.1 276.3 222.7 221.9
Number of Iterations 300 300 300 300
Training Time [sec] 19.8 47.8 88.4 133.9
The measured NH3 concertation were observed to be smoother, with sharp rises and
slower falls. The sudden rise in NH3 peaks follows the immediate rise in power causing higher
exhaust flowrate through the TWC during the cycle. On the other hand, the longer response in
the NH3 drop could potentially be from the thermal and chemical inertia accompanied by the
low flowrate at such conditions. The study further investigated data smoothening or filtering
methods to see if certain distinct response behavior could be captured and at the same time
minimize data fluctuation at lower power demand conditions. A filtering method known as
exponential weighted moving average (EWMA) was evaluated for the obtained results. EWMA
have been commonly used in statistical sensor estimation cases, one of its few applications in
the area of on-board diagnostics for vehicle emission control systems. Unlike, other simple
moving average which gives equal weighing on a period of data size provide as a time window
by the user, EWMA on the other hand, applies weighting factors which decrease exponentially
within the specified filtering period (FP). The filter was applied to the estimated dataset to
examine if this potentially reduces the lag by applying higher weights to the estimated peaks and
lower weights to the slow response of the trace. The filter performance for the best estimated
data set were evaluated based on the improvement in the MSE value. Figure 63 provides the
MSE results for using EWMA filter with different averaging period, and it is observed that for
a period of six data points resulted in the lowest MSE value for the given data set. Figure 64,
shows the comparison of the estimated NH3 concentration using between the filtered versus
the unfiltered results using EWMA filtering method with period 6. Based on the residual curves,
we do notice slight improvement in noise reduction.

101
Figure 63: Comparison of MSE using EWMA filter with different filtering periods
Figure 64. Comparison of measured and estimated NH3 concertation applying the EWMA filter (Filter Period = 6)
216
218
220
222
224
226
228
230
0 2 4 6 8 10 12 14
MS
E
Filter Period [Data Points]

102
Figure 65, shows the final estimated NH3 concentration trace using the best network
properties obtained from the above parametric analysis. The following estimation resulted in
having MSE equals to 218 and with a R-squared value of 0.93. It shows that, ANN method
using different engine and after-treatment parameters as in input factors can be used to capture
the formation of NH3 through the catalyst with some accuracy.
Figure 65. Comparison of measured and estimated NH3 concentration; (Number of Inputs = 9, Number of Neurons = 40, Fitting Function = Bayesian Regularization,
EWMA with Period = 6)
The primary objective of this specific work was to understand if precursor NH3 can be
accurately predicted from the TWC using engine parameters, especially under transient
conditions and then used the estimated value (instead of sensor based value) into the passive-
SCR model as one of the input parameter. The dynamics of adsorption and desorption behavior
is significantly influenced by the amount of NH3 entering and being stored on the surface of
the SCR catalyst. As in terms of quantity, the NH3 entering the SCR can be estimated and
evaluated in terms of moles per catalyst volume. The obtained estimated NH3 concertation from
the ANN is converted into estimated number of moles of NH3 per SCR catalyst volume
(moles/m3).
Figure 66 shows the cumulative profile of the estimated moles of NH3 per catalyst
volume over the duty-cycle. This representation provides the estimation of the available NH3
that is entering the SCR and can be stored by the catalyst. From basic visual inspection, the
estimated profile closely matches with the value obtained from actual measurement. The

103
difference in the number of moles at a given movement into the cycle is provide by Figure 67,
with a maximum value of approximately 0.28 moles/m3 at 943 seconds into the data cycle. For
the given cycle, the total moles of NH3 was calculated to be at 15.45 moles/m3 and 15.65
moles/m3, using actual measurement and AN-N estimated values, respectively.
Figure 66. Comparison of number of moles of NH3 per catalyst volume (moles/m3) calculated from actual versus estimated NH3 concentration.
Figure 67. Difference between actual and estimated number of moles of NH3 per catalyst volume

104
The best trained network obtained from the above analysis where then used to validate
on a different data set. Two similar FTP tests were used for the validation process and the
estimated NH3 concentration using the pre-trained network are provided by Figure 68 and
Figure 70. The first data set (FTP Data Set 1) validation resulted in MSE of 330.9 and r-squared
of 0.7485, and the second set (FPT Data Set 2) resulted in MSE of 859.02 and r-squared of
0.7003. The high NH3 concentration peaks observed did vary between the two FTP cycles, and
the network was able to define the higher peak but not the shorter peaks. The estimated profiles
also show high data fluctuation but overall followed the trend of the measured trace (shown by
the red curve). The adequacy of an AN-N trained model depend upon how well it validates a
diverse set of system behavior in predicting certain response. The study does realize the
shortcoming of models’ limitation along with not having appropriate parameters that influence
the dynamics of the TWC system in producing NH3 at various levels.
Figure 68. Comparison of actual versus estimated NH3 concertation using validation FTP Data Set 1

105
Figure 69 Comparison of actual versus estimated NH3 concertation using validation FTP Data Set 2
Figure 70 and Figure 71, represents the cumulative profile of the actual versus estimated
moles of NH3 per catalyst volume over the duty-cycle. From the observation, the values using
estimated concentration tend to over-predict the moles of available ammonia with a difference
of 24% for Set 1 and 18.8% for the Set 2 at the end of the cycle.
Figure 70. Comparison of actual versus estimated number of moles of NH3 per catalyst volume (moles/m3) for FTP Data Set 1

106
Figure 71. Comparison of actual versus estimated number of moles of NH3 per catalyst volume (moles/m3) for FTP Data Set 2
Considering the results obtained from the validation sets, the ammonia availability
model can be further optimized by reducing variation in the NH3 concentration estimation. The
estimated results from FTP Data Set 2 was further processed using EWMA filtering with
different number of filtering periods. Although, this approach might not be practical in
observing NH3 availibiltiy at a shorter resolution in the cycle but can be utilized in larger time-
scale observation methods.
Figure 72, shows results from applying EWMA filtering with different period numbers.
There wasn’t any notable change seen in NH3 availability profile when using filtering with 6
seconds and 15 seconds periods but better improvement when using a 30 second period. This
can also be observed from provided Figure 73, obtained from calculating the difference between
the actual and the estimated profiles. The number of moles from using 30 second settings
estimation under-predicts during first half of the cycle (due to smoothening of the NH3 high
peaks) and over-predicts for the other half of the cycle. This results in final estimated value of
6.91 moles/m3, i.e. 10% higher than actual measured 6.28 moles/m3.

107
Figure 72. Comparison of actual versus estimated number of moles of NH3 per catalyst volume (moles/m3) periods for FTP Data Set 2 using three different EWMA
filtering
Figure 73. Difference between actual versus estimated number of moles of NH3 per catalyst volume (moles/m3) periods for FTP Data Set 2 using three different EWMA
filtering

108
5.6 SCR model calibrated to experimental data
Parameters of the SCR model were identified by solving the system of reaction using
ODE solver and then calibrating the model against the experimental obtained data. The model
calibration was aimed at matching the solved gaseous concentration to the outlet of the SCR
using cost function, where the parameters are identified by minimaxing the least-square errors.
The developed model results with the obtain reaction parameters was validated with the steady
state mode 1 data.
Table 14 shows the reaction rate parameters identifies in the SCR state model based on
the experimental data. The values obtained here closely matches with the values seen in similar
literatures (Song 2013; Clark et al. 2009). The ammonia storage capacity (Ω) was assumed
constant at 100 moles/m3 in the calculation. The initial value for the ammonia storage ratio was
assumed to be at 0.15.
Table 14. Reaction rate identified parameters in the three state SCR model Parameter Number
Parameter Optimized
Values Unit
1 kreduction 3.63E+06 m3/mol-s
2 Ereduction 65.2 kJ/mol
3 kadsorption 5.48E+06 m3/mol-s
4 Eadsorption 47.6 kJ/mol
5 kdesorption 3.36E+06 1/2s
6 Edesorption 131 kJ/mol
Figure 74 displays comparison of model predicted NOx values with the measured
concentration using FTIR pre-and-post SCR. It can be seen the simulated NOx after the SCR
matches well before the 40th second but then overpredicts for the rest of the part. The initial
value of the ammonia storage ratio plays a key role due to the difference of the initial guess of
the ammonia storage for the model and the true storage ratio inside the SCR catalyst. This can
also be observed from the simulated ammonia storage ratio curve (shown by the dashed green
line in the figure) where ammonia storage ratio rapidly drops to zero indicating no NH3 stored
for NOx reduction reaction. Additionally, the reaction rates of the SCR reactions are highly
dependent on the NH3 storage capacity and changed the model outcome since the value
participates in all three state reactions. The simulation was rerun for a higher initial ammonia
storage value (0.7) using the same reaction parameters and comparison is shown inn Figure

109
75. The result indicates higher ammonia storage ratio till the 250 second with closer NOx
prediction than compared to the previous results.
Figure 74. Comparison of post-SCR NOx, post-SCR NH3 and NH3 storage ratio predicted by 3-state SCR model storage ratio for steady-state Mode 1 (baseline
operation); Initial ammonia storage ratio = 0.15
Figure 75. Comparison of post-SCR NOx, post-SCR NH3 and NH3 storage ratio predicted by 3-state SCR model for steady-state Mode 1 (baseline operation); Initial
ammonia storage ratio = 0.7;

110
Figure 76 provides results simulated from considering the NH3 oxidation mechanism
and adding three more parameters (E and k for oxidation, and Ω) as in the identification process.
The initial NH3 storage ratio was set at 0.15 for this simulation. The comparison of the simulated
NOx profile and the measured show good agreement till 150th second and then tend to
underestimate into rest of the cycle duration, except between (305-420) seconds. And, these
disparities could be due to NO2 formation that was seen in the actual measurement. The study
did not include NO2 formation mechanism in the SCR model.
Figure 76. Comparison of post-SCR NOx, post-SCR NH3 and NH3 storage ratio predicted by 3-state SCR model for steady-state Mode 1 (baseline operation); Initial
ammonia storage ratio = 0.15; Ω as identified parameter
Table 15 summarizes the identified values of 9 model parameters using GA’s
optimization tool. Ones again the obtained parameter correlates well with the ones provided in
literatures.

111
Table 15. Reaction rate identified parameters in the three state SCR model Parameter Number
Parameter Optimized Values Units
1 kreduction 2.84E+05 m3/mol-s
2 Ereduction 70.92 kJ/mol
3 kadsorption 5.45E+06 m3/mol-s
4 Eadsorption 46.6 kJ/mol
5 kdesorption 3.33E+09 1/s
6 Edesorption 125.1 kJ/mol
7 koxidation 6.57E+07 1/s
8 Eoxidation 129.8 kJ/mol
9 Ω 76.63 moles/m3

112
CHAPTER 6 Conclusions
The study presents evaluation of a pathway in mitigating secondary NH3 emission
produced by the TWC during stoichiometric operation of natural gas engines. The study
approaches the development of a passive ammonia reduction system by conducting experiments
on a heavy-duty natural gas engine and utilizing selective catalytic reduction units typically used
in diesel engines. The MY08 ISL-G Cummins engine equipped with the TWC after-treatment
system was evaluated for baseline performance and emission characteristics and tested over
transient and steady-state operating conditions. The study further evaluates an engine-based
control strategy to minimize both NH3 and NOx control over the TWC+SCR configuration.
The following sections highlights the major findings, provides recommendations, and
contextualizes studies contribution to relevant areas of interest.
6.1 Experimental Findings
The results obtained from the baseline evaluation indicated elevated levels of tailpipe
NH3 emission, with an average concentration of 37 ppm and 61 ppm for the FTP and WHTC
transient cycles, respectively. The high peaks of NH3 observed were caused by isolated rich AFR
conditions due to aggressive power demands within the tested cycles. Additionally, exhaust
temperatures were a crucial factor in NOx reduction and NH3 formation, where improved NOx
conversions were observed at higher TWC inlet temperatures but also resulted in increased NH3
formation over the TWC.
Correspondingly, the results obtained from evaluating five different formulated SCRs
showed that SCR 3 (Fe-zeolite with 400 cpsi) and SCR 4 (Cu-zeolite) absorbed above 90% of
the TWC’s generated NH3 below 375°C of averaged SCR temperatures. However, the Fe-zeolite
performed with 60-85% efficiency in NOX conversion above 300°C, while the Cu-zeolite
performed moderately between (40-65%) at all temperature ranges. Performance-based on NOx
conversion efficiency and storage capacity at both low and higher temperature ranges, observed
under dynamic natural gas engine operations, the study considered the Cu-zeolite SCR for an
adsorption and desorption study over eight steady-state modes. From these steady-state mode
experiments, it was observed that NH3 storage ratio and SCR catalyst temperature were the two
main factors in initiating desorption. Furthermore, from switching the engine to lean-burn
operation, the high NOx activity after the TWC could regenerate the stored NH3, however, the

113
levels in NH3 regeneration and NOx conversion depended upon different lean-ON duration.
The study compared different lean-ON periods evaluated for a medium speed/load operation
mode (Mode 6). Lean-ON duration between (2.5-3.5) seconds resulted in low moderate NOx
slip after the TWC, improved NOx conversion by the SCR and initiated NH3 regeneration
process. The study also evaluated fuel consumption differences, and the results indicated on
average a 2.1% brake specific fuel consumption improvement for the lean-ON operation when
compared to baseline stoichiometric operation over the entire 8 steady-state modes.
The study further investigated model-based estimator methods from a stand-point of
control-oriented passive-SCR regeneration approach. Results obtained from Model 1 indicated
that the ANN fitting method estimated accumulated pre-SCR NH3 in moles per SCR volume
to be 1.3% higher than the actual measured when using 9 different inputs form two combined
FTP data sets for training. However, during the validation process, the ANN estimated
significantly higher differences of 25.6% and 16.8% for two different individual FTP data sets.
The study further evaluated using an EWMA filter with different filtering windows, and showed
that the accumulation of NH3 at the SCR inlet could be estimated more accurately at a larger
time scale.
On the other hand, results obtained from Model 2 adequately estimated post-SCR NOx
and NH3 adsorption for lower speed/load steady-state modes but the model was not able to
estimate NH3 desorption rise at higher steady-state modes. The differences observed in post-
SCR NOx and NH3 could be attributed to assuming an initial NH3 storage ratio that could have
been different from the actual NH3 storage of the SCR in the beginning of each steady-state
test. Additionally, the ammonia storage capacity, which have shown to vary with SCR surface
temperature from other related studies, was kept constant during the parameter identification
process.
6.2 Recommendations
The current study was limited by the SCR design parameters, and the performance of
the SCR in NH3 storage and NOx reduction characteristics could be improved with specifically
designed catalyst to meet the natural gas engine operation’s ranges. In addition, the study
observed NO2 being formed over the Cu-zeolite SCR catalyst with NO2/NO ratios as close to
1:1 under certain conditions. As a result, a two stage SCR system could potentially allow
improvements that considers the fast-SCR reactions.
114
Beside from the adequate SCR system downstream of the TWC, the engine based
control strategy that was developed using fuzzy logic method, can be improved in an
experimental study using a H-I-L setup to fine-tune possible input-output parameters. For
example, the size of membership functions and the inference rule matrix could be increased for
better regeneration status control. Along with the size, other shapes in defining the membership
functions could also be considered.
Ammonia storage ratio has shown to be a good indicator in estimating the state of the
SCR, and utilizing this as one of the fuzzy input parameters would allow wider range of SCR
regeneration control. For example, the regen status could be switched to ON mode by
monitoring the ammonia storage ratio which indicates saturation level of the SCR catalyst over
a duty cycle, even when there is no NH3 or NOx being slipped after the SCR. This would allow
improved fuel consumptions due to more frequent lean-ON operations.
The study was limited with engine and after-treatment parameters that were used in the
ANN Model-1. However, the estimation could be improved by conducting further analysis with
other influential factors that links to formation of NH3 over the TWC. For example, using
engine parameters such as actual measured air fuel ratio, mass rate of EGR, in-cylinder
combustion parameters, and more. Using additional emission sensors at the inlet of the TWC
and instrumenting mid-brick temperatures would potentially help in improving the estimation
accuracy but could lead to adding hardware cost and increasing computational time.
On the other hand, Model-2 could also be improved by assuming more higher order
reaction processes and adding potential SCR mechanisms that were not considered in this study.
Although, the study used only the inlet SCR temperatures, using catalyst temperature models
through the catalyst could potentially help in determining desorption characteristics as observed
during the transient and steady-state tests.
6.3 Contributions
This dissertation contributes to the area of alternative fueled vehicles and their emission
reduction challenges. Few researchers have addressed the concerns over high emission levels of
ammonia observed from stoichiometric operated natural gas vehicles equipped with a TWC
system, and previous work primarily focused on gasoline fueled engines only. As a preliminary
part of this work, the study investigated a heavy-duty natural gas engine with a comprehensive
evaluation of ammonia formation over the three-way catalyst in relation to dynamic engine

115
operating parameters. The results obtained in this study pose a critical need to monitor NH3
emission from stoichiometric natural gas vehicles which in the near future could be regulated at
tailpipe levels as seen in diesel vehicles with urea-SCR technology.
In addition, the passive ammonia reduction pathway utilizing an SCR system that was
evaluated in this study could also lead to meeting the low-NOx emission standards. The USEPA
has initiated rulemaking for low-NOx emission standards, and if in force, the new standard
would require all new heavy-duty vehicles to meet 0.02 g/bhp-hr NOx regulation starting from
the year 2024. This would involve vehicle manufacturers to reduce NOx emission by almost
90% from the current standards, and would require significant after-treatment development
strategies.
As a final remark, this study specifically introduces techniques in operating dedicated
natural gas engines at or near stoichiometric point to more lean-burn combustion regimes.
Engines deigned for more lean-burn operation can make use of higher compression ratios, and
thus provide improved performance and more efficient fuel use than those in conventional
spark ignited engines. The engine-based air-fuel ratio dithering strategy using a fuzzy-logic
controller was designed to lower both NH3 and NOx emissions, however, has also shown to
provide fuel consumption improvements. The fuzzy-logic controller which needs only two
sensor values as inputs can further be expanded into using ammonia storage ratios as one of the
linguistic variables. In addition, with the two-regeneration outputs, short-dithering and long-
dithering modes, would further expand the operation of lean-burn activity to a much larger
scale. This would be a promising pathway for off-road and stationary dedicated natural gas
engines since the air-fuel ratio could be precisely controlled over steady-state duty cycles, also
from a model-based ammonia storage and control development standpoint.

116
REFERENCES
Barbier, Jacques, and Daniel Duprez. 1994. “Steam Effects in Three-Way Catalysis.” Applied Catalysis B: Environmental 4 (2): 105–40. doi:http://dx.doi.org/10.1016/0926-3373(94)80046-4.
Battye Viney P., Roelle, Paul A., William; Aneja. 2003. “Evaluation and Improvement of Ammonia Emissions Inventories.” Atmospheric Environment 37 (2003): 3873–83.
Blanco-Rodriguez, Dr-Ing David. 2014. Modelling and Observation of Exhaust Gas Concentrations for Diesel Engine Control. doi:10.1007/978-3-319-06737-7.
Bosch, Hans, and Frans Janssen. 1988. “Catalytic Reduction of Nitrogen Oxides.” Catalysis Today 2 (4): V.
Cavataio, Giovanni, Hung-wen Jen, James R Warner, James W Girard, Jeong Y Kim, and Christine K Lambert. 2008. “Enhanced Durability of a Cu / Zeolite Based SCR Catalyst.” SAE International Journal of Fuels and Lubricants 1 (1): 477–87. doi:10.4271/2008-01-1025.
Cesare, Matteo De, and Federico Covassin. 2011. “Neural Network Based Models for Virtual NOx Sensing of Compression Ignition Engines.” SAE International. doi:10.4271/2011-24-0157.
CFR40/1065/SubB. 2017. “§1065.140 Dilution for Gaseous and PM Constituents.” Accessed November 21. https://www.ecfr.gov/.
CFR40/1065/SubD. 2017. “Subpart D — Calibrations and Verifications.” Accessed November 21. https://www.ecfr.gov/.
Chatterjee, Daniel, Thomas Burkhardt, Brigitte Bandl-Konrad, Tillmann Braun, Enrico Tronconi, Isabella Nova, and Cristian Ciardelli. 2005. “Numerical Simulation of Ammonia SCR-Catalytic Converters : Model Development and Application.” SAE Transactions 114 (4): 437–48. doi:10.4271/2005-01-0965.
Chavannavar, Praveen. 2014. “Development and Implementation of a Mapless, Model Based SCR Control System.” SAE International. doi:10.4271/2014-01-9050.
Chen, Pingen, and Junmin Wang. 2014. “Sliding-Mode Observers for Urea Selective Catalytic Reduction System State Estimations Based on Nitrogen Oxide Sensor Measurements.” Proceedings of the Institution of Mechanical Engineers, Part D: Journal of Automobile Engineering 229 (7): 954407014548052. doi:10.1177/0954407014548052.
Chen, Pingen, and Junmin Wang. 2015. “A Novel Cost-Effective Robust Approach for Selective Catalytic Reduction State Estimations Using Dual Nitrogen Oxide Sensors.” Proceedings of the Institution of Mechanical Engineers, Part D: Journal of Automobile Engineering 229 (1): 83–96. doi:10.1177/0954407014526570.
Chi, John N. 2009. “Control Challenges for Optimal NOx Conversion Efficiency from SCR Aftertreatment Systems.” SAE International. doi:10.4271/2009-01-0905.
Ciardelli, Cristian, Isabella Nova, Enrico Tronconi, Brigitte Konrad, Daniel Chatterjee, Karlheinz Ecke, and Michel Weibel. 2004. “SCR-DeNOx for Diesel Engine Exhaust Aftertreatment: Unsteady-State Kinetic Study and Monolith Reactor Modelling.” Chemical Engineering Science 59 (22–23): 5301–9. doi:10.1016/j.ces.2004.07.016.
Clark, Nigel, D Ph, Gregory Thompson, D Ph, Mridul Gautam, D Ph, Benjamin Shade, et al. 2009. “Optimization of a Retrofit Urea-SCR System Clinton R . Bedick Dissertation Submitted to the College of Engineering and Mineral Resources at West Virginia University in Partial Fulfillment of

117
the Requirements for the Degree of Doctor of Philosophy in Mecha.”
Colombo, Massimo, Grigorios Koltsakis, Isabella Nova, and Enrico Tronconi. 2012. “Modelling the Ammonia Adsorption–desorption Process over an Fe–zeolite Catalyst for SCR Automotive Applications.” Catalysis Today 188 (1): 42–52. doi:http://dx.doi.org/10.1016/j.cattod.2011.09.002.
Colombo, Massimo, Isabella Nova, and Enrico Tronconi. 2010. “A Comparative Study of the NH3-SCR Reactions over a Cu-Zeolite and a Fe-Zeolite Catalyst.” Catalysis Today 151 (3–4): 223–30. doi:http://dx.doi.org/10.1016/j.cattod.2010.01.010.
Defoort, M, D Olsen, and B Willson. 2004. “The Effect of Air-Fuel Ratio Control Strategies on Nitrogen Compound Formation in Three-Way Catalysts.” International Journal of Engine Research 5 (1): 115–22. doi:10.1243/146808704772914291.
Delgado, Oscar, and Rachel Muncrief. 2015. “Assessment of Heavy-Duty Natural Gas Vehicle Emissions: Implications and Policy Recommendations.” http://www.theicct.org/sites/default/files/publications/ICCT_NG-HDV-emissions-assessmnt_20150730.pdf.
Devarakonda, M, J Johnson, and G Parker. 2012. “NOx Control Systems and Methods for Controlling NOx Emissions” US20120260.
Devarakonda, M, G Parker, and J H Johnson. 2008. “Adequacy of Reduced Order Models for Model-Based Control in a Urea-SCR Aftertreatment System.” SAE Technical Paper Series 2008 (724): 776–90. doi:10.4271/2008-01-0617.
Eijnden, Edwin v d, Robert Cloudt, Frank Willems, and Peter v d Heijden. 2009. “Automated Model Fit Tool for SCR Control and OBD Development.” SAE International. doi:10.4271/2009-01-1285.
Figura, Jiri, Dejan Kihas, Jaroslav Pekar, Michael Uchanski, Nassim Khaled, and Sriram Srinivasan. 2016. “Automotive Selective Catalytic Reduction System Model-Based Estimators for On-ECU Implementation: A Brief Overview.” SAE International. doi:10.4271/2016-01-0972.
Franco S. Francisco; German, John; Mock, Peter, Vicente; Posada. 2014. “Real-World Exhaust Emissions from Modern Diesel Cars Part 1: Aggregated Results.” The International Council on Clean Transportation.
Frobert, Arnaud, Yann Creff, Stéphane Raux, Christophe Charial, Arnaud Audouin, and Laurent Gagnepain. 2009. “SCR for Passenger Car: The Ammonia-Storage Issue on a Fe-ZSM5 Catalyst.” SAE International. doi:10.4271/2009-01-1929.
González-velasco, Juan R, Juan A Botas, Raquel Ferret, M Pilar González-marcos, Jean-louis Marc, and Miguel A Gutiérrez-ortiz. 2000. “Thermal Aging of Pd / Pt / Rh Automotive Catalysts under a Cycled Oxidizing – Reducing Environment” 59: 395–402.
Grossale, Antonio, Isabella Nova, and Enrico Tronconi. 2008. “Study of a Fe-Zeolite-Based System as NH3-SCR Catalyst for Diesel Exhaust Aftertreatment.” Catalysis Today 136 (1–2): 18–27. doi:10.1016/j.cattod.2007.10.117.
Guralp, Orgun, Gongshin Qi, Wei Li, and Paul Najt. 2011. “Experimental Study of NO X Reduction by Passive Ammonia-SCR for Stoichiometric SIDI Engines.” Society of Automotive Engineers (SAE). SAE International. doi:10.4271/2011-01-0307.
Haga, Hisao, Hiroyuki Kojima, Naoko Fukushi, Naoki Ohya, and Takuya Mito. 2015. “Optimized NH3 Storage Control for Next Generation Urea-SCR System.” SAE International. doi:10.4271/2015-01-1024.

118
Herman, Andrew, Ming-Cheng Wu, David Cabush, and Mark Shost. 2009. “Model Based Control of SCR Dosing and OBD Strategies with Feedback from NH3 Sensors.” SAE International. doi:10.4271/2009-01-0911.
Hsieh, M.-F., and J Wang. 2011. “Sliding-Mode Observer for Urea-Selective Catalytic Reduction (SCR) Mid-Catalyst Ammonia Concentration Estimation.” International Journal of Automotive Technology 12 (3): 321. doi:10.1007/s12239-011-0038-4.
Hsieh, Ming Feng, and Junmin Wang. 2010. “An Extended Kalman Filter for Ammonia Coverage Ratio and Capacity Estimations in the Application of Diesel Engine SCR Control and Onboard Diagnosis.” In Proceedings of the 2010 American Control Conference, 5874–79. doi:10.1109/ACC.2010.5530516.
Hsieh, Ming Feng, and Junmin Wang. 2011. “Development and Experimental Studies of a Control-Oriented SCR Model for a Two-Catalyst Urea-SCR System.” Control Engineering Practice 19 (4). Elsevier: 409–22. doi:10.1016/j.conengprac.2011.01.004.
Huai, T, T D Durbin, J W Miller, J T Pisano, C G Sauer, S H Rhee, and J M Norbeck. 2003. “Investigation of NH3 Emissions from New Technology Vehicles as a Function of Vehicle Operating Conditions.” Environ Sci Technol 37 (21): 4841–47.
I. Nova, M Colombo and E Tronconi. 2011. “Kinetic Modeling of Dynamic Aspects of the Standard NH3-SCR Reaction Over V2O5-WO3_TiO2 and Fe-Zeolite Commercial Catalysts for the Aftertreatment of Diesel Engines Exhausts.” Oil & Gas Science and Technology 66 (4): 681–91. doi:10.2516/ogst/2011132.
IARC, International Agency for Research on Cancer. 2013. “IARC: Outdoor Air Pollution a Leading Environmental Cause of Cancer Deaths.” World Health Organization.
Jääskeläinen, Hannu, and W Addy Majewski. 2016. “Urea Dosing Control,” 1–20.
Jinbiao, Ning, and Yan Fengjun. 2015. “Nonlinear Disturbance Observer Design for Estimation of Ammonia Storage Ratio in Selected Catalytic Reduction Systems.” In 2015 American Control Conference (ACC), 495–500. doi:10.1109/ACC.2015.7170784.
Johnson, Timothy V. 2009. “Diesel Emission Control in Review.” In SAE. Vol. 2012-01–03.
Kamasamudram, Krishna, Neal Currier, Tamas Szailer, and Aleksey Yezerets. 2010. “Why Cu- and Fe-Zeolite SCR Catalysts Behave Differently At Low Temperatures.” SAE International. doi:10.4271/2010-01-1182.
Karavalakis, Georgios, Maryam Hajbabaei, Yu Jiang, Jiacheng Yang, Kent C. Johnson, David R. Cocker, and Thomas D. Durbin. 2016. “Regulated, Greenhouse Gas, and Particulate Emissions from Lean-Burn and Stoichiometric Natural Gas Heavy-Duty Vehicles on Different Fuel Compositions.” Fuel 175. Elsevier Ltd: 146–56. doi:10.1016/j.fuel.2016.02.034.
Keuper, Andreas, Hiie-Mai Ida Unger, Jia Huang, Harald Bressler, and Wolfgang Albrecht. 2011. “Investigations to Achieve Highest Efficiencies in Exhaust Gas After-Treatment for Commercial Vehicles Using an SCR System.” SAE 2011-01–22.
Kim, Chang Hwan, Kevin Perry, Michael Viola, Wei Li, and Kushal Narayanaswamy. 2011. “Three-Way Catalyst Design for Urealess Passive Ammonia SCR: Lean-Burn SIDI Aftertreatment System.” SAE Technical Paper. SAE International. doi:10.4271/2011-01-0306.
Koebel, Manfred, Martin Elsener, and Giuseppe Madia. 2001. “Recent Advances in the Development

119
of Urea-SCR for Automotive Applications.” SAE 2001-01–36.
Kröcher, O. 2007. “Chapter 9 Aspects of Catalyst Development for Mobile Urea-SCR Systems - From Vanadia-Titania Catalysts to Metal-Exchanged Zeolites.” Studies in Surface Science and Catalysis 171 (January). Elsevier: 261–89. doi:10.1016/S0167-2991(07)80210-2.
Krupa, S V. 2003. “Effects of Atmospheric Ammonia (NH3) on Terrestrial Vegetation: A Review.” Environ Pollut 124 (2): 179–221.
Li, Wei, Kevin L. Perry, Kushal Narayanaswamy, Chang Hwan Kim, and Paul Najt. 2010. “Passive Ammonia SCR System for Lean-Burn SIDI Engines.” SAE International Journal of Fuels and Lubricants 3 (1). SAE International: 2010-01–0366. doi:10.4271/2010-01-0366.
Livingston, Cody, Paul Rieger, and Arthur Winer. 2009. “Ammonia Emissions from a Representative in-Use Fleet of Light and Medium-Duty Vehicles in the California South Coast Air Basin.” Atmospheric Environment 43 (21): 3326–33. doi:10.1016/j.atmosenv.2009.04.009.
Majewski, W Addy. 2005. “Selective Catalytic Reduction.” https://www.dieselnet.com/tech/cat_scr.php.
Marins, J. L. 2000. “An Extended Kalman Filter for Quaternion-Based Attitude Estimation.” Thesis Master, no. x: 3033–38. http://oai.dtic.mil/oai/oai?verb=getRecord&metadataPrefix=html&identifier=ADA384973.
Matam, Santhosh Kumar, E H Otal, M H Aguirre, A Winkler, A Ulrich, D Rentsch, A Weidenkaff, and D Ferri. 2012. “Thermal and Chemical Aging of Model Three-Way Catalyst Pd/Al2O3 and Its Impact on the Conversion of CNG Vehicle Exhaust.” Catalysis Today 184 (1): 237–44. doi:http://dx.doi.org/10.1016/j.cattod.2011.09.030.
Mathworks. 2016. “Fuzzy Logic Toolbox TM User Guide,” 1–285.
Mathworks. 2017. “Neural Network Toolbox User’s Guide.”
MathWorks. 2017. “Solve Stiff Differential Equations and DAEs; Variable Order Method - MATLAB ode15s.” Accessed November 22. http://www.mathworks.com/help/matlab/ref/ode15s.html.
McKinley, Thomas L, and Andrew G Alleyne. 2009. “A Switched, Controls-Oriented SCR Catalyst Model Using On-Line Eigenvalue Estimation.” SAE International. doi:10.4271/2009-01-1284.
Mejía-Centeno, Isidro, and Gustavo A. Fuentes. 2009. “Nitrous Oxide Formation during Light-off over a Commercial Pd-Containing Three-Way Catalytic Converter: The Effect of Low-Sulfur Gasoline.” Chemical Engineering Communications 196 (10): 1140–51. doi:10.1080/00986440902831664.
Moos, Ralf, Ralf Müller, Carsten Plog, Aleksandar Knezevic, Holger Leye, Eckard Irion, Tillmann Braun, Klaus-Jürgen Marquardt, and Klaus Binder. 2002. “Selective Ammonia Exhaust Gas Sensor for Automotive Applications.” Sensors and Actuators B: Chemical 83 (1–3): 181–89. doi:http://dx.doi.org/10.1016/S0925-4005(01)01038-3.
Nagashima, K, G Zhang, T Hirota, and H Muraki. 2000. “The Effect of Aging Temperature on Catalyst Performance of Pt/Rh and Pd/Rh TWCs.” SAE International. doi:10.4271/2000-01-1954.
NGK. 2017. “Primary Uses Sample Measurements.”
NGV Global. 2017. “Current Natural Gas Vehicle Statistics.” http://www.iangv.org/current-ngv-stats/.
Nova Enrico, Isabella; Tronconi. 2014. Urea-SCR Technology for deNOx After Treatment of Diesel

120
Exhausts. Fundamental and Applied Catalysis. Springer: Springer New York.
Ohtsuka, Hirofumi. 2015. “Pt-Rh/CeO2-Al2O3 for Controlling Emissions from Natural Gas Engines: Three-Way Catalytic Activity at Low Temperatures and Effects of SO2 Aging.” Emission Control Science and Technology 1 (1): 108–16. doi:10.1007/s40825-014-0009-0.
Ong, Chun, Anuradha Annaswamy, Ilya V Kolmanovsky, Paul Laing, and Dennis Reed. 2010. “An Adaptive Proportional Integral Control of a Urea Selective Catalytic Reduction System Based on System Identification Models.” SAE International. doi:10.4271/2010-01-1174.
Pant, Atul, and Steven J. Schmieg. 2011. “Kinetic Model of NOx SCR Using Urea on Commercial Cu-Zeolite Catalyst.” Industrial and Engineering Chemistry Research 50 (9): 5490–98. doi:10.1021/ie200060s.
Perhinschi, Mario. 2016. Artificial Intelligence Techniques in MAE Chapter 3 Part 1,2,3 and 4.
Prié, Yannick, B E N Abdallah, B E N Abdallah, Mark Hudson Beale Martin T. Hagan Howard B. Demuth, Etudes Technologiques, Bacha Amira Date, Craig Warren, et al. 2015. “Neural Network Toolbox User â€TM S Guide.” MathWorks, no. June: 2–3. doi:10.1002/0471221546.
Prikhodko, Jim Parks and Vitaly. 2009. “Ammonia Production and Utilization in a Hybrid LNT+SCR System.” SAE Techinical Paper 4970 (November 2009): 2009–2739. doi:10.4271/2009-01-2739.
Prikhodko, Vitaly Y., James E. Parks, Josh A. Pihl, and Todd J. Toops. 2016. “Ammonia Generation and Utilization in a Passive SCR (TWC+SCR) System on Lean Gasoline Engine.” SAE International Journal of Engines 9 (2). SAE International: 2016-01–0934. doi:10.4271/2016-01-0934.
Quiros, David C, Arvind Thiruvengadam, Saroj Pradhan, Marc Besch, Pragalath Thiruvengadam, Berk Demirgok, Daniel Carder, Adewale Oshinuga, Tao Huai, and Shaohua Hu. 2016. “Real-World Emissions from Modern Heavy-Duty Diesel, Natural Gas, and Hybrid Diesel Trucks Operating Along Major California Freight Corridors.” Emission Control Science and Technology 2 (3): 156–72. doi:10.1007/s40825-016-0044-0.
Renner, Eberhard, and Ralf Wolke. 2008. “Formation of Secondary Inorganic Aerosols by High Ammonia Emissions Simulated by LM/MUSCAT.” In Air Pollution Modeling and Its Application XIX, edited by Carlos Borrego and Ana Isabel Miranda, 522–29. Dordrecht: Springer Netherlands. doi:10.1007/978-1-4020-8453-9_57.
Sabatini, Stefano, Irfan Kil, Travis Hamilton, Jeff Wuttke, Luis Del Rio, Michael Smith, Zoran Filipi, Mark A Hoffman, and Simona Onori. 2016. “Characterization of Aging Effect on Three-Way Catalyst Oxygen Storage Dynamics.” SAE International. doi:10.4271/2016-01-0971.
Sanchonx. 2017. “Interferometer for FTIR.” Accessed November 28. https://commons.wikimedia.org/wiki/File:FTIR_Interferometer.png.
Shi, Xian, Reinhard Seiser, Jyh-Yuan Chen, Robert Dibble, and Robert Cattolica. 2015. “Fuel-Dithering Optimization of Efficiency of TWC on Natural Gas IC Engine.” SAE International. doi:10.4271/2015-01-1043.
Skaf, Zakwan, Timur Aliyev, Leo Shead, and Thomas Steffen. 2014. “The State of the Art in Selective Catalytic Reduction Control.” SAE International. doi:10.4271/2014-01-1533.
Song, Xiaobo. 2013. “A SCR Model Based on Reactor and Engine Experimental Studies for a Cu-Zeolite Catalyst.” Mechanical Engineering. Michigan Technological University.
Song, Xiaobo, Gordon Parker, John Johnson, Jeffrey Naber, and Josh Pihl. 2013. “A Modeling Study of

121
SCR Reaction Kinetics from Reactor Experiments.” Sae Technincal Paper Series, no. 2013-01–1576. doi:10.4271/2013-01-1576.
Stanton, Donald, Stephen Charlton, and Phani Vajapeyazula. 2013. “Diesel Engine Technologies Enabling Powertrain Optimization to Meet U.S. Greenhouse Gas Emissions.” SAE International. doi:10.4271/2013-24-0094.
Stanton, Donald W. 2013. “Systematic Development of Highly Efficient and Clean Engines to Meet Future Commercial Vehicle Greenhouse Gas Regulations.” SAE International. doi:10.4271/2013-01-2421.
Suarez-Bertoa, R, A A Zardini, and C Astorga. 2014. “Ammonia Exhaust Emissions from Spark Ignition Vehicles over the New European Driving Cycle.” Atmospheric Environment 97: 43–53. doi:http://dx.doi.org/10.1016/j.atmosenv.2014.07.050.
Sun, Kang, Lei Tao, David J Miller, Da Pan, Levi M Golston, Mark A Zondlo, Robert J Griffin, et al. 2016. “Vehicle Emissions as an Important Urban Ammonia Source in the United States and China.” Environ Sci Technol. American Chemical Society. doi:10.1021/acs.est.6b02805.
Tengyu Liu Boguang Wang, Xiang Ding, Wei Deng, Sujun Lü, Yanli Zhang, Xinming Wang. 2014. “Emission Factor of Ammonia (NH3) from on-Road Vehicles in China: Tunnel Tests in Urban Guangzhou.” Environment Research Letters 9 (6).
Tennison, Paul, Christine Lambert, and Michael Levin. 2004. “NOx Control Development with Urea SCR on a Diesel Passenger Car.” SAE International. doi:10.4271/2004-01-1291.
Theis, Joseph R., Jeong Kim, and Giovanni Cavataio. 2015. “Passive TWC+SCR Systems for Satisfying Tier 2, Bin 2 Emission Standards on Lean-Burn Gasoline Engines.” SAE International Journal of Fuels and Lubricants 8 (2): 2015-01–1004. doi:10.4271/2015-01-1004.
Thiruvengadam, Arvind, Marc Besch, Daniel Carder, Adewale Oshinuga, Randall Pasek, Henry Hogo, and Mridul Gautam. 2016. “Unregulated Greenhouse Gas and Ammonia Emissions from Current Technology Heavy-Duty Vehicles.” Journal of the Air & Waste Management Association 66 (11): 1045–60. doi:10.1080/10962247.2016.1158751.
Upadhyay, Devesh, and Michiel Van Nieuwstadt. 2006. “Model Based Analysis and Control Design of a Urea-SCR deNOx Aftertreatment System.” Journal of Dynamic Systems, Measurement, and Control 128 (3): 737. doi:10.1115/1.2234494.
USEPA. 2011. “Department of Transportation.” Federal Register 76 (179). https://www.gpo.gov/fdsys/pkg/FR-2011-09-15/pdf/2011-20740.pdf.
USEPA. 2016. “Engine Certification and Compliance Testing.” USEPA. https://www.epa.gov/vehicle-and-fuel-emissions-testing/engine-certification-and-compliance-testing.
Wang, D, S Yao, D Racine, D Cabush, and M Shost. 2007. “Ammonia Sensor for SCR NOx Reduction.” In DEER Conf.
Wang, Dongliang, Kaisheng Huang, Xiaozhong Wu, and Yinhui Wang. 2011. “The Impact of Oxygen Sensor Degradation on Air-Fuel Ratio and Emissions.” 2011 International Conference on Electric Information and Control Engineering, ICEICE 2011 - Proceedings, no. 2007: 2773–76. doi:10.1109/ICEICE.2011.5776926.
Willems, Frank, Robert Cloudt, Edwin van den Eijnden, Marcel van Genderen, Ruud Verbeek, Bram de Jager, Wiebe Boomsma, and Ignace van den Heuvel. 2007. “Is Closed-Loop SCR Control Required to Meet Future Emission Targets?” SAE Technical Papers 2007 (x). doi:10.4271/2007-01-1574.

122
Zhang, Hui, Junmin Wang, and Yue Yun Wang. 2015. “Removal of NO Xsensor Ammonia Cross Sensitivity from Contaminated Measurements in Diesel-Engine Selective Catalytic Reduction Systems.” Fuel 150 (x): 448–56. doi:10.1016/j.fuel.2015.02.053.
Zhao, Yanguang, Jing Hu, Lun Hua, Shijin Shuai, and Jianxin Wang. 2011. “Ammonia Storage and Slip in a Urea Selective Catalytic Reduction Catalyst under Steady and Transient Conditions.” Industrial & Engineering Chemistry Research 50 (21). American Chemical Society: 11863–71. doi:10.1021/ie201045w.

123
APPENDIX A FTIR Specification
Table 16. FTIR Specification from Manufacturer
Model MultiGasTM
2030-HS
Measurement Technique FTIR Spectrometry
Gases and Vapors Measurable Most molecules except for N2, H2, and O2
Ranges Concentration setting between 100ppb and 100% full scale
FTIR 2102 Process FTIR
Spectral Resolution 0.5 - 128cm-1
Scan Speed 5 scans/sec @ 0.5cm-1
Scan Time 0.2 sec or longer
Infrared Source Silicon Carbide @ 1200°C
Reference Laser Helium Neon (15798.2cm-1
)
Detector LN2 -cooled MCT; TE -cooled MCT
Purge Pressure 20 psig (1.5 bar) max.
Spectrometer Purge Flow 0.2 L/min of dry nitrogen or CO2 free clean dry air with dewpoints below -70°C
Optics Purge Flow 0.2 L/min of dry nitrogen or CO2 free clean dry air with dewpoints below -70°C
Pressure Transducer MKS Baratron®
Purge Connection Swagelok® quick connect
Computer High speed xeon™ processor supplied with analyzer
Communications RJ-45 cross-over Ethernet
Output Options xML, analog, AK, others (please inquire)
Dimensions 17.5"W x 12.5"H x 25.5"D
Installation 19" rack mount chassis
Power 120 or 240 VAC, 50/60 Hz, 3 amps
Weight 110 lbs. (50 kg)
Sample Temperature Ambient to 200°C (calibration temperature dependant)
Sample Flow 1 - 100+ L/min
0.0 - 1.3 atm (calibration pressure dependant)
0.95 - 1.05 atm (nominal)
Construction Nickel coated Al; Welded 316 stainless steel optional
Fittings ½" Swagelok®
Tubing Heated ½" stainless steel
Mirrors Nickel plated aluminum substrate, with rugged gold coating
Windows KBr; CaF2 (others available)
O-rings Viton® (others available)
Name (formula) Lowest Detectable Limit with 20/20™ Cell and 0.2 sec Measurement
Ammonia (NH3) 0.5 ppm
Carbon Dioxide (CO2) 0.2 ppm
Carbon Monoxide (CO) 1.0 ppm
Formaldehyde (H2CO) 0.6 ppm
Methane (CH4) 1.0 ppm
Nitrogen Dioxide (NO2) 0.5 ppm
Nitric Oxide (NO) 1.0 ppm
Sulfur Dioxide (SO2) 1.0 ppm
xylenes (C8H10) 1.0 ppm
Analyzer
Sampling Parameters
Sample Pressure
Gas Cell
Detection Limits
Low-level detection limits for the 5.11 meter gas cell and a mercury-cadmium-telluride (MCT) detector at 0.5 cm-1
resolution for typical

124
APPENDIX B Fuzzy Logic Controller Design and Program Code
Figure 77. MATLAB®’s Fuzzy-Logic Toolbox (FL Main Design Interface)
Figure 78. MATLAB®’s Fuzzy-Logic Toolbox (FL Membership Function Design Interface)

125
Figure 79. MATLAB®’s Fuzzy-Logic Toolbox (FL Inference Rule Design Interface)
Figure 80. MATLAB®’s Fuzzy-Logic Toolbox (FL Rule Viewer)

126
~~~~ passive-ARC Regeneration Fuzzy-Logic Simulation Program ~~~~
clc
clear all
% Import FL Controller::
FLController = 'passiveARC FLC.fis';
FLC = readfis(FLName);
% Import Input Data::
ExpData = 'FTP_1.mat';
NOS = Data.SensorNOx(:,1); % [Units: ppm]
AS = Data.SensorNH3(:,1); % [Units: ppm]
load(ExpData)
% Evaluate Inputs::
% Linguistic Variable-1 [Ammonia Slip, post SCR NH3]
AS(AS < 0 ) = 0;
% Linguistic Variable-2 [Rate of Ammonia Slip]
RateDelay = 5; % [Units: sec]
for i = 1:length(AS)
if i > RateDelay
RAS(i) = AS(i)-AS(i-RateDelay);
else
RAS(i) = 0; % [Units: ppm/period in secs]
end
end
% Linguistic Variable-3 [NOx slip]
NOS(NOS < 0 ) = 0;
% Evaluate Output [Regeneration Status]
RegenStatus = evalfis([AS,RAS,NOS],FLC);
FLC.fis
[System]
name ='passiveARC FLC'
Type ='mamdani'
Version =2.0
NumInputs =3
NumOutputs =1
NumRules =48
AndMethod ='min'
OrMethod ='max'
ImpMethod ='min'
AggMethod ='max'
DefuzzMethod='mom'
[Input1]
Name ='AmmoniaSlip(AS)'

127
Range =[0 250]
NumMFs =4
MF1 ='NS':'trapmf',[0 0 8 10]
MF2 ='SS':'trapmf',[8 10 18 20]
MF3 ='MS':'trapmf',[18 20 36 40]
MF4 ='LS':'trapmf',[36 40 250 500]
[Input2]
Name ='RateofAmmoniaSlip(RAS)'
Range =[-20 20]
NumMFs =3
MF1 ='DR':'trapmf',[-20 -20 -1 -0.5]
MF2 ='CR':'trapmf',[-1 -0.5 0.5 1]
MF3 ='IR':'trapmf',[0.5 1 20 20]
[Input3]
Name ='NOxSlip(NOS)'
Range =[0 1500]
NumMFs =4
MF1 ='NS':'trapmf',[0 0 20 50]
MF2 ='SS':'trapmf',[20 50 70 100]
MF3 ='MS':'trapmf',[70 100 500 530]
MF4 ='LS':'trapmf',[500 530 1500 1500]
[Output1]
Name ='SCR_Regeneration_Status'
Range =[0 1]
NumMFs =3
MF1 ='RegenOFF':'trimf',[0 0.25 0.5]
MF2 ='RegenONShort':'trimf',[0.5 0.65 0.8]
MF3 ='RegenONLong':'trimf',[0.8 0.85 1]
[Rules]
1 1 1, 1 (1) : 1
1 1 2, 1 (1) : 1
1 1 3, 1 (1) : 1
1 1 4, 1 (1) : 1
1 2 1, 1 (1) : 1
1 2 2, 1 (1) : 1
1 2 3, 1 (1) : 1
1 2 4, 1 (1) : 1
1 3 1, 1 (1) : 1
1 3 2, 1 (1) : 1
1 3 3, 1 (1) : 1
1 3 4, 1 (1) : 1
2 1 1, 2 (1) : 1
2 1 2, 1 (1) : 1
2 1 3, 1 (1) : 1
2 1 4, 1 (1) : 1
2 2 1, 2 (1) : 1
2 2 2, 2 (1) : 1
2 2 3, 1 (1) : 1

128
2 2 4, 1 (1) : 1
2 3 1, 3 (1) : 1
2 3 2, 2 (1) : 1
2 3 3, 1 (1) : 1
2 3 4, 1 (1) : 1
3 1 1, 3 (1) : 1
3 1 2, 2 (1) : 1
3 1 3, 1 (1) : 1
3 1 4, 1 (1) : 1
3 2 1, 3 (1) : 1
3 2 2, 2 (1) : 1
3 2 3, 1 (1) : 1
3 2 4, 1 (1) : 1
3 3 1, 3 (1) : 1
3 3 2, 3 (1) : 1
3 3 3, 1 (1) : 1
3 3 4, 1 (1) : 1
4 1 1, 3 (1) : 1
4 1 2, 2 (1) : 1
4 1 3, 1 (1) : 1
4 1 4, 1 (1) : 1
4 2 1, 3 (1) : 1
4 2 2, 2 (1) : 1
4 2 3, 1 (1) : 1
4 2 4, 1 (1) : 1
4 3 1, 3 (1) : 1
4 3 2, 3 (1) : 1
4 3 3, 1 (1) : 1
4 3 4, 1 (1) : 1