development of a spatial-temporal co- occurrence index … species act...development of a...
TRANSCRIPT
Development of a spatial-temporal co-
occurrence index to evaluate pesticide
risks to threatened and endangered
speciesCALFED Part 4
Gerco Hoogeweg, Debra Denton (EPA R9), Richard S. Breuer (CA DWR), Gregg Hancock, and Patti TenBrook (EPA R9)
Project Context
Spatial and Temporal Quantification of Pesticide
Loadings to the Sacramento River, San Joaquin
River, and Bay‐Delta to Guide Risk Assessment for
Sensitive Species
Part 1. Project overview (Sunday)
Part 2. Agricultural modeling (Monday)
Part 3. Urban modeling (Tuesday)
Part 4. Development and application of a multi-dimensional index
2
Project Context
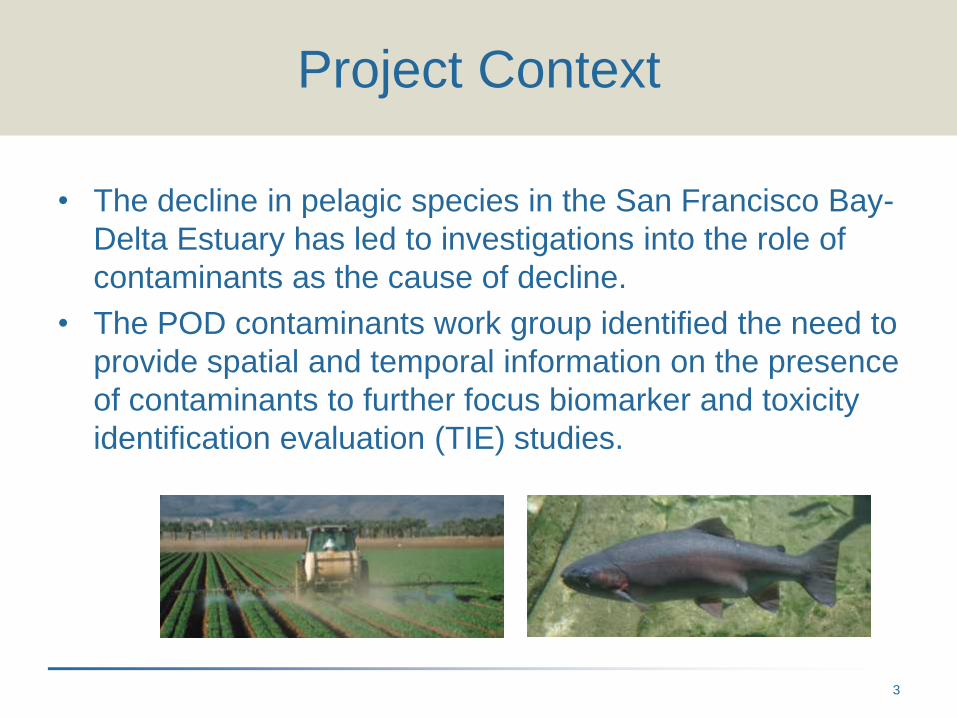
• The decline in pelagic species in the San Francisco Bay-
Delta Estuary has led to investigations into the role of
contaminants as the cause of decline.
• The POD contaminants work group identified the need to
provide spatial and temporal information on the presence
of contaminants to further focus biomarker and toxicity
identification evaluation (TIE) studies.
3
Project Context
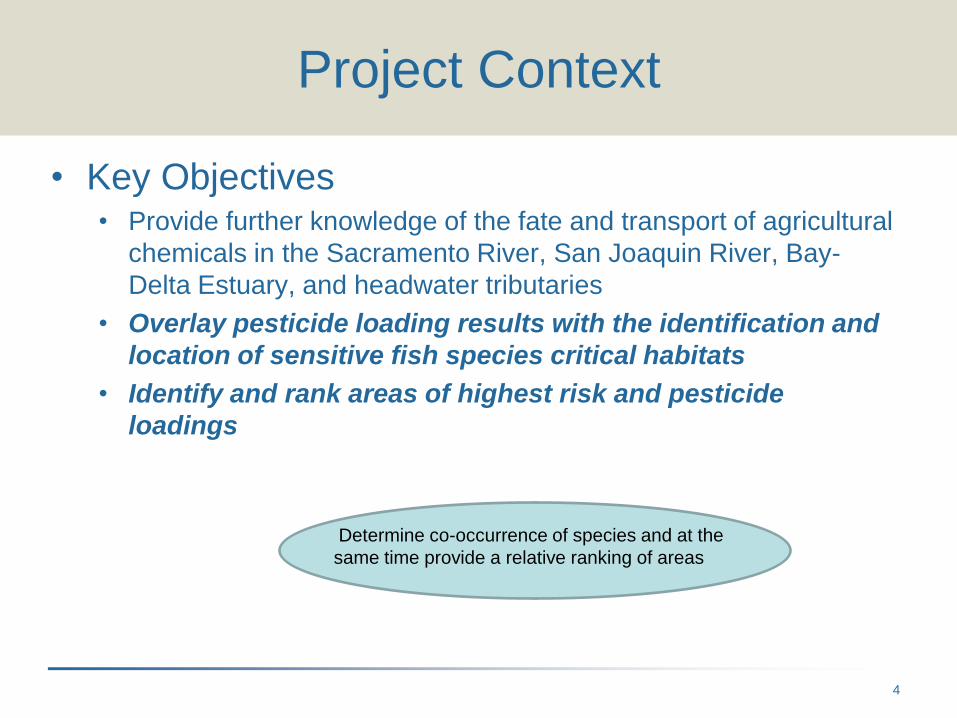
• Key Objectives• Provide further knowledge of the fate and transport of agricultural
chemicals in the Sacramento River, San Joaquin River, Bay-
Delta Estuary, and headwater tributaries
• Overlay pesticide loading results with the identification and
location of sensitive fish species critical habitats
• Identify and rank areas of highest risk and pesticide
loadings
Determine co-occurrence of species and at the
same time provide a relative ranking of areas
4
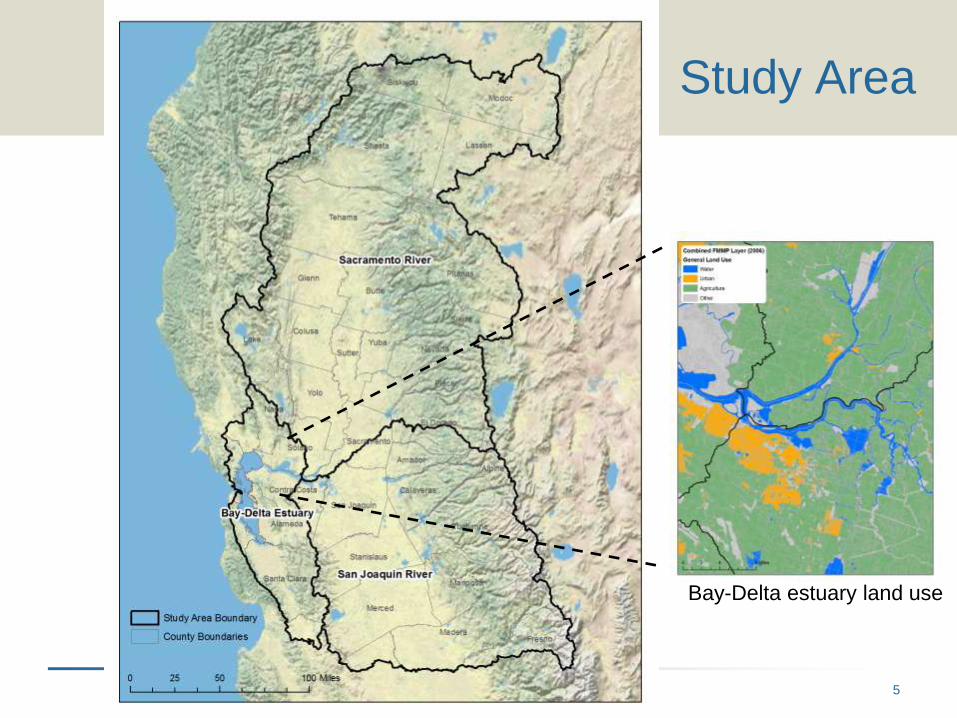
Study Area
Bay-Delta estuary land use
5
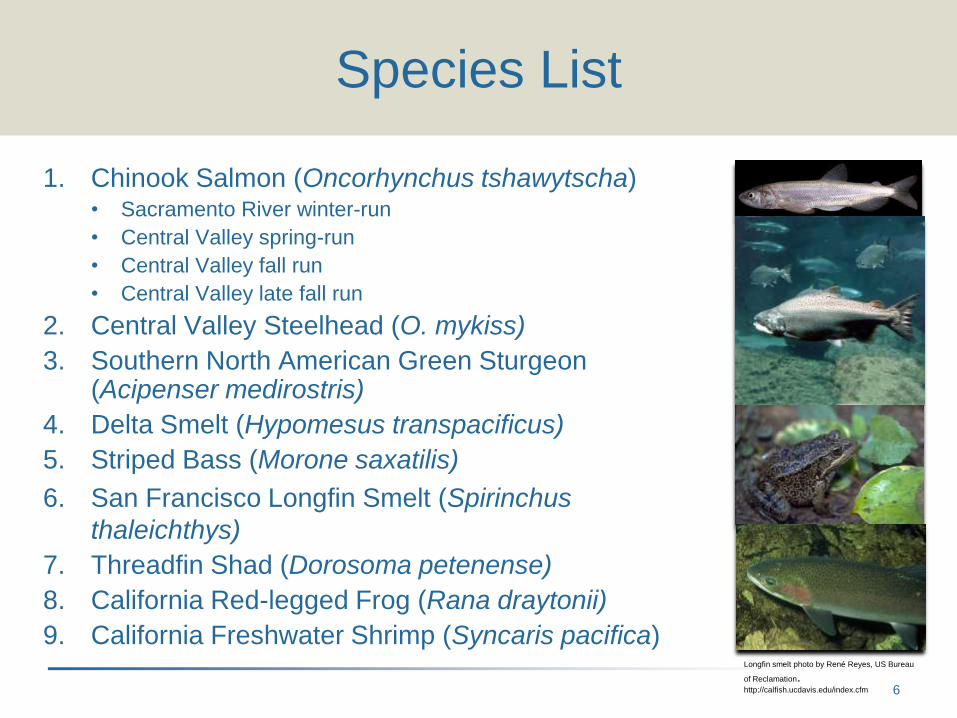
Species List
1. Chinook Salmon (Oncorhynchus tshawytscha)• Sacramento River winter-run
• Central Valley spring-run
• Central Valley fall run
• Central Valley late fall run
2. Central Valley Steelhead (O. mykiss)
3. Southern North American Green Sturgeon (Acipenser medirostris)
4. Delta Smelt (Hypomesus transpacificus)
5. Striped Bass (Morone saxatilis)
6. San Francisco Longfin Smelt (Spirinchus
thaleichthys)
7. Threadfin Shad (Dorosoma petenense)
8. California Red-legged Frog (Rana draytonii)
9. California Freshwater Shrimp (Syncaris pacifica)Longfin smelt photo by René Reyes, US Bureau
of Reclamation. http://calfish.ucdavis.edu/index.cfm 6

Pesticides
• Abamectin Insecticide
• Bifenthrin Insecticide
• Bromacil Herbicide
• Captan Fungicide
• Carbaryl Insecticide
• Chlorothalonil Fungicide
• Chlorpyrifos Insecticide
• Cyfluthrin Insecticide
• Cypermethrin Insecticide
• Deltamethrin Insecticide
• Diazinon Insecticide
• Dimethoate Insecticide
• Diuron Herbicide
• Esfenvalerate Insecticide
• Fipronil Insecticide
• Hexazinone Herbicide
• Imidacloprid Insecticide
• Indoxacarb Insecticide
• Lambda cyhalothrin Insecticide
• Malathion Insecticide
• Mancozeb Fungicide
• Maneb Fungicide
• Methomyl Insecticide
• Naled Insecticide
• Norflurazon Herbicide
• Oxyflurofen Herbicide
• Paraquat dichloride Herbicide
• Pendimethalin Herbicide
• Permethrin Insecticide
• Propanil Herbicide
• Propargite Insecticide
• Pyraclostrobin Fungicide
• (s)-Metolachlor Herbicide
• Simazine Herbicide
• Tralomethrin Insecticide
• Trifluralin Herbicide
• Ziram Fungicide
7
Blue = High Overall Relative-Risk Level Green = Moderate Overall Relative-Risk Level
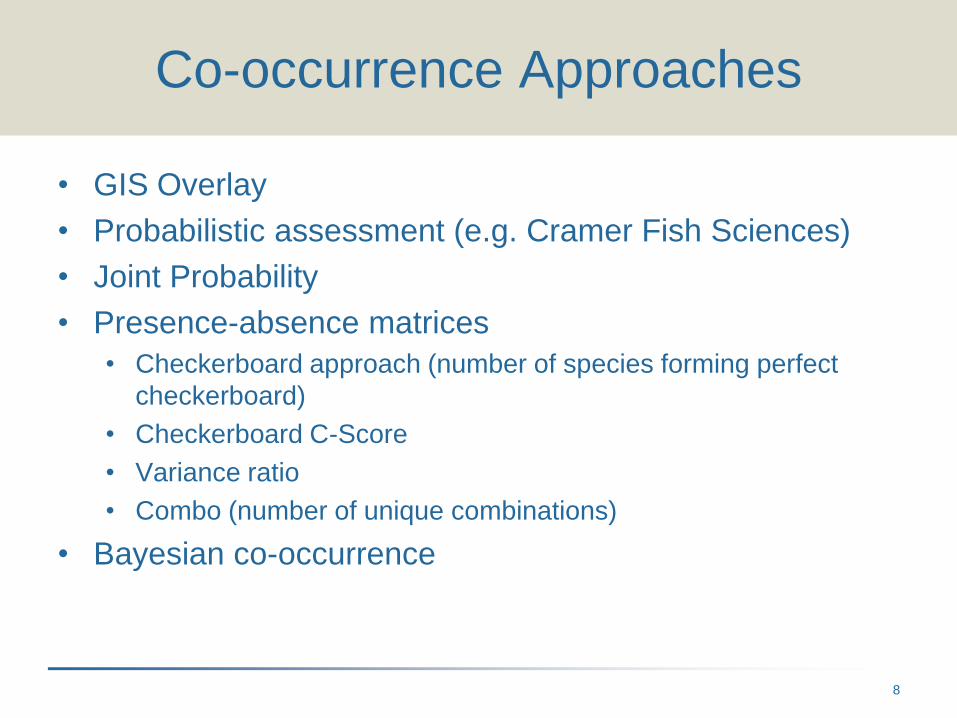
Co-occurrence Approaches
• GIS Overlay
• Probabilistic assessment (e.g. Cramer Fish Sciences)
• Joint Probability
• Presence-absence matrices
• Checkerboard approach (number of species forming perfect
checkerboard)
• Checkerboard C-Score
• Variance ratio
• Combo (number of unique combinations)
• Bayesian co-occurrence
8
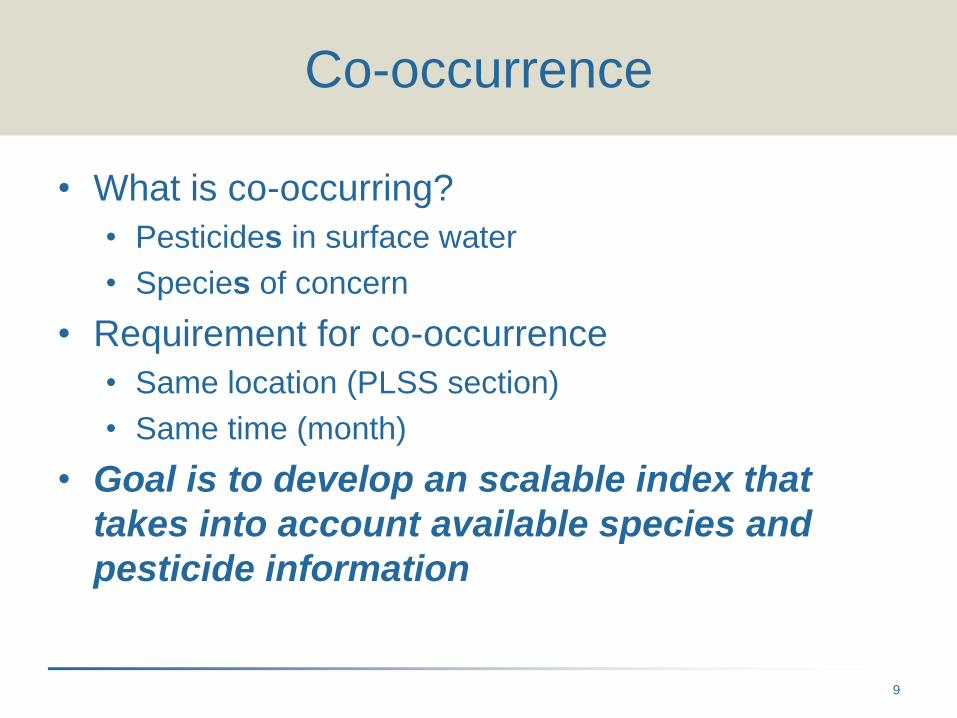
Co-occurrence
• What is co-occurring?
• Pesticides in surface water
• Species of concern
• Requirement for co-occurrence
• Same location (PLSS section)
• Same time (month)
• Goal is to develop an scalable index that
takes into account available species and
pesticide information
9
Co-occurrence Index
• Pesticides in surface water
• Risk assessment the Risk Quotient (RQ) is used.
• Events with RQ ≥ 1 are of interest
• Potential effects on SOC
• In order to calculate the RQ, you need to have a
benchmark.
10
Co-occurrence Index
• Pesticides Toxicity
• For each pesticide (40) an acute threshold was
chosen:
• Determined most conservative EPA-OPP benchmark for
each pesticide
• Only one toxicity threshold for each pesticide
• Added 10x safety factor to account for T&ES
11
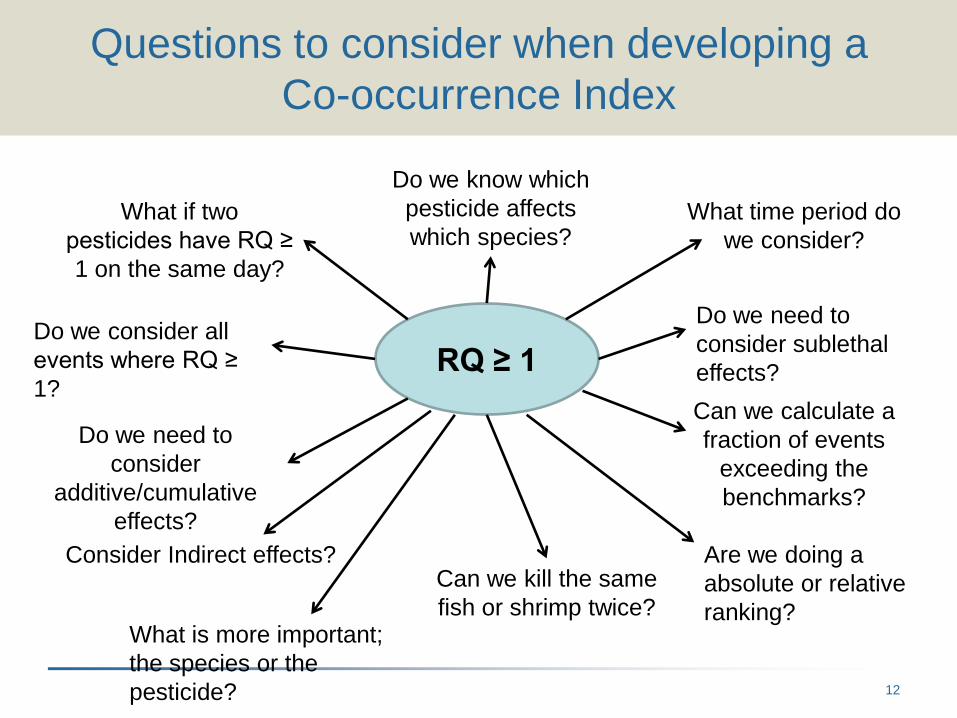
Questions to consider when developing a
Co-occurrence Index
RQ ≥ 1
What if two
pesticides have RQ ≥
1 on the same day?
Do we need to
consider
additive/cumulative
effects?
What time period do
we consider?
Can we calculate a
fraction of events
exceeding the
benchmarks?
Can we kill the same
fish or shrimp twice?
Do we know which
pesticide affects
which species?
Do we consider all
events where RQ ≥
1?
Do we need to
consider sublethal
effects?
Are we doing a
absolute or relative
ranking?
Consider Indirect effects?
What is more important;
the species or the
pesticide? 12
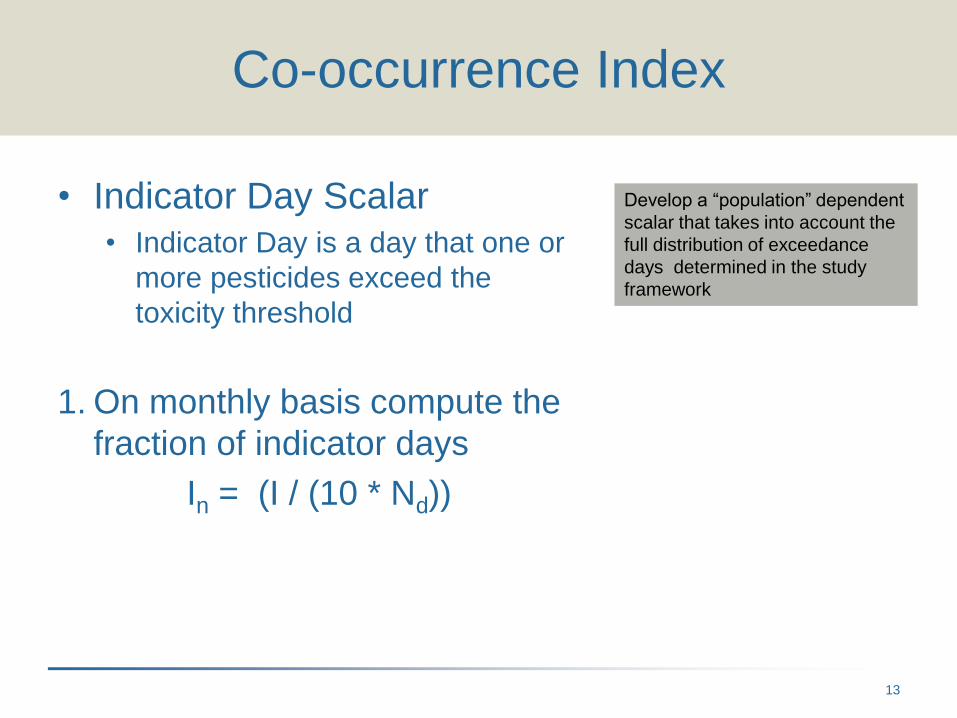
Co-occurrence Index
• Indicator Day Scalar
• Indicator Day is a day that one or
more pesticides exceed the
toxicity threshold
1. On monthly basis compute the
fraction of indicator days
In = (I / (10 * Nd))
Develop a “population” dependent
scalar that takes into account the
full distribution of exceedance
days determined in the study
framework
13
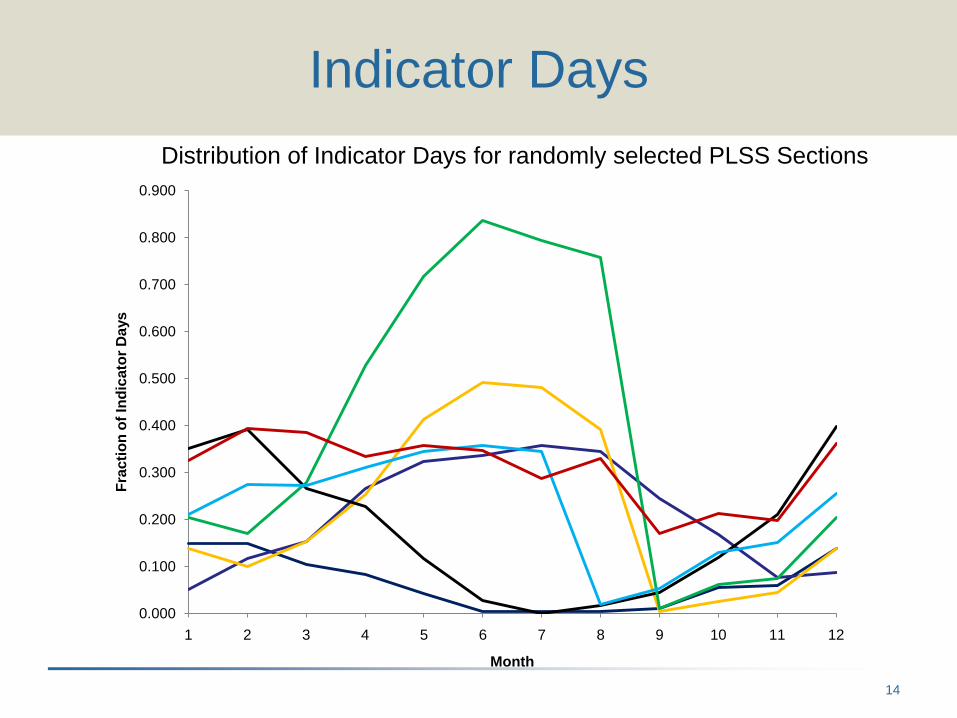
Indicator Days
Distribution of Indicator Days for randomly selected PLSS Sections
0.000
0.100
0.200
0.300
0.400
0.500
0.600
0.700
0.800
0.900
1 2 3 4 5 6 7 8 9 10 11 12
Fra
cti
on
of
Ind
icato
r D
ays
Month
14
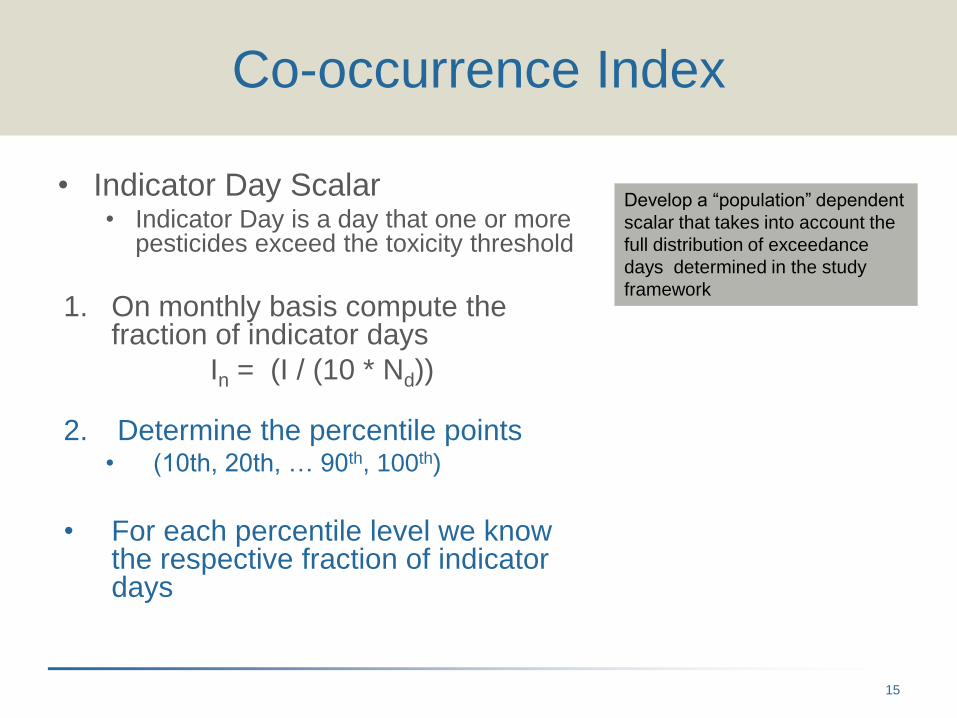
Co-occurrence Index
• Indicator Day Scalar• Indicator Day is a day that one or more
pesticides exceed the toxicity threshold
1. On monthly basis compute the fraction of indicator days
In = (I / (10 * Nd))
2. Determine the percentile points• (10th, 20th, … 90th, 100th)
• For each percentile level we know the respective fraction of indicator days
Develop a “population” dependent
scalar that takes into account the
full distribution of exceedance
days determined in the study
framework
15
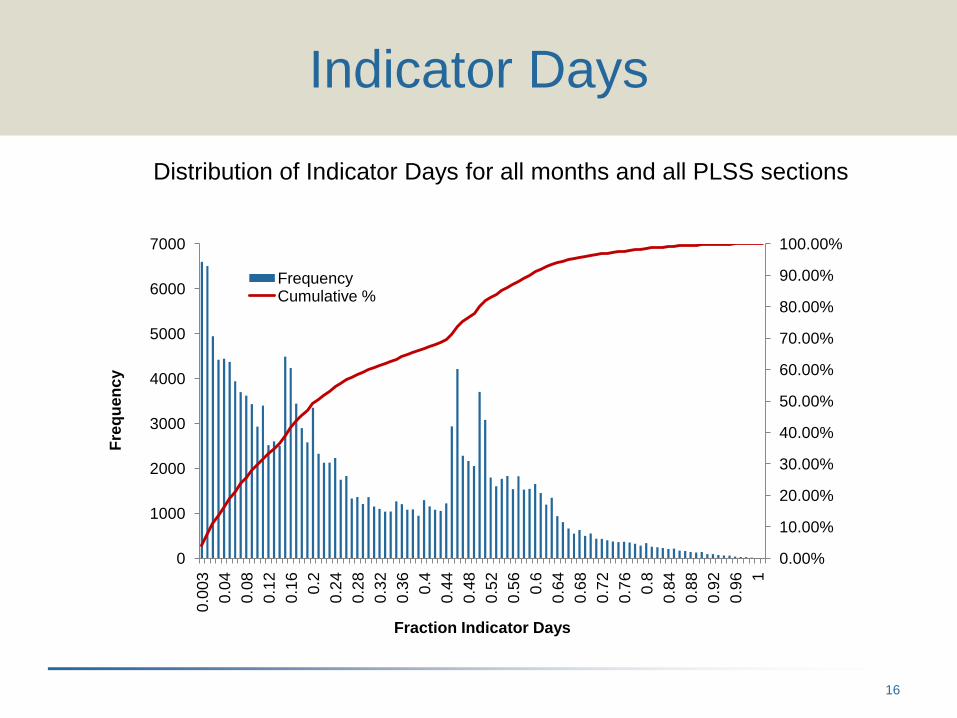
Indicator Days
Distribution of Indicator Days for all months and all PLSS sections
0.00%
10.00%
20.00%
30.00%
40.00%
50.00%
60.00%
70.00%
80.00%
90.00%
100.00%
0
1000
2000
3000
4000
5000
6000
7000
0.0
03
0.0
4
0.0
8
0.1
2
0.1
6
0.2
0.2
4
0.2
8
0.3
2
0.3
6
0.4
0.4
4
0.4
8
0.5
2
0.5
6
0.6
0.6
4
0.6
8
0.7
2
0.7
6
0.8
0.8
4
0.8
8
0.9
2
0.9
6 1
Fre
qu
en
cy
Fraction Indicator Days
FrequencyCumulative %
16
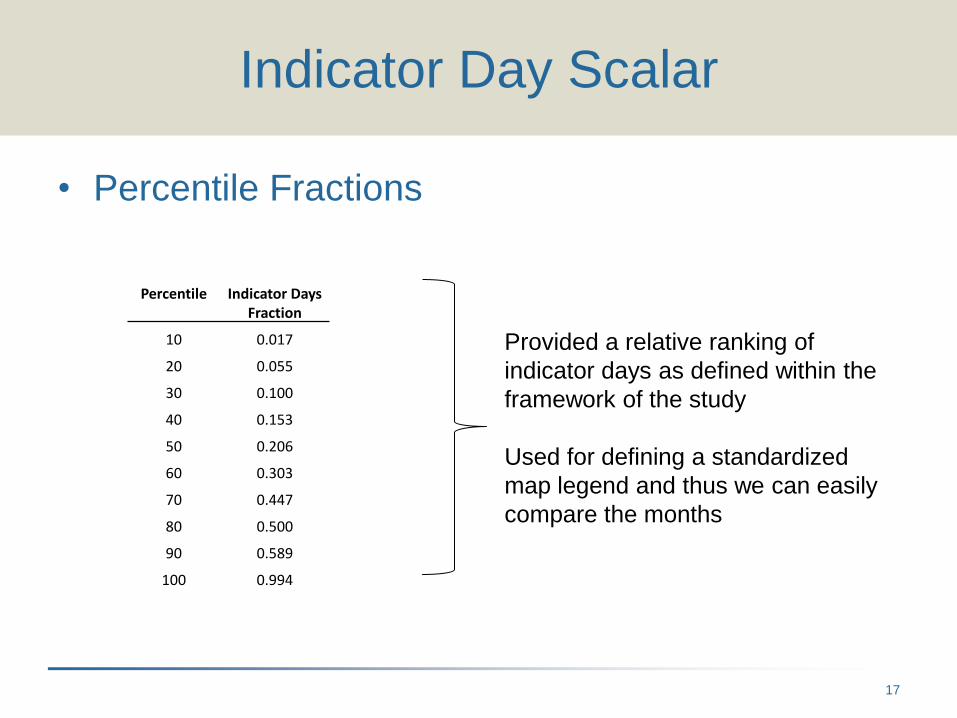
Indicator Day Scalar
• Percentile Fractions
Percentile Indicator DaysFraction
10 0.017
20 0.055
30 0.100
40 0.153
50 0.206
60 0.303
70 0.447
80 0.500
90 0.589
100 0.994
Provided a relative ranking of
indicator days as defined within the
framework of the study
Used for defining a standardized
map legend and thus we can easily
compare the months
17
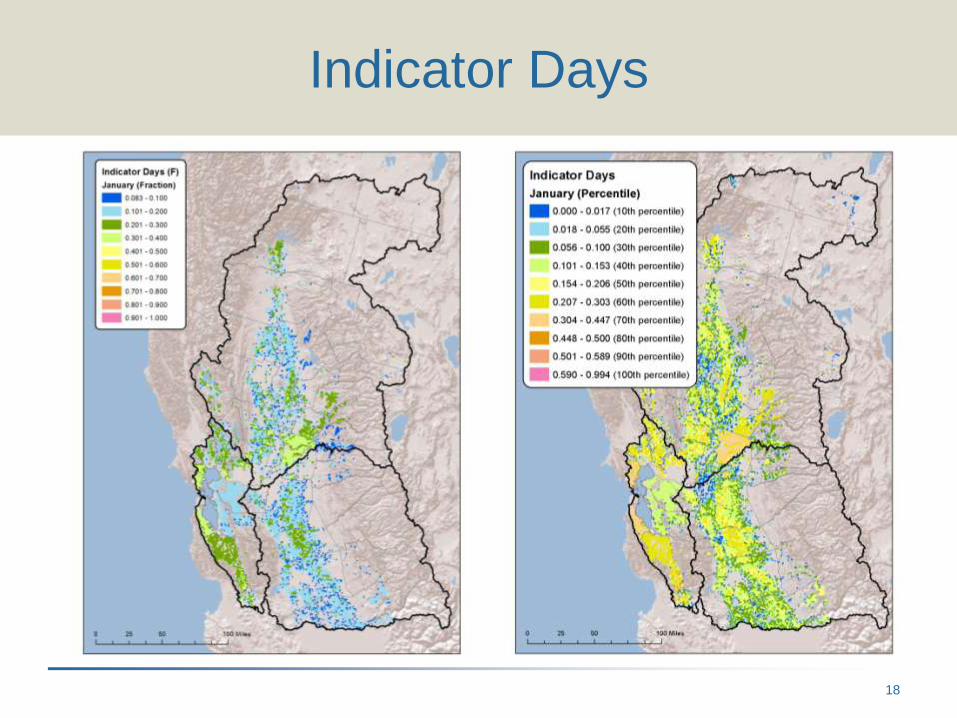
Indicator Days
18
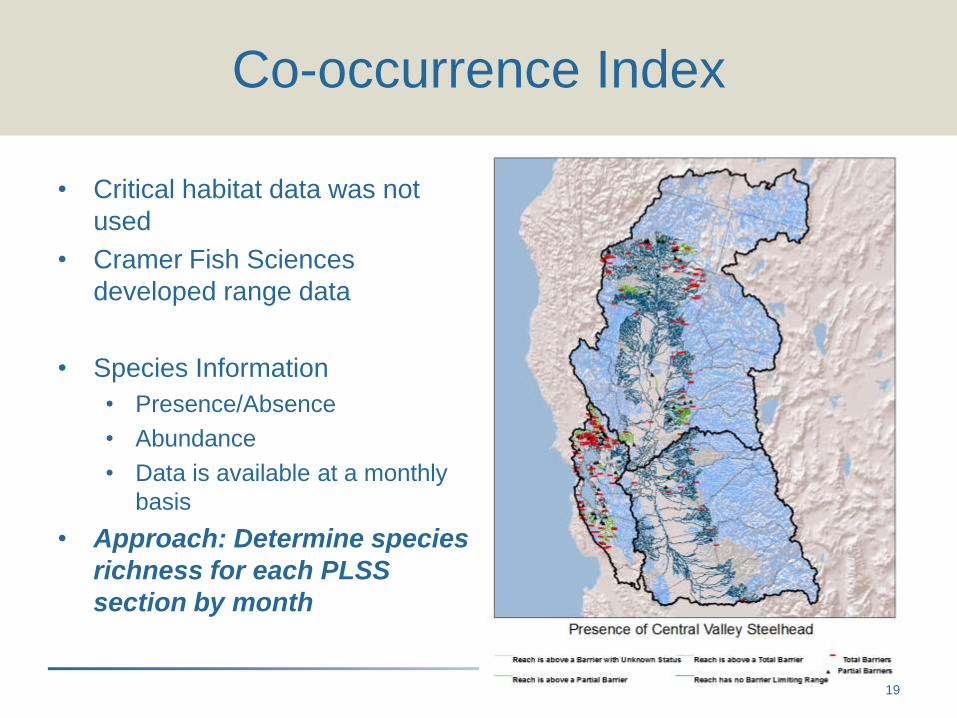
Co-occurrence Index
• Critical habitat data was not
used
• Cramer Fish Sciences
developed range data
• Species Information
• Presence/Absence
• Abundance
• Data is available at a monthly
basis
• Approach: Determine species
richness for each PLSS
section by month
19
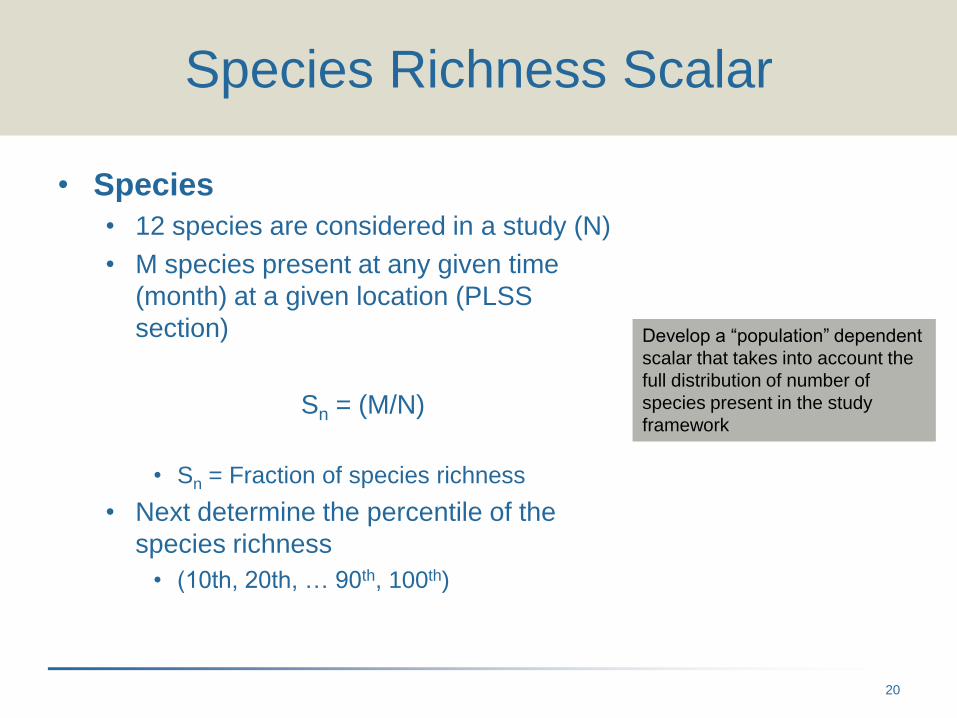
Species Richness Scalar
• Species
• 12 species are considered in a study (N)
• M species present at any given time
(month) at a given location (PLSS
section)
Sn = (M/N)
• Sn = Fraction of species richness
• Next determine the percentile of the
species richness
• (10th, 20th, … 90th, 100th)
Develop a “population” dependent
scalar that takes into account the
full distribution of number of
species present in the study
framework
20
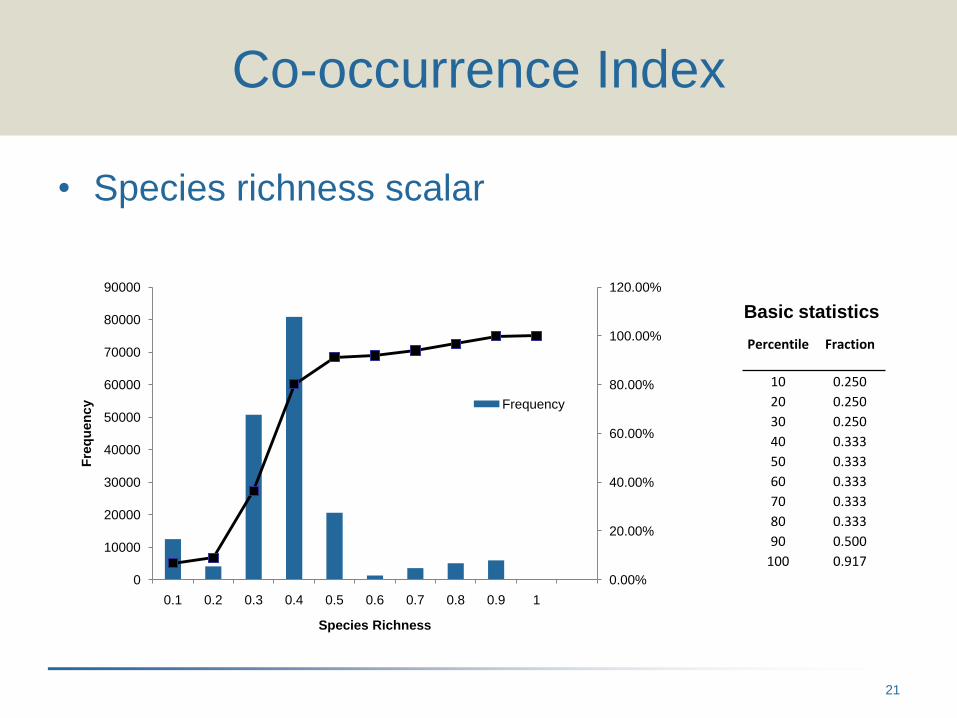
Co-occurrence Index
• Species richness scalar
0.00%
20.00%
40.00%
60.00%
80.00%
100.00%
120.00%
0
10000
20000
30000
40000
50000
60000
70000
80000
90000
0.1 0.2 0.3 0.4 0.5 0.6 0.7 0.8 0.9 1
Fre
qu
en
cy
Species Richness
Frequency
Percentile Fraction
10 0.250
20 0.250
30 0.250
40 0.333
50 0.333
60 0.333
70 0.333
80 0.333
90 0.500
100 0.917
Basic statistics
21
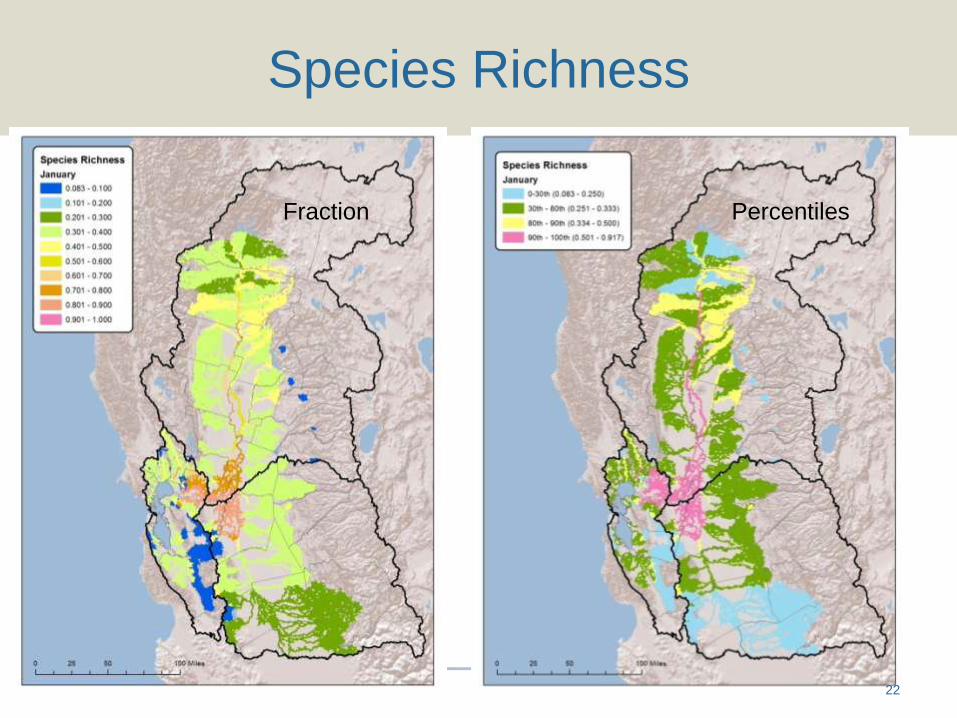
Species Richness
Fraction Percentiles
22
Co-occurrence Index
• What we know:
• Scalar: representing the fraction of indicator days by
month
• Scalar: representing the species richness by month
• Next we combine these two sets into a multi-
dimensional index
• Holmes Index of Co-occurrence
23
0
0
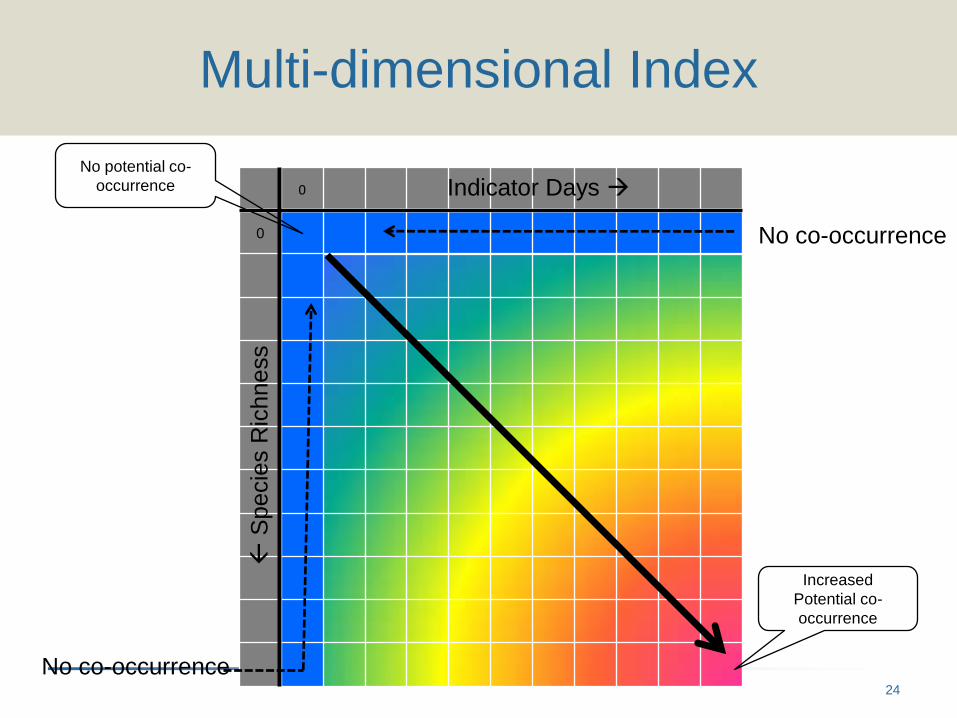
Multi-dimensional Index
No potential co-
occurrence
Increased
Potential co-
occurrence
Indicator Days
S
pecie
s R
ichness
No co-occurrence
No co-occurrence24

Multi-dimensional Index
S
pecie
s R
ichness
Indicator Days
0 1 2 3 4 5 6 7 8 9 10
0 00 01 02 03 04 05 06 07 08 09 010
1 10 11 12 13 14 15 16 17 18 19 110
2 20 21 22 23 24 25 26 27 28 29 210
3 30 31 32 33 34 35 36 37 38 39 310
4 40 41 42 43 44 45 46 47 48 49 410
5 50 51 52 53 54 55 56 57 58 59 510
6 60 61 62 63 64 65 66 67 68 69 610
7 70 71 72 73 74 75 76 77 78 79 710
8 80 81 82 83 84 85 86 87 88 89 810
9 90 91 92 93 94 95 96 97 98 99 910
10 100 101 102 103 104 105 106 107 108 109 1010
25
0 1 2 3 4 5 6 7 8 9 10
0 00 01 02 03 04 05 06 07 08 09 010
1 10 11 12 13 14 15 16 17 18 19 110
2 20 21 22 23 24 25 26 27 28 29 210
3 30 31 32 33 34 35 36 37 38 39 310
4 40 41 42 43 44 45 46 47 48 49 410
5 50 51 52 53 54 55 56 57 58 59 510
6 60 61 62 63 64 65 66 67 68 69 610
7 70 71 72 73 74 75 76 77 78 79 710
8 80 81 82 83 84 85 86 87 88 89 810
9 90 91 92 93 94 95 96 97 98 99 910
10 100 101 102 103 104 105 106 107 108 109 1010
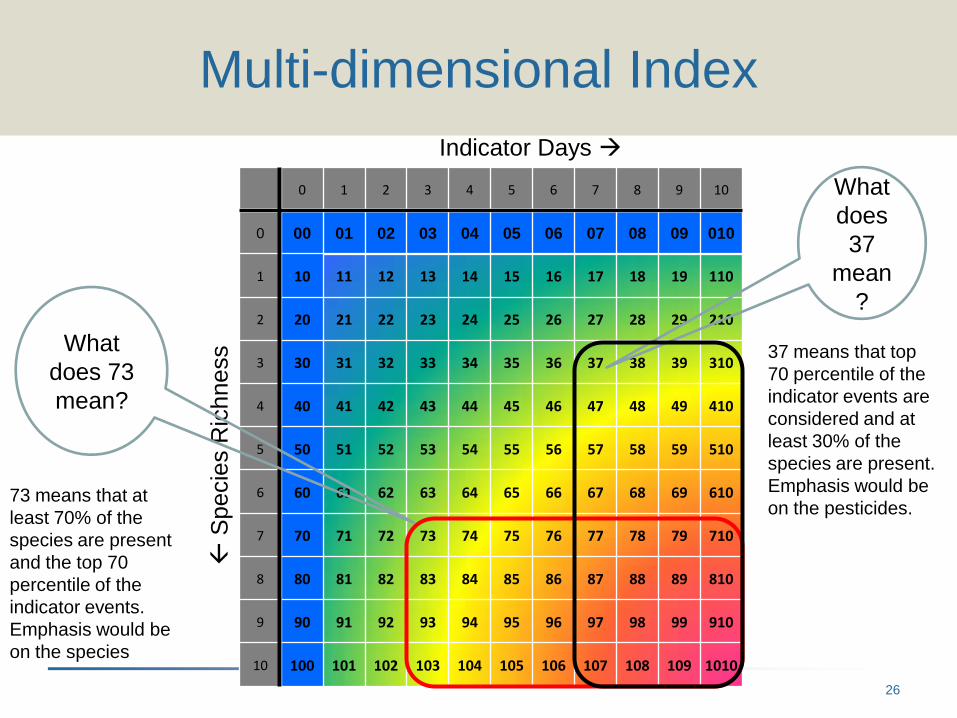
Multi-dimensional Index
S
pecie
s R
ichness
Indicator Days
What
does 73
mean?
73 means that at
least 70% of the
species are present
and the top 70
percentile of the
indicator events.
Emphasis would be
on the species
What
does
37
mean
?
37 means that top
70 percentile of the
indicator events are
considered and at
least 30% of the
species are present.
Emphasis would be
on the pesticides.
26
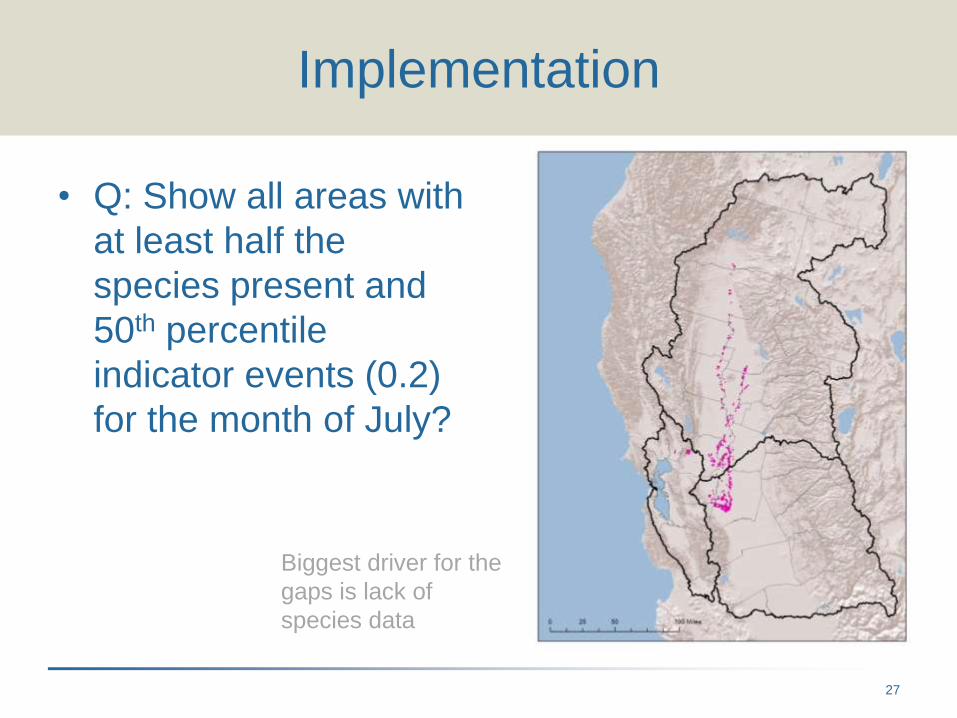
Implementation
• Q: Show all areas with
at least half the
species present and
50th percentile
indicator events (0.2)
for the month of July?
Biggest driver for the
gaps is lack of
species data
27
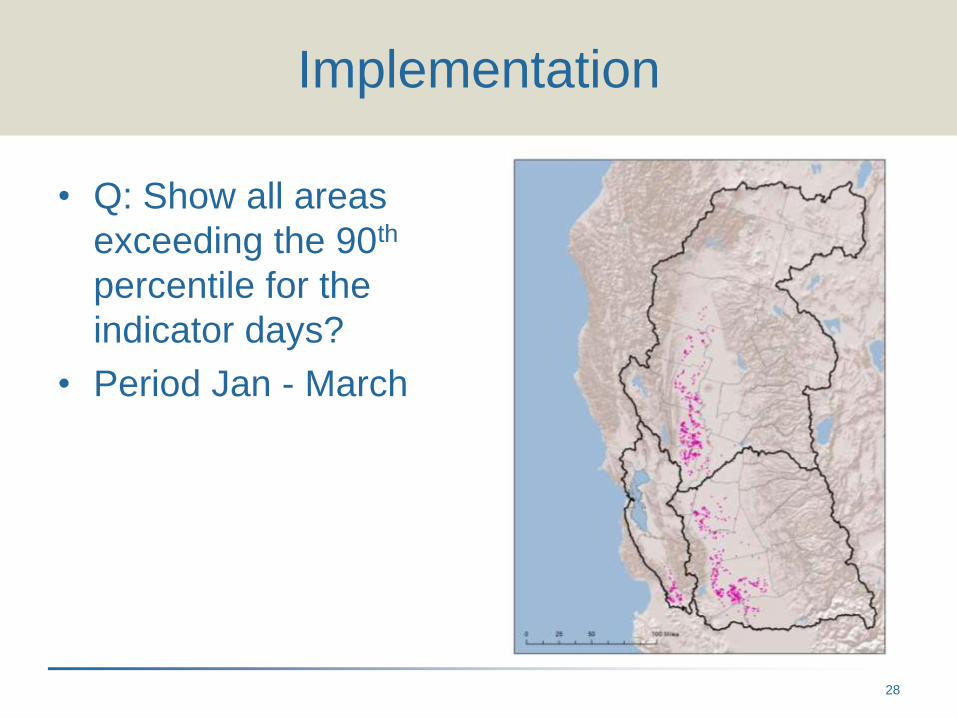
Implementation
• Q: Show all areas
exceeding the 90th
percentile for the
indicator days?
• Period Jan - March
28
Conclusions
• 2-dimensional scalable Index matrix was
developed to determine co-occurrence of TE&S
and pesticide concentrations in surface water
exceeding toxicity benchmark
• Index allows you to scale the rankings based on
available data
• Index provides a relative ranking of area with
“high” co-occurrence
• Good species distribution data is important
29