development of a microsimulation program to … of a microsimulation program to study freeway ramp...
TRANSCRIPT
1
DEVELOPMENT OF A MICROSIMULATION PROGRAM TO STUDY FREEWAY RAMP MERGING PROCESS IN CONGESTED TRAFFIC CONDITIONS
Majid Sarvi*, Institute of Transport studies, Department of Civil Engineering, Building 60, Monash
University 3800, Melbourne, Australia, Tel: +61-3-99059696, Fax: +61-3-99054944, [email protected]
Masao Kuwahara, Kuwahara Lab., Institute of Industrial science, University of Tokyo, 4-6-1 Komaba, Meguro-ku, Tokyo 153-8505, Japan Tel: +81-3-5452-6418, Fax: +81-3-5452-6420,
Avishai Ceder, Transportation Research institute, Civil and Environmental Engineering Faculty. Technion-Israel Institute of Technology, Israel, Tel: +972-4-8331923 Fax: +972-4-
8335104, [email protected]
* Corresponding author
ABSTRACT This work describes a micro simulation program that is developed to study freeway ramp merging phenomena under congested traffic conditions. First, the results of extensive macroscopic and microscopic studies are used to establish a model for the behaviour of merging drivers. A theoretical framework for modeling the ramp and freeway lag driver acceleration-deceleration behaviour is then presented. This methodology uses the stimuli-response psychophysical concept as a fundamental rule, and is formulated as a modified form of the conventional car-following models. Data collected at the two merging points of the Tokyo Metropolitan Expressway are used to calibrate the hypothesized ramp and freeway lag vehicle acceleration models. Next, based on this behavioural model, the Freeway Merging Capacity Simulation Program (FMCSP) is developed to simulate the actual traffic conditions. This model evaluates the capacity of a merging section for a given geometric design and flow condition. The validation of FMCSP performed at microscopic and macroscopic levels using the observed flow, vehicles trajectories, and lane changing maneuver. The developed FMCSP is applied to investigate the lane changing restriction strategy as well as the study of ramp driver behaviour by establishing a link to a driving simulator. The results indicated that the FMCSP is capable of simulating the actual traffic conditions of congested freeway ramp merging sections to study the complex ramp merging phenomena. Key Words: Micro simulation program, Freeway ramp merging, Driving behaviour, Congested traffic flow.

2
1. INTRODUCTION
Statistical analyses of observed volumes are usually employed in order to estimate the
capacity of highway elements. Capacity of merging sections, however, is affected by many
variables such as two directions of flow and variety of lane configurations, various geometric
design and flow conditions. It is difficult to estimate the capacity of merging sections
through statistical analysis based on observed capacity data for various geometry and flow
conditions. Additionally, quite often, sufficient data can not be collected for the purpose of a
particular study (e.g. lateral clearance impact on freeway merging capacity). Merging
capacity still can not be estimated with sufficient accuracy, though extensive studies on
merging sections have been performed mainly in the United States (Beaky 1938, Pinnell et al.
1960, Hess 1963, Wattlworth et al. 1967, Rottinghous 1974, Polus et al. 1985, 1987). Instead,
this study focused on individual vehicular maneuvers to construct a simulation model for a
merging section, since the merging capacity is possibly a consequence of the aggregation
behaviour of each driver, and is not completely random but follows some fundamental
disciplines. For this purpose, extensive microscopic data obtained from observation on two
merging sections and a macroscopic study in several sections of the metropolitan expressway
in Tokyo area is utilized and necessary data such as spacing and relative speeds of merging
vehicles are obtained. A theoretical framework for modeling the ramp and freeway lag driver
(approaching the ramp area from the freeway) acceleration-deceleration behaviour is
presented. This methodology uses the stimuli-response psychophysical concept as a
fundamental rule, and is formulated as a modified form of the conventional car-following
models. Data collected at the two merging points are used to calibrate the hypothesized ramp
and freeway lag vehicle acceleration models. Based on these analyses, a micro simulation
model that intends to predict and evaluates the behaviour of drivers at merging sections under
heavy traffic situation as well as to estimate the merging capacity is developed. The overall

3
research approach is illustrated in Figure 1, emphasizing the fourth component, which
represents this work.
Figure 1 Conceptual flowchart for this study.
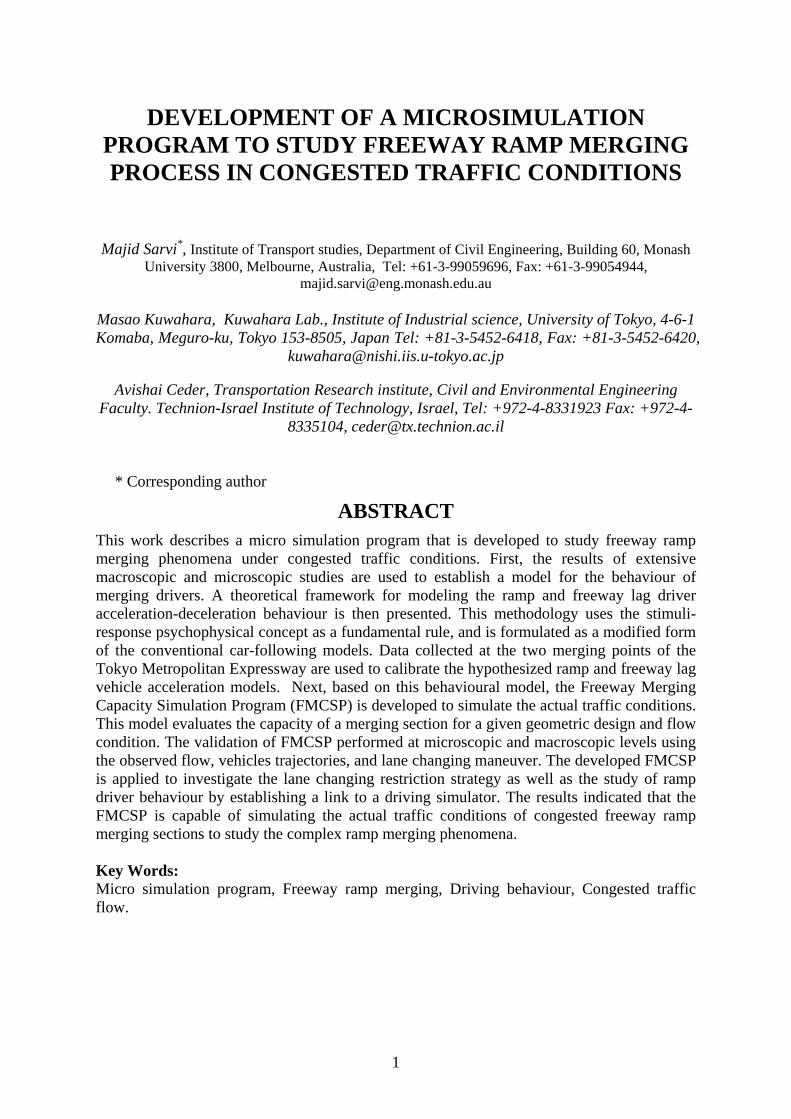
2. MODELING 2.1. Vehicle Interaction and Traffic Behaviour 2.1.1. The decision process of drivers
The tasks and decision-making processes required of drivers approaching a freeway merging
point differ between free-flow conditions and congested-flow conditions. A comprehensive
traffic survey and on-site observation have shown that the decision-making process of drivers
in merging situations can be divided into three zones, as shown in Figure 2 (Sarvi 2000, Sarvi
et al. 2001). The decisions required in each zone can be expressed as follows.
Ramp Zone 1 (preliminary zone): A decision about how to arrive at Zone 2 (from lane one or
two),
Ramp Zone 2 (merging zone): A decision about which two vehicles to merge between,
Behavioral models
Simulation model
Data collection
Design applicationsand ITS
. Video camera
. Survey
. Detectors
. Human factors studies
. Stochastic models
. Statistical distributions
. Different operationalstrategies
. Driving simulatorexperiments
. VMS, VICS
. Operational strategies
. Volume and speed
. Amount of lane changing
. Near-accident conflicts
. Zone definitions
. Driving decision processes
. Probabilities and magnitudes
. Speed
. Acceleration/deceleration
. Flow rate (capacity) evaluation
. Safety evaluations
. Operation and control
. Establish geometric design criteria
ComponentsInput Outcome
Instrumented carexperiment
Behavioral models
Simulation model
Data collection
Design applicationsand ITS
. Video camera
. Survey
. Detectors
. Human factors studies
. Stochastic models
. Statistical distributions
. Different operationalstrategies
. Driving simulatorexperiments
. VMS, VICS
. Operational strategies
. Volume and speed
. Amount of lane changing
. Near-accident conflicts
. Zone definitions
. Driving decision processes
. Probabilities and magnitudes
. Speed
. Acceleration/deceleration
. Flow rate (capacity) evaluation
. Safety evaluations
. Operation and control
. Establish geometric design criteria
ComponentsInput Outcome
Instrumented carexperiment
4
Ramp Zone 3 (downstream zone): A decision about at what distance and speed to follow the
vehicle in front,
Freeway Zone 1 (preliminary zone): Same as ramp Zone 1,
Freeway Zone 2 (merging zone): A decision as to which vehicle from the ramp should be
permitted to merge,
Freeway Zone 3 (downstream zone): Same as ramp Zone 3.
Figure 2 Zone specifications during freeway ramp merging maneuver.
The first decision that a driver must make is greatly affected by the surrounding traffic
situation (e.g., traffic volume in the two lanes, traffic flow speed, desirable gap) and by the
circumstances of the particular driver (e.g., attitude, vehicle type, familiarity with the area).
The second decision, which involves the ramp driver searching for and accepting a suitable
gap, has been extensively studied for the free-flow merging condition (Drew et al. 1967,
Daganzo 1979, Makigami et al. 1988, Chang et al 1991, Kita 1993, 1998, Ahmed et al. 1996,
1999, Kurian 2000). The gap searching and acceptance maneuvers commonly observed under
free-flow conditions do not occur under heavy traffic flow conditions, according to a
thorough microscopic and macroscopic study and observations of the Tokyo Metropolitan
Expressway (MEX) (Sarvi et al. 1999, 2001, 2002). These studies found no significant
correlation between the acceleration lane length and the maximum flow rate in the merging
Ramp lane one
Freeway lane one
Zone one with 350m length
Zone two
Zone three with 100m length
AggressiveLane changing
AvoidanceLane changing
Ramp lane one
Freeway lane one
Zone one with 350m length
Zone two
Zone three with 100m length
Zone one with 350m length
Zone two
Zone three with 100m length
AggressiveLane changing
AvoidanceLane changing
5
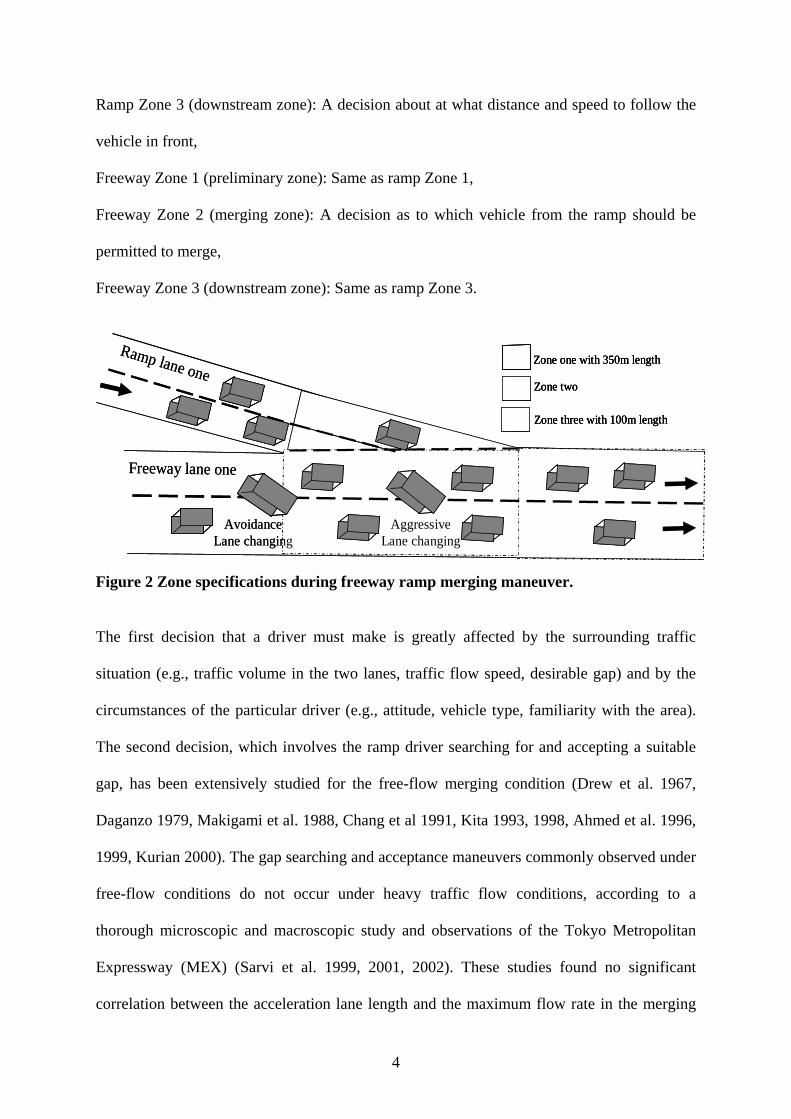
sections (See Figure 3). Heavy traffic conditions also lead to squeeze merging at the end of
the merging section. Here, we define this type of merging as zip merging, which refers to the
situation where vehicles from the ramp and freeway shoulder lane merge together one by one
regardless of the available gap. Observations at the Ichinohashi and Hamazaki-bashi merging
sections under congested traffic flow found more than 97% of merging maneuvers to be of
the zip merging type (Sarvi et al. 2001). Therefore, in this study the gap searching and
acceptance maneuver will not be addressed. The third driver decision, related to car-
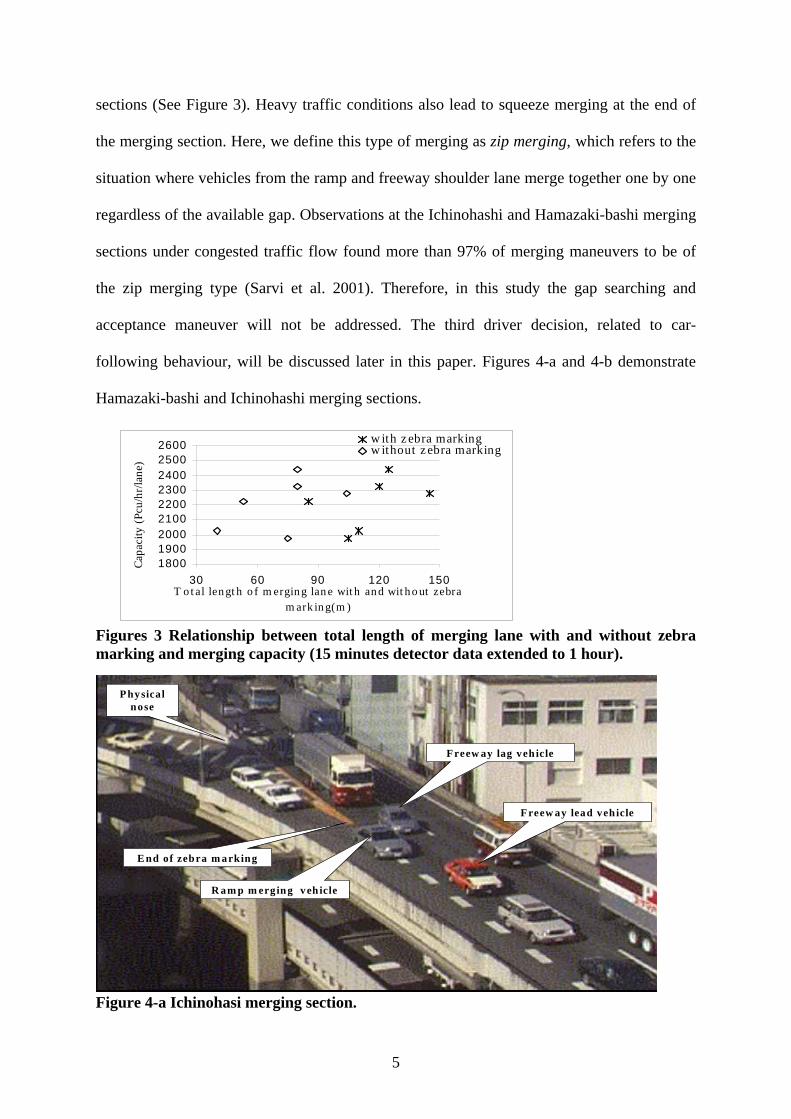
following behaviour, will be discussed later in this paper. Figures 4-a and 4-b demonstrate
Hamazaki-bashi and Ichinohashi merging sections.
180019002000210022002300240025002600
30 60 90 120 150T o t al len gt h o f m ergin g lan e wit h an d wit h o ut zebra
m ark in g(m )
Capa
city
(Pcu
/hr/l
ane)
w ith z ebra markingw ithout z ebra marking
Figures 3 Relationship between total length of merging lane with and without zebra marking and merging capacity (15 minutes detector data extended to 1 hour). Figure 4-a Ichinohasi merging section.
Freew ay lead vehicle
Freew ay lag veh icle
R am p m ergin g veh icle
E nd of zebra m arking
Physical nose
Freew ay lead vehicle
Freew ay lag veh icle
R am p m ergin g veh icle
E nd of zebra m arking
Physical nose

6
Figure 4-b Hamazaki-bashi merging section.
2.1.2. Vehicle interactions and lane-changing behaviour
Table 1 lists the possible interactions between vehicles approaching and engaging the
merging area under congested traffic conditions, as established by comprehensive
observations (Sarvi 2000). These interactions include lane-changing in Zone 1 before
engaging the merging section, merging at Zone 2, lane-changing within Zone 2, and car-
following behaviour between vehicles. For example, driver i in freeway lane 1 (row 1)
interacts with driver j in ramp lane 1 (column 3) by slowing down and provides a gap that is
sufficient for the ramp vehicle to merge. Conversely, driver i in ramp lane 1 (row 3) interacts
with driver j in freeway lane 1 (column 1) by forcing a merge in order to merge as early as
possible. Research on lane-changing behaviour has focused on gap acceptance behaviour and
its applications. In this study, lane-changing behaviour in the merging area under congested
traffic conditions was investigated at the microscopic and macroscopic (not individual
vehicle) level (Sarvi et al. 2001, 2002). Two types of lane-changing behaviour are frequently
observed in the merging sections. In Zone 1, aggressive drivers force their vehicles into the
freeway/ramp lane 2 in order to avoid merging interactions. In Zone 2, some drivers force
their vehicles into the freeway lane 2 in order to avoid the delay of a second merging. These
lane-changing maneuvers affect the flow rate at the merging section, usually causing a
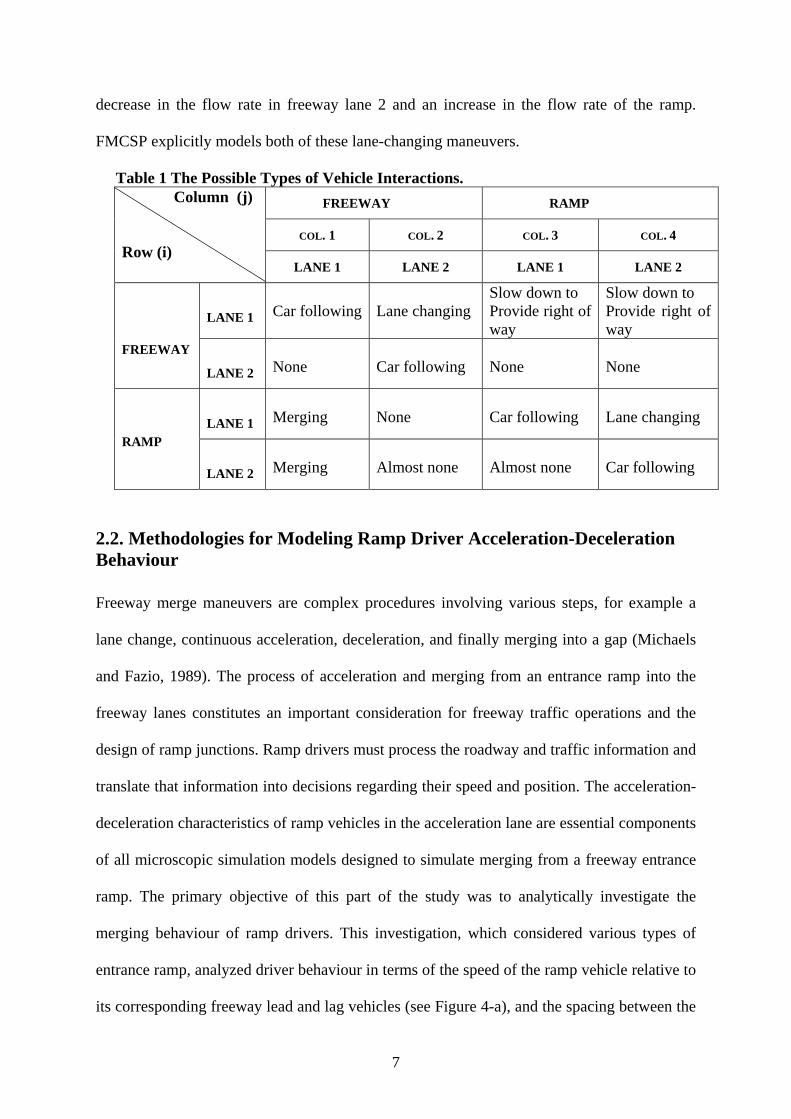
7
decrease in the flow rate in freeway lane 2 and an increase in the flow rate of the ramp.
FMCSP explicitly models both of these lane-changing maneuvers.
Table 1 The Possible Types of Vehicle Interactions. FREEWAY RAMP
COL. 1 COL. 2 COL. 3 COL. 4
Column (j) Row (i)
LANE 1 LANE 2 LANE 1 LANE 2
LANE 1
Car following
Lane changing
Slow down to Provide right of way
Slow down to Provide right of way
FREEWAY
LANE 2
None
Car following
None
None
LANE 1
Merging
None
Car following
Lane changing
RAMP
LANE 2
Merging
Almost none
Almost none
Car following
2.2. Methodologies for Modeling Ramp Driver Acceleration-Deceleration Behaviour
Freeway merge maneuvers are complex procedures involving various steps, for example a
lane change, continuous acceleration, deceleration, and finally merging into a gap (Michaels
and Fazio, 1989). The process of acceleration and merging from an entrance ramp into the
freeway lanes constitutes an important consideration for freeway traffic operations and the
design of ramp junctions. Ramp drivers must process the roadway and traffic information and
translate that information into decisions regarding their speed and position. The acceleration-
deceleration characteristics of ramp vehicles in the acceleration lane are essential components
of all microscopic simulation models designed to simulate merging from a freeway entrance
ramp. The primary objective of this part of the study was to analytically investigate the
merging behaviour of ramp drivers. This investigation, which considered various types of
entrance ramp, analyzed driver behaviour in terms of the speed of the ramp vehicle relative to
its corresponding freeway lead and lag vehicles (see Figure 4-a), and the spacing between the
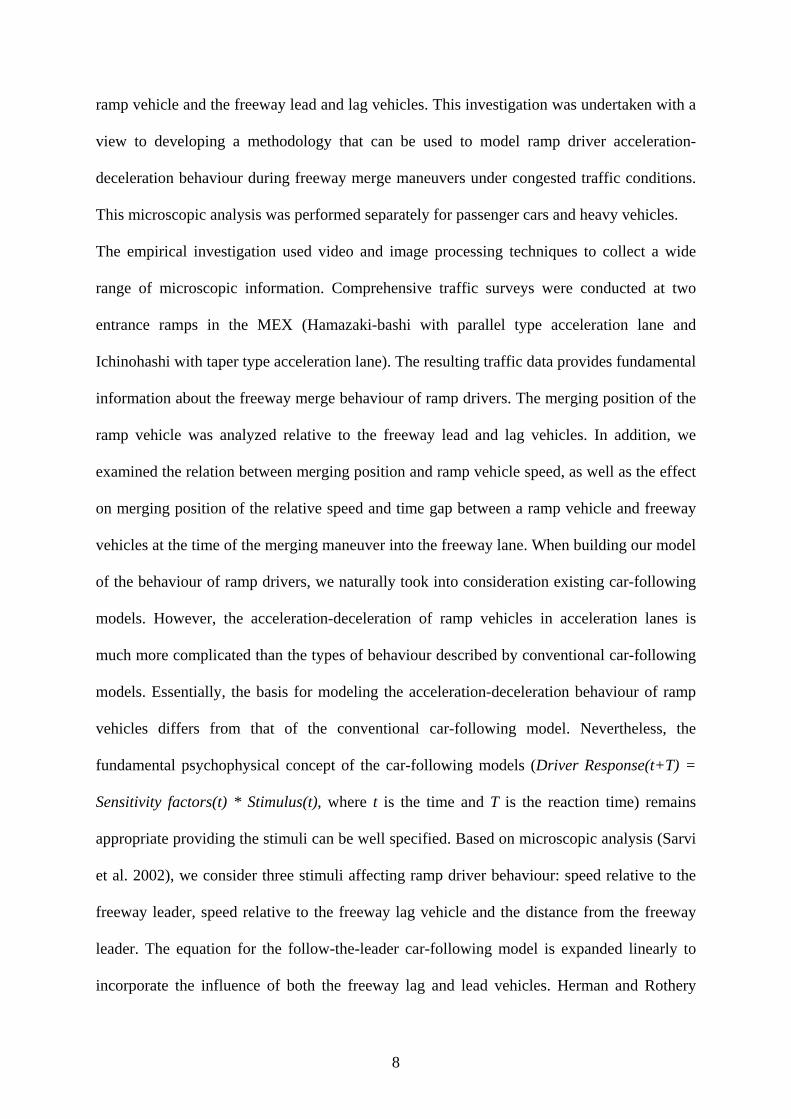
8
ramp vehicle and the freeway lead and lag vehicles. This investigation was undertaken with a
view to developing a methodology that can be used to model ramp driver acceleration-
deceleration behaviour during freeway merge maneuvers under congested traffic conditions.
This microscopic analysis was performed separately for passenger cars and heavy vehicles.
The empirical investigation used video and image processing techniques to collect a wide
range of microscopic information. Comprehensive traffic surveys were conducted at two
entrance ramps in the MEX (Hamazaki-bashi with parallel type acceleration lane and
Ichinohashi with taper type acceleration lane). The resulting traffic data provides fundamental
information about the freeway merge behaviour of ramp drivers. The merging position of the
ramp vehicle was analyzed relative to the freeway lead and lag vehicles. In addition, we
examined the relation between merging position and ramp vehicle speed, as well as the effect
on merging position of the relative speed and time gap between a ramp vehicle and freeway
vehicles at the time of the merging maneuver into the freeway lane. When building our model
of the behaviour of ramp drivers, we naturally took into consideration existing car-following
models. However, the acceleration-deceleration of ramp vehicles in acceleration lanes is
much more complicated than the types of behaviour described by conventional car-following
models. Essentially, the basis for modeling the acceleration-deceleration behaviour of ramp
vehicles differs from that of the conventional car-following model. Nevertheless, the
fundamental psychophysical concept of the car-following models (Driver Response(t+T) =
Sensitivity factors(t) * Stimulus(t), where t is the time and T is the reaction time) remains
appropriate providing the stimuli can be well specified. Based on microscopic analysis (Sarvi
et al. 2002), we consider three stimuli affecting ramp driver behaviour: speed relative to the
freeway leader, speed relative to the freeway lag vehicle and the distance from the freeway
leader. The equation for the follow-the-leader car-following model is expanded linearly to
incorporate the influence of both the freeway lag and lead vehicles. Herman and Rothery

9
(1963) proposed a similar concept with regard to a three-car car-following situation. The
expression for ramp vehicle acceleration-deceleration behaviour of a ramp platoon leader is
given in Equation 1.
)]()([)]()([
)()(110 tVtV
tXtXTtVTta RFleadl
RFlead
mR
R −−+
+=+ αα
+ )]()([)]()([
)(22 tVtV
tXtXTtV
FlagRlFlagR
mR −−
+α
+ )]}([)({)]()([
133 tvftS
tXtX lRFlead
−−
α (1)
Where:
)( TtaR + : Acceleration rate of the ramp vehicle at time t+T (m/s2) )(tX R : Location of the ramp vehicle at time t (m)
)(tX Flead : Location of the freeway lead vehicle at time t (m) )(tX Flag : Location of the freeway lag vehicle at time t (m)
)(tVR : Velocity of the ramp vehicle at time t (m/s) )(tVFlead : Velocity of the freeway lead vehicle at time t (m/s)
)(tVFlag : Velocity of the freeway lag vehicle at time t (m/s) )()()( tXtXtS RFlead −= : Spacing between the ramp vehicle and the freeway leader
vehicle at time t (m) )]([ tvf : Desired spacing as a function of speed (m)
T : Time lag or driver response time (s) 3213210 ,,,,,,, lllmαααα are the parameters to be estimated.
The second and third terms in Equation 1 represent the conventional model of the reaction of
a ramp driver to changes in the speed of the corresponding freeway leader and lag vehicles.
The fourth term introduces a spring action related to the spacing between the ramp vehicle
and freeway lead vehicle, which causes the follower to accelerate when the spacing is larger
than the desired value and decelerate when the spacing is less than the desired value. Data
collected at two merging points of the MEX which incorporated two hundred samples were
used to calibrate the hypothesized ramp vehicle acceleration-deceleration models. The results
indicated that 90th percentile of ramp drivers respond to stimuli after a time gap of 0.66s.
10
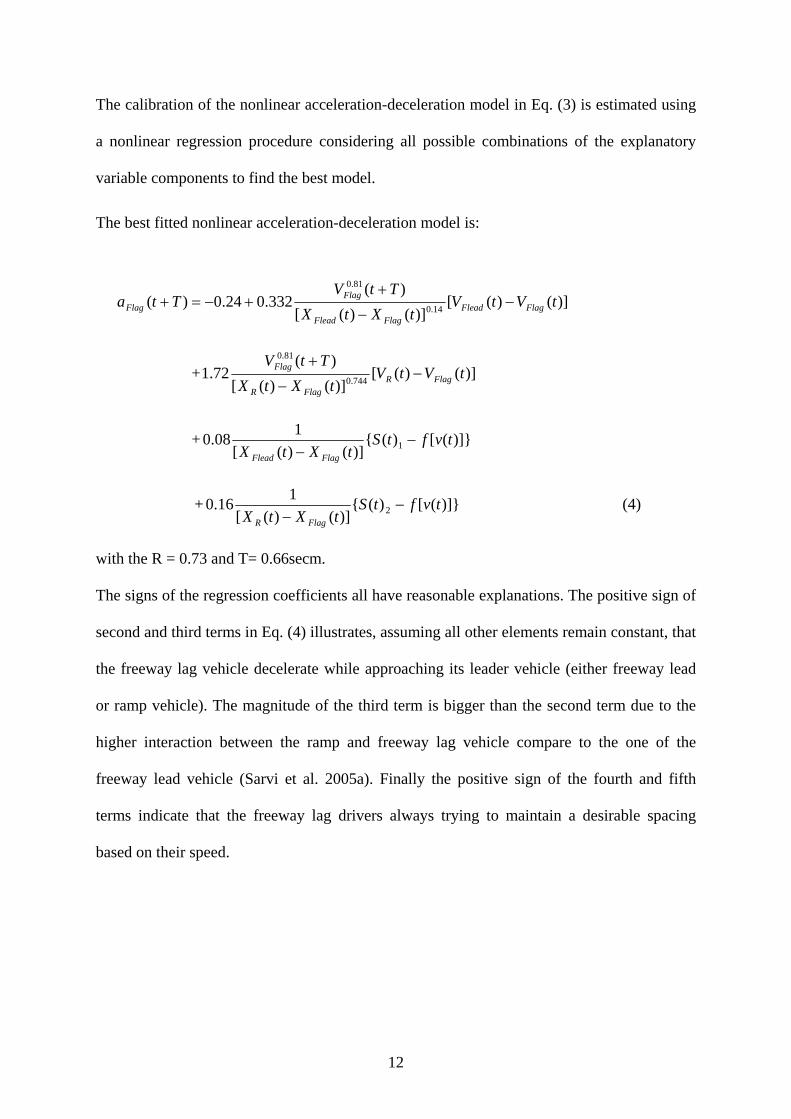
Nonlinear and linear functional forms considering all possible combinations of the
explanatory variable components of Eq. (1) were used for the calibration of proposed model
(Sarvi 2000).
The best fitted nonlinear acceleration-deceleration model is:
)]()([)]()([
)(84.1103.0)( 1
0002.0
tVtVtXtX
TtVTta RFleadRFlead
RR −
−+
+=+
)]()([)]()([
)(5.0 0
0002.0
tVtVtXtX
TtVFlagR
FlagR
R −−
+−
+ )]}([)({)]()([
1134.0 0 tvftStXtX RFlead
−−
(2)
with the R = 0.7 and T= 0.66sec.
The signs of the regression coefficients all have reasonable explanations. The positive sign of
second term in Eq. (2) illustrates, assuming all other elements remain constant, that the ramp
vehicle decelerate while approaching its freeway lead vehicle. The negative sign of the third
term, conversely, indicates that if the speed of ramp vehicle is lower than its corresponding
freeway lag vehicle, then the ramp vehicle accelerates in order to force a merging. Finally the
positive sign of the fourth term indicates that the ramp driver always trying to maintain a
desirable spacing based on its speed. The inclusion of the ramp vehicle current speed as one
of the explanatory variables is necessary due to its significant regression coefficient.
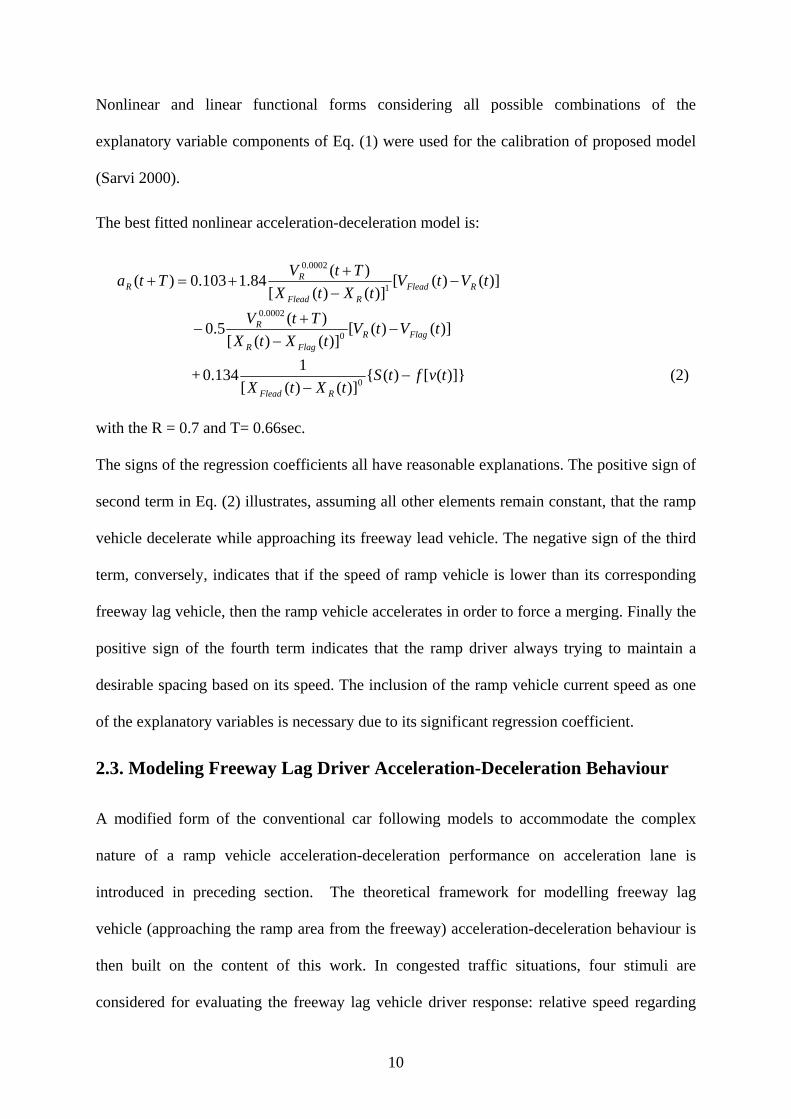
2.3. Modeling Freeway Lag Driver Acceleration-Deceleration Behaviour A modified form of the conventional car following models to accommodate the complex
nature of a ramp vehicle acceleration-deceleration performance on acceleration lane is
introduced in preceding section. The theoretical framework for modelling freeway lag
vehicle (approaching the ramp area from the freeway) acceleration-deceleration behaviour is
then built on the content of this work. In congested traffic situations, four stimuli are
considered for evaluating the freeway lag vehicle driver response: relative speed regarding
11
the freeway leader, relative speed regarding the ramp vehicle, spacing regarding the freeway
leader, and the spacing regarding the ramp vehicle as it is reported by Sarvi et al. (2005a).
The hypothesized expression of freeway lag vehicle acceleration-deceleration behaviour is
given as follows:
)]()([)]()([
)()(
110 tVtVtXtX
TtVTta FlagFleadl
FlagFlead
mFlag
Flag −−
++=+ αα
+ )]()([)]()([
)(22 tVtV
tXtXTtV
FlagRlFlagR
mFlag −−
+α
+ )]}([)({)]()([
113 3
tvftStXtX l
FlagFlead
−−
α
+ )]}([)({)]()([
124 4
tvftStXtX l
FlagR
−−
α (3)
Where:
)( TtaFlag + : Acceleration rate of the freeway lag vehicle at time t+T (m/s2) )(tX R : Location of the ramp vehicle at time t (m)
)(tX Flead : Location of the freeway lead vehicle at time t (m) )(tX Flag : Location of the freeway lag vehicle at time t (m)
)(tVR : Speed of the ramp vehicle at time t (m/s) )(tVFlead : Speed of the freeway lead vehicle at time t (m/s)
)(tVFlag : Speed of the freeway lag vehicle at time t (m/s) )()()( 1 tXtXtS FlagFlead −= : Spacing between the freeway lag vehicle and the freeway
leader vehicle at time t (m) )()()( 2 tXtXtS FlagR −= : Spacing between the freeway lag vehicle and the
ramp vehicle at time t (m)
)]([ tvf : Desired spacing as a function of speed (m) T : Time lag or driver reaction time (s)
432143210 ,,,,,,,,, llllmααααα are parameters to be estimated. Eq. (3) has a nonlinear form. However, by assigning constant values to some of the
parameters, Eq. (3) can be transformed to a linear form. A nonlinear and linear regression
technique is performed in order to calibrate the parameters in Eq. (3) for different T values.
12
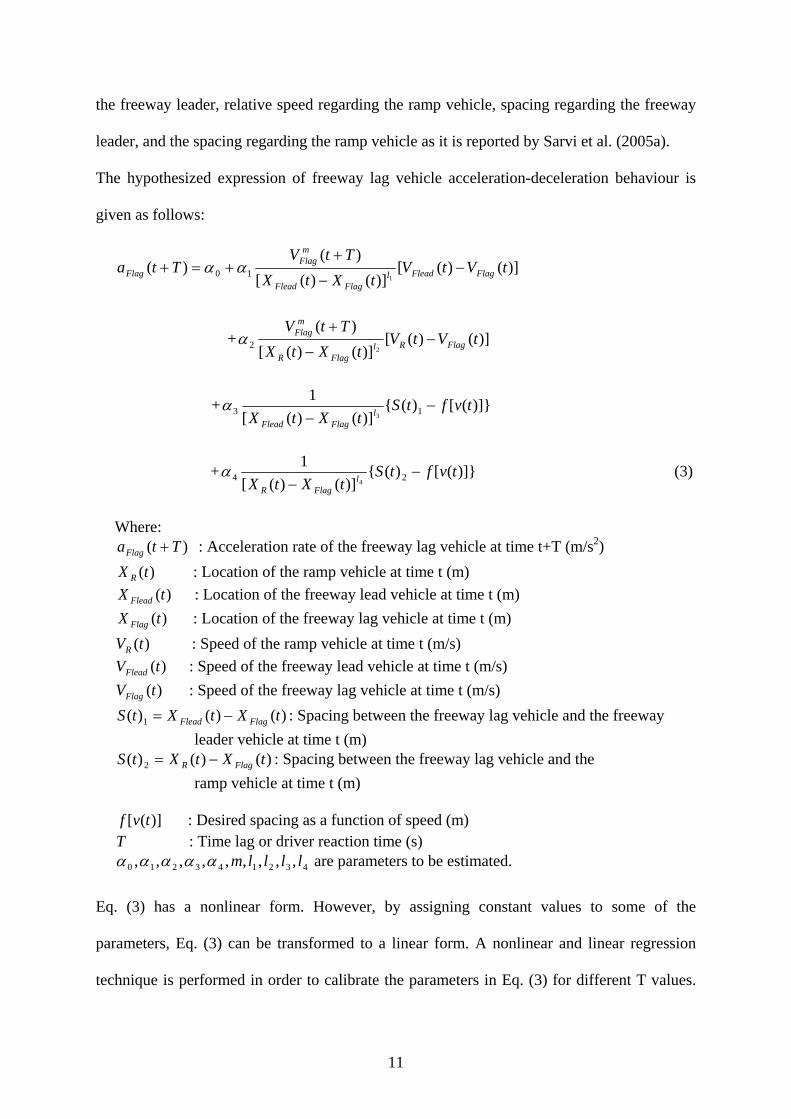
The calibration of the nonlinear acceleration-deceleration model in Eq. (3) is estimated using
a nonlinear regression procedure considering all possible combinations of the explanatory
variable components to find the best model.
The best fitted nonlinear acceleration-deceleration model is:
)]()([)]()([
)(332.024.0)( 14.0
81.0
tVtVtXtX
TtVTta FlagFlead
FlagFlead
FlagFlag −
−
++−=+
+ )]()([)]()([
)(72.1 744.0
81.0
tVtVtXtX
TtVFlagR
FlagR
Flag −−
+
+ )]}([)({)]()([
108.0 1 tvftStXtX FlagFlead
−−
+ )]}([)({)]()([
116.0 2 tvftStXtX FlagR
−−
(4)
with the R = 0.73 and T= 0.66secm.
The signs of the regression coefficients all have reasonable explanations. The positive sign of
second and third terms in Eq. (4) illustrates, assuming all other elements remain constant, that
the freeway lag vehicle decelerate while approaching its leader vehicle (either freeway lead
or ramp vehicle). The magnitude of the third term is bigger than the second term due to the
higher interaction between the ramp and freeway lag vehicle compare to the one of the
freeway lead vehicle (Sarvi et al. 2005a). Finally the positive sign of the fourth and fifth
terms indicate that the freeway lag drivers always trying to maintain a desirable spacing
based on their speed.

13
3. FMCSP: A MICRO SIMULATION MODEL 3.1. Outline of FMCSP
A periodic sampling method at intervals of 0.05 s is used for this micro simulation model.
The FMCSP simulation includes the merging section and the upstream/downstream sections.
These sections are treated as three distinct types, each with its own characteristics (see Figure
2). The FMCSP considers the following: (1) Preliminary segments (ramp and freeway lanes 1
and 2 prior to the merging point): the purpose of these segments is to allow time for the
vehicles generated at the upstream ends of the ramp and freeway to form platoons while
traveling through the 350 m segment. At the beginning of the freeway segment, vehicles are
dynamically generated based on the travel times of vehicles in the shoulder and median lanes
of the freeway. The merging maneuver makes the travel time of vehicles in the freeway
shoulder lane greater than that of vehicles in the median lane; hence, fewer vehicles are
generated in the shoulder lane. The shorter travel time of the freeway median lane accounts
for the tendency of drivers familiar with the merging section to utilize this lane to avoid
merging interactions. The FMCSP also varies vehicle size and acceleration/deceleration
performance to simulate vehicles ranging from trucks to light vehicles. Each driver is given a
desired speed, which is chosen from a normal distribution at the time the driver’s vehicle is
generated. (2) Merging segment (ramp and freeway lanes at the merging area): The merging
maneuvers of the merging vehicles, separately for passenger and heavy vehicles, is
implemented in these segments, utilizing the acceleration models described in the preceding
sections, in addition to the lane-changing maneuvers of vehicles moving from the freeway
shoulder lane into the freeway median lane. A 10-m segment between Zones 2 and 3 is
defined as the terminal segment so that in which vehicles that have not yet merged are forced
to merge. (3) Downstream segments (freeway lanes at Zone 3): In this 100-m section after the
merging section, free-flow traffic conditions are simulated. (4) Aggressive driver lane-
14
changing model: this component models the lane-changing behaviour of drivers who move
from the freeway shoulder lane to the freeway median lane immediately before the merging
section in order to avoid merging interactions. Direct observation and video data indicate that
this lane-changing behaviour reduces the flow rate of the freeway median lane and
consequently affects the total output flow rate of the freeway. (5) Avoidance lane-changing
model: this model implements the lane-changing of vehicles from the freeway shoulder lane
(within the merging section) into the freeway median lane. Often vehicles change lane,
especially where the two lanes ramp merge, after their first merging to avoid the delay of a
second merging.
The current version of the traffic simulation model considers parallel and taper types of
acceleration lane, the length of the taper, and the convergence angle of the merging segment.
The graphic interface of FMCSP displays the ramp-freeway configuration of the merging
section as well as the movement of vehicles along the traffic lanes.
3.1.1. Calibration and validation process
The validation of FMCSP was performed at microscopic and macroscopic levels using the
traffic flows and lane-changing maneuvers observed at the Hamazaki-bashi and Ichinohashi
merging sections, where the traffic demand exceeds the capacity resulting in upstream queues.
In the macroscopic analysis, the average speed, density, and volume computed using the
FMCSP were compared with the values from real world traffic conditions (Figure 5). In the
microscopic analysis, trajectories from the FMSCP were compared with those from the field
data (Figure 6).
15
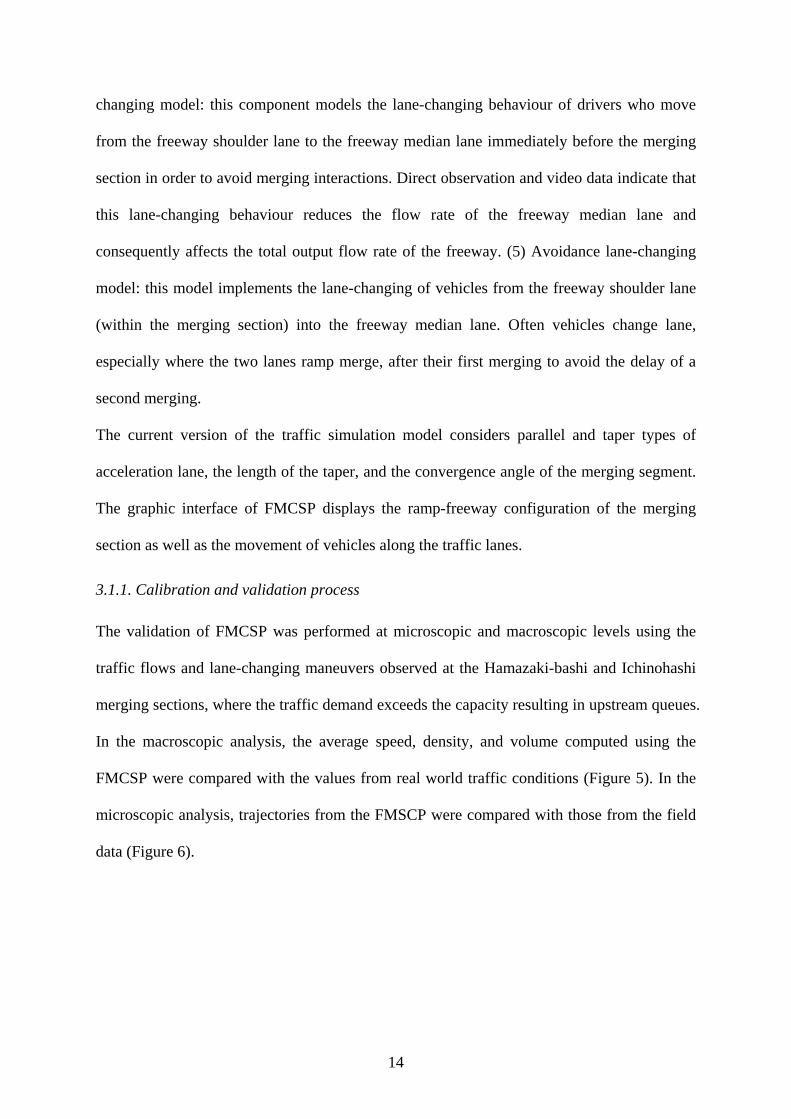
Figure 5 Observed versus simulated traffic volumes at Ichinohashi.
To validate the simulation model, four traffic flows and two lane-changing maneuvers were
compared with observation. The two lane-changing maneuvers considered were aggressive
lane changing before the physical nose and avoidance lane changing within the merging
section. As shown in Figure 5, good agreement was found between the real and simulated
results for the traffic volumes of the freeway shoulder and median lanes after the merging
section, the traffic volumes of the ramp lane and freeway median lane before the merging
section, the number of lane-changing maneuvers before the physical nose, and the lane-
changing maneuvers within the merging section.
Figure 6 shows a comparison between the simulated and observed trajectories of vehicles.
Each pair of lines in this figure represents the ramp vehicle and its freeway lead vehicle. The
slopes of the trajectory lines (speeds) for the simulated vehicles before and after the merging
process are consistent with the observed slopes. The average speeds of the simulated ramp
vehicle and its freeway leader vehicle during the course of merging maneuver (i.e., from the
physical nose till the end of merging lane) are 5.24 m/s and 6.20 m/s, respectively, while the
corresponding velocities observed for the real vehicles are 5.25 m/s and 6.24 m/s. Between
the end of the zebra marking and the end of the merging lane, the average time (headway)
between the ramp vehicle and its freeway leader is 1.8 s in the real situation and 1.95 s for the
16
simulation. Additionally, a significant speed reduction immediately prior to the merging
maneuver is observed in both the simulated and the real trajectories.
Figure 6 Comparison of observed, simulation, and DS trajectories at Ichinohashi
In addition to the trajectory analysis, the lane-changing maneuvers of vehicles in the FMCSP,
as visualized using the graphic interface (see Figure 7), were validated against real world
video footage. This comparison considered the movement of the simulated vehicles prior to
the merge end, and the merging maneuver of vehicles at the merging section. Furthermore,
the impact of heavy vehicles percentage on maximum flow rate of Ichinohashi merging
section was compared with the field data obtained from detector data taken over two months
(Sarvi et al. 2005b). The results specified a good consistency between the FMCSP and
detector data.
0
20
40
60
80
100
120
0 5 10 15 20 25 30 35 40 45 50 55 60Time (s)
Dist
ance
(m)
Physical nose
End of zebra
End of merging lane
Driving simulator Simulation
Observation FL R FL
R
RR
FL FL
R: Ramp merging vehicleFL: Corresponding freeway lead vehicle
FL R
FL
R
FL R

17
Figure 7 Two images of FMCSP
4. SIMULATION PROGRAM APPLICATIONS A wide range of application options are available through the developed simulation program.
Some initial results from a series of applications are presented in the following sections.
4.1. Developing control strategies for freeway merging points using FMCSP Traffic congestion frequently occurs at merging bottleneck sections, especially during heavy
traffic demand. Generally different empirical strategies could be applied at merging sections
to increase the flow rate and decrease the accident rate. However, these strategies do not rely
either on any behavioural characteristic of the merging traffic or on the geometric design of
the merging segments. Therefore, the FMCSP is utilized to investigate different strategies
during the merging process under congested situations in order to design safer and less
congested merging points as well as to apply more efficient control at these bottleneck
sections. Two groups of strategies were investigated and reported by Sarvi et al. (2003). The
first group was related to the traffic characteristics, and the second group to the geometric
characteristics. In the first group, the control strategies related to closure of freeway and ramp
lanes as well as lane-changing maneuver restriction were investigated. The results and a brief
discussion of implementation of a lane changing restriction are presented in the next section.
18
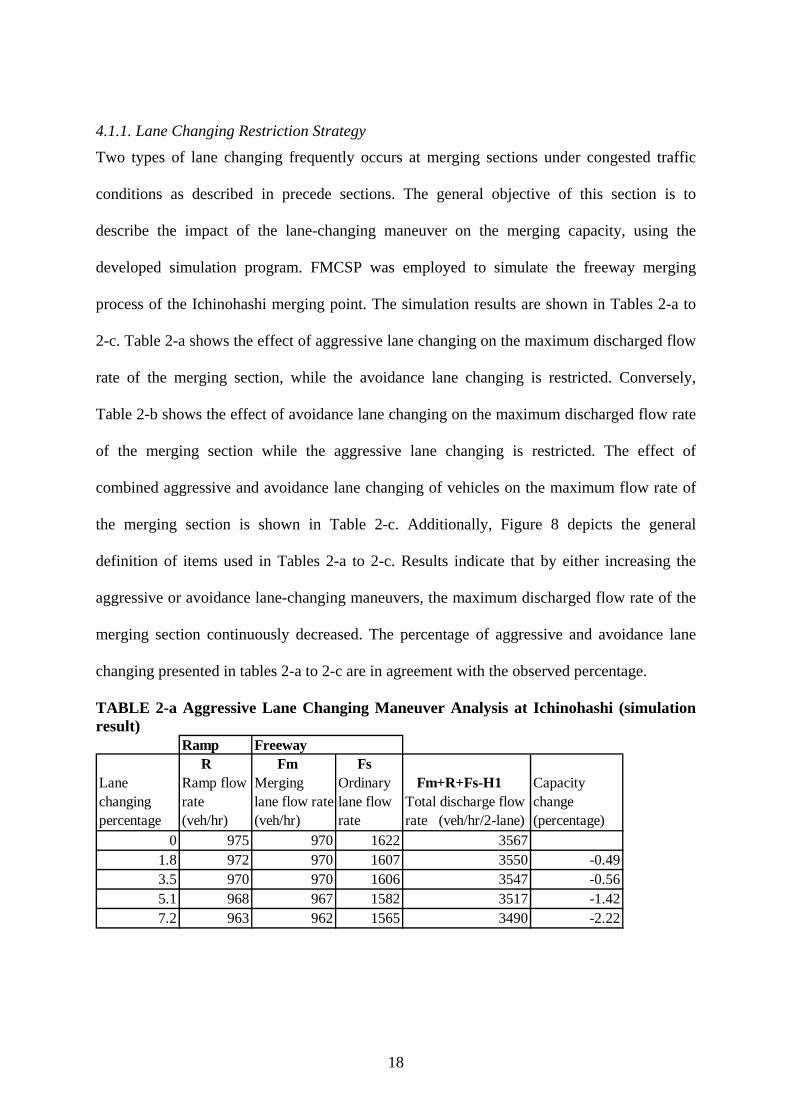
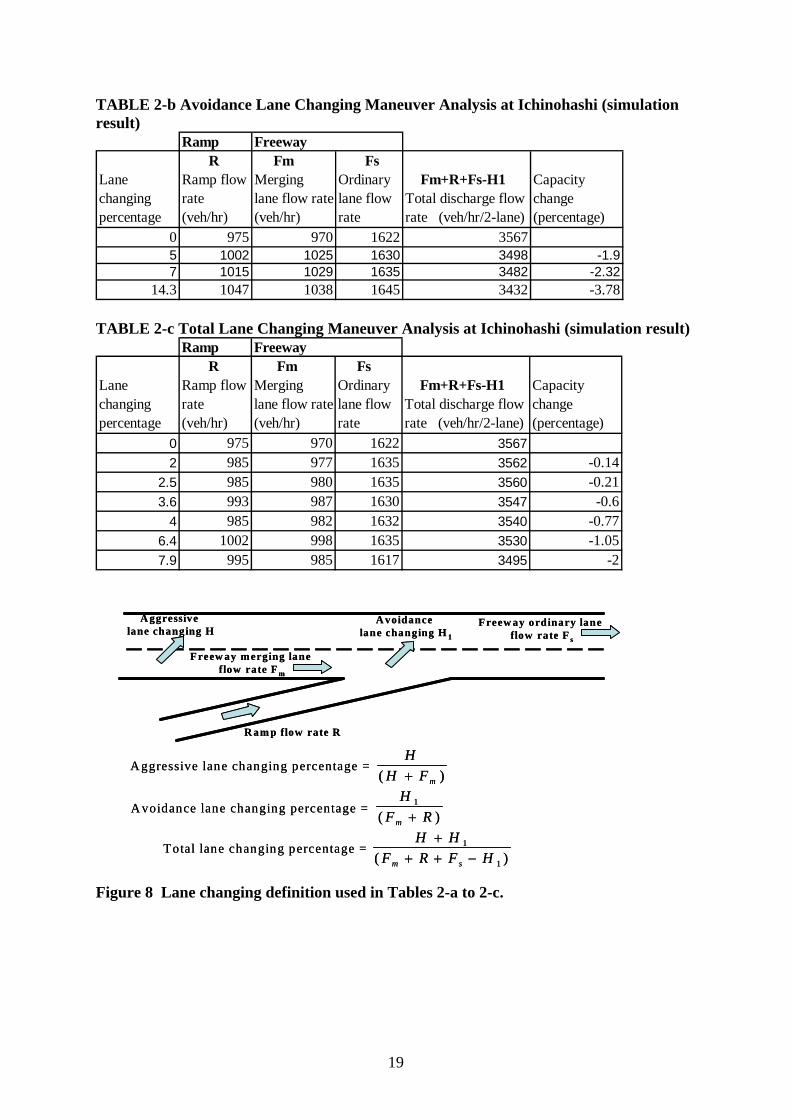
4.1.1. Lane Changing Restriction Strategy
Two types of lane changing frequently occurs at merging sections under congested traffic
conditions as described in precede sections. The general objective of this section is to
describe the impact of the lane-changing maneuver on the merging capacity, using the
developed simulation program. FMCSP was employed to simulate the freeway merging
process of the Ichinohashi merging point. The simulation results are shown in Tables 2-a to
2-c. Table 2-a shows the effect of aggressive lane changing on the maximum discharged flow
rate of the merging section, while the avoidance lane changing is restricted. Conversely,
Table 2-b shows the effect of avoidance lane changing on the maximum discharged flow rate
of the merging section while the aggressive lane changing is restricted. The effect of
combined aggressive and avoidance lane changing of vehicles on the maximum flow rate of
the merging section is shown in Table 2-c. Additionally, Figure 8 depicts the general
definition of items used in Tables 2-a to 2-c. Results indicate that by either increasing the
aggressive or avoidance lane-changing maneuvers, the maximum discharged flow rate of the
merging section continuously decreased. The percentage of aggressive and avoidance lane
changing presented in tables 2-a to 2-c are in agreement with the observed percentage.
TABLE 2-a Aggressive Lane Changing Maneuver Analysis at Ichinohashi (simulation result)
Ramp
Lane changing percentage
R Ramp flow rate (veh/hr)
Fm Merging lane flow rate (veh/hr)
Fs Ordinary lane flow rate
Fm+R+Fs-H1 Total discharge flow rate (veh/hr/2-lane)
Capacity change (percentage)
0 975 970 1622 35671.8 972 970 1607 3550 -0.493.5 970 970 1606 3547 -0.565.1 968 967 1582 3517 -1.427.2 963 962 1565 3490 -2.22
Freeway
19
TABLE 2-b Avoidance Lane Changing Maneuver Analysis at Ichinohashi (simulation result)
Ramp
Lane changing percentage
R Ramp flow rate (veh/hr)
Fm Merging lane flow rate (veh/hr)
Fs Ordinary lane flow rate
Fm+R+Fs-H1 Total discharge flow rate (veh/hr/2-lane)
Capacity change (percentage)
0 975 970 1622 35675 1002 1025 1630 3498 -1.97 1015 1029 1635 3482 -2.32
14.3 1047 1038 1645 3432 -3.78
Freeway
TABLE 2-c Total Lane Changing Maneuver Analysis at Ichinohashi (simulation result)
Ramp
Lane changing percentage
R Ramp flow rate (veh/hr)
Fm Merging lane flow rate (veh/hr)
Fs Ordinary lane flow rate
Fm+R+Fs-H1 Total discharge flow rate (veh/hr/2-lane)
Capacity change (percentage)
0 975 970 1622 35672 985 977 1635 3562 -0.14
2.5 985 980 1635 3560 -0.213.6 993 987 1630 3547 -0.6
4 985 982 1632 3540 -0.776.4 1002 998 1635 3530 -1.057.9 995 985 1617 3495 -2
Freeway
Figure 8 Lane changing definition used in Tables 2-a to 2-c.
Freew ay ordinary laneflow rate F s
Freew ay merging laneflow rate F m
A voidancelane changing H 1
A ggressivelane changing H
R am p flow rate R
Aggressive lane changing percentage = )( mFH
H+
A voidance lane changing percentage = )(1
RFH
m +
Total lane changing percentage = )( 1
1
HFRFHH
sm −+++
Freew ay ordinary laneflow rate F s
Freew ay merging laneflow rate F m
A voidancelane changing H 1
A ggressivelane changing H
R am p flow rate R
Aggressive lane changing percentage = )( mFH
H+
A voidance lane changing percentage = )(1
RFH
m +
Total lane changing percentage = )( 1
1
HFRFHH
sm −+++

20
4.2 Study of freeway ramp merging process using FMCSP and a driving Simulator Carmakers, suppliers and transport research laboratories commonly employ driving
simulators in research and the development. Driving simulators are well established as
training tools, and are becoming an essential component in new vehicle research and
development as well as an increasingly useful tool in traffic and transportation research
(Upchurch et al. 2002, Knodler et al. 2005, Essam et al. 2005). One of the first attempts to
utilize a driving simulator to study freeway ramp merging phenomena was introduced and
presented by Sarvi et al. (2004). The following section briefly describes the methodology
for linking a driving simulator (DS) into the FMCSP in order to compare the behaviour of DS
drivers with that of drivers in the real world as they carry out freeway ramp merging
maneuvers.
4.2.1. Comparison of driving behaviour in DS with the one in the real world
The DS and simulation were combined by replacing one vehicle in the FMCSP by the DS.
Using this approach, the FMCSP adjusts the speed of the surrounding vehicles (e.g., freeway
lead and lag vehicles) in response to the incoming merging vehicle (i.e., DS driver) according
to the car-following models, as explained earlier. The FMCSP was extensively calibrated,
improved, and modified to accurately simulate the actual traffic scenarios of the DS. The
driving behaviour data of 12 people were collected while they were driving in the DS (see
Figure 9). In addition, two participants of the DS experiments drove a sophisticated
instrumented car through the real Ichinohashi merging section. The driving behaviour data
from the DS, instrumented car, and observation of drivers were compared to investigate the
behaviour of DS driver and examine differences between the behaviour of drivers using
simulators and that in the real world (see Figure 6). The results indicated that the FMCSP is
capable of simulating the actual traffic conditions of congested freeway ramp merging
21
process, and that the insertion into a simulation of a vehicle controlled by a DS is a promising
tool for the study of complicated ramp merging phenomena.
Figure 9 A photograph of DS driver driving in DS.
5. CONCLUSION
Traffic surveys, macroscopic and microscopic studies are performed at several merging
sections on the Tokyo Metropolitan Expressway and a particular method to deal with these
observed data is established. A theoretical framework for modeling the ramp and freeway lag
driver acceleration-deceleration behaviour is presented. This methodology uses the stimuli-
response psychophysical concept as a fundamental rule, and is formulated as a modified form
of the conventional car-following models. Data collected at the two merging points of the
Tokyo Metropolitan Expressway are used to calibrate the hypothesized ramp and freeway lag
vehicle acceleration models. Furthermore, the lane changing maneuver of freeway aggressive
vehicles before merging end as well as avoidance lanes changing are presented and taken into
consideration.
Based on the behavioural model as an evaluation tool, a multi-purpose micro simulation
program, FMCSP, has been developed. The validation of FMCSP performed at microscopic
22
and macroscopic levels using the observation flow and lane changing maneuver at the
Hamazaki-bashi and Ichinohashi interchanges under congested traffic situation. It is found
that simulated value of discharged volumes and lane changing maneuver as well as the
observed and the simulated trajectories of vehicles fitted well with that observed. It is also
found that the impact of heavy vehicle percentage on the merging capacity of FMCSP is in
agreement with the observed data. Finally the developed simulation program is applied
successfully to investigate variety of freeway and ramp merging strategies as well as to
establish a link with a driving simulator to study ramp driver’s behaviour. Future
improvements such as incorporation of the effects of vertical alignment, lane width, and
lateral clearance needed to improve the functionality of FMCSP.
REFERENCES
Ahmed, K., Ben-Akiva, M., Koutsopoulos, H., Mishalani, R., 1996. Models of freeway lane changing and gap acceptance behaviour. International Symposium of Traffic and Transportation Theory, J. Lesort (ed.), Elsevier Science & Pergoman Pub.: 501-515. Ahmad, k., 1999. Modeling drivers acceleration and lane changing behaviour. Ph.D. Thesis, Department of Civil and Environmental Engineering, MIT, Cambridge, MA. Beakey, J. 1938. Acceleration and deceleration characteristics of private passenger vehicle. Proceeding of the 18th Highway Research Board annual meeting, Washington, D.C. Chang, G., YM, C., 1991. An amperical investigation of macroscopic lane changing characteristics on uncongested multilane freeways. Transportation research Journal, Vol. 25A. Daganzo, C., 1979. Estimation of gap acceptance parameters within and across the population from direct roadside observation. Transportation research Journal, Vol. 15B. Drew, D., LaMotte, L., Wattleworth, J., 1967. Gap acceptance in the freeway merging process. Highway research record. Herman, R., Rothery, R.W, 1963. Car following and steady state flow. Proceeding of the second International symposium on the theory of road and traffic flow, London, United Kingdom. Hess, J.W. 1963. Capacities and characteristics of Ramp-Freeway connections. HRR 1963, 27.
23
Hess, J.W. 1963. Ramp-Freeway terminal operation as related to freeway lane volume distribution and adjacent ramp influence. HRR 1965, 99. Kita, H., 1993. Effects of merging lane length on the merging behaviour at expressway on-ramps. International Symposium of Traffic and Transportation Theory, C. Daganzo (ed.), Elsevier Science & Pergoman Pub.: 37-51. Kita, H., 1998. A merging-give way interaction model of cars in a merging section: A game theoretic analysis. Transportation research Journal, Vol. 33A. Knodler, MA, Jr; Noyce, DA; Kacir, KC; Brehmer, CL. 2005. Evaluation of traffic signal displays for protected-permissive left turn control using simulator technology. Journal of Transportation Engineering,Volume: 131 Issue: 4. Kurian, M., 2000. Calibration of Microscopic Traffic Simulator. Master Thesis, Department of Civil and Environmental Engineering, MIT, Cambridge, MA. Makigami, Y., Adachi, Y., Sueda, M., 1988. Merging lane length for expressway improvement plan in Japan. Journal of transportation engineering, Vol. 114, No. 6. Michaels, R.M., Fazio, J., 1989. Driver behaviour model of merging. TRR 1233, pp. 4-10. Pinnell, C., Keese, C. 1960. Traffic behaviour and freeway ramp design. Journal of the Highway Design proceeding of the American Society of Civil Engineering. Polus, A., Livneh, M. 1985. Vehicle flow characteristics on acceleration lanes. Journal of Transportation Engineering, Vol. 111, No. 6. Polus, A., Livneh, M. 1987. Comments on flow characteristics on acceleration lanes. Transportation Research, 21A(1). Rottinghous, B.H. 1974. Urban freeway ramp control. Proceeding of the summer annual meeting of plning and transport research and computation (international), Ltd. Univ. Warwich, UK. Sarvi, M., and Kuwahara, M., 1999. Comparative study on evaluation of merging capacity in Tokyo Metropolitan Expressway. Seisan-Kenkyu Journal, Vol.51, No. 2. Sarvi, M, 2000. Freeway ramp merging phenomena observed in traffic congestion. Ph.D. dissertation, University of Tokyo. Sarvi, M., Kuwahara, M., Ceder, A., 2001. Morita H. Macroscopic study of freeway ramp merging phenomena observed in traffic congestion. Journal of Eastern Asia Society for Transportation Studies. Sarvi, M., Ceder,A., Kuwahara, M., 2002. Modeling of freeway ramp merging process observed during traffic congestion. International Symposium of Traffic and Transportation Theory, M.A.P. Taylor (ed.), Elsevier Science & Pergoman Pub.: 483-502.
24
Sarvi, M., Kuwahara M. Ceder,A., 2003. Developing control strategies for freeway merging points under congested traffic situations using modeling and a simulation approach. Journal of Advanced transportation, 37, 3. Sarvi, M Kuwahara, M Ceder, A. 2004. “A study on freeway ramp merging phenomena in congested traffic situation by traffic simulation combined with driving simulator”. Journal of computer-aided civil and infrastructure engineering 19, 351-363. Sarvi, M., Ceder,A., Kuwahara, M., 2005a. Freeway ramp merging process observed in congested traffic: Lag vehicle acceleration model. International Symposium of Traffic and Transportation Theory, H. Mahmassani (ed.), Elsevier Science & Pergoman Pub.: 303-321. Sarvi M, Kuwahara M, 2005b. Evaluation of the heavy-duty vehicles impacts on the capacity of merging sections using a micro simulation”. Submitted for publication in the IEEE Transactions on Intelligent Transportation Systems Journal. Upchurch, J; Fisher, D; Carpenter, RA; Dutta, A. 2002. Freeway guides sign with driving simulator for central artery tunnel. Journal of Transportation Research Record, 1801, pp 9-17. Wattlworth, J.A., Buhr, J.H., Drew, D.R., Geric, F.A. 1967. Operational effects of some entrance ramp geometrics on freeway merging. HRR 1967, 280. Yan, Xuedong; Radwan, Essam; Birriel, Elizabeth. 2005. Analysis of Red Light Running Crashes Based on Quasi-Induced Exposure and Multiple Logistic Regression Method. Journal of the Transportation Research Record, 1908, pp 70-79.