development of a high surface area cathode for an
TRANSCRIPT

The Pennsylvania State University
The Graduate School
College of Engineering
DEVELOPMENT OF A HIGH SURFACE AREA CATHODE FOR AN
ENVIRONMENTALLY FRIENDLY MAGNESIUM RESERVE BATTERY
A Thesis in
Engineering Science and Mechanics
by
Robert J. Vadella Jr.
© 2013 Robert J. Vadella Jr.
Submitted in Partial Fulfillment
of the Requirements
for the Degree of
Master of Science
December 2013

ii
The thesis of Robert J. Vadella Jr. was reviewed and approved* by the following:
Barbara A. Shaw
Professor of Engineering Science and Mechanics
Thesis Advisor
Elizabeth Sikora
Instructor of Engineering Science and Mechanics
Judith A. Todd
Professor of Engineering Science and Mechanics
P.B. Breneman Department Head of Engineering Science and Mechanics
*Signatures are on file in the Graduate School.

iii
Abstract
In this thesis, various materials and fabrication techniques were examined in an attempt to
develop a cathode material for a “green” magnesium reserve battery. The candidate cathode
materials could be classified as one of two types – conducting polymers and graphite materials –
both of which are carbon-based. Three important factors that influence the effectiveness of
cathode materials are surface area, electrical conductivity, and a large potential difference with
the anode which in this study is a magnesium alloy.
The surface of each candidate material (or substrate on which a material was deposited) was
examined using scanning electron microscopy. The candidate cathode materials were then
subjected to electrochemical experiments which enabled for the candidate electrodes to be
compared against one another. The anode material that was used in every experiment was a
chunk of bulk magnesium AZ91 alloy. Two different electrolytes – saturated sodium chloride
and artificial seawater – were tested as well.
Using the Gamry Reference 3000 potentiostat, the electrochemical cells were tested together in a
full cell configuration. The two main tests that were run were the read voltage experiment which
measures the cell voltage over time and the constant current discharge experiment which
measures the voltage response of the cell as a constant current is forced through the cell.
Read voltage experiments indicated that the conducting polymer cathodes, polypyrrole and
poly(3,4-ethylenedioxythiophene) (PEDOT), provided a stable cell voltage of over 1.8 V when
coupled with AZ91 in either electrolyte solution. However, the conducting polymer cathodes
failed in the constant current discharge tests likely due to the relatively low conductivity of the
samples. While the materials are “conducting” polymers, their conductivity is still orders of
magnitude lower than graphite and metallic materials.
The graphite cathodes displayed lower cell voltages of between 1.6 to 1.8 V, but were much
better in the constant current discharge experiments. Two materials that stood out among the
graphite materials were the Zorflex double weave graphite fabric and the pressed powder
graphite made using powder metallurgy techniques. The high surface area and electrical
conductivity of these materials allowed for large currents to run through the cell while the cell
voltage still remained high.

iv
Table of Contents
List of Figures ........................................................................................................................vii
List of Tables .........................................................................................................................xvii
Acknowledgements ................................................................................................................xviii
Chapter 1: Introduction ..........................................................................................................1
1.1. Background .........................................................................................................1
1.2. Objectives ...........................................................................................................2
Chapter 2: Literature Review .................................................................................................4
2.1. Batteries ..............................................................................................................4
2.1.1. Principles of Battery Operation ...........................................................5
2.1.2. Reserve Batteries .................................................................................9
2.1.3. Disposal and Recycling of Batteries ....................................................10
2.2. Battery Anodes....................................................................................................11
2.2.1. Magnesium ...........................................................................................11
2.2.1.1. Corrosion of Magnesium ......................................................12
2.2.2. Magnesium Batteries ...........................................................................16
2.3. Battery Cathodes .................................................................................................19
2.3.1. Conductive Polymers ...........................................................................20
2.3.1.1. PEDOT ..................................................................................20
2.3.1.2. PEDOT:PSS ..........................................................................21
2.3.1.3. Polypyrrole ............................................................................21
2.3.1.4. Electrospinning .....................................................................22
2.3.2. Graphite................................................................................................25
2.3.2.1. Graphite in Current Battery Technology ..............................28
2.3.3. Cathodes Used in Magnesium Reserve Systems .................................28
2.3.3.1. Silver Chloride ......................................................................29
2.3.3.2. Cuprous Chloride ..................................................................30
2.3.3.3. Manganese Dioxide ..............................................................30
2.3.4. Thin Film Electrodes............................................................................31
Chapter 3: Experimental ........................................................................................................32
3.1. Fabrication of Cathode Materials........................................................................32
3.1.1. Conducting Polymers ...........................................................................32

v
3.1.1.1. Direct Deposition onto a Substrate .......................................32
3.1.1.2. Chemical Vapor Deposition ..................................................33
3.1.1.3. Electrospinning .....................................................................34
3.1.2. Graphite Materials ...............................................................................37
3.1.2.1. Graphite Foil .........................................................................37
3.1.2.2. Woven Graphite Cloth ..........................................................38
3.1.2.3. Carbon Paint..........................................................................39
3.1.2.4. Carbon Ink ............................................................................40
3.1.2.5. Pressed Graphite Powders .....................................................41
3.1.3. Summary of Prepared Candidate Materials .........................................42
3.2. Characterization ..................................................................................................43
3.3. Conductivity Testing ...........................................................................................44
3.4. Electrochemical Testing......................................................................................45
3.4.1. Sample Preparation ..............................................................................46
3.4.2. Solution Preparation.............................................................................48
3.4.3. Half-Cell Tests .....................................................................................49
3.4.4. Full-Cell Tests ......................................................................................50
3.4.4.1. Read Voltage .........................................................................51
3.4.4.2. Constant Current Discharge ..................................................52
Chapter 4: Results and Discussion .........................................................................................55
4.1. Characterization ..................................................................................................55
4.1.1. Surface Morphology ............................................................................55
4.1.1.1. Conducting Polymers ............................................................55
4.1.1.2. Graphite Materials ................................................................58
4.2. Electrochemical Testing......................................................................................62
4.2.1. Read Voltage Experiments ..................................................................62
4.2.2. Constant Current Discharge Tests .......................................................65
4.2.2.1. Control Tests .........................................................................66
4.2.2.2. Conducting Polymers ............................................................69
4.2.2.3. Graphite Materials ................................................................69
4.2.2.4. Summary of Constant Current Discharge Experiments ........75
4.2.3. Potentiostatic EIS Experiments ............................................................83
4.2.4. Voltage Delay ......................................................................................85
Chapter 5: Conclusion............................................................................................................87
Chapter 6: Future Work .........................................................................................................88

vi
Appendix A: Glossary of Battery Terminology.....................................................................89
Appendix B: Read Voltage Experiments ...............................................................................90
Appendix C: Constant Current Discharge Experiments ........................................................99
References ..............................................................................................................................103

vii
List of Figures
Figure 2-1: A "voltaic pile," considered to be the first ever battery. It was
invented in the year 1800 by Alessandro Volta. [Taken from Reference 9] .........................4
Figure 2-2: The two images show the results of connecting cells in series or in
parallel. The image on the left shows how connecting four cells in series will
result in an additive potential, while image on the right shows how connecting
four cells in series will result in an additive current. [Taken from Reference 10] ................6
Figure 2-3: The schematic illustrates the discharge of a galvanic cell. [Taken
from Reference 7] ..................................................................................................................7
Figure 2-4: The galvanic series ranks materials from most to least active in a
particular environment. This galvanic series is for materials in flowing seawater at
25˚C. The potential is measured against a saturated calomel electrode. [Taken
from Reference 11] ................................................................................................................8
Figure 2-5: A schematic of the components of a typical consumer battery is
shown [Taken from Reference 2] ..........................................................................................9
Figure 2-6: The electromotive force (emf) series shows the potential of reversible
electrodes at standard state with respect to a hydrogen reference. Magnesium has
a standard electrode potential of -2.37 V. [Taken from Reference 22] .................................13
Figure 2-7: Pourbaix diagrams show the equilibrium phases for an aqueous
electrochemical system. The diagram in this image is for pure magnesium in
water. It shows that the magnesium is thermodynamically favored to corrode in
almost all environments. [Taken from Reference 25] ...........................................................14
Figure 2-8: The top schematic shows galvanic corrosion due to external contact
with another metal. The bottom schematic shows galvanic corrosion due to the
presence of an internal cathode. [Taken from Reference 18] ................................................15
Figure 2-9: An example of magnesium water-activated battery [Taken from
Reference 13] .........................................................................................................................17
Figure 2-10: Voltage profile of magnesium primary battery at 20˚C [Taken from
Reference 29] .........................................................................................................................18
Figure 2-11: (Left) The cylindrical construction of a magnesium primary battery
is shown. (Right) An inside-out construction of a magnesium battery is shown.
[Taken from Reference 29] ....................................................................................................19
Figure 2-12: The chemical structure of the EDOT monomer is shown. The
PEDOT polymer consists of long chains of EDOT monomers. PEDOT is a sulfur-
containing conducting polymer where the sulfur atom is in the aromatic cycle. ..................20

viii
Figure 2-13: The chemical structure of the pyrrole monomer is shown. The
polypyrrole polymer consists of long chains of pyrrole monomers. Polypyrrole is
a nitrogen-containing conducting polymer where the nitrogen atom is in the
aromatic cycle. .......................................................................................................................22
Figure 2-14: Electrospinning setup [Taken from Reference 49] ..........................................23
Figure 2-15: SEM images of polystyrene nanofibers where EDOT was vapor
deposited for 6 hours at 70˚C. [Taken from Reference 56] ...................................................24
Figure 2-16: The image displays the crystal structure of graphite showing ABAB
stacking sequence and the unit cell. The diagram shows the spacing between
electrons and layer planes. [Taken from Reference 5] ..........................................................26
Figure 2-17: The left image shows the hexagonal stacking sequence of graphite
layer planes. The image on the right shows the less common and more unstable
rhombohedral stacking sequence of graphite layer planes. [Taken from Reference
5] ............................................................................................................................................27
Figure 2-18: Mg/AgCl batteries [Taken from Reference 13] ...............................................29
Figure 2-19: The discharge curves of 12 Mg/MnO2 cells connected in series in
various aqueous electrolytes are shown. The discharge test was run at a constant
current of 150 mA (10 mA/cm2). [Taken from Reference 66] ..............................................30
Figure 3-1: A timeline of the chemical vapor deposition process of polypyrrole is
shown. The catalyst-coated paper substrates are placed in a petri dish and drops of
the monomer pyrrole are dropped around the samples. (Left) The samples are
covered and placed in an oven (~65˚C) where vapors of the monomer start to
polymerize on the surface of the samples. This can be seen due to the darker
color. (Middle) After several hours, the monomer is completely polymerized on
the surface of the samples. The samples are now coated in the conducting polymer
polypyrrole. (Right) ...............................................................................................................33
Figure 3-2: The components of the electrospinning apparatus are shown. [Taken
from Reference 72] ................................................................................................................34
Figure 3-3: The process for fabricating the spinneret used in the electrospinning
setup is shown. The glass pipet is stretched over a Bunsen burner until the
opening is very small. ............................................................................................................35
Figure 3-4: An optical micrograph of an engineered electrospinning spinneret
made from a glass pipet is shown. .........................................................................................35
Figure 3-5: This image shows the electrospinning process in action. The
electrospun product is deposited on the glass slides beneath the spinneret. ..........................36

ix
Figure 3-6: Graphite foil .......................................................................................................37
Figure 3-7: Two woven carbon fabrics are shown. The black fabric is Zorflex
double weave graphite cloth and the silver fabric is ECO Fabric bamboo charcoal
carbon nanoparticle fabric. .....................................................................................................38
Figure 3-8: Ted Pella colloidal graphite paint ......................................................................40
Figure 3-9: The process of painting graphite ink onto a glass fiber paper substrate
is shown. Due to the porosity of the substrates that were used, large amounts of
ink were needed for the substrate to be fully coated. .............................................................41
Figure 3-10: This image shows the pressed powder graphite samples that were
used for testing. Fine graphite powder was pressed into this shape using over 26
tons of pressure. .....................................................................................................................42
Figure 3-11: Philips XL 30 Environmental Scanning Electron Microscope ........................44
Figure 3-12: Two different test setups were used depending on the materials that
were being tested. The beaker cell setup is shown on the left and the flat cell setup
is shown on the right. In the flat cell, the anode and cathode are 7 cm apart. When
tests were run in the beaker cell setup, an attempt was made to hold the electrodes
7 cm apart for the results to remain consistent. .....................................................................45
Figure 3-13: To prepare the magnesium alloy samples used as the anode material
during electrochemical tests, a wet sanding process was used to ensure the anode
material would be consistent throughout all experiments......................................................46
Figure 3-14: A magnesium AZ91 alloy anode sample with an electrical
connection made from copper tape is shown. While it would have been possible to
connect the leads of the potentiostat directly to the magnesium, the copper tape
makes the connection much easier. ........................................................................................47
Figure 3-15: A masked Zorflex fabric electrode is shown. The masking tape
prevented leaking of the electrolyte out of the cell. Again copper tape was used to
make the electrical connection. ..............................................................................................48
Figure 3-16: The setup for testing the solution pH of the tested electrolytes is
shown. ....................................................................................................................................49
Figure 3-17: The half-cell test setup is shown. The counter (red) and counter
sense (orange) leads are connected to the counter electrode. The working (green)
and working sense (blue) are connected to the working electrode. The reference
(white) lead is connected to the reference electrode. .............................................................50

x
Figure 3-18: The full-cell test setup is shown. In the full-cell setup, the lead
connections are different from the half-cell setup. The working and working sense
leads are connected to the cathode, the counter and reference leads are connected
to the anode, and the ground and counter sense leads (not pictured) are connected
to each other. ..........................................................................................................................51
Figure 3-19: The constant current discharge curves for a Duracell AA alkaline
battery are shown. The time axis is on a log scale. The battery displays a very
stable voltage for relatively long periods of time. This is an example of the
discharge tests that were run in this study. ............................................................................53
Figure 3-20: The parameters of a constant current discharge experiment of a
Zorflex/AZ91/artificial seawater cell are shown. All discharge tests were run for
three hours in the constant current discharge mode. This particular experiment
was run at 100 μA. .................................................................................................................54
Figure 4-1: The scanning electron micrographs of electrospun polystyrene after
the chemical vapor deposition of PEDOT are shown. The images show that the
liquid jet of polymer from the electrospinning procedure actually produced small
globs of material rather than a mat of fibers. .........................................................................56
Figure 4-2: The scanning electron micrographs of polypyrrole electrodes are
shown. The polypyrrole was deposited onto filter paper substrates via a chemical
vapor deposition. ....................................................................................................................57
Figure 4-3: The scanning electron micrographs of Zorflex double weave graphite
cloth show the material’s very high surface area. The individual graphite fibers
that make up the fabric have a diameter of about 10 microns. ..............................................58
Figure 4-4: The scanning electron micrographs of pressed powder graphite
samples are shown. There seem to be some artifacts on the material surface. In the
5000x image, it is possible to see the surface structure of the material. ................................59
Figure 4-5: The images show the scanning electron micrographs of a charcoal air
vent material that was used as a substrate material for many depositions. The
images depict the material’s high porosity and surface area. ................................................60
Figure 4-6: The scanning electron micrographs of ECO Fabric bamboo carbon
nanoparticle cloth which was used as a substrate material for many different
cathodes. The threads of the ECO fabric are about 15 microns thick are woven
into a high surface area cloth. ................................................................................................61
Figure 4-7: The graphs above represent the read voltage curves for each
candidate cathode material when that material is in a cell with a bulk magnesium
AZ91 anode and saturated sodium chloride electrolyte. All experiments were run
at ambient lab temperature. ....................................................................................................63

xi
Figure 4-8: The graphs above represent the read voltage curves for each
candidate cathode material when that material is in a cell with a bulk AZ91 anode
and artificial seawater electrolyte. All experiments were run at ambient lab
temperature. ...........................................................................................................................64
Figure 4-9: The exposed area of the bulk AZ91 anode experiences significant
pitting attack during the constant current discharge experiments. Longer tests and
higher currents lead to deeper pits on the surface of the metal. .............................................66
Figure 4-10: The first constant current discharge tests that were run were the
control tests. The cathode material in the control was once again bulk graphite.
The anode was bulk AZ91 and the electrolyte was saturated sodium chloride. All
tests were run at ambient lab temperature in a flat cell with a distance of 7 cm
between electrodes. Tests were run from 50 μA to 1000 μA. ...............................................67
Figure 4-11: This graph shows the series of constant current discharge tests with
the cell containing the bulk graphite plate control material as its cathode. The
anode was bulk magnesium AZ91 and the electrolyte was artificial seawater. All
tests were run at ambient lab temperature in a flat cell with a distance of 7 cm
between electrodes. ................................................................................................................68
Figure 4-12: The constant current discharge graphs of a cell with a Zorflex
cathode, AZ91 anode, and saturated NaCl electrolyte are shown. All tests were
run at ambient lab temperature in the flat cell with a distance of 7 cm between
anode and cathode. The Zorflex cathode performed significantly better than the
bulk graphite used in the control series of experiments as the cell was able to
withstand currents in the milliamp range. ..............................................................................70
Figure 4-13: The constant current discharge graphs of a cell with a Zorflex
cathode, bulk magnesium AZ91 anode, and artificial seawater electrolyte are
shown. All tests were run at ambient lab temperature in the flat cell with a
distance of 7 cm between anode and cathode. The Zorflex cathode performs
significantly better with the artificial seawater electrolyte than the bulk graphite
did in the control series of experiments. ................................................................................71
Figure 4-14: The constant current discharge curves of the graphite
foil/AZ91/saturated NaCl cell are shown. All tests were run at ambient lab
temperature in the flat cell with a distance of 7 cm between anode and cathode.
The low surface area of the cathode prevents the cell from maintaining a high
voltage even at currents as low as 200 μA. ............................................................................72
Figure 4-15: The constant current discharge curves of the graphite
foil/AZ91/ASW cell are shown. All tests were run at ambient lab temperature in
the flat cell with a distance of 7 cm between anode and cathode. The low surface

xii
area of the cathode prevents the cell from maintaining a high voltage even at
currents as low as 200 μA. .....................................................................................................73
Figure 4-16: The discharge curves of a cell with a cathode made from graphite
powder that has been pressed into a solid electrode. The anode is bulk AZ91 and
the electrolyte is saturated sodium chloride. All tests were run at ambient lab
temperature in the flat cell with a distance of 7 cm between anode and cathode. .................74
Figure 4-17: The discharge curves of a cell with a cathode made from graphite
powder that has been pressed into a solid electrode. The anode is bulk AZ91 and
the electrolyte is artificial seawater. All tests were run at ambient lab temperature
in the flat cell with a distance of 7 cm between anode and cathode. .....................................75
Figure 4-18: This graph is a comparison of each of the cells that were tested with
a constant current of 100 μA. .................................................................................................76
Figure 4-19: This graph is a comparison of each of the cells that were tested with
a constant current of 200 μA. .................................................................................................77
Figure 4-20: This graph is a comparison of each of the cells that were tested with
a constant current of 500 μA. .................................................................................................78
Figure 4-21: This graph is a comparison of each of the cells that were tested with
a constant current of 1000 μA. ...............................................................................................79
Figure 4-22: This graph is a comparison of each of the cells that were tested with
a constant current of 2000 μA. ...............................................................................................80
Figure 4-23: This graph is a comparison of each of the cells that were tested with
a constant current of 3000 μA. ...............................................................................................81
Figure 4-24: This graph is a comparison of each of the cells that were tested with
a constant current of 4000 μA. ...............................................................................................82
Figure 4-25: This graph shows the first 15 data points of two runs of a Nyquist
plot from a potentiostatic EIS experiment. AZ91 was the anode, bulk graphite was
the counter electrode and a saturated calomel electrode was the reference. The
solution resistance can be obtained as the point where the curve crosses the x axis
where Zimag is equal to 0. The solution resistance of saturated sodium chloride in
the flat cell is between 4 and 5 Ω. ..........................................................................................84
Figure 4-26: This graph shows the first 15 data points of two runs of a Nyquist
plot from a potentiostatic EIS experiment. AZ91 was the anode, bulk graphite was
the counter electrode and a saturated calomel electrode was the reference. The
solution resistance can be obtained as the point where the curve crosses the x axis

xiii
where Zimag is equal to 0. The solution resistance of artificial seawater is around
18 to 20 Ω. .............................................................................................................................85
Figure 4-27: The first minute of a constant current discharge experiment is
shown. It is the 100 μA discharge curve of the Zorflex/AZ91/saturated NaCl cell.
In the first 15 seconds of the experiment, the potential dips before stabilizing at
about 1.7 V. This is because of voltage delay caused because time is required to
disrupt the passive film on the surface of the AZ91 anode....................................................86
Figure B-1: The graphs from a read voltage experiment are shown. The cathode
was a bulk graphite plate, the anode was bulk magnesium AZ91, and the
electrolyte was saturated sodium chloride. The experiments were run at ambient
lab temperature in the flat cell with a distance of 7 cm between anode and
cathode. The cell voltage was between 1.65 and 1.70 V. ......................................................90
Figure B-2: The graphs from two runs of a read voltage experiment are shown.
The cathode was a bulk graphite plate, the anode was bulk magnesium AZ91, and
the electrolyte was artificial seawater. The experiments were run at ambient lab
temperature in the flat cell with a distance of 7 cm between anode and cathode.
The cell voltage was between 1.6 and 1.7 V..........................................................................90
Figure B-3: The graphs from two runs of a 12 hour read voltage experiment are
shown. The cell consisted of a PEDOT cathode that was vapor deposited onto a
filter paper substrate. The anode was bulk magnesium AZ91 and the electrolyte
was saturated sodium chloride. The experiments were run at ambient lab
temperature in the flat cell where the anode and cathode were separated by 7 cm.
The cell voltage was between 1.8 and 1.85 V........................................................................91
Figure B-4: The graphs from two runs of a 12 hour read voltage experiment are
shown. The cell consisted of a PEDOT cathode that was vapor deposited onto a
filter paper substrate. The anode was bulk magnesium AZ91 and the electrolyte
was artificial seawater. The experiments were run at ambient lab temperature in
the flat cell where the anode and cathode were separated by 7 cm. The cell voltage
was between 1.8 and 1.85 V. .................................................................................................91
Figure B-5: The graphs from two runs of a 12 hour read voltage experiment are
shown. The cell consisted of a PEDOT:PSS cathode on a filter paper substrate, a
bulk magnesium AZ91 anode, and a saturated sodium chloride electrolyte. The
experiments were run at ambient lab temperature in the flat cell where the anode
and cathode were separated by 7 cm. The cell voltage was between 1.0 and 1.2 V. .............92
Figure B-6: The graphs from two runs of a 12 hour read voltage experiment are
shown. The cell consisted of a PEDOT:PSS cathode that was on a filter paper
substrate. The anode was bulk AZ91 and the electrolyte was artificial seawater.
The experiments were run at ambient lab temperature in the flat cell where the
anode and cathode were separated by 7 cm. The cell voltage was between 0.9 and
1.1 V. ......................................................................................................................................92

xiv
Figure B-7: The graphs from two runs of a 12 hour read voltage experiment are
shown. The cell consisted of a polypyrrole cathode on a filter paper substrate, a
bulk AZ91 anode, and saturated sodium chloride electrolyte. The experiments
were run at ambient lab temperature in the flat cell where the anode and cathode
were separated by 7 cm. The cell voltage was between 1.9 and 2.0 V. .................................93
Figure B-8: The graphs from two runs of a 12 hour read voltage experiment are
shown. The cell consisted of a polypyrrole cathode on a filter paper substrate, a
bulk AZ91 anode, and artificial seawater electrolyte. The experiments were run at
ambient lab temperature in the flat cell where the anode and cathode were
separated by 7 cm. The cell voltage was between 1.85 and 1.9 V.........................................93
Figure B-9: The graphs from two runs of a 12 hour read voltage experiment are
shown. The cell consisted of a Zorflex double weave graphite fabric cathode, bulk
AZ91 anode, and saturated sodium chloride electrolyte. The experiments were run
at ambient lab temperature in the flat cell where the anode and cathode were
separated by 7 cm. The cell voltage was between 1.75 and 1.85 V.......................................94
Figure B-10: The graphs from two runs of a 12 hour read voltage experiment are
shown. The cell consisted of a Zorflex double weave graphite fabric cathode, bulk
AZ91 anode, and artificial seawater electrolyte. The experiments were run at
ambient lab temperature in the flat cell where the anode and cathode were
separated by 7 cm. The cell voltage was between 1.7 and 1.75 V.........................................94
Figure B-11: The graphs from two runs of a 12 hour read voltage experiment are
shown. The cell consisted of a graphite foil cathode, bulk AZ91 anode, and
saturated sodium chloride electrolyte. The experiments were run at ambient lab
temperature in the flat cell where the anode and cathode were separated by 7 cm.
The cell voltage was between 1.75 and 1.8 V........................................................................95
Figure B-12: The graphs from two runs of a 12 hour read voltage experiment are
shown. The cell consisted of a graphite foil cathode, bulk AZ91 anode, and
artificial seawater electrolyte. The experiments were run at ambient lab
temperature in the flat cell where the anode and cathode were separated by 7 cm.
The cell voltage was between 1.7 and 1.75 V........................................................................95
Figure B-13: The graphs from two runs of a 12 hour read voltage experiment are
shown. The cathode in this cell was Ted Pella colloidal graphite paint which was
painted onto an ECO Fabric bamboo carbon nanoparticle fabric substrate. The
anode was bulk AZ91 and the electrolyte was saturated sodium chloride. The
experiments were run at ambient lab temperature in the flat cell where the anode
and cathode were separated by 7 cm. The cell voltage was somewhat unstable but
remained between 1.65 and 1.8 V for the duration of the experiment. ..................................96
Figure B-14: The graphs from two runs of a 12 hour read voltage experiment are
shown. The cathode in this cell was Ted Pella colloidal graphite paint which was
painted onto an ECO Fabric bamboo carbon nanoparticle fabric substrate. The
anode was bulk AZ91 and the electrolyte was artificial seawater. The experiments

xv
were run at ambient lab temperature in the flat cell where the anode and cathode
were separated by 7 cm. The cell voltage was between 1.6 and 1.65 V. ...............................96
Figure B-15: The read voltage curves of a cell with a graphite ink cathode on a
filter paper substrate. The anode was bulk AZ91 and the electrolyte was saturated
sodium chloride. The experiments were run at ambient lab temperature in the flat
cell where the anode and cathode were separated by 7 cm. The cell voltage was
somewhat unstable but remained between 1.65 and 1.75 V. .................................................97
Figure B-16: The read voltage curves of a cell with a graphite ink cathode on a
filter paper substrate. The anode is AZ91 and the electrolyte is artificial seawater.
The experiments were run at ambient lab temperature in the flat cell where the
anode and cathode were separated by 7 cm. The cell voltage was between 1.68
and 1.75 V. .............................................................................................................................97
Figure B-17: The graphs from two runs of a 12 hour read voltage experiment are
shown. The cell consisted of a cathode made from pressed graphite powder, bulk
AZ91 anode, and saturated sodium chloride electrolyte. The experiments were run
at ambient lab temperature in the flat cell where the anode and cathode were
separated by 7 cm. The cell voltage was between 1.74 and 1.78 V.......................................98
Figure B-18: The graphs from two runs of a 12 hour read voltage experiment are
shown. The cell consisted of a cathode made from pressed graphite powder, bulk
AZ91 anode, and artificial seawater electrolyte. The experiments were run at
ambient lab temperature in the flat cell where the anode and cathode were
separated by 7 cm. The cell voltage was between 1.65 and 1.75 V.......................................98

xvi
List of Tables
Table 2-1: The advantages and disadvantages of magnesium batteries compared
to zinc-carbon LeClanché systems [Taken from Reference 29] ............................................17
Table 2-2: Properties of magnesium water-activated batteries with different
cathode materials [Taken from Reference 13] .......................................................................28
Table 3-1: List of all conducting polymer materials prepared for characterization
and electrochemical testing ....................................................................................................43
Table 3-2: List of all graphite materials prepared for characterization and
electrochemical testing...........................................................................................................43
Table 4-1: Summary of read voltage experiments for cells with each cathode
material ..................................................................................................................................65
Table C-1: Data points taken at the 30 minute, 1 hour, 2 hour, and three hour
mark in the constant current discharge graphs for the bulk
graphite/AZ91/saturated sodium chloride cell are shown. The data from two
replicate runs is shown where the run that is highlighted in boldface text is the one
represented in graphical form in the main body of the thesis. ...............................................99
Table C-2: Data points taken at the 30 minute, 1 hour, 2 hour, and three hour
mark in the constant current discharge graphs for the bulk graphite/AZ91/artificial
seawater cell are shown. The data from two replicate runs is shown where the run
that is highlighted in boldface text is the one represented in graphical form in the
main body of the thesis. .........................................................................................................99
Table C-3: Data points taken at the 30 minute, 1 hour, 2 hour, and three hour
mark in the constant current discharge graphs for the Zorflex/AZ91/saturated
sodium chloride cell are shown. The data from two replicate runs is shown where
the run that is highlighted in boldface text is the one represented in graphical form
in the main body of the thesis. ...............................................................................................100
Table C-4: Data points taken at the 30 minute, 1 hour, 2 hour, and three hour
mark in the constant current discharge graphs for the Zorflex/AZ91/artificial
seawater cell are shown. The data from two replicate runs is shown where the run
that is highlighted in boldface text is the one represented in graphical form in the
main body of the thesis. .........................................................................................................100
Table C-5: Data points taken at the 30 minute, 1 hour, 2 hour, and three hour
mark in the constant current discharge graphs for the graphite foil/AZ91/saturated
sodium chloride cell are shown. The data from two replicate runs is shown where
the run that is highlighted in boldface text is the one represented in graphical form
in the main body of the thesis. ...............................................................................................101

xvii
Table C-6: Data points taken at the 30 minute, 1 hour, 2 hour, and three hour
mark in the constant current discharge graphs for the graphite foil/AZ91/artificial
seawater cell are shown. The data from two replicate runs is shown where the run
that is highlighted in boldface text is the one represented in graphical form in the
main body of the thesis. .........................................................................................................101
Table C-7: Data points taken at the 30 minute, 1 hour, 2 hour, and three hour
mark in the constant current discharge graphs for the P/M
graphite/AZ91/saturated sodium chloride cell are shown. The data from two
replicate runs is shown where the run that is highlighted in boldface text is the one
represented in graphical form in the main body of the thesis. ...............................................101
Table C-8: Data points taken at the 30 minute, 1 hour, 2 hour, and three hour
mark in the constant current discharge graphs for the P/M graphite/AZ91/artificial
seawater cell are shown. The data from two replicate runs is shown where the run
that is highlighted in boldface text is the one represented in graphical form in the
main body of the thesis. .........................................................................................................102

xviii
Acknowledgements
First, I would like to thank my thesis advisor Dr. Barbara Shaw for helping me with my research
and academic goals. I also would like to thank Dr. Elizabeth Sikora for answering numerous
research-related questions and for her technical writing expertise. Both have shown great
patience and support while working with me as an undergraduate and graduate student.
I would also like to thank some of the other professors who worked with me on this research,
including Dr. Seong Kim and Dr. Mark Horn. I owe so much gratitude to the other students who
worked alongside me in the lab during the past few years. These include Anna Hartsock, Daniel
Cook, Anthony Naccarelli, Robert Gresh, Jordan Bingaman, Ian Rineer, Jon Steiner, Nick Chu,
Derek Wolfe, and Işin Dizvay.
I want to thank the Department of Engineering Science and Mechanics at Penn State and all of
the professors from the program that have assisted me during my Penn State career. It is also
very important that I thank the Naval Engineering Education Center (NEEC) for funding the
research being done in the corrosion lab. Without the NEEC, none of this research would be
possible.

1
Chapter 1: Introduction
1.1. Background
Battery technology has come a very long way since the Alessandro Volta’s invention of the
voltaic pile – the first battery capable of supplying continuous current to an external circuit – in
the year 1800. [1] Over the last 200 years, batteries have transformed from novelty items to
indispensable generators of power for a huge variety of applications. The average American
family has as many as 40-60 consumer batteries in and around the home at any particular time.
[2] Some of the most common uses for batteries today are:
Household: smoke detectors, telephones, doorbells, flashlights
Entertainment: portable televisions, toys, remote controls, gaming systems
Portable electronic devices: watches, cameras, MP3 players, cell phones, laptops
Health products: hearing aids, pacemakers, defibrillators
Automotive: car batteries
And many more. [2]
Batteries are firmly entrenched as the power source for such a wide array of technologies that it
is impossible to foresee the use of batteries declining any time soon. With the increased use of
portable electronics like cell phones, tablets, and laptops, the demand for battery power will only
increase. Considering that almost all batteries make use of large amounts of heavy metals and
toxic materials this is quite a frightening prospect. [3] Potentially hazardous materials often
found in batteries include mercury, lead, copper, zinc, cadmium, manganese, nickel, and lithium.
[4] The dumping of spent batteries containing these materials has raised concerns about soil
contamination and water pollution. In the past few decades the necessity for battery recycling
facilities has been realized, leading to legislative measures in Europe and North America. [3]
While battery recycling technology continues improving, perhaps a solution exists that
eliminates the need for battery recycling altogether. The reason that such dangerous materials are
used in battery fabrication is for increased performance. Creating a battery that uses no
hazardous materials that can perform at even a fraction of the current state-of-the-art would be a
great benefit to society.

2
1.2. Objectives
Developing a battery that “leaves no trace” is the larger project under which the research of this
thesis falls. The idea is to use nonhazardous materials that will dissolve away after the lifetime of
the battery is over. This concept could be used for many different applications including those
where a power source is required for some length of time in the body. The biodegradability of
the battery could limit the number of necessary surgeries for the patient.
The first choice that was made in the project was to use a magnesium alloy as the anode material
for the battery. Magnesium is non-toxic and is found naturally in the body already. Using
magnesium does limit some of the versatility that other batteries offer in that magnesium
batteries are typically single-use batteries since the magnesium will continue dissolving
regardless of whether the battery is being used or not. This is what led to the goal of developing a
magnesium reserve battery. In this reserve battery, the electrolyte is not added to the system until
the time of use, thus eliminating the problem of the magnesium dissolving before serving as the
anode of the cell.
This thesis centers on the development and characterization of various non-toxic, high surface
area cathode materials for an environmentally friendly magnesium reserve battery. Particular
focus is placed on graphitic materials and conductive polymers. In a battery, positive ions in the
electrolyte solution flow toward the cathode creating a positive current from the cathode to the
anode. A high surface area cathode means that more reactions can take place in the cell because
more of the electrode is exposed to the electrolyte. This allows for a higher current flow through
the cell.
The cathode material must be electrically conductive in order to conduct this current. While
graphite and conductive polymers are not as conductive as metals (by about two orders of
magnitude), they are many orders of magnitude more conductive than semiconductors such as
germanium and silicon. [5,6] In addition to conductivity, the cathode must display a high
working voltage so that a large potential difference exists between the cathode and the
magnesium anode. Magnesium and graphite are on complete opposite ends of the galvanic

3
series, meaning the potential difference between the two will be very high. This potential
difference is the driving force for current to flow and thus generate power.
In this thesis, different methods will be used to synthesize high surface area cathode materials.
These materials will be characterized using both optical and electron microscopy, and then will
be subjected to electrochemical testing to determine how they will perform as the positive
electrode in a battery. Using a full-cell test setup, the cathode materials can be paired with
magnesium and tested as a unit. This is different than typical electrochemical experiments that
can only test one electrode at a time.

4
Chapter 2: Literature Review
2.1. Batteries
A battery is defined as a device that converts chemical energy into electrical energy. Chemical
energy contained within the battery’s active materials is converted to electrical energy by way of
an oxidation-reduction (or redox) reaction. [7] Benjamin Franklin was the first to use the word
“battery” to describe electrical devices when he compared multiple Leyden jars (early electrical
capacitors) to a battery of cannons. Alessandro Volta, an Italian physicist, is credited with
developing the first electrochemical cell in 1792, and also inventing the first battery (or “voltaic
pile”) in 1800 (shown in Figure 2-1). [7,8]
Figure 2-1: A "voltaic pile," considered to be the first ever battery. It was invented in the year 1800 by
Alessandro Volta. [Taken from Reference 9]
Battery technology has improved significantly in the last 200 years, and is now a multibillion
dollar industry. [10] The average American family has as many as 40-60 consumer batteries in
and around the home at any particular time. [2] The convenience of batteries lies in the wide
range of sizes in which they can be manufactured or assembled into packs, their ability to supply
electrical power instantly, their portability (for smaller size batteries), and the option of single-
use or multiple use units. [8]

5
There are two broad categories into which batteries are classified: (1) primary batteries, which
can only be discharged one time before they are thrown away; (2) secondary or rechargeable
batteries, which can be recharged and used multiple times. [7,8]
Primary batteries are mostly confined to smaller sizes for the consumer market. They have been
around for well over 100 years. The earliest primary batteries were mostly zinc-carbon batteries,
which had a specific energy of less than 50 Wh/kg. The most common primary batteries today
are lithium batteries which have a specific energy of more than 400 Wh/kg. [7]
In rechargeable batteries, the electrochemical reactions are reversible. This allows the battery to
be charged and discharged for many cycles. The most common secondary batteries are lead-acid,
nickel-cadmium (Ni-Cd), nickel metal hydride (Ni-MH), lithium ion (Li-ion), and lithium ion
polymer (Li-ion polymer). [7]
Primary and secondary batteries are employed for many different uses:
Household: smoke detectors, telephones, door bells, flashlights
Entertainment: portable TVs, toys, remote controls
Portable electronic devices: watches, cameras, MP3 players, laptops, cellular phones
Health products: hearing aids, pacemakers
Automotive: car batteries
And many more. [2]
Because of the wide array of applications, batteries are built in many different shapes and
configurations – cylindrical, button, flat, and prismatic – and their components are designed
according to the particular shape of the battery. [7]
2.1.1. Principles of Battery Operation
The “cell” is the most basic electrochemical unit. The term “battery” is often misused when
referring to a single electrochemical cell. A battery consists of one or more of these
electrochemical cells, connected in series or parallel, or both, depending on the desired output
voltage and capacity. [7]

6
Figure 2-2: The two above images show the results of connecting cells in series or in parallel. The image
on the left shows how connecting four cells in series will result in an additive potential, while the image
on the right shows that connecting four cells in parallel will result in an additive current. [Taken from
Reference 10]
The above image shows two scenarios in which multiple cells are connected in different parallel
or serial configurations, resulting in two different systems. Connecting cells in parallel allows for
increased current flow, while connecting cells in series allows for higher potential. The desired
configuration of cells for every battery is unique to the application for which it will be used. [10]
The electrochemical cell consists of three major components:
1. The negative electrode (anode) – The anode gives up electrons to the external circuit and
is oxidized during the electrochemical reaction. (M → Mn+
+ ne-) Positive current flows
into the anode.
2. The positive electrode (cathode) – The cathode accepts electrons from the external circuit
and is reduced during the electrochemical reaction. (nX + ne- → nX
-) Positive current
flows out of the cathode.
3. The electrolyte – The electrolyte is an ionic conductor that provides the medium for the
transfer of charge inside the cell between the positive and negative electrodes.
Electrolytes are typically liquids, but some batteries use solid electrolytes. [7]
Optimal combinations of anode and cathode materials are those that are lightweight and give
high cell voltage and capacity. [7]
During the discharge of a cell, which is shown in the schematic below in Figure 2-3, the
electrons flow from the anode, which is oxidized, through the external load to the cathode, where

7
the electrons are accepted and the cathode material is reduced. The electrolyte completes the
electric circuit by allowing the flow of anions (negative ions) to the anode and cations (positive
ions) to the cathode [7]
Figure 2-3: The schematic shown above illustrates the discharge of a galvanic cell. [Taken from
Reference 7]
The potential of a battery is determined by the combination of the materials that are used to make
up the system. The anode, cathode, electrolyte, and the load are all variables that affect the
voltage that the battery will produce. A primary battery is essentially just a galvanic couple. A
galvanic couple is simply a system with two dissimilar metals that are electrically connected.
Figure 2-4 shows a galvanic series in flowing seawater at 25˚C, where the potential of each
material in the series is measured versus a reference electrode. In the case of the galvanic series
pictured below, the reference electrode being used is the saturated calomel electrode. [11]
Coupling a noble material like graphite or platinum with an active metal like zinc or magnesium
will create an electrochemical cell with a large potential. This potential difference will initiate a
flow of electrons that can be turned into electrical energy. This is the basic idea behind the
operation of batteries. [7]

8
Figure 2-4: The galvanic series ranks materials from most to least active in a particular environment. The
galvanic series above is for materials in flowing seawater at 25˚C. The potential is measured against a
saturated calomel reference electrode. [Taken from Reference 11]
The most basic of primary batteries can be assembled simply by having two dissimilar metals in
an electrolyte. However, all commercially available batteries are significantly more complex.
Battery technology, having been around for such a long time, is a very mature technology. The
batteries that are sold to consumers are highly engineered to be extremely efficient and can
generate large amounts of energy. [2]
Figure 2-5 is a diagram of the interior of the typical consumer battery. It shows not only the
anode and cathode, but also many of the other components that are needed to make the battery
work properly.
9
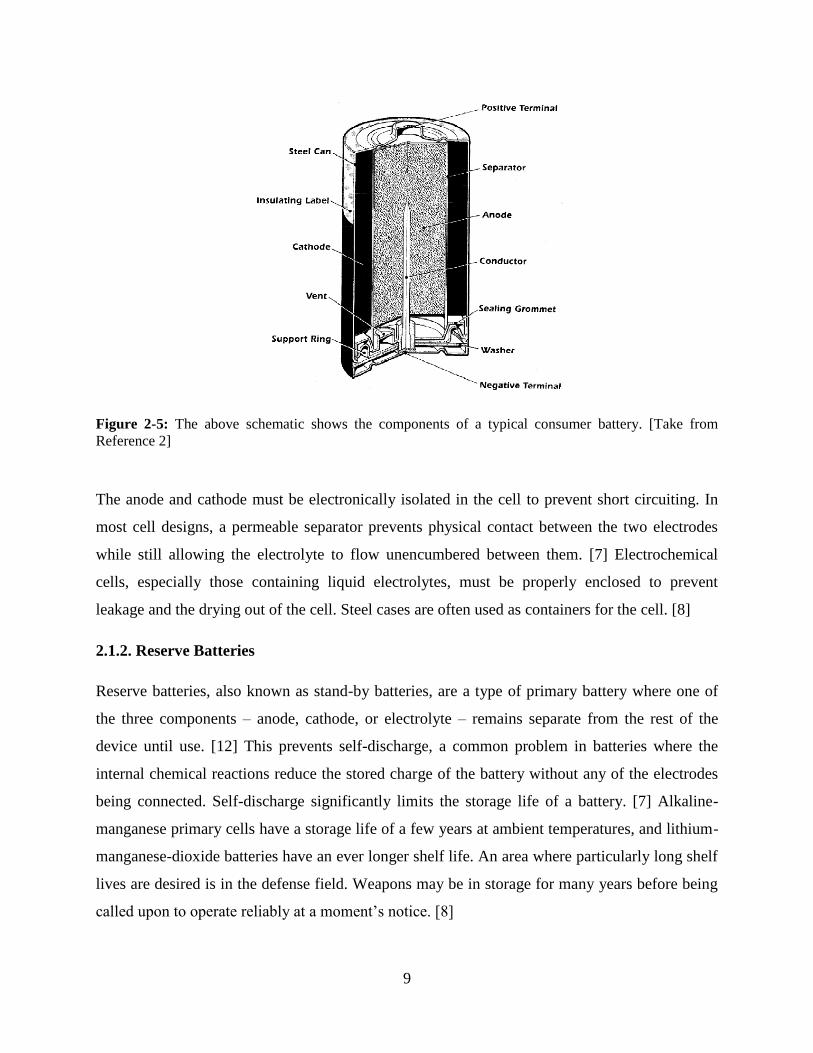
Figure 2-5: The above schematic shows the components of a typical consumer battery. [Take from
Reference 2]
The anode and cathode must be electronically isolated in the cell to prevent short circuiting. In
most cell designs, a permeable separator prevents physical contact between the two electrodes
while still allowing the electrolyte to flow unencumbered between them. [7] Electrochemical
cells, especially those containing liquid electrolytes, must be properly enclosed to prevent
leakage and the drying out of the cell. Steel cases are often used as containers for the cell. [8]
2.1.2. Reserve Batteries
Reserve batteries, also known as stand-by batteries, are a type of primary battery where one of
the three components – anode, cathode, or electrolyte – remains separate from the rest of the
device until use. [12] This prevents self-discharge, a common problem in batteries where the
internal chemical reactions reduce the stored charge of the battery without any of the electrodes
being connected. Self-discharge significantly limits the storage life of a battery. [7] Alkaline-
manganese primary cells have a storage life of a few years at ambient temperatures, and lithium-
manganese-dioxide batteries have an ever longer shelf life. An area where particularly long shelf
lives are desired is in the defense field. Weapons may be in storage for many years before being
called upon to operate reliably at a moment’s notice. [8]

10
Reserve batteries are uncommon for everyday consumer use because they can only be used one
time. Most consumer applications require a battery that can sporadically supply power for
extended periods of time. A reserve battery, once activated, does not have a significantly long
life and does not stop discharging. [12] Typical anode materials for reserve batteries include
zinc, magnesium, aluminum, and lithium (although lithium reserve batteries are still in the early
stages of development). [7]
A common reserve battery is the water-activated battery, which uses salt or fresh water to start
the generation of current flow. [13] There are also reserve battery systems that are activated
when a gas, such as oxygen, is introduced into the cell. The gas is typically the electrolyte in
these systems, but there are also examples of the gas being used as the positive electrode. Heat
activated batteries, or thermal batteries, have a solid salt electrolyte that when heated becomes
ionically conductive, thus activating the cell. [7]
Typical applications for reserve batteries are those that require the delivery of high power for
relatively short periods of time. [7] An example of a reserve battery being used in a domestic
application is the dry-charged lead-acid (car) battery in which a sulfuric acid electrolyte is not
added until the battery is sold. Another example is the zinc-air hearing aid battery. [13] As was
previously mentioned, reserve batteries are also ideal for certain military applications where long
storage life is of utmost importance. Missile and torpedo deployment are examples of situations
where great amounts of power are necessary after very long periods of inactivity. [7,8]
2.1.3. Disposal and Recycling of Batteries
Battery technology has considerably advanced throughout the years, but battery disposal and
recycling are areas where new ideas and technologies are required. [3] The potentially hazardous
components of batteries include mercury, lead, copper, zinc, cadmium, manganese, nickel,
lithium, and harmful chemical electrolytes. [4] While disposal services for many types of
batteries do exist, many are inconvenient or not highly publicized, leading most household
batteries to be simply thrown away with other household waste and then taken to landfills. This
allows for the harmful materials contained in batteries to leech into the soil and groundwater.
The manner in which batteries are disposed or recycled depends on the battery type. The most
common disposal process for the most common type of household battery, the alkaline battery, is

11
incineration. This process effectively removes tangible waste from the battery but results in the
release of harmful gases and chemical byproducts. [14]
Lead-acid automotive batteries are much more readily recycled than other battery types. Car
batteries account for almost all of the planet’s lead consumption, [15] and due to the toxicity of
lead, almost 90% of these batteries of recycled. [16] They are recycled by a grinding process
where the acid is neutralized and the polymers are separated from the lead. The recovered
materials are often used to make new batteries. [15]
Button cells are another variety of batteries more frequently recycled than typical household
batteries. [16] Button cells are usually single cell batteries used to power small portable
electronics like wristwatches and hearing aids. They are often recycled because of the value and
toxicity – they often contain mercury – of their chemicals. [16]
Almost all batteries, primary and secondary, can also be recycled. This includes alkaline, Ni-Cd,
Ni-MH, lithium, Li-ion, silver-oxide, and Ni-Zn batteries. Making recycling programs for these
battery systems more readily available to the public should be a major priority for the world’s
governments as battery usage continues to rise.
2.2. Battery Anodes
Oxidation takes place at the negative electrode, or anode, of the cell. The anode gives up
electrons to the external circuit and is oxidized during an electrochemical reaction. The anode is
also called the reducing or fuel electrode. [7] Anodes are designed with the following properties
in mind: efficiency as a reducing agent, high coulombic output (Ah/g), good conductivity,
stability, ease of fabrication, and low cost. [7]
2.2.1. Magnesium
Magnesium is the world’s lightest structural metal with a density of 1.74 g/cm3. It is also one of
the most abundant elements found in nature. [17,18] Seawater in particular is an almost
unlimited source of magnesium with an estimated 6 million tons per cubic mile according to a
study by DOW Chemical. [19] There are approximately 320 million cubic miles of seawater on
the planet. Magnesium and magnesium alloys are non-magnetic, have relatively high thermal and

12
electrical conductivity, and good vibration and shock absorption. [17,18,20] Magnesium presents
no toxicity hazard and can be shaped and worked by all known methods. [20]
2.2.1.1. Corrosion of Magnesium
A major issue regarding the use of magnesium and magnesium alloys for structural applications
is its corrosion behavior. In battery applications, however, the corrosion of the anode is what
provides the fuel to make the system work. Understanding the mechanisms of magnesium
corrosion is vital to understanding the operation of an electrochemical cell with a magnesium
electrode.
The corrosion resistance of magnesium is especially poor when the material contains specific
metal impurities (Fe, Ni, Cu,…) or is exposed to aggressive electrolyte species such as those
containing chloride (Cl-) ions. [18] Because of its poor corrosion resistance, magnesium is rarely
used in its unalloyed form. In engineering applications, magnesium is usually alloyed with one or
more elements (aluminum, manganese, rare earth metals, lithium, zinc, and zirconium). [19]
Magnesium has the lowest standard potential of all engineering materials, as is shown in Figure
2-6 below. Under standard conditions at 25˚C, magnesium (Mg2+
/Mg) has a standard electrode
potential of -2.37 Vnhe (with respect to a hydrogen reference) for bare magnesium metal in
contact with solution containing magnesium divalent ions. [21,22]

13
Figure 2-6: The electromotive force series shows the potential of reversible electrodes at standard state
with respect to a hydrogen reference. Magnesium has a standard electrode potential of -2.37 V. [Taken
from Reference 22]
The actual corrosion potential of magnesium is usually about -1.7 Vnhe in dilute chloride
solutions. The difference in potential between the theoretical standard potential and the actual
corrosion potential is due to the formation of a surface film of magnesium hydroxide (Mg(OH)2),
or perhaps magnesium oxide (MgO). [23,24] The film provides some protection over a wide pH
range. Figure 2-7 shows a theoretical potential-pH (Pourbaix) diagram for pure magnesium in
water. This diagram shows that the magnesium is thermodynamically favored to corrode in
almost all environments. In very basic solution, a passive film of Mg(OH)2 will protect the
surface from oxidizing. [25]

14
Figure 2-7: Pourbaix diagrams show the equilibrium phases for an aqueous electrochemical system. The
diagram above is for pure magnesium in water. It shows that magnesium is thermodynamically favored to
corrode in almost all environments. [Taken from Reference 25]
The Pourbaix diagram provides information on where corrosion is thermodynamically favorable;
it tells nothing about the corrosion mechanism or corrosion rate. And even at lower pH values,
the oxide film on the metal surface can offer some considerable corrosion prevention. [18] A
later thermodynamic study by Perrault concluded that no thermodynamic equilibrium could exist
for a magnesium electrode in contact with an aqueous solution. [26]
There is no material that exhibits high corrosion resistance in all types of environments. A
particular material may have a high resistance to corrosion in one environment but a low
corrosion resistance in another environment. There are fewer media that are suitable for
magnesium alloys compared to other materials. Typically, magnesium alloys will be stable in
basic solution, but will corrode rapidly in neutral and acidic solutions. [18]
In most cases, the corrosion of magnesium and magnesium alloys initiates from localized
corrosion, especially in immersed conditions. [18] They naturally undergo pitting corrosion at
the free corrosion potential (Ecorr) when exposed to chloride ions in a non-oxidizing medium. As

15
a result, the manner in which magnesium and its alloys corrode in neutral or alkaline solutions is
by pitting corrosion. [24]
Magnesium alloys are very highly vulnerable to galvanic corrosion since magnesium is anodic to
all other engineering metals. [17] Cathodes can be either external as other metals in contact with
the magnesium anode, or they could be internal as second or impurity phases. [18] Both of these
types of galvanic corrosion are shown in Figure 2-8.
Figure 2-8: The top schematic shows galvanic corrosion due to external contact with another metal. The
bottom schematic shows galvanic corrosion due to the presence of internal cathode. [Taken from
Reference 18]
The galvanic corrosion rate is increased by the following factors: high conductivity of the
medium, large potential difference between anode and cathode, low polarizability of anode and
cathode, large area ratio of cathode to anode, and small physical distance between anode and
cathode. [27] Galvanic corrosion on magnesium typically takes the form of pitting. [17,18]
The corrosion reaction of pure magnesium provides the basis for understanding not only the
corrosion of pure magnesium, but the corrosion of magnesium alloys as well. [18] In aqueous
environments, magnesium dissolution usually proceeds by an electrochemical reaction with

16
water to produce magnesium hydroxide and hydrogen gas. [18,23] The overall corrosion
reaction is:
Mg 2 2 → Mg( ) 2 2
The overall reaction can also be expressed as the sum of the partial reactions below:
Mg →Mg2 2e (anodic reaction)
2 2 2e → 2 2
(cathodic reaction)
Mg2 2 →Mg( )
2 (product formation)
While the overall corrosion reaction of magnesium alloys has yet to receive systematic study,
Song believes it is reasonable to expect that the corrosion mechanisms of magnesium alloys are
similar to those of pure magnesium. [28]
2.2.2. Magnesium Batteries
Magnesium and magnesium alloys are appealing candidates for use as negative electrode
materials in primary batteries for many reasons. They have a very high standard potential which
leads to a higher voltage battery system. [29] They are also lightweight and abundant. [17,18,29]
Table 2-1 below illustrates some of the advantages and disadvantages of magnesium batteries as
opposed to zinc-carbon and Leclanché batteries.
During the Vietnam War, magnesium batteries replaced Leclanché batteries (zinc-carbon
batteries where the electrolyte was manually added to the system) [7] for long shelf life
applications. [13] The magnesium batteries could be stored under higher temperature conditions
and also had twice the storage capacity of the Leclanché systems. [30]

17
Table 2-1: This table shows the advantages and disadvantages of magnesium batteries compared to zinc-
carbon and LeClanché systems. [Taken from Reference 29]
Magnesium alloys possess several characteristics that make them excellent candidates for anode
materials in seawater battery systems. These include rapid activation, high cell voltage, wide
voltage range, high power density capability, relatively low density, low electrode potential, and
long unactivated storage life. [31] Magnesium seawater activated batteries are a type of reserve
batteries used for applications such as sonobuoys, beacons, emergency equipment, balloon
batteries, and life jackets. [13,31]
Figure 2-9: An example of a magnesium water-activated battery [Taken from Reference 13]
In battery configurations, magnesium will act as the fuel electrode, providing electrons to the
system through oxidation. The magnesium will be a part of a galvanic couple, meaning that

18
galvanic corrosion is the mechanism requiring further investigation. Galvanic corrosion of
magnesium is detailed in Chapter 2.2.1.1.
Voltage delay is one of the major issues with magnesium batteries shown in Table 2-1. Voltage
delay in magnesium batteries is a direct consequence of the passive film present on the metal
surface. The delay occurs while the protective film on the surface of a passive metal (in this case
magnesium) becomes disrupted by the flow of current, exposing the bare metal to the electrolyte.
This results in the delayed action in the battery’s ability to deliver full output voltage after being
placed under load. [29] Figure 2-10 shows how voltage delay in magnesium batteries affects the
battery’s potential immediately after activation.
Figure 2-10: Voltage profile of magnesium primary battery at 20˚C [Taken from Reference 29]
Once the discharge of the cell has stopped, the passive film reforms on the magnesium surface,
but not nearly to its original protective state. This makes both magnesium and aluminum
batteries poor candidates for applications requiring the intermittent use of power. [33]
Figure 2-11 below show two different constructions of magnesium batteries. The standard
cylindrical construction shown on the left is similar to the cylindrical zinc-carbon battery. In this
design, the magnesium anode is also the external casing of the battery with the cathode being
contained inside. The inside-out design utilizes a carbon cathode current collector that is also the
container that holds the cell together. [29]

19
Figure 2-11: (Left) The cylindrical construction of a magnesium primary battery is shown. (Right) An
inside-out construction of a magnesium primary battery is shown. [Taken from Reference 29]
In all magnesium water-activated batteries – batteries where a liquid electrolyte is added at the
intended time of use – there are some other very important components besides just the anode
and cathode. Some of these components are briefly mentioned in Chapter 2.1.1.
Separators are nonconductive materials designed to prevent the short circuit of the cell by
physically separating the anode and cathode. [13] Woven fabrics or papers can be used as
separators in cells with liquid electrolytes. [34] Electrical connections, both between the different
cells internal to the battery as well as terminations, are important in battery design. Batteries
must be contained in a rigid encasement which has openings at each ends allowing for the entry
of the electrolyte and the emission of corrosion products. [13]
2.3. Battery Cathodes
The positive electrode of the electrochemical cell is where the reduction reaction takes place.
During the discharge of the cell, electrons flow from the anode to the cathode, meaning that
positive current flow from the cathode to the anode. [7] The cathode must be an effective
oxidizing agent, be stable when in contact with the electrolyte, and have a useful working
voltage. [7] The candidate cathode materials discussed in this are conductive polymers and
graphitic materials.

20
2.3.1. Conductive Polymers
Conductive polymers are organic polymers capable of conducting electricity. [35] Their
electrical properties can be tailored for the desired application using organic synthesis methods
[36] and advanced dispersion techniques. [37] The high conductivity is acquired due to the
incorporation of dopants into the matrix of the initial polyconjugated polymers. [38] The two
types of conducting polymers discussed in detail in this chapter are the nitrogen-containing
polypyrrole and the sulfur-containing poly(3,4-ethylenedioxythiophene) (PEDOT).
2.3.1.1. PEDOT
Poly(3,4-ethylenedioxythiophene) (PEDOT) is a conductive polymer based on the
ethylenedioxythiophene (EDOT) monomer. Some of the attractive properties of PEDOT (in its
conducting state) include high stability, moderate band gap (1.6-1.7 eV), and thermal stability of
its electrical properties compared with other thiophenes. [6] It is insoluble in many common
solvents and unstable in its neutral state, as it oxidizes quickly in air. Excellent electrochemical
activity and electronic conductivity is attainable with this material. [39] The chemical structure
of PEDOT is shown in Figure 2-12.
Figure 2-12: The chemical structure of the EDOT monomer is shown. The PEDOT polymer consists of
long chains of EDOT monomers. PEDOT is a sulfur-containing conducting polymer where the sulfur
atom is in the aromatic cycle.
PEDOT has been examined as a potential electrode for lithium/lithium-ion rechargeable
batteries. It has been studied as part of a composite material for the anode of the battery as well
as for the cathode. [39,40] Nanocomposites of PEDOT with silver nanoparticles [41] and aligned

21
carbon nanotube/PEDOT composites [39] have been examined as possible anode materials for
Li/Li-ion batteries. Composites of PEDOT with Poly[dithio-2,5-(1,3,4-thiadiazole)] (PDMcT)
[40] and lithium cobalt oxide (LiCoO2) [42] were evaluated as potential cathode materials.
In the study performed by Kiya, an organosulfur-composite cathode made with PDMcT and
PEDOT was tested to have an initial capacity of 205 mAh/g, which is very high, but this capacity
significantly decreased in subsequent charge/discharge tests due to dissolution of the reduction
products in the electrolyte. [40] The decrease in capacity after multiple cycles is unacceptable
for secondary batteries, but this problem is not of importance in reserve batteries, which are a
type of primary battery.
2.3.1.2. PEDOT:PSS
Because it is not easily produced, PEDOT is combined with a polyelectrolyte solution
(polystyrenesulfonate) to create a macromolecular salt called PEDOT:PSS. In this configuration,
PEDOT is in its oxidized state. [6] PEDOT:PSS has a much higher solubility than PEDOT by
itself. It also displays exceptionally high conductivity. [6] PSS has a much higher molecular
weight than PEDOT, and its role in the macromolecular salt is to act as a counter ion and keep
the PEDOT chain segments dispersed in an aqueous solution.
2.3.1.3. Polypyrrole
Polypyrrole is formed by the polymerization of the pyrrole monomer. Polypyrrole, like PEDOT,
is a conducting polymer. It has been used for various sensor applications including the sensing of
humidity, toxins, and even biomolecules. [43,44] It could also be used as a vehicle for drug
delivery, with the polymer matrix serving as a container for proteins. [45] The chemical structure
of polypyrrole is shown in Figure 2-13. Polypyrrole is part of the nitrogen-containing class of
conducting polymers, along with polyaniline.

22
Figure 2-13: The chemical structure of the pyrrole monomer is shown. The polypyrrole polymer consists
of long chains of pyrrole monomers. Polypyrrole is a nitrogen-containing conducting polymer where the
nitrogen atom is in the aromatic cycle.
Polypyrrole has been examined as a potential cathode material for an environmentally
responsible battery. Kong et al developed a magnesium/PPy battery for a biomedical application.
[46] The battery used polypyrrole doped with a biological polyelectrolyte as the cathode and a
magnesium alloy (AZ61) as the anode. The electrolyte used in the tested was phosphate buffered
saline (PBS), an electrolyte commonly used to simulate internal body fluids. With an exhibited
energy density of ~790 Wh/kg, they concluded that this system could be used to power
implantable devices requiring low power densities such as pacemakers or biomonitoring systems.
[46]
2.3.1.4. Electrospinning
Electrospinning is a process by which polymer nanofibers can be produced using an
electrostatically driven jet of polymer solution. It can be used to assemble fibrous polymer mats
ranging in thickness from several microns down to fibers with diameters less than 100 nm. [47]
Electrospinning is used for applications in several scientific areas, such as biomedicine,
filtration, electronics, sensors, catalysts, and composites. [48] Some of the unique properties of
nanofibers are their extraordinarily high surface area per unit mass, very high porosity, tunable
pore size, tunable surface properties, layer thinness, high permeability, low basic weight, ability
to retain electrostatic charges, and cost effectiveness. [49] Electrospinning could be used to
synthesize high surface area cathode materials for battery applications.

23
The setup for electrospinning consists of three major components: a high-voltage power supply,
a spinneret, and a collector (grounded conductor). A direct current (DC) power supply is
typically used although it is possible to use alternating current (AC) potentials. [49] A diagram
illustrating the electrospinning setup is shown below in Figure 2-14.
Figure 2-14: The electrospinning setup is shown. [Taken from Reference 49]
A high-voltage electrostatic field is used to charge the surface of a polymer-solution droplet,
which induces the ejection of a liquid jet through the spinneret. A charged jet of polymer
solution is ejected, which then solidifies into an electrically charged fiber through solvent
evaporation or cooling. [48,50]
The electric field is the most crucial parameter in electrospinning. It was observed through
experimentation that all regions are highly influenced by the applied and induced electric fields
which result in a considerable variation in the morphology of the nanofibers. [51] Recently,
researchers have identified the effect of the size of the fibers on the structural and mechanical
properties of the fibers. Fiber diameter is affected by the concentration of the polymer in the
solution, the type of solvent used, the conductivity of the solution, and the feeding rate of the
solution. The nature of the collector influences the morphological and physical characteristics of
the spun fibers. [52]
Electrospinning can also be used to create high surface area fibers for numerous applications. It
can be used to synthesize biocompatible thin films with a useful coating design and surface
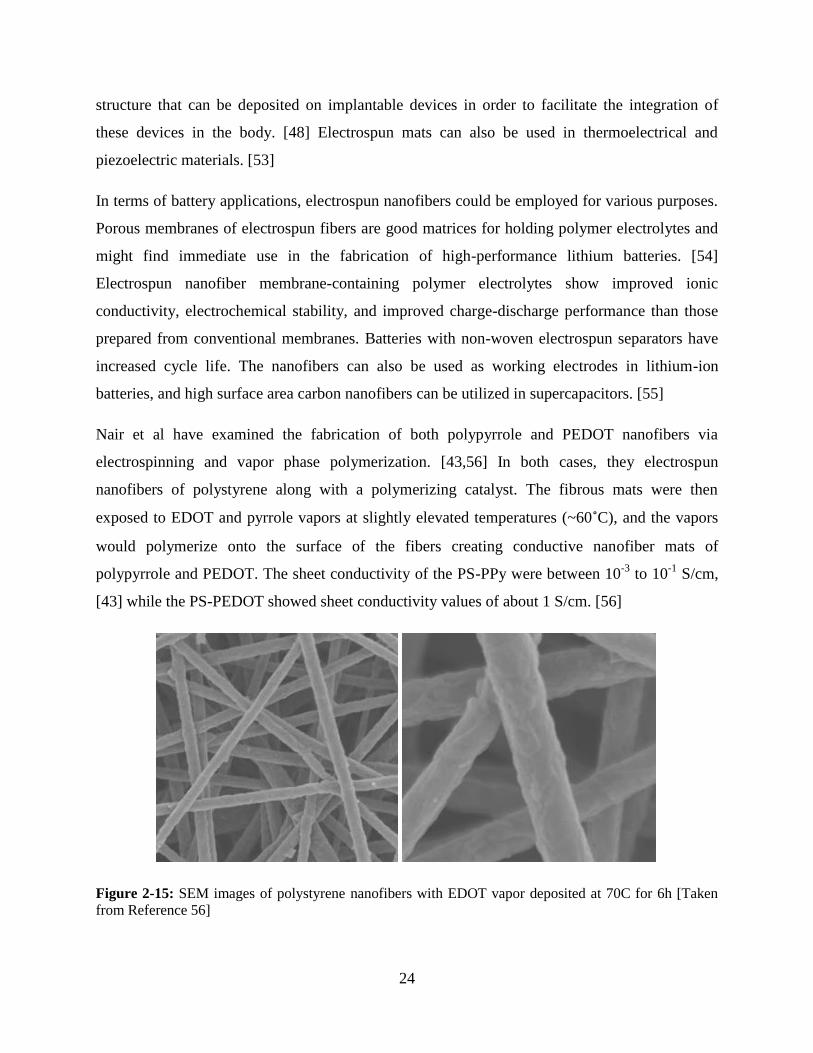
24
structure that can be deposited on implantable devices in order to facilitate the integration of
these devices in the body. [48] Electrospun mats can also be used in thermoelectrical and
piezoelectric materials. [53]
In terms of battery applications, electrospun nanofibers could be employed for various purposes.
Porous membranes of electrospun fibers are good matrices for holding polymer electrolytes and
might find immediate use in the fabrication of high-performance lithium batteries. [54]
Electrospun nanofiber membrane-containing polymer electrolytes show improved ionic
conductivity, electrochemical stability, and improved charge-discharge performance than those
prepared from conventional membranes. Batteries with non-woven electrospun separators have
increased cycle life. The nanofibers can also be used as working electrodes in lithium-ion
batteries, and high surface area carbon nanofibers can be utilized in supercapacitors. [55]
Nair et al have examined the fabrication of both polypyrrole and PEDOT nanofibers via
electrospinning and vapor phase polymerization. [43,56] In both cases, they electrospun
nanofibers of polystyrene along with a polymerizing catalyst. The fibrous mats were then
exposed to EDOT and pyrrole vapors at slightly elevated temperatures (~60˚C), and the vapors
would polymerize onto the surface of the fibers creating conductive nanofiber mats of
polypyrrole and PEDOT. The sheet conductivity of the PS-PPy were between 10-3
to 10-1
S/cm,
[43] while the PS-PEDOT showed sheet conductivity values of about 1 S/cm. [56]
Figure 2-15: SEM images of polystyrene nanofibers with EDOT vapor deposited at 70C for 6h [Taken
from Reference 56]

25
Typical electrospinning apparatuses yield nonwoven mats of fibers, but many developments have
been made in trying to control the deposition of the electrospinning jet to form more ordered
patters. Modifications to the standard setup can also allow for atypical nanofiber morphologies
such as hollow or coaxial nanofibers. [57]
2.3.2. Graphite
Graphite is a common allotrope of carbon and is in fact the most stable form of carbon under
standard conditions. It is one of three forms of crystalline carbon; the others being diamond and
fullerenes. [58] Unlike diamond, graphite is electronically conductive. This is due to the
graphite’s crystalline structure, which allows for electron delocalization. The valence electrons
are free to move around and thus conduct electricity. It is primarily conducted within the plane of
the layers.
As shown in Figure 2-16 below, graphite is composed of a series of stacked layer planes. In the
layer plane, each carbon atom is covalently (σ) bonded to three other carbon atoms to form a
series of continuous hexagons. The covalent bond is short in length (0.141 nm) and high strength
(524 kJ/mol). The hybridized fourth valence electron is paired with another delocalized electron
in an adjacent layer plane by a much weaker van der Waals (π) bond (7 kJ/mol). [5]

26
Figure 2-16: The crystal structure of graphite showing ABAB stacking sequence and the unit cell. The
diagram shows the spacing between electrons and layer planes. [Taken from Reference 5]
The stacking of the layer planes occurs in two slightly different ways: hexagonal and
rhombohedral. Each structure has different physical properties. Hexagonal stacking is far more
common and more stable than rhombohedral stacking. [5] These stacking sequences are
illustrated below in Figure 2-17. The hexagonal stacking sequence is also pictured above in
Figure 2-16.

27
Figure 2-17: The left image shows the hexagonal stacking sequence of graphite layer planes. The image
on the right shows the less common and more unstable rhombohedral stacking sequence of graphite layer
planes. [Taken from Reference 5]
Electrically, graphite can be considered as a “semi-metal,” meaning that it acts as a conductor in
the basal plane and as an insulator normal to the basal plane. In some cases, the electrical
resistivity of the material can be 10,000 times higher in the c direction than in the ab directions.
[59] Graphite’s often quoted resistivity values are 3000 10-6
Ω∙m in the c direction and 2.5-5.0
10-6
Ω∙m in the ab directions. [5]
Due to the weak van der Waals interactions between graphite layers, graphite is very fragile upon
the application of mechanical stresses. This mechanical weakness is a reason why electronic
applications of graphite hadn’t been studied in great detail in the last few decades. [60] To avoid
problems associated with mechanical weakness, but also the high preparation temperature of
graphite, thin film formation of graphite on solid substrates at low temperatures is a viable
option. Thin film formation of graphite via chemical vapor deposition (CVD) has been studied
during the past few decades. [61]

28
2.3.2.1. Graphite in Current Battery Technology
Graphite use in batteries has been increasing in the last few decades. Natural and synthetic
graphite are used to construct the anode of all major battery technologies. [62] This is due to its
conductivity (>100 S/cm), high mechanical strength, good chemical stability, low cost, and
availability. [63] These same characteristics, coupled with its high electrochemical potential,
make graphite a viable as a cathode material in batteries also.
The most common anode material in lithium-ion batteries is graphite. When the cell discharges,
the positive ion is extracted from the graphite anode and inserted into a lithium containing
cathode. During the charging process, the reverse reaction occurs.
2.3.3. Cathodes Used in Magnesium Reserve Systems
Magnesium is already being successfully used as a battery anode for reserve systems for various
specialty applications. Table 2-2 below shows some of the cathode materials already being used
in magnesium water-activated batteries and their characteristics. Some of the cathodes in the
table will be discussed in greater depth later in this section.
Table 2-2: The table below shows some of the properties of magnesium water-activated batteries with
different cathode materials. [Taken from Reference 13]

29
The open circuit voltage of all of the magnesium reserve battery systems is very high (1.5-1.7 V)
with the exception of the lead chloride/magnesium cell. The low open circuit potential of the
magnesium (-1.7 V vs. SCE) allows for higher voltage batteries than any other metal.
2.3.3.1. Silver Chloride Cathodes
The magnesium/silver chloride reserve battery was first developed by Bell Telephone
Laboratories to power electric torpedoes. The overall redox reaction for the magnesium/silver
chloride battery is [13]:
Mg 2AgCl→MgCl2 2Ag
The silver chloride cathode is used in magnesium reserve systems for many kinds of underwater
applications such as sonobuoys, lifebuoys, life rafts, and detection devices [64] to go along with
torpedoes. Activation of these batteries requires less than a second to deliver the full desired
power output. [65]
Figure 2-18: Mg/AgCl batteries [Taken from Reference 13]
Silver chloride has the highest energy density per unit weight and volume. [13] Table 2-2
illustrates the superiority of AgCl cathodes over other cathode materials in these two areas. AgCl
is also highly reliable for many strategic applications, which is why it is used despite its high
cost. [65]

30
2.3.3.2. Cuprous Chloride Cathodes
Magnesium/cuprous chloride systems are significantly less expensive than silver chloride
systems, but the performance of the battery suffers. [13] It is not physically or electronically
capable of powering electric torpedoes, but can be used as an inexpensive substitute for
magnesium/silver chloride systems for many other applications.
Besides decreased performance, another issue with using cuprous chloride cathodes in water-
activated magnesium reserve systems is the solubility of the copper ions. This solubility leads to
the corrosion of the magnesium anode as well as overheating. It is also an environmental hazard.
[66]
2.3.3.3. Manganese Dioxide Cathodes
Manganese dioxide (MnO2) is known as a non-toxic chemical [66] and has been studied for its
viability as a cathode material. [67] MnO2 is also inexpensive, practically insoluble, and
lightweight. [66] Figure 2-19 shows the discharge curves of 12 Mg/MnO2 cells connected in
series in different aqueous electrolytes.
Figure 2-19: The discharge curves of 12 Mg/MnO2 cells connected in series in various aqueous
electrolytes are shown. The discharge test was run at a constant current of 150 mA (10 mA/cm2). [Taken
from Reference 66]

31
When compared to the Mg/CuCl water-activated battery, the Mg/MnO2 water-activated battery
gives a slightly lower voltage, but the voltage is more stable. The two systems have very similar
capacities as well. The main difference between the two systems is the environmental impact, as
the Mg/MnO2 battery does not contain any heavy metal salts. Vuorilehto concludes that the
Mg/MnO2 battery can be used for all of the same applications as the Mg/CuCl battery while
being an environmentally friendly alternative.
Another common electrolyte used for these batteries is aqueous magnesium perchlorate which is
poured into the cell at the time of use. The electrolyte is absorbed into the separators within a
few seconds at above freezing conditions but the absorption requires more time in colder
temperatures due to the electrolyte’s viscosity. [68]
2.3.4. Thin Film Electrodes
Thin films are intriguing for battery technology because of the customizability of the features
that can be obtained. It is well known that the structure and properties of thin films of a material
are usually quite different from the respective bulk material. [69] Thin films allow for the
tailoring of materials to a specific purpose with characteristics that may be unattainable using
bulk samples. There is a continuous effort to engineer surface properties to enhance the life of
components under harsh environmental conditions where temperature, corrosion, and wear are
concerns. [70]
Thin films are often used for coating applications. The three main industrial coating techniques
(besides painting and electroplating) can be broadly classified into three categories: physical
vapor deposition (PVD), chemical vapor deposition (CVD), and spray processes. The choice of
technique is determined by the applications for the coating, its desired properties, financial cost,
production rate, substrate limitations, and process consistency. [70] In battery technology, the
ability to create high surface area electrodes that facilitate large currents is of great importance.
Magnesium thin films are of particular interest because it has been shown that depositing
magnesium films can greatly improve resistance to localized forms of corrosion. Schlüter found
that resistance to localized attack was significantly enhanced in thin film specimens because the
films do not contain any precipitates. Precipitates present in bulk samples enhance localized
corrosion. [71]

32
Chapter 3: Experimental Design and Methods
This study employed numerous techniques of fabricating, characterizing, and testing a variety of
candidate cathode materials for the reserve battery system. The two main candidates were
graphitic materials and conductive polymers. These materials, when coupled with a magnesium
anode, provide large cell voltages, are electronically conductive and are not hazardous to the
environment.
Some of the cathode materials were simply bought and then characterized and tested. Others
were fabricated using various synthesis techniques to try to tailor the material for the specific
application. The methods in which materials were constructed are explained in detail for each
material that was tested in this study. All candidate cathode materials were characterized using
optical microscopy and scanning electron microscopy to examine the surface of the materials.
The materials were then electrochemically tested using a Gamry Instruments Reference 3000
potentiostat, and the data from these tests were collected and analyzed using Gamry Instruments
software (Gamry Framework Version 6.10 and Gamry EChem Analyst Version 6.10).
3.1. Fabrication of Cathode Materials
In this thesis, conductive polymers, carbon materials, and combinations of both were synthesized
to be tested as cathode materials for a magnesium reserve battery. Various methods were used to
make the cathode samples and these methods are explained in detail in this section.
3.1.1. Conducting Polymers
Some of the simpler methods for generating conducting polymer electrodes were developed
through trial and error. The more complex methods, such as electrospinning and chemical vapor
deposition, were developed through a study of the literature. The key characteristics required of
the electrode materials were high conductivity and high surface area.
3.1.1.1. Direct Deposition onto a Substrate
Certain conducting polymers can be purchased in liquid form. One of the simplest methods of
creating a high surface area conducting polymer electrode is to directly deposit the liquid
conducting polymer onto an inert high surface area substrate. When the liquid polymer dries,

33
what is left is a porous material that now has a coat of conducting polymer. The preferred
substrate that was used for this process was glass fiber paper, because it is highly porous as well
as very chemically inert. The only conducting polymer that was able to be purchased in its
already conductive and polymerized form was PEDOT:PSS.
3.1.1.2. Chemical Vapor Deposition
The vapor deposition of the polymers onto various paper substrates was done by first coating the
substrates in the polymerizing catalyst iron (III) chloride (FeCl3). Next, the monomer (EDOT or
pyrrole) was dropped into a petri dish in close proximity but not in physical contact with the
substrates. After several hours, the monomer would interact with the catalyst, causing it to
polymerize on the surface of the substrate in a vapor deposition. This process is shown and
explained in Figure 3-1.
Figure 3-1: A timeline of the chemical vapor deposition process of polypyrrole is shown. The catalyst-
coated paper substrates are placed in a petri dish and drops of the monomer pyrrole are dropped around
the samples. (Left) The samples are covered and placed in an oven (~65˚C) where vapors of the monomer
start to polymerize on the surface of the samples. This is evidenced in the darker color. (Middle) After
several hours, the monomer is completely polymerized on the surface of the samples. The samples are
now coated in the conducting polymer polypyrrole. (Right)
The vapor deposition was done both at room temperature and at slightly elevated temperatures
(65˚C). The higher temperature depositions sped up the reaction. The polymerization process for
both PEDOT and polypyrrole only took about three hours at 65˚C while it took anywhere from
12 hours to 24 hours at room temperature. Other substrates made from carbon or carbon-based

34
materials were used as well. The deposition was done on charcoal air vents, woven graphite
cloth, and bamboo-based cloth.
3.1.1.3. Electrospinning
Fully assembled electrospinning setups can be purchased, but they are very expensive. They can
also be assembled fairly inexpensively which is what was done for this research study. The major
components in an electrospinning setup are shown below in Figure 3-2. Each of these
components had to be assembled to create a fully functioning electrospinning system.
Figure 3-2: The components of the electrospinning apparatus are shown. [Taken from Reference 72]
The spinneret was fabricated from a typical laboratory glass pipet. Because the opening at the
bottom of the pipet is far too large for the application of electrospinning, the pipet required
significant physical alteration. Figure 3-3 shows the process of elongating the pipet end using a
Meker-Fisher burner.

35
Figure 3-3: The process for fabricating the spinneret used in the electrospinning setup is shown.
The end of the pipet is drawn out until it is very thin and then is removed from the heat so that
the glass solidifies again. The stretched out end is then cut very precisely so the remaining
product is a pipet with a much smaller opening. The process is more of an art than it is a science.
Figure 3-4 shows an optical micrograph of one of these engineering electrospinning spinnerets
that was made using this technique.
Figure 3-4: Optical micrograph of an engineered electrospinning spinneret made from a glass pipet
In the electrospinning setup, the spinneret is held directly above the collecting substrate. The
collector used in this electrospinning setup was aluminum foil which was grounded to the outside

36
of a fume hood. The electrospinning process requires a very high voltage in order to force the
polymer solution out of the small opening at the bottom of the spinneret. The polymer solution
used was made by putting a mixture of polystyrene (M.W. 400,000) and iron (III) chloride into a
tetrahydrofuran (THF)-acetone-butanol solvent system. A stable high voltage power supply is
necessary to force this solution out of the spinneret. A 20 kV power supply from Gamma High
Voltage Research Inc. was used to supply the needed voltage. Figure 3-5 shows the
electrospinning setup during an actual run.
Figure 3-5: This image shows the electrospinning process in action. The electrospun product is deposited
on the glass slides below the spinneret.
The large potential difference between the grounded aluminum foil collector and the polymer
solution inside the spinneret force a jet of liquid through the opening at the bottom of the
spinneret. The liquid solidifies into fibers when exposed to the air and the fibers collect on the
glass slides sitting on top of the aluminum foil collector.
The thickness of the fibers is dependent upon the size of the opening of the spinneret, the
distance between the collector and the spinneret tip, the composition of the polymer solution, and
the applied potential. The diameter of the tip opening varied but all were only a few microns.

37
The tip was held at around 6 inches from the collector and the applied potential was between 10-
12 kV depending on how the jet of liquid came out from the spinneret.
3.1.2. Graphite Materials
The goal of the project initially was to develop a polymer cathode, but as the research evolved, it
became clear that looking at graphitic materials would be necessary, at least to make a
comparison. Graphite is electrically conductive, inexpensive, versatile, and has a high open
circuit potential (which is necessary for a large potential difference between anode and cathode).
Another intriguing prospect of using graphite is that a huge variety of conductive carbon
materials with high surface area are already available, making it possible to start characterizing
and testing the material immediately.
3.1.2.1. Graphite Foil
Graphite foil is available in many different varieties for many different applications. It is used as
a sealing material in harsh environments due to its ability to withstand high temperature and
pressure. It is also chemically inert and will not react with chemicals and corrosives. Because foil
is smooth by nature, it has a relatively low surface area. However, it is electronically conductive,
flexible, and is more mechanically robust than many of the other candidate electrodes (papers
and fabrics). The foil was electrochemically tested as a candidate material, but its main purpose
was to serve as a substrate material for higher surface area graphite materials.
Figure 3-6: Graphite foil
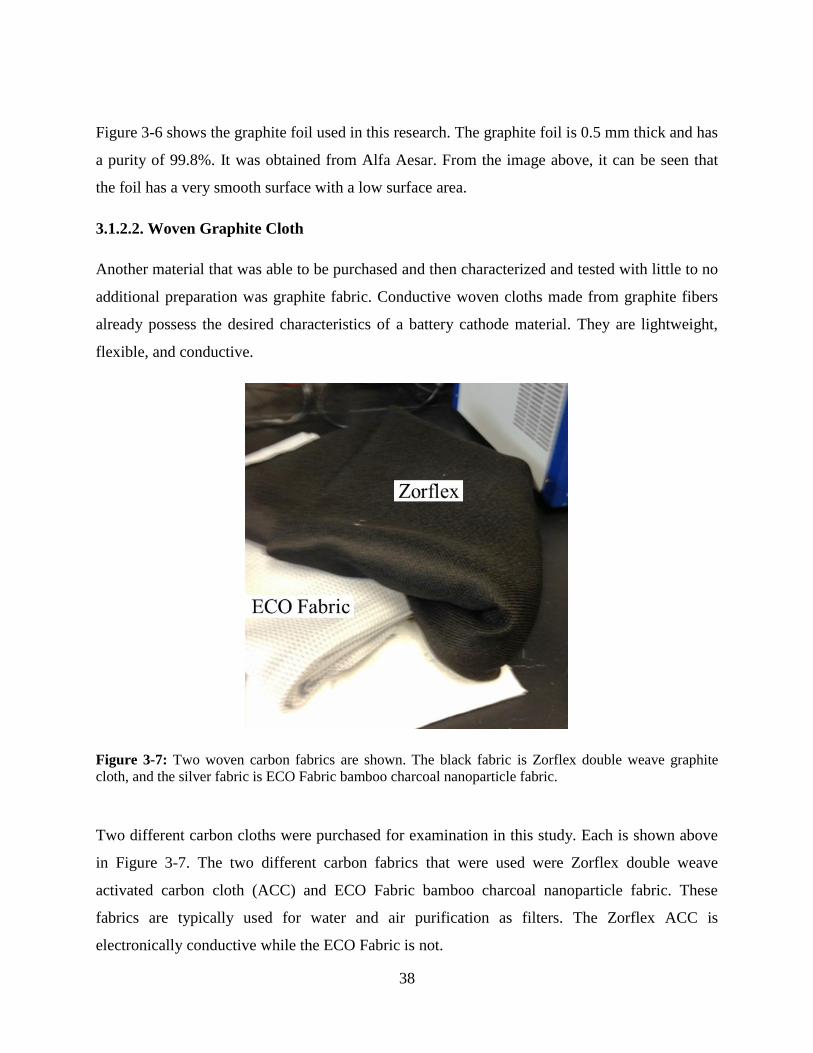
38
Figure 3-6 shows the graphite foil used in this research. The graphite foil is 0.5 mm thick and has
a purity of 99.8%. It was obtained from Alfa Aesar. From the image above, it can be seen that
the foil has a very smooth surface with a low surface area.
3.1.2.2. Woven Graphite Cloth
Another material that was able to be purchased and then characterized and tested with little to no
additional preparation was graphite fabric. Conductive woven cloths made from graphite fibers
already possess the desired characteristics of a battery cathode material. They are lightweight,
flexible, and conductive.
Figure 3-7: Two woven carbon fabrics are shown. The black fabric is Zorflex double weave graphite
cloth, and the silver fabric is ECO Fabric bamboo charcoal nanoparticle fabric.
Two different carbon cloths were purchased for examination in this study. Each is shown above
in Figure 3-7. The two different carbon fabrics that were used were Zorflex double weave
activated carbon cloth (ACC) and ECO Fabric bamboo charcoal nanoparticle fabric. These
fabrics are typically used for water and air purification as filters. The Zorflex ACC is
electronically conductive while the ECO Fabric is not.

39
Zorflex activated carbon fiber cloth has an extremely large surface area, and the double weave
has an even higher surface area, which is why it was purchased as a candidate cathode material.
The product description states that the material has a surface area of 1000-2000 m2/g. It also
mentions that the cloth is not a stand-alone product due to its poor mechanical strength and
suggests supporting the cloth with a more durable material.
The ECO Fabric bamboo charcoal nanoparticle fabric is a much less expensive material than the
Zorflex activated carbon cloth. It consists of entirely “green” materials including bamboo stalks
from the mountains of Taiwan. While the material is porous, it does not display nearly the
surface area of the Zorflex material, and it also is not electronically conductive. It does display
excellent durability, and is used in this study as a substrate material for conductive graphite
paints and inks.
3.1.2.3. Carbon Paint
Conductive carbon paint was deposited directly onto various substrates using a paintbrush. The
carbon paint that was used was colloidal graphite paint from Ted Pella Inc. This paint is typically
used to make electrical connections.
The paint that was used possesses various desirable properties including its excellent coverage of
woven materials, its adhesion to various substrates, its ability to air dry, environmentally friendly
(no ozone-depleting chemicals), and its high electrical conductivity. Figure 3-8 shows the Ted
Pella colloidal graphite paint.

40
Figure 3-8: Ted Pella colloidal graphite paint
Carbon paint was used for a variety of purposes in this study. It was deposited on various
substrates including ECO Fabric bamboo charcoal nanoparticle fabric, glass fiber paper, filter
paper, and graphite foil. It was also used as an adhesive to adhere the structurally weak Zorflex
activated carbon fiber cloth to the mechanically stronger graphite foil.
3.1.2.4. Carbon Ink
Conductive carbon ink was used to coat different substrates and then was tested as a cathode
material. To make the conductive ink, graphite powder, liquid tape, and toluene were mixed.
Using a recipe found online, three parts graphite powder, two parts liquid tape, and six parts
toluene are mixed to make the ink. This ink was then painted directly onto different substrate
materials and was then tested. Image 3-9 shows graphite ink being painted onto a glass fiber
paper substrate.
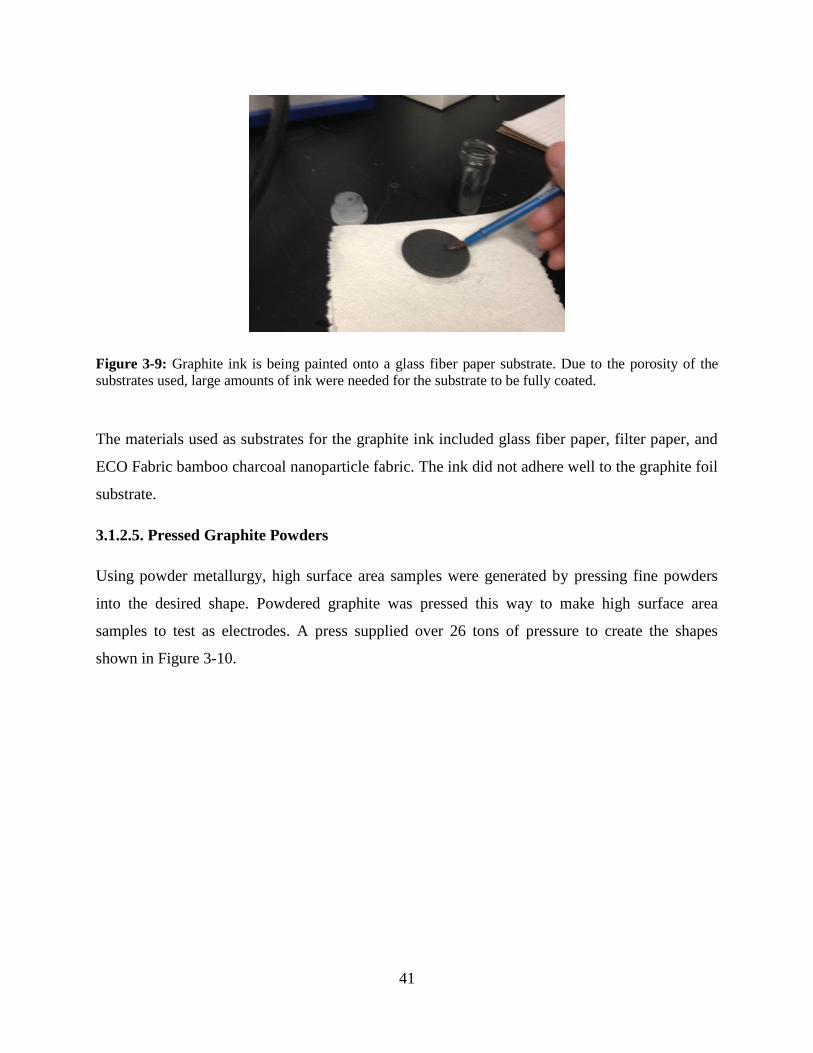
41
Figure 3-9: Graphite ink is being painted onto a glass fiber paper substrate. Due to the porosity of the
substrates used, large amounts of ink were needed for the substrate to be fully coated.
The materials used as substrates for the graphite ink included glass fiber paper, filter paper, and
ECO Fabric bamboo charcoal nanoparticle fabric. The ink did not adhere well to the graphite foil
substrate.
3.1.2.5. Pressed Graphite Powders
Using powder metallurgy, high surface area samples were generated by pressing fine powders
into the desired shape. Powdered graphite was pressed this way to make high surface area
samples to test as electrodes. A press supplied over 26 tons of pressure to create the shapes
shown in Figure 3-10.

42
Figure 3-10: This image shows the pressed powder graphite samples that were used for testing. Fine
graphite powder was pressed into this shape using over 26 tons of pressure.
The powder that was used was high purity graphite from Asbury Mills. Despite the high pressure
used to press the graphite powder together, graphite does not adhere to itself very well and the
samples were mechanically very weak. Using a wax binder to make a stronger product was
considered, but it would too greatly affect the electrical conductivity of the graphite.
3.1.3. Summary of Prepared Candidate Materials
In the two classes (conducting polymers, graphite materials) of materials tested as potential
cathode materials for the magnesium reserve battery, many different materials and synthesis
techniques were utilized. Section 3.1 of this chapter discusses each material individually, but
many combinations of materials and techniques were also utilized in order to maximize the
desirable characteristics of the materials. A list of all materials that were prepared for
characterization and electrochemical testing is included in this summary. Table 3-1 is a list of all
conducting polymers and Table 3-2 is a list of all graphite materials.

43
Table 3-1: List of all conducting polymer materials prepared for characterization and electrochemical
testing
Table 3-2: List of all graphite materials prepared for characterization and electrochemical testing
3.2. Characterization
Different characterization tests were used to determine some of the properties of the cathode
materials. Optical microscopy and scanning electron microscopy were used to get an up-close
look at the texture of the materials to get an idea of the surface area. Although the materials used
for the cathode need to be conductive, the samples were carbon coated prior to examination in
the SEM to ensure conductivity and to limit charging effects. The microscope that was used was
the Philips XL30 Environmental Scanning Electron Microscope (ESEM). This instrument allows

44
for a wide range of magnifications enabling the observation of micron-sized features in the
woven papers and cloths to nano-scale features of the fibers produced in electrospinning.
Figure 3-11: Philips XL 30 Environmental Scanning Electron Microscope
All of the images taken using the SEM were obtained with relatively low electron beam energy
(between 2 and 5 keV). Higher magnification and higher resolution are possible at higher beam
energies, but these high energies can also damage the samples.
3.3. Conductivity Testing
A key characteristic of battery electrodes is electrical conductivity. The electrode must be able to
allow for the flow of electrons through the circuit. Low electrode conductivity will provide
circuit resistance that lowers the available energy that the battery can provide. The energy that is
supposed to go to the external circuit will instead be dissipated in the electrode itself.
To quickly test the electrical conductivity of the samples, a continuity test was run using a digital
multimeter. This test is typically run to make sure two circuit elements are electrically connected,
but in this instance it was used to make sure the cathode samples were electronically conductive.
The multimeter will beep loudly if its leads are connected electronically (as they would be if both

45
were connected to a conductive material) and it will remain silent if the leads are not connected
electronically.
3.4. Electrochemical Testing
Electrochemical tests were performed on the different cathode materials to determine their
electrochemical properties. The purpose of this was to determine comparisons to known values
of other cathode materials and batteries that are currently being used. All electrochemical tests
were conducted using the Gamry Reference 3000 Potentiostat/Galvanostat/ZRA with data being
collected by Gamry Framework data acquisition software (Version 6.10). The data was then
analyzed using Gamry EChem Analyst software (Version 6.10). Figure 3-12 below shows two
different test setups utilized during the electrochemical experiments in this study.
Figure 3-12: Two different test setups were used depending on the materials being tested. On the left, the
beaker-cell setup is shown. The image on the right shows a flat cell setup. In the flat cell, the anode and
cathode are 7 cm apart. In the beaker cell test setup, an attempt was made to hold the electrodes 7 cm
apart as well.
The beaker-cell setup is used to test materials that are either too large or too small to fit in the flat
cell. Using the flat cells is greatly preferred because of the importance of anode-cathode area
ratios. The flat cell provides equal “apparent area” for each electrode. Also, the flat cell will have

46
the same distance between electrodes every time. While attempts were made to hold the
electrodes the same distance apart in the beaker cell, this distance could not be guaranteed as it is
in the flat cell setup.
3.4.1. Sample Preparation
Section 3.1 provided information about the fabrication of various cathode materials. However,
the preparation of samples (both anode and cathode) for electrochemical testing required for
additional provisions to be made.
In this thesis, all electrochemical tests were done using a bulk magnesium AZ91 alloy as the
anode material. Comparing cathode materials required for the magnesium alloy samples to be the
same for each experiment. The procedure for preparing the anode samples included a wet
sanding process to create a smooth polished surface that was the same each time. Figure 3-13
shows the wet sanding procedure.
Figure 3-13: To prepare the magnesium alloy samples used as the anode material during electrochemical
tests, a wet sanding process was used to ensure that the anode material would be consistent throughout all
experiments.
Once sanded, the magnesium alloy sample was thoroughly rinsed to dispose of any excess
particles leftover from the sanding process. When the sample was completely dry, electrical

47
connections were made to the sample using 3M copper electrical tape. Figure 3-14 shows a
magnesium anode sample with a copper tape electrical connection.
Figure 3-14: A magnesium alloy AZ91 anode sample with an electrical connection made from copper
tape is shown. While it would have been possible to connect the potentiostat leads directly to the
magnesium itself, the copper tape makes the connection much easier.
Cathode materials also required electrical connections to be made. The connections were also
made using the copper electrical tape. In many cases, the porosity of the cathode materials also
meant that provisions needed to be made to prevent the leaking of the electrolyte inside of the
flat cell. Figure 3-15 shows how this problem was combatted using a simple masking process.

48
Figure 3-15: A masked Zorflex fabric electrode is shown. The masking tape (3M electroplater’s tape)
prevented leaking of the electrolyte out of the cell. Again copper tape was used to make the electrical
connection.
The 3M electroplater’s tape pressed up against the O-ring of the flat cell sealing the porous
cathode materials and preventing any solution from leaking out of the cell. This masking
technique was used for the Zorflex fabric and all of the samples that used a fabric or a paper as
the substrate material.
3.4.2. Solution Preparation
A few different electrolyte solutions were used in this study. Each was prepared in the laboratory
by mixing solid chemical ingredients into solution. The consistency in electrolyte preparation is
extremely important because of how much a subtle change in pH or solution resistance can
impact the response of an electrochemical system.
The electrolytes that were used were saturated sodium chloride and artificial seawater. Artificial
seawater was chosen because many magnesium reserve batteries are “seawater-activated”
batteries, and saltwater is an electrolyte that can be found in nature so that the battery’s user may
not need to carry around a liquid electrolyte to add to the system. The choice to test with
saturated sodium chloride stemmed from the research of Penn State undergraduate student Jon

49
Steiner, who tested many different electrolytes for this project and determined saturated sodium
chloride to be the best candidate. [73] The solutions were carefully mixed with deionized water,
and then tested for their pH.
Figure 3-16: The setup for testing the solution pH of the tested electrolytes is shown.
The pH values for the as-mixed artificial seawater ranged from around 7.9-8.4, which is right
about where they should have been. The pH of sodium chloride should be exactly 7.0 because
the ions will not increase or decrease H+ or OH
- concentration. The measured values for pH of
these solutions were about 6.5-7.0.
3.4.3. Half-Cell Tests
When performing electrochemical tests in the half-cell format, only one of the electrodes (the
working electrode) is being examined with respect to the counter electrode, the reference
electrode, and the electrolyte. This is the standard setup for almost all corrosion experiments.
Figure 3-17 shows how the leads are connected in this setup.

50
Figure 3-17: The half-cell setup is shown. The counter (red) and counter sense (orange) leads are
connected to the counter electrode. The working (green) and working sense (blue) leads are connected to
the working electrode. The reference (white) lead is connected to the reference electrode.
The simplest electrochemical test is the open circuit potential. In this experiment, the potential
difference between the working electrode (in this case the cathode material) and a reference
electrode in measured. The reference electrode used in all experiments was the saturated calomel
electrode.
This configuration was used for potentiostatic electrochemical impedance spectroscopy (EIS)
experiments to determine the solution resistances of saturated sodium chloride and artificial
seawater.
3.4.4. Full-Cell Tests
The Gamry Reference 3000 potentiostat allows for the ability to conduct full cell experiments,
meaning an anode and cathode can be hooked up together and tested as a cell. The setup for full
cell experiments is shown in Figure 3-18.

51
Figure 3-18: The full cell test setup is shown. In the full cell setup, the lead connections are different
from the half-cell setup. The working and working sense leads are connected to the cathode, the counter
and reference leads are connected to the anode, and the ground and counter sense leads (not pictured) are
connected to each other.
In this setup, the working and working sense leads are connected to the positive electrode
(candidate cathode material) of the cell while the counter and reference leads are connected to
the negative electrode (magnesium anode material) of the cell. This is reasonable because the
potential difference is measured between the positive and negative electrodes of the cell rather
than with respect to an arbitrary reference. The counter sense lead and ground lead are also
connected to each other to ground the cell.
3.4.4.1. Read Voltage
The most simple full cell test is the read voltage experiment, which measures the potential
difference between the anode and cathode in whatever electrolyte is present. To test the various
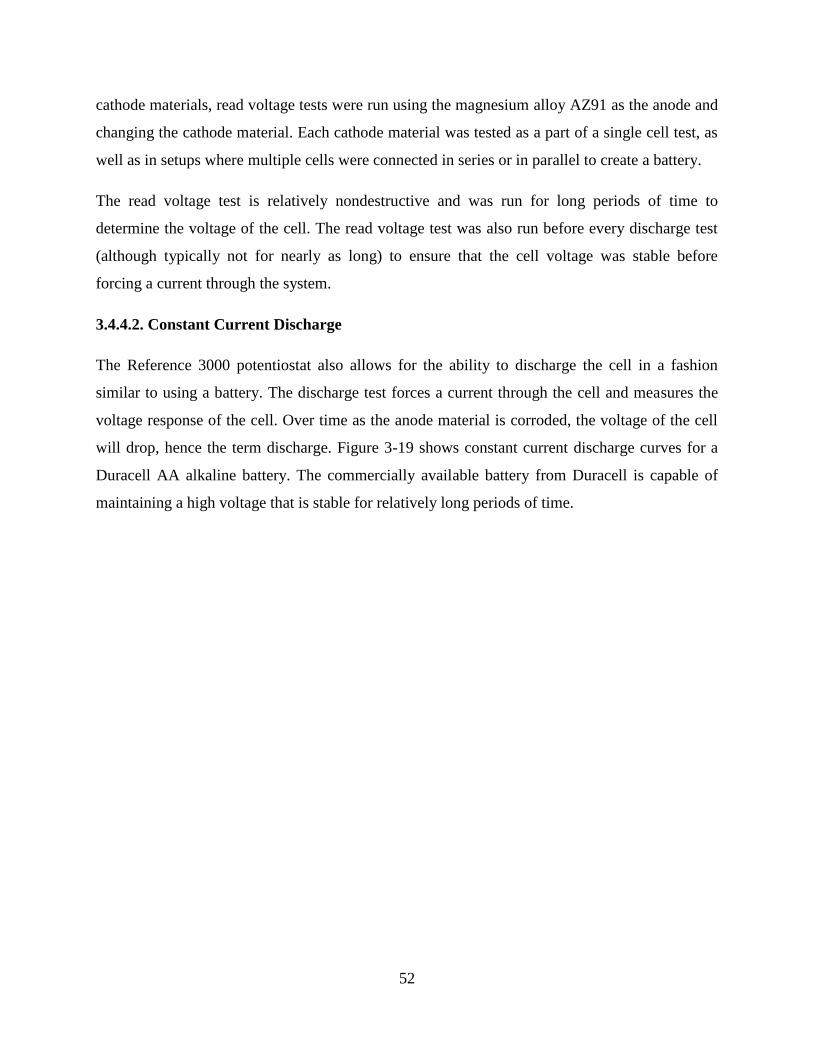
52
cathode materials, read voltage tests were run using the magnesium alloy AZ91 as the anode and
changing the cathode material. Each cathode material was tested as a part of a single cell test, as
well as in setups where multiple cells were connected in series or in parallel to create a battery.
The read voltage test is relatively nondestructive and was run for long periods of time to
determine the voltage of the cell. The read voltage test was also run before every discharge test
(although typically not for nearly as long) to ensure that the cell voltage was stable before
forcing a current through the system.
3.4.4.2. Constant Current Discharge
The Reference 3000 potentiostat also allows for the ability to discharge the cell in a fashion
similar to using a battery. The discharge test forces a current through the cell and measures the
voltage response of the cell. Over time as the anode material is corroded, the voltage of the cell
will drop, hence the term discharge. Figure 3-19 shows constant current discharge curves for a
Duracell AA alkaline battery. The commercially available battery from Duracell is capable of
maintaining a high voltage that is stable for relatively long periods of time.

53
Figure 3-19: The constant current discharge curves for a Duracell AA alkaline battery are shown. The
time axis is on a log scale. The battery displays a very stable voltage for pretty long periods of time. This
is an example of the discharge tests that are run in this study.
The first round of discharge testing was a control test using bulk magnesium AZ91 as the anode
and bulk graphite as the cathode. The bulk graphite is the standard to which subsequent cathode
materials are compared. The discharge tests are run first at low currents and the current is then
increased in later tests until the cell shows it can no longer handle any more current without its
potential immediately dropping below usable values. If the potential dropped below 0.8 V during
the discharge experiment, discharge experiments were not continued at higher currents because a
cell providing a voltage this low is unsuitable for battery applications. Figure 3-20 shows the
parameters that were entered for one of the discharge experiments.
0.00
0.20
0.40
0.60
0.80
1.00
1.20
1.40
1.60
1.80
1 10 100 1000 10000 100000
Vo
ltag
e (
V)
Time (s)
Discharge of AA Duracell Alkaline Battery (log time scale)
100 mA
150 mA
250 mA
500 mA
1000 mA

54
Figure 3-20: The parameters of a constant current discharge experiment of a Zorflex/AZ91/artificial
seawater cell are shown. All discharge tests were run for three hours in the constant current discharge
mode. This particular experiment was run at 100 μA.
The actual cells that were tested varied due to the different cathodes and electrolytes that were
used, but the only parameter on the screen shown in Figure 3-20 that changed was the discharge
current. All discharge experiments were run for three hours in the constant current discharge
mode. Also, the cell type was full cell meaning the cell was set up in the configuration shown in
Figure 3-18. The working connection was selected as positive because the cathode of the cell
was connected to the working and working sense cell leads. In the experiment shown above, the
Zorflex/AZ91/artificial seawater cell is tested at a constant current of 100 μA.

55
Chapter 4: Results and Discussion
4.1. Characterization
Many candidate materials were examined in the course of this study. Optical and scanning
electron microscopy helped to determine the relative porosity and surface area of the candidate
cathodes. In this section, micrographs of the cathode materials are shown.
4.1.1. Surface Morphology
The most important reason for examining the surface of the candidate cathode materials under
the microscope is to observe the surface area. It becomes possible to see highly magnified views
of the surface and thus make determinations about the relative surface areas of the materials
being viewed. The images in this section were taken using a Philips XL 30 Environmental
Scanning Electron Microscope. For each material, images were taken at low magnification to
illustrate the overall structure of the material. Then, higher magnification images were taken to
show the microstructure of the surface of the material.
4.1.1.1. Conducting Polymers
The conducting polymers PEDOT and polypyrrole were deposited via a few different methods as
was discussed in Section 3.1.1. None of these conducting polymers were stand-alone materials
and each had to be deposited onto a substrate material.
The most complex method for fabricating a conducting polymer cathode was the combination of
creating a high surface area mat of polystyrene via electrospinning and then depositing the
conducting polymer (PEDOT or polystyrene) via chemical vapor deposition on top of the
polystyrene mat. This method was the most difficult and time consuming. Figure 4-1 shows
scanning electron micrographs of the product of these processes.

56
Figure 4-1: The scanning electron micrographs of electrospun PEDOT shows that the liquid jet of
polymer from the electrospinning procedure actually produced small globs of material rather than a mat
of fibers.
Rather than the expected mats of nanofibers (Figure 2-15), the product of the electrospinning
process was small globs of fibers. Many different factors could have contributed to the
unexpected product, but it was most likely due to the tip geometry of the spinneret. It is likely
that the images above represent the result of an “electrospraying” rather than electrospinning.
Because of the nature of the application, all that was really desired from the process was a high
surface area conducting polymer, which was still achieved. The major issue was that only very
small amounts of conducting polymers could be generated through these methods. Not nearly
enough electrospun product was produced to even make an attempt at electrochemical testing.
With more sophisticated electrospinning equipment, this process can be made much easier and is
less time consuming.

57
Conducting polymers were also deposited onto filter paper substrates, with the idea being to coat
an already high surface area material with the conducting polymer to create a high surface area
electrode. Figure 4-2 shows the scanning electron micrographs of a filter paper substrate after the
deposition of the conducting polymer polypyrrole.
Figure 4-2: The scanning electron micrographs of polypyrrole electrodes are shown. The polypyrrole was
deposited onto filter paper substrates via a chemical vapor deposition. The top left image is at low
magnification showing the woven fibers of the filter paper, while the other three micrographs show the
surface of individual fibers.
The tangled fibers of the paper make for a very high surface area. The average width of the paper
fibers is about 15 to 20 μm. While the surface area is definitely not as high as it would be for a
mat of electrospun fibers, it is still a very high surface area electrode with a much easier
fabrication process.

58
4.1.1.2. Graphite Materials
Unlike the conducting polymers which all needed to be deposited onto a substrate of a different
material, many of the graphite materials that were tested could stand alone as an electrode.
Figure 4-3 shows the scanning electron micrographs of Zorflex double weave graphite fiber
cloth.
Figure 4-3: Scanning electron micrographs of Zorflex double weave graphite cloth show the material's
very high surface area. The structure of the fabric can be seen in the two lower magnification images on
top. The images on the bottom were taken at higher magnification and indicate that the individual
graphite fibers are about 10 μm thick.
These SEM images provide a nice representation of the structure of the cloth’s weave and the
actual surface area of the material. The low magnification images show how the fibers fit
together to make up the cloth while the higher magnification images give an idea of how thick
the individual fibers are. Because the cloth is double woven, the material has a higher density of

59
fibers which increases the surface area of the material while also providing some better strength.
The fibers in this material are about 10 μm thick.
Graphite electrodes were also made using a powder metallurgy process. Fine graphite powder,
which is actually often used to lubricate the presses, was subjected to very large amounts of
pressure which forced the powder into a solid shape. This procedure is explained in the Section
3.1.2.5 of the Experimental Chapter. Figure 4-4 shows the scanning electron micrographs of the
surface of the pressed powder graphite samples.
Figure 4-4: The scanning electron micrographs of pressed powder graphite samples are shown. There
seem to be some surface artifacts on the material surface. In the 5000x image, it is possible to see the
surface structure of the material.
There seem to be artifacts on the surface of the material, although it is uncertain what these
artifacts could be. The highest magnification image provides the best idea of how the surface of
the material actually looks. The flat scale-like surface structure definitely looks like graphite.

60
However, the images do not seem to show that the material has a very high surface area as was
expected using the powder metallurgy process.
Many of the graphite materials tested could not stand alone as an electrode material and were
deposited onto carbon-based substrate materials. The substrates were chosen for their high
surface area and the thought that the organic carbon-based substrates would not interact with and
change the properties of the conductive graphite that would then be deposited on the surface.
Figure 4-5 shows scanning electron micrographs of a charcoal air vent. The charcoal air vent is
purposefully designed to have high porosity and a high surface area.
Figure 4-5: Scanning electron micrographs of a charcoal air vent material that was used as a substrate
material for many depositions. The top left image shows the porous structure of the air vent at low
magnification. The other two images show the textured surface of the fibers that make up that porous
structure.

61
The SEM images of charcoal air vent show that the fibers of the air vent vary in thickness, but
have a textured surface which increases the surface area. The drawback to the charcoal air vent is
the low density of fibers. When compared to the SEM images of some of the other substrates, the
charcoal air vent has only a fraction of the number of fibers, which greatly decreases the surface
area of the material.
Figure 4-6 shows the scanning electron micrographs of ECO Fabric bamboo carbon nanoparticle
cloth. This carbon-based cloth is very mechanically stable and the SEM images show that the
woven fibers provide a nice amount of surface area for the deposition of conductive graphite.
Figure 4-6: Scanning electron micrographs of ECO Fabric bamboo carbon nanoparticle cloth which was
used as a substrate material for many different cathodes. The two images on top show the structure of the
woven fabric. The bottom image shows individual threads at higher magnification. The threads of the
EC fabric are about 15 μm thick.

62
The images of the ECO Fabric indicate the individual fibers of the material have a thickness of
about 15 μm. The amount of fibers in the cloth is also significantly more than that of the charcoal
air vent meaning the ECO Fabric cloth has a higher surface area.
4.2. Electrochemical Testing
The viability of each candidate cathode material ultimately depended on its performance while
connected as the positive electrode in an electrochemical cell. The tests used for determining
each material’s potential as a cathode were the open circuit potential of the cathode material, the
read voltage potential of the full cell with a magnesium alloy AZ91 anode connected to each
cathode material, and the constant current discharge of the full cell. These experiments are
explained in detail in Section 3.4. The results of these tests are presented here.
4.2.1. Read Voltage Experiments
Each cathode was connected in the full cell arrangement with magnesium alloy AZ91 as the
anode. Both saturated sodium chloride and artificial seawater were used as electrolytes. For each
experiment, two replicate runs of the test were completed. The read voltage test provides the
potential difference between anode and cathode in an electrolyte solution. This potential is the
driving force that eventually creates electrical power in a battery.
This section of the thesis contains a summary of all of the read voltage experiments that were
run, but does not show every single experiment. The complete collection of read voltage data can
be found in Appendix B.
Figure 4-7 shows a single run of a 12 hour read voltage test for each cell that was tested with the
saturated sodium chloride electrolyte. Each test was run at ambient lab temperature with the
potentiostat taking a new data point every five seconds.

63
Figure 4-7: The graphs above represent the read voltage curves for each candidate cathode material when
that material is in a cell with a bulk magnesium AZ91 anode and saturated sodium chloride electrolyte.
All experiments were run at ambient lab temperature.
Each of the candidate materials with the exception of PEDOT:PSS provides a cell voltage greater
than the control material of bulk graphite. The two highest cell voltages were observed in cells
with conducting polymer cathodes. The PEDOT and polypyrrole cells both provided cell
voltages higher than 1.8 V. The graphite materials – Zorflex, graphite foil, and pressed powder
graphite – each display stable cell voltages between 1.7 and 1.8 V. The control cell that used
bulk graphite as the cathode material had a cell voltage between 1.65 and 1.7 V.
Figure 4-8 depicts the exact same experiment as Figure 4-7 with one major difference. The
electrolyte used for the read voltage tests in Figure 4-8 was artificial seawater rather than
saturated sodium chloride. Once again, all experiments were run at ambient lab temperature with
the potentiostat taking a new data point every five seconds for the duration of the 12 hour
experiments.

64
Figure 4-8: The graphs above represent the read voltage curves for each candidate cathode material when
that material is in a cell with a bulk AZ91 anode and artificial seawater electrolyte. All experiments were
run at ambient lab temperature.
Once again, the cells with conducting polymer cathodes made of PEDOT and polypyrrole had
the highest cell voltage. Both maintained a stable cell voltage above 1.8 V for the entire length of
the experiment. PEDOT:PSS again exhibits by far the lowest potential of the candidate materials
with cell voltages between 0.9 and 1.1 V.
In the artificial seawater electrolyte, the cells with graphite cathodes tended to display slightly
lower cell voltages than they did in saturated sodium chloride. Cells with Zorflex, graphite foil,
and pressed powder graphite cathodes all had higher cell voltages than the bulk graphite plate
used as the control material. The graphite paint cathode had a slightly lower cell voltage than the
control, but all of the graphite materials still had a voltage between 1.6 and 1.75 V.
The results of all of the read voltage experiments are summarized even more succinctly in Table
4-1. The table gives the range of cell voltages for each cathode material in both saturated sodium
chloride and artificial seawater electrolytes.

65
Table 4-1: This table summarizes all of the read voltage experiments by showing the range of cell
voltages for each cell that was tested. All tests were run with a magnesium AZ91 anode at ambient lab
temperature. The table shows the range of cell voltages for cells containing each cathode material in both
saturated sodium chloride and artificial seawater electrolytes.
At the conclusion of the read voltage experiments, it seemed as though all of the candidate
materials except PEDOT:PSS would be viable options for the cathode of the magnesium reserve
battery. The conducting polymers polypyrrole and PEDOT were especially promising
considering the observed cell voltages between 1.8 and 2.0 V when coupled with the magnesium
AZ91 anode in either electrolyte.
4.2.2. Constant Current Discharge Tests
The running time for the constant current discharge tests varied based on the materials being
tested and the current flowing through the cell. Because the anode material is a bulk magnesium
alloy, it was not possible to run the discharge tests where the anode could completely dissolve.
Magnesium thin film anodes are currently being synthesized and evaluated in conjunction with
this research but the two electrodes were not able to be tested together. This prevents the ability
to determine the battery’s capacity using the discharge test. ow the corrosion of the thin film
magnesium anode will occur also cannot be determined from these tests. It may in fact be
considerably different than how the bulk material corrodes during the discharge experiments.
Figure 4-9 shows an area of a bulk AZ91 anode after a constant current discharge test.

66
Figure 4-9: The exposed area of the bulk AZ91 anode experiences significant pitting attack during the
constant current discharge experiments. Longer tests and higher currents lead to deeper pits on the surface
of the metal.
The above image shows the pitting attack that the anode experiences during the experiment. This
was to be expected as galvanic corrosion of magnesium generally results in pitting. Higher
currents and longer tests produced deeper and more prevalent pits on the surface of the
magnesium alloy. It will be interesting to see in the future how the degradation of the structured
thin film magnesium anodes will occur.
Each curve represents a single run at a certain current. Two replicate runs were completed at
each current, but only one run is shown in the figures in this section. All of the data for both runs
of all experiments are accessible in Appendix C.
4.2.2.1. Control Tests
All candidate materials are compared to the control test series with bulk graphite being used as
the cathode material. The data from these tests is presented in this section. In Figure 4-10, a
series of constant current discharge tests for a bulk graphite/AZ91/saturated NaCl cell are shown.

67
Figure 4-10: The first constant current discharge tests that were run were the control tests. The cathode
material in the control was once again bulk graphite. The anode was bulk AZ91 and the electrolyte was
saturated sodium chloride. All tests were run at ambient lab temperature in a flat cell with a distance of 7
cm between electrodes. Tests were run from 50 μA to 1000 μA.
At currents up to 600 μA, the cell displayed a stable and usable voltage of at least 1.1 V. The
figure also clearly illustrates how increasing the current through the cell effectively lowers the
cell voltage. At currents higher than 600 μA, the potential of the cell becomes far too low to be
effective as a battery.
Figure 4-11 shows the constant current discharge curves for a bulk graphite/AZ91/ASW cell.
The first current tested was 50 μA and subsequent tests were run at increased currents until the
cell could no longer maintain a usable cell voltage.

68
Figure 4-11: This graph shows the series of constant current discharge tests with the cell containing the
bulk graphite plate control material as its cathode. The anode was bulk magnesium AZ91 and the
electrolyte was artificial seawater. All tests were run at ambient lab temperature in a flat cell with a
distance of 7 cm between electrodes.
It is quite clear when comparing Figure 4-10 and Figure 4-11 that the cells with saturated sodium
chloride as the electrolyte were able to facilitate greater amounts of current flow than cells with
artificial seawater electrolyte. At currents as low as 300 μA, the voltage of the bulk
graphite/AZ91/ASW cell dropped almost immediately to around 0.7 V. The same cell with
saturated sodium chloride as the electrolyte could maintain a potential of over 1.1 V at currents
twice as high.
This observation stresses the importance of the solution resistance in the electrolyte solutions.
While artificial seawater is highly conductive, it does not contain nearly as many ions in solution
as a saturated sodium chloride solution. It is also important to point out that all of the discharge
experiments were run in a flat cell where the anode and cathode were separated by a distance of
about 7 cm. The actual battery design will not have nearly as much distance between electrodes
which will lower the resistance of the solution.

69
4.2.2.2. Conducting Polymers
With the exception of the electrospun conducting polymer samples, all of the conducting
polymers were deposited onto filter paper substrates. Because of this all electrochemical tests
involving conducting polymers had to be run in an open beaker cell setup (see Figure 3-12). In
this setup, the exposed areas of the electrodes are not equivalent like they are in the flat cell
setup. This is not a problem for read voltage experiments, but it greatly affects the discharge
experiments because now current is involved and the flow of electrons depends greatly on the
surface area of the electrodes.
Many different strategies were employed in order to try to obtain discharge data from the
conducting polymer electrodes, but none of these strategies yielded any viable data. As soon as
current began flowing at the onset of the experiment, the output voltage of the cell immediately
dropped from the high cell voltages found during the read voltage tests to very low voltages
incapable of producing any power if used as a battery.
4.2.2.3. Graphite Materials
The constant current discharge experiments involving cells with graphite cathodes varied
substantially based on a few different factors. In this section, the data from discharge
experiments involving each graphite cathode material is presented. At the end of the section, the
data is summarized and the materials are compared against one another and against the control
experiments.
Figure 4-12 shows a series of discharge curves for a cell consisting of a Zorflex double weave
graphite fabric cathode, bulk magnesium AZ91 anode, and saturated sodium chloride electrolyte.
The discharge tests were run for three hours at ambient lab temperature. The current was
increased gradually from an initial value of 100 μA until the cell could no longer maintain a
voltage above 1.0 V at the end of the three hour test.

70
Figure 4-12: The constant current discharge graphs of a cell with a Zorflex cathode, AZ91 anode, and
saturated NaCl electrolyte are shown. All tests were run at ambient lab temperature in the flat cell with a
distance of 7 cm between anode and cathode. The Zorflex cathode performed significantly better than the
bulk graphite used in the control series of experiments as the cell was able to withstand currents in the
milliamp range.
The high surface area Zorflex is able to facilitate significantly larger currents than the bulk
graphite material used in the control experiments. While the bulk graphite/AZ91/saturated NaCl
cell only had a cell voltage of about 0.9 V at 800 μA, the Zorflex cell did not drop below a cell
voltage of 1.0 V until the very end of the three hour test at a constant current of 4000 μA.
Figure 4-13 shows a series of constant current discharge tests for a Zorflex/AZ91/ASW cell.
After observing the difference between the discharge curves in Figures 4-10 and 4-11 where the
difference in solution greatly affected the cell voltage of the control cells, the expectation was
that a similar drop in performance would be seen in cells with the Zorflex cathode material.

71
Figure 4-13: The constant current discharge graphs of a cell with a Zorflex cathode, bulk magnesium
AZ91 anode, and artificial seawater electrolyte are shown. All tests were run at ambient lab temperature
in the flat cell with a distance of 7 cm between anode and cathode. The Zorflex cathode performs
significantly better with the artificial seawater electrolyte than the bulk graphite did in the control series
of experiments.
This expectation proved to be true as the Zorflex/AZ91/ASW cell did not perform quite as well
as the Zorflex/AZ91/saturated NaCl cell. However, the drop-off in performance was not nearly
as pronounced as it was in the case of the control experiments (Figures 4-10 and 4-11). The cell
was still able to maintain voltages around 1.3 V at currents up to 1500 μA.
Figure 4-14 shows the constant current discharge curves for a graphite foil/AZ91/saturated NaCl
cell. Like the bulk graphite plate that was tested as the control material, graphite foil is a very
smooth material with a low surface area.

72
Figure 4-14: The constant current discharge curves of the graphite foil/AZ91/saturated NaCl cell are
shown. All tests were run at ambient lab temperature in the flat cell with a distance of 7 cm between
anode and cathode. The low surface area of the cathode prevents the cell from maintaining a high voltage
even at currents as low as 200 μA.
The low surface area graphite foil was not expected to be able facilitate very high currents
through the cell, and that expectation was confirmed during the experiment. At 200 μA, the cell
voltage immediately dropped to around 0.8 V.
Figure 4-15 shows the constant current discharge curves of the graphite foil/AZ91/artificial
seawater cell.

73
Figure 4-15: The constant current discharge curves of the graphite foil/AZ91/ASW cell are shown. All
tests were run at ambient lab temperature in the flat cell with a distance of 7 cm between anode and
cathode. The low surface area of the cathode prevents the cell from maintaining a high voltage even at
currents as low as 200 μA.
This cell performed just as poorly as the graphite foil/AZ91/saturated NaCl cell. The graphite
foil simply does not provide the necessary surface area to act as an effective electrode material in
a battery. A higher surface area cathode is essential for the battery to function effectively.
Figure 4-16 shows the discharge curves of a cell with a much higher surface area cathode
material. The cathode in this cell was made from graphite powder which was pressed into a solid
shape using powder metallurgy techniques. The process for fabricating these electrodes is
explained in Section 3.1.2.5. The anode material was once again bulk magnesium AZ91 and the
electrolyte was saturated sodium chloride.

74
Figure 4-16: The discharge curves of a cell with a cathode made from graphite powder that has been
pressed into a solid electrode. The anode is bulk AZ91 and the electrolyte is saturated sodium chloride.
All tests were run at ambient lab temperature in the flat cell with a distance of 7 cm between anode and
cathode.
This cell was capable of maintaining a stable voltage of over 1.3 V at currents up to 3000 μA. In
the 4000 μA constant current discharge test, the cell had a stable voltage of about 1.3 V for about
two hours before the potential finally began decreasing.
Figure 4-17 shows the series of discharge curves for the pressed powder graphite/AZ91/artificial
seawater cell.

75
Figure 4-17: The discharge curves of a cell with a cathode made from graphite powder that has been
pressed into a solid electrode. The anode is bulk AZ91 and the electrolyte is artificial seawater. All tests
were run at ambient lab temperature in the flat cell with a distance of 7 cm between anode and cathode.
As with the other cells that were tested, the change in electrolyte made a difference in the voltage
response of the cell during the constant current discharge tests. When compared to the cells with
saturated sodium chloride electrolyte, the cells with artificial seawater electrolyte had an
operating voltage about 200 mV lower for each current interval.
4.2.2.4. Summary of Constant Current Discharge Experiments
The constant current discharge test is the most effective way of observing how the cell voltage of
an electrochemical cell will hold up as it is exposed to the types of current that would be needed
to operate a battery. The cell’s ability to maintain a stable working voltage at increasingly higher
currents shows whether or not a given combination of materials will be successful.
Comparing the cell voltage of cells containing each different cathode material at the same current
value will illustrate how well each cell performs at a given current. The graph in Figure 4-18
shows the discharge curves of each cathode material at a constant current of 100 μA.

76
Figure 4-18: This graph is a comparison of each of the cells that were tested with a constant current of
100 μA.
At the low current of 100 μA, the cell should not discharge very much at all. The cell voltage
should remain near its initial open circuit value (from the read voltage experiments) for the
duration of the experiment. In Figure 4-18, three cells stand out – the Zorflex/AZ91/saturated
NaCl cell, the Zorflex/AZ91/artificial seawater cell, and the P/M graphite/AZ91/saturated
sodium chloride cell – by maintaining a stable cell voltage above 1.6 V for the entire three
discharge test.
As was previously mentioned, the cells with graphite foil cathodes do a poor job holding a high
voltage. The two control cells with bulk graphite as their cathode material maintain a stable
voltage although it is much lower (about 1.4 V in saturated NaCl and 1.25 V in artificial
seawater) than the three cells mentioned in the previous paragraph. The P/M
graphite/AZ91/artificial seawater cell is also very stable although its cell voltage of 1.4 V is
about 200 mV lower than the same cell in saturated sodium chloride electrolyte.

77
Figure 4-19 compares the discharge curves of the different cells at a slightly higher constant
current of 200 μA. This is still a relatively low current, so the cells should still have been able to
maintain high and stable voltages for the entire test.
Figure 4-19: This graph is a comparison of each of the cells that were tested with a constant current of
200 μA.
The three best cells at 100 μA were again the three best cells at 200 μA. The
Zorflex/AZ91/saturated NaCl cell in particular stands out as being extremely stable as well as
having the highest cell voltage of around 1.7 V at the end of the three hour test. The
Zorflex/AZ91/artificial seawater and P/M graphite/AZ91/saturated NaCl cells both stayed
around 1.6 V for the length of the experiment. The P/M graphite/AZ91/artificial seawater cell
was once again very stable but had a cell voltage 200 mV lower than the P/M
graphite/AZ91/saturated NaCl cell.
The control tests with bulk graphite cathodes were once again very stable but at much lower
potentials than the Zorflex or P/M graphite cells. Graphite foil again showed that it is not a viable

78
option as a cathode material as the potential of the cells with graphite foil cathodes were below
1.0 V even at this very low current value.
Figure 4-20 compares the discharge curves of the different cells at a constant current of 500 μA.
Because the graphite foil cathodes were unable to provide any voltage at this high of a current,
the graph now only compares six different cells. There are three cathodes that are tested and each
is tested in both saturated sodium chloride and artificial seawater.
Figure 4-20: This graph is a comparison of each of the cells that were tested with a constant current of
500 μA.
The Zorflex/AZ91/saturated NaCl cell is still displaying a cell voltage of almost 1.7 V for the
entire three hours. The Zorflex/AZ91/artificial seawater cell was not nearly as stable at 500 μA
as it dropped to about 1.2 V after three hours. Both cells with pressed graphite powder cathodes
remained relatively stable at potentials of about 1.5 V in saturated sodium chloride and just under
1.4 V in artificial seawater. The low surface area of the bulk graphite cathodes used in the
control cells is the reason for the low cell voltages in the control experiments. The bulk

79
graphite/AZ91/saturated NaCl cell maintained a stable voltage slightly under 1.2 V, but the same
cell in artificial seawater had a cell voltage of about 0.6 V.
Figure 4-21 compares the discharge curves of the different cells at a constant current of 1000 μA.
After displaying a very low cell voltage at 500 μA, the bulk graphite/AZ91/artificial seawater
cell was not tested at 1000 μA.
Figure 4-21: This graph is a comparison of each of the cells that were tested with a constant current of
1000 μA.
The results from the 1000 μA discharge curves are very similar to the results from the 500 μA
discharge curves. The Zorflex/AZ91/saturated NaCl cell once again provided a stable 1.7 V for
the full three hours while the Zorflex cell in artificial seawater was much less stable as its cell
voltage decreased to around 1.2 V. The P/M graphite/AZ91/saturated sodium chloride cell
provided a voltage of around 1.4 V while the P/M graphite/AZ91/artificial seawater cell provided
a voltage about 100 mV lower. The low surface area bulk graphite control cell saw its voltage
drop to less than 1 V at this current.

80
Figure 4-22 compares the discharge curves of the different cells at a constant current of 2000 μA.
Only two cathode materials were tested at this high current value: the Zorflex double weave
graphite fiber fabric and the pressed graphite powder.
Figure 4-22: This graph is a comparison of each of the cells that were tested with a constant current of
2000 μA.
The Zorflex/AZ91/saturated sodium chloride cell finally dropped to below 1.6 V, but was still
very stable between 1.5 and 1.6 V. The Zorflex cell in artificial seawater was again much less
stable and its cell voltage steadily decreased from about 1.4 to 1.05 V after discharging for three
hours at 2000 μA. The two P/M graphite cells once more displayed flat discharge curves with the
potential of the saturated sodium chloride cell about 100-150 mV than the artificial seawater cell.
Figure 4-23 compares the discharge curves at 3000 μA. The same four cells that were tested at
2000 μA in Figure 4-22 were tested at a current of 3000 μA.

81
Figure 4-23: This graph is a comparison of each of the cells that were tested with a constant current of
3000 μA.
Figure 4-23 is nearly identical to Figure 4-22 except that the cell voltage values for each cell are
a little bit lower at this higher current value. The Zorflex cell in saturated sodium chloride has the
highest cell voltage again and it stays between 1.4 and 1.5 V for the entire test. The Zorflex cell
in artificial seawater is once again much less stable and drops to about 0.8 V at the end of the
three hour discharge test. Both P/M graphite cells have relatively flat graphs with stable cell
voltages of about 1.35 V in saturated NaCl and 1.2 V in artificial seawater.
Figure 4-24 is a graph of the discharge curves at 4000 μA. The Zorflex/AZ91/artificial seawater
cell was eliminated at this current and the three remaining cells were compared to each other.

82
Figure 4-24: This graph is a comparison of each of the cells that were tested with a constant current of
4000 μA.
There was evidence of the Zorflex/AZ91/saturated NaCl cell becoming less stable as the currents
steadily increased. In Figure 4-23, while this cell still had the highest cell voltage, the cell
voltage decreased during the experiment while the cell voltages of the P/M graphite cells
remained flat. The Zorflex/AZ91/saturated NaCl cell decreased over the entire test at 4000 μA
and could not even provide a cell voltage above 1 V at the end of the test.
The pressed powder graphite cathodes showed relatively stable voltages for the full three hours
even at a voltage of 4000 μA. In saturated sodium chloride, the cell provided a voltage of about
1.3 V for over two hours before starting to decrease to a potential of about 1.1 V at the end of the
experiment. The P/M graphite cell in artificial seawater provided a stable voltage of 1.1 V for the
full three hours.

83
4.2.3. Potentiostatic EIS Experiments
After running all of the constant current discharge experiments for each candidate cathode
material in both saturated sodium chloride and artificial seawater, it became abundantly clear that
the performance of the battery would vary greatly depending on the electrolyte used. Although
artificial seawater is a highly conductive electrolyte, it does not have as many ions in solution as
saturated sodium chloride.
There are certainly many different reasons why the cells using saturated sodium chloride as their
electrolyte performed better than those with artificial seawater. This is because the anode
material that is being consumed will corrode differently depending on the solution, the cathode,
and a variety of other factors. However, the main reason for the discrepancy in performance was
believed to be because of the different solution resistances of the two solutions.
To test this theory, a series of electrochemical impedance spectroscopy (EIS) experiments were
run. EIS is a useful technique that can be used to model an electrochemical cell as an electrical
circuit. The resistance of the electrolyte solution is one of the pieces of information that can be
extracted from the data.
Figure 4-25 shows the Nyquist plots for two runs of a potentiostatic EIS experiment used to
determine the solution resistance of the saturated sodium chloride electrolyte. In this experiment,
bulk magnesium AZ91 is the anode, bulk graphite is the counter electrode, and a saturated
calomel electrode (SCE) is the reference electrode. It is important to recall that all experiments
were run in flat cells with an electrode separation distance of 7 cm.

84
Figure 4-25: This graph shows the first 15 data points of two runs of a Nyquist plot from a potentiostatic
EIS experiment. AZ91 was the anode, bulk graphite was the counter electrode and a saturated calomel
electrode was the reference. The solution resistance can be obtained as the point where the curve crosses
the x axis where Zimag is equal to 0. The solution resistance of saturated sodium chloride in the flat cell is
between 4 and 5 Ω.
The solution resistance can be obtained from the Nyquist plot as the point where the curve
crosses the x axis (where Zimag=0). The solution resistance in Run 1 of the experiment was
around 4.8 Ω and in Run 2 it was 4.5 Ω. This low resistance was expected as saturated
electrolytes are very conductive.
Figure 4-26 shows the Nyquist plots for two runs of the same experiment in artificial seawater.
Once again, AZ91 is the anode, bulk graphite is the counter, and an SCE reference electrode is
used.

85
Figure 4-26: This graph shows the first 15 data points of two runs of a Nyquist plot from a potentiostatic
EIS experiment. AZ91 was the anode, bulk graphite was the counter electrode and a saturated calomel
electrode was the reference. The solution resistance can be obtained as the point where the curve crosses
the x axis where Zimag is equal to 0. The solution resistance of artificial seawater is around 18 to 20 Ω.
The solution resistance of the artificial seawater is still pretty low although it is quite a bit higher
than the resistance of saturated sodium chloride. The solution resistance in Run 1 was 20.1 Ω and
in Run 2 it was 18.4 Ω.
Figures 4-25 and 4-26 help to reaffirm the hypothesis that the difference in the solution
resistance of saturated sodium chloride and artificial seawater led to a difference in performance.
The higher solution resistance in the artificial seawater made the flow of current more difficult
during constant current discharge tests.
4.2.2.6. Voltage Delay
It is worth noting that in almost every single discharge curve, a short voltage delay is visible in
the graphs. Discussed in Section 2.2.2, voltage delay is a phenomenon caused by the passive film
on the surface of the anode material. Figure 4-27 shows the beginning of a constant current
0
5
10
15
20
25
30
35
40
45
0 5 10 15 20 25 30
-Zim
ag (
oh
ms)
Zreal (ohms)
Potentiostatic EIS in Artificial Seawater
Run 1
Run 2

86
discharge experiment. A high scan rate was used to show in detail the voltage response of the
cell immediately after the constant current is applied.
Figure 4-27: The first minute of a constant current discharge experiment is shown. It is the 100 μA
discharge curve of the Zorflex/AZ91/saturated NaCl cell. In the first 15 seconds of the experiment, the
potential dips before stabilizing at about 1.7 V. This is because of voltage delay caused because time is
required to disrupt the passive film on the surface of the AZ91 anode.
The graph shows that in the initial seconds after starting the experiment the cell voltage is very
low, but after about 5 seconds the cell voltage stabilizes. This voltage delay is noticeable at both
high and low current values and is present regardless of the cathode material or electrolyte.
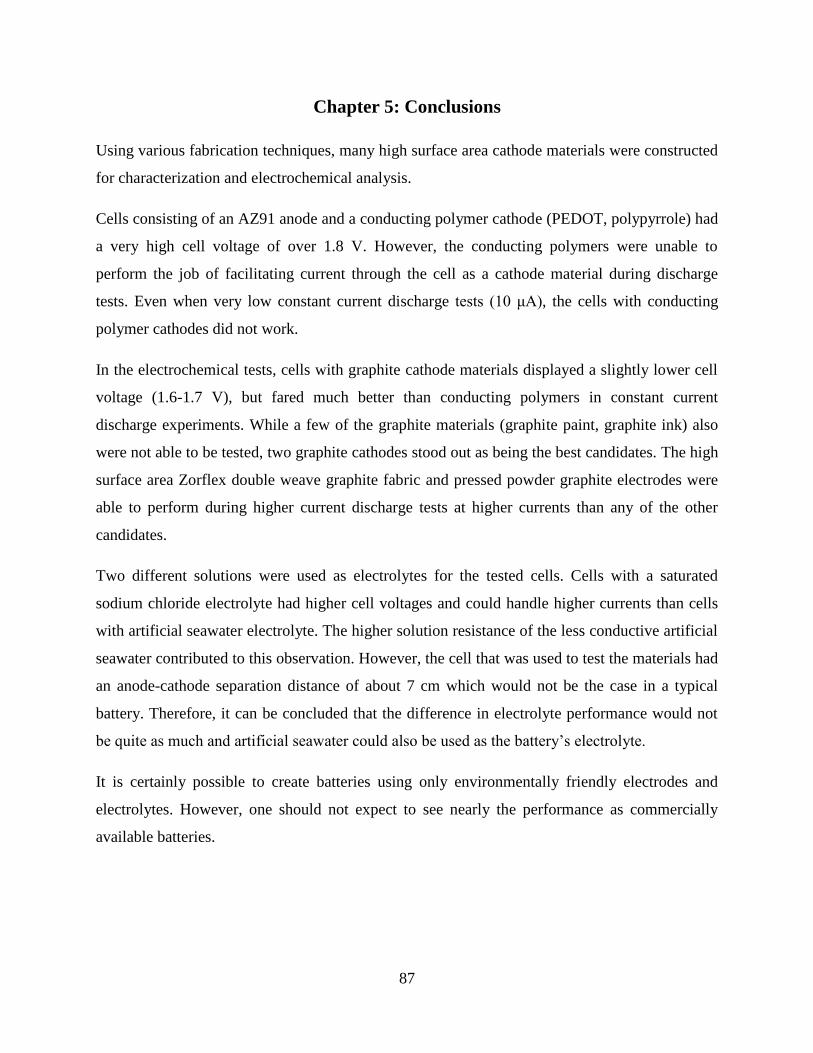
87
Chapter 5: Conclusions
Using various fabrication techniques, many high surface area cathode materials were constructed
for characterization and electrochemical analysis.
Cells consisting of an AZ91 anode and a conducting polymer cathode (PEDOT, polypyrrole) had
a very high cell voltage of over 1.8 V. However, the conducting polymers were unable to
perform the job of facilitating current through the cell as a cathode material during discharge
tests. Even when very low constant current discharge tests (10 μA), the cells with conducting
polymer cathodes did not work.
In the electrochemical tests, cells with graphite cathode materials displayed a slightly lower cell
voltage (1.6-1.7 V), but fared much better than conducting polymers in constant current
discharge experiments. While a few of the graphite materials (graphite paint, graphite ink) also
were not able to be tested, two graphite cathodes stood out as being the best candidates. The high
surface area Zorflex double weave graphite fabric and pressed powder graphite electrodes were
able to perform during higher current discharge tests at higher currents than any of the other
candidates.
Two different solutions were used as electrolytes for the tested cells. Cells with a saturated
sodium chloride electrolyte had higher cell voltages and could handle higher currents than cells
with artificial seawater electrolyte. The higher solution resistance of the less conductive artificial
seawater contributed to this observation. However, the cell that was used to test the materials had
an anode-cathode separation distance of about 7 cm which would not be the case in a typical
battery. Therefore, it can be concluded that the difference in electrolyte performance would not
be quite as much and artificial seawater could also be used as the battery’s electrolyte.
It is certainly possible to create batteries using only environmentally friendly electrodes and
electrolytes. However, one should not expect to see nearly the performance as commercially
available batteries.

88
Chapter 6: Future Work
Unfortunately, the thin film magnesium alloy anode materials were not available for testing in
this study. Running full cell experiments on the Gamry Reference 3000 potentiostat with the
high surface area cathodes and thin film anodes would offer a better idea of the true performance
of the intended final battery design.
With the success of the high surface area graphite cathode materials like the Zorflex double
weave graphite cloth, it is certain that many other techniques for producing high surface area
graphite could also be employed to fabricate a cathode material. Because graphite is so widely
used for such a wide variety of applications, there exist many different ways of creating graphite
materials.
One of the most intriguing possibilities is a graphite thin film electrode. Coupled with a thin film
magnesium alloy anode, a battery consisting entirely of high surface area structured thin films
could facilitate large currents and thus generate more power. The thin film battery would be very
compact and lightweight, which are very important characteristics.
The main setback with the conducting polymer cathodes, which actually produced the highest
cell voltage when coupled with AZ91, seemed to be electrical conductivity. The lack of
conductivity made current flow within the cell impossible which rendered these materials useless
as battery electrode materials. In future research, finding ways to increase the conductivity of
these promising materials should definitely be examined.

89
Appendix A: Glossary of Battery Terminology
Capacity: The capacity of a battery is the amount of electric charge it can deliver at its rated
voltage. Bigger cells with more electrode material will have higher capacities than smaller cells
made of the same materials. The unit for capacity is the amp-hour (A∙h).
Specific Energy: Specific energy is the amount of energy stored in a given amount of mass. The
unit for specific energy is Watt-hours per kilogram (Wh/kg).
Energy Density: The amount of energy stored in a specific region of space is its energy density.
The unit for energy density is Watt-hours per liter (Wh/L).
Power Density: Power density is the amount of power per unit volume. In batteries it is often
called volume power density. The unit for power density is Watt per cubic meter (W/m3).

90
Appendix B: Read Voltage Experiments
Figure B-1: The graphs from a read voltage experiment are shown. The cathode was a bulk graphite
plate, the anode was bulk magnesium AZ91, and the electrolyte was saturated sodium chloride. The
experiments were run at ambient lab temperature in the flat cell with a distance of 7 cm between anode
and cathode. The cell voltage was between 1.65 and 1.70 V.
Figure B-2: The graphs from two runs of a read voltage experiment are shown. The cathode was a bulk
graphite plate, the anode was bulk magnesium AZ91, and the electrolyte was artificial seawater. The
experiments were run at ambient lab temperature in the flat cell with a distance of 7 cm between anode
and cathode. The cell voltage was between 1.6 and 1.7 V.

91
Figure B-3: The graphs from two runs of a 12 hour read voltage experiment are shown. The cell
consisted of a PEDOT cathode that was vapor deposited onto a filter paper substrate. The anode was bulk
magnesium AZ91 and the electrolyte was saturated sodium chloride. The experiments were run at
ambient lab temperature in the flat cell where the anode and cathode were separated by 7 cm. The cell
voltage was between 1.8 and 1.85 V.
Figure B-4: The graphs from two runs of a 12 hour read voltage experiment are shown. The cell
consisted of a PEDOT cathode that was vapor deposited onto a filter paper substrate. The anode was bulk
magnesium AZ91 and the electrolyte was artificial seawater. The experiments were run at ambient lab
temperature in the flat cell where the anode and cathode were separated by 7 cm. The cell voltage was
between 1.8 and 1.85 V.

92
Figure B-5: The graphs from two runs of a 12 hour read voltage experiment are shown. The cell
consisted of a PEDOT:PSS cathode on a filter paper substrate, a bulk magnesium AZ91 anode, and a
saturated sodium chloride electrolyte. The experiments were run at ambient lab temperature in the flat cell
where the anode and cathode were separated by 7 cm. The cell voltage was between 1.0 and 1.2 V.
Figure B-6: The graphs from two runs of a 12 hour read voltage experiment are shown. The cell
consisted of a PEDOT:PSS cathode that was on a filter paper substrate. The anode was bulk AZ91 and the
electrolyte was artificial seawater. The experiments were run at ambient lab temperature in the flat cell
where the anode and cathode were separated by 7 cm. The cell voltage was between 0.9 and 1.1 V.

93
Figure B-7: The graphs from two runs of a 12 hour read voltage experiment are shown. The cell
consisted of a polypyrrole cathode on a filter paper substrate, a bulk AZ91 anode, and saturated sodium
chloride electrolyte. The experiments were run at ambient lab temperature in the flat cell where the anode
and cathode were separated by 7 cm. The cell voltage was between 1.9 and 2.0 V.
Figure B-8: The graphs from two runs of a 12 hour read voltage experiment are shown. The cell
consisted of a polypyrrole cathode on a filter paper substrate, a bulk AZ91 anode, and artificial seawater
electrolyte. The experiments were run at ambient lab temperature in the flat cell where the anode and
cathode were separated by 7 cm. The cell voltage was between 1.85 and 1.9 V.

94
Figure B-9: The graphs from two runs of a 12 hour read voltage experiment are shown. The cell
consisted of a Zorflex double weave graphite fabric cathode, bulk AZ91 anode, and saturated sodium
chloride electrolyte. The experiments were run at ambient lab temperature in the flat cell where the anode
and cathode were separated by 7 cm. The cell voltage was between 1.75 and 1.85 V.
Figure B-10: The graphs from two runs of a 12 hour read voltage experiment are shown. The cell
consisted of a Zorflex double weave graphite fabric cathode, bulk AZ91 anode, and artificial seawater
electrolyte. The experiments were run at ambient lab temperature in the flat cell where the anode and
cathode were separated by 7 cm. The cell voltage was between 1.7 and 1.75 V.

95
Figure B-11: The graphs from two runs of a 12 hour read voltage experiment are shown. The cell
consisted of a graphite foil cathode, bulk AZ91 anode, and saturated sodium chloride electrolyte. The
experiments were run at ambient lab temperature in the flat cell where the anode and cathode were
separated by 7 cm. The cell voltage was between 1.75 and 1.8 V.
Figure B-12: The graphs from two runs of a 12 hour read voltage experiment are shown. The cell
consisted of a graphite foil cathode, bulk AZ91 anode, and artificial seawater electrolyte. The experiments
were run at ambient lab temperature in the flat cell where the anode and cathode were separated by 7 cm.
The cell voltage was between 1.7 and 1.75 V.

96
Figure B-13: The graphs from two runs of a 12 hour read voltage experiment are shown. The cathode in
this cell was Ted Pella colloidal graphite paint which was painted onto an ECO Fabric bamboo carbon
nanoparticle fabric substrate. The anode was bulk AZ91 and the electrolyte was saturated sodium
chloride. The experiments were run at ambient lab temperature in the flat cell where the anode and
cathode were separated by 7 cm. The cell voltage was somewhat unstable but remained between 1.65 and
1.8 V for the duration of the experiment.
Figure B-14: The graphs from two runs of a 12 hour read voltage experiment are shown. The cathode in
this cell was Ted Pella colloidal graphite paint which was painted onto an ECO Fabric bamboo carbon
nanoparticle fabric substrate. The anode was bulk AZ91 and the electrolyte was artificial seawater. The
experiments were run at ambient lab temperature in the flat cell where the anode and cathode were
separated by 7 cm. The cell voltage was between 1.6 and 1.65 V.
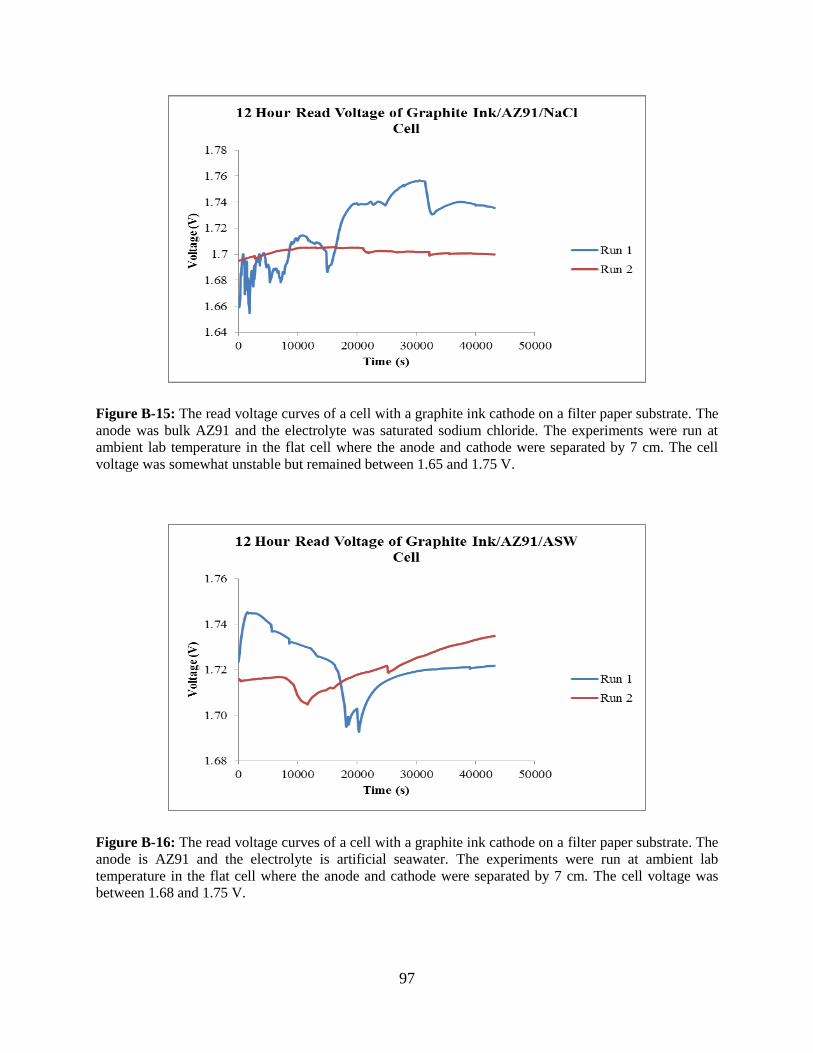
97
Figure B-15: The read voltage curves of a cell with a graphite ink cathode on a filter paper substrate. The
anode was bulk AZ91 and the electrolyte was saturated sodium chloride. The experiments were run at
ambient lab temperature in the flat cell where the anode and cathode were separated by 7 cm. The cell
voltage was somewhat unstable but remained between 1.65 and 1.75 V.
Figure B-16: The read voltage curves of a cell with a graphite ink cathode on a filter paper substrate. The
anode is AZ91 and the electrolyte is artificial seawater. The experiments were run at ambient lab
temperature in the flat cell where the anode and cathode were separated by 7 cm. The cell voltage was
between 1.68 and 1.75 V.
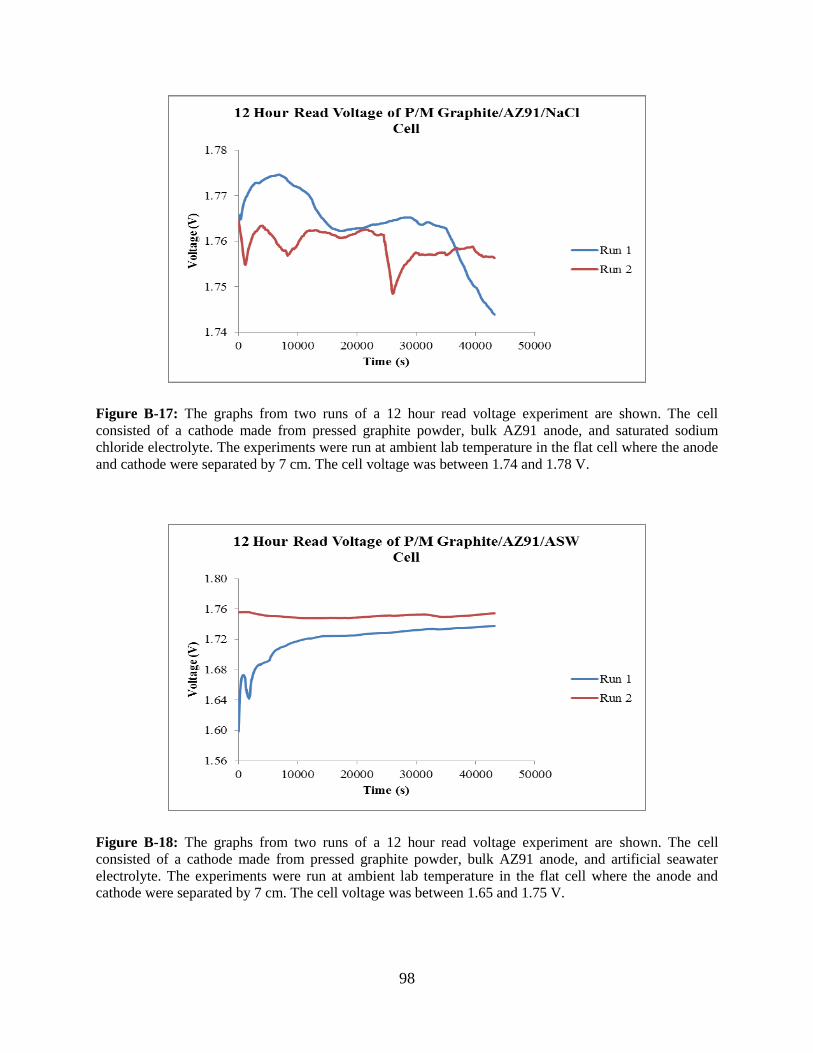
98
Figure B-17: The graphs from two runs of a 12 hour read voltage experiment are shown. The cell
consisted of a cathode made from pressed graphite powder, bulk AZ91 anode, and saturated sodium
chloride electrolyte. The experiments were run at ambient lab temperature in the flat cell where the anode
and cathode were separated by 7 cm. The cell voltage was between 1.74 and 1.78 V.
Figure B-18: The graphs from two runs of a 12 hour read voltage experiment are shown. The cell
consisted of a cathode made from pressed graphite powder, bulk AZ91 anode, and artificial seawater
electrolyte. The experiments were run at ambient lab temperature in the flat cell where the anode and
cathode were separated by 7 cm. The cell voltage was between 1.65 and 1.75 V.

99
Appendix C: Constant Current Discharge Experiments
In the Section 4.2.2 of the thesis, many constant current discharge graphs are displayed. In the
main body of the text, only one run of each experiment at each current is depicted. Replicate
experiments were run for all of the experiments and that data is presented in this appendix. In the
tables below, the run in boldface text is the one that was included in the main body of the text.
The data from the second run is also displayed without the boldface.
Table C-1: Data points taken at the 30 minute, 1 hour, 2 hour, and three hour mark in the constant current
discharge graphs for the bulk graphite/AZ91/saturated sodium chloride cell are shown. The data from two
replicate runs is shown where the run that is highlighted in boldface text is the one represented in
graphical form in the main body of the thesis.
Current 30 min 1 hour 2 hours 3 hours
100 μA Run 1 1.383 V 1.387 V 1.386 V 1.383 V
Run 2 1.421 V 1.398 V 1.401 V 1.388 V
200 μA Run 1 1.290 V 1.297 V 1.294 V 1.297 V
Run 2 1.187 V 1.219 V 1.222 V 1.215 V
500 μA Run 1 1.184 V 1.162 V 1.167 V 1.165 V
Run 2 1.171 V 1.174 V 1.182 V 1.185 V
1000 μA Run 1 0.779 V 0.815 V 0.894 V 0.936 V
Run 2 0.654 V 0.711 V 0.705 V 0.739 V
Table C-2: Data points taken at the 30 minute, 1 hour, 2 hour, and three hour mark in the constant current
discharge graphs for the bulk graphite/AZ91/artificial seawater cell are shown. The data from two
replicate runs is shown where the run that is highlighted in boldface text is the one represented in
graphical form in the main body of the thesis.
Current 30 min 1 hour 2 hours 3 hours
100 μA Run 1 1.202 V 1.198 V 1.185 V 1.192 V
Run 2 1.239 V 1.231 V 1.233 V 1.237 V
200 μA Run 1 1.070 V 1.066 V 1.062 V 1.075 V
Run 2 1.044 V 1.055 V 1.054 V 1.032 V
500 μA Run 1 0.613 V 0.609 V 0.618 V 0.629 V
Run 2 0.720 V 0.688 V 0.611 V 0.583 V

100
Table C-3: Data points taken at the 30 minute, 1 hour, 2 hour, and three hour mark in the constant current
discharge graphs for the Zorflex/AZ91/saturated sodium chloride cell are shown. The data from two
replicate runs is shown where the run that is highlighted in boldface text is the one represented in
graphical form in the main body of the thesis.
Current 30 min 1 hour 2 hours 3 hours
100 μA Run 1 1.675 V 1.685 V 1.689 V 1.683 V
Run 2 1.707 V 1.709 V 1.704 V 1.696 V
200 μA Run 1 1.716 V 1.628 V 1.622 V 1.626 V
Run 2 1.715 V 1.712 V 1.696 V 1.694 V
500 μA Run 1 1.661 V 1.652 V 1.638 V 1.621 V
Run 2 1.670 V 1.664 V 1.648 V 1.631 V
1000 μA Run 1 1.639 V 1.632 V 1.605 V 1.569 V
Run 2 1.678 V 1.662 V 1.622 V 1.606 V
1500 μA Run 1 1.637 V 1.616 V 1.569 V 1.539 V
Run 2 1.563 V 1.550 V 1.523 V 1.502 V
2000 μA Run 1 1.585 V 1.557 V 1.520 V 1.497 V
Run 2 1.569 V 1.530 V 1.491 V 1.466 V
3000 μA Run 1 1.422 V 1.371 V 1.300 V 1.271 V
Run 2 1.498 V 1.450 V 1.381 V 1.348 V
4000 μA Run 1 1.395 V 1.278 V 1.106 V 0.971 V
Run 2 1.226 V 1.109 V 1.098 V 0.982 V
Table C-4: Data points taken at the 30 minute, 1 hour, 2 hour, and three hour mark in the constant current
discharge graphs for the Zorflex/AZ91/artificial seawater cell are shown. The data from two replicate runs
is shown where the run that is highlighted in boldface text is the one represented in graphical form in the
main body of the thesis.
Current 30 min 1 hour 2 hours 3 hours
100 μA Run 1 1.685 V 1.667 V 1.638 V 1.594 V
Run 2 1.706 V 1.685 V 1.657 V 1.621 V
200 μA Run 1 1.645 V 1.605 V 1.544 V 1.481 V
Run 2 1.682 V 1.609 V 1.564 V 1.542 V
500 μA Run 1 1.571 V 1.479 V 1.335 V 1.233 V
Run 2 1.409 V 1.339 V 1.226 V 1.138 V
1000 μA Run 1 1.494 V 1.479 V 1.441 V 1.384 V
Run 2 1.520 V 1.464 V 1.360 V 1.256 V
1500 μA Run 1 1.501 V 1.472 V 1.419 V 1.356 V
Run 2 1.392 V 1.345 V 1.322 V 1.299 V
2000 μA Run 1 1.307 V 1.255 V 1.147 V 1.052 V
Run 2 1.289 V 1.277 V 1.198 V 0.973 V
3000 μA Run 1 1.345 V 1.176 V 0.952 V 0.802 V
Run 2 1.319 V 1.029 V 0.912 V 0.732 V

101
Table C-5: Data points taken at the 30 minute, 1 hour, 2 hour, and three hour mark in the constant current
discharge graphs for the graphite foil/AZ91/saturated sodium chloride cell are shown. The data from two
replicate runs is shown where the run that is highlighted in boldface text is the one represented in
graphical form in the main body of the thesis.
Current 30 min 1 hour 2 hours 3 hours
100 μA Run 1 1.169 V 1.125 V 1.098 V 1.068 V
Run 2 1.094 V 1.055 V 1.007 V 0.988 V
200 μA Run 1 0.781 V 0.782 V 0.802 V 0.809 V
Run 2 0.744 V 0.743 V 0.755 V 0.749 V
Table C-6: Data points taken at the 30 minute, 1 hour, 2 hour, and three hour mark in the constant current
discharge graphs for the graphite foil/AZ91/artificial seawater cell are shown. The data from two replicate
runs is shown where the run that is highlighted in boldface text is the one represented in graphical form in
the main body of the thesis.
Current 30 min 1 hour 2 hours 3 hours
100 μA Run 1 1.051 V 1.021 V 1.007 V 1.008 V
Run 2 1.122 V 1.087 V 1.054 V 1.043 V
200 μA Run 1 0.676 V 0.700 V 0.718 V 0.721 V
Run 2 0.543 V 0.541 V 0.533 V 0.536 V
Table C-7: Data points taken at the 30 minute, 1 hour, 2 hour, and three hour mark in the constant current
discharge graphs for the P/M graphite/AZ91/saturated sodium chloride cell are shown. The data from two
replicate runs is shown where the run that is highlighted in boldface text is the one represented in
graphical form in the main body of the thesis.
Current 30 min 1 hour 2 hours 3 hours
100 μA Run 1 1.649 V 1.637 V 1.614 V 1.598 V
Run 2 1.633 V 1.624 V 1.618 V 1.603 V
200 μA Run 1 1.602 V 1.591 V 1.538 V 1.496 V
Run 2 1.588 V 1.569 V 1.566 V 1.534 V
500 μA Run 1 1.553 V 1.518 V 1.472 V 1.458 V
Run 2 1.569 V 1.502 V 1.465 V 1.421 V
1000 μA Run 1 1.418 V 1.404 V 1.394 V 1.388 V
Run 2 1.457 V 1.444 V 1.401 V 1.364 V
1500 μA Run 1 1.384 V 1.368 V 1.363 V 1.359 V
Run 2 1.271 V 1.288 V 1.278 V 1.272 V
2000 μA Run 1 1.381 V 1.374 V 1.368 V 1.356 V
Run 2 1.213 V 1.199 V 1.182 V 1.170 V
3000 μA Run 1 1.319 V 1.312 V 1.297 V 1.286 V
Run 2 1.349 V 1.341 V 1.332 V 1.321 V
4000 μA Run 1 1.325 V 1.311 V 1.255 V 1.084 V
Run 2 1.304 V 1.256 V 1.122 V 0.946 V

102
Table C-8: Data points taken at the 30 minute, 1 hour, 2 hour, and three hour mark in the constant current
discharge graphs for the P/M graphite/AZ91/artificial seawater cell are shown. The data from two
replicate runs is shown where the run that is highlighted in boldface text is the one represented in
graphical form in the main body of the thesis.
Current 30 min 1 hour 2 hours 3 hours
100 μA Run 1 1.410 V 1.418 V 1.426 V 1.420 V
Run 2 1.392 V 1.395 V 1.394 V 1.389 V
200 μA Run 1 1.396 V 1.391 V 1.398 V 1.398 V
Run 2 1.414 V 1.378 V 1.378 V 1.375 V
500 μA Run 1 1.342 V 1.327 V 1.319 V 1.309 V
Run 2 1.297 V 1.301 V 1.302 V 1.308 V
1000 μA Run 1 1.291 V 1.273 V 1.279 V 1.277 V
Run 2 1.255 V 1.242 V 1.245 V 1.246 V
1500 μA Run 1 1.269 V 1.254 V 1.261 V 1.258 V
Run 2 1.267 V 1.259 V 1.246 V 1.243 V
2000 μA Run 1 1.210 V 1.220 V 1.230 V 1.229 V
Run 2 1.189 V 1.195 V 1.202 V 1.204 V
3000 μA Run 1 1.175 V 1.181 V 1.181 V 1.176 V
Run 2 1.121 V 1.119 V 1.108 V 1.106 V
4000 μA Run 1 1.087 V 1.105 V 1.104 V 1.093 V
Run 2 0.980 V 0.989 V 1.010 V 1.008 V

103
References
1. B.S. Finn, “ rigin of Electrical Power,” National Museum of American History, 2002.
2. R.M. Dell, “Batteries: Fifty years of materials development,” Solid State Ionics, 2000;
134(1-2), p. 139-158.
3. A.M. Bernardes, D.C.R. Espinosa, J.A.S. Tenorio, “Recycling of batteries: a review of
current processes and technologies,” Journal of Power Sources, 2004; 130(1-2), p. 291-
298.
4. H. Lund, McGraw-Hill Recycling Handbook, 2nd
ed., McGraw-Hill, New York, 2000.
5. H.O. Pierson, Handbook of Carbon, Graphite, Diamond, and Fullerenes: Properties,
Processing and Applications, Noyes Publications, Park Ridge, NJ, 1993.
6. A.M. Nardes, “ n the conductivity of PED T:PSS thin films,” Technische Universteit
Eindhoven, 2007.
7. D. Linden, T.B. Reddy, Handbook of Batteries, 3rd
ed., McGraw-Hill, New York, 2002.
8. R.M. Dell, D.A.J. Rand, Understanding Batteries, Royal Society of Chemistry,
Manchester, 2001.
9. P. Brenni, R. Galdi, F. Pietra, A. Savini, “From Volta onwards: a variety of electrical
batteries in the Pavia Museum of Electrical Technology,” Third IEEE History of Electro-
technology Conference – The Origins of Electrotechnologies, 2012; p. 1-6.
10. “Battery Statistics,” Battery University, 2006; Retrieved from
http://batteryuniversity.com/learn/article/battery_statistics
11. “Galvanic Corrosion,” Atlas Steel Technical Note No. 7, Atlas Steels, Revised August
2010.
12. A.G. Ritchie, “Military Applications of Reserve Batteries,” Philosophical Transactions:
Mathematical, Physical and Engineering Sciences, 1996; 354(1712), p. 1643-1652.
13. R.F. Koontz, R.D. Lucero, “Magnesium Water-Activated Batteries,” Handbook of
Batteries, 2002, p. 17.1-17.27.
14. M. Bartolozzi, “The recovery of metals from spent alkaline-manganese batteries: a
review of patent literature,” Resources, Conservation and Recycling, 1990; 4(3), p. 233-
240.
15. P. Haefliger, M. Mathieu-Nolf, S. Lociciro, C. Ndiaye, M. Coly, A. Diouf, A.L. Faye, et
al., “Mass lead intoxication from informal used lead-acid battery recycling in Dakar,
Senegal,” Environmental Health Perspectives, 2009; 117(10), p. 1535-40.
16. “Wastes – Resource Conservation – Common Wastes and Materials: Batteries,” United
States Environmental Protection Agency, 2012; Retrieved from
http://www.epa.gov/osw/conserve/materials/battery.htm
17. E. Ghali, W. Dietzel, K.U. Kainer, “General and Localized Corrosion of Magnesium
Alloys: A Critical Review,” Journal of Materials Engineering and Performance, 2004;
13(1), p. 7-23.
18. G.L. Song, A. Atrens, “Corrosion Mechanisms of Magnesium Alloys,” Advanced
Engineering Materials, 1999; 1(1), p. 11-33.

104
19. Anon., Technical communication, Dow Chemical Company, Dow North America,
Freeport, TX, 1994, 77541.
20. R.W. Murray, J.E. illis, “Magnesium Finishing: Chemical Treatment and Coating
Processes,” SAE Technical Paper No. 900791, Detroit, 1990.
21. A. Froats, T.K. Aune, D. Hawke, W. Unsworth, J. Hillis,
22. L.L. Shreir, Corrosion, Vol. 1, Metal/Environment Reactions, Newnes-Butterworths,
1965; p. 86-100.
23. G.L. Makar, J. Kruger, “Corrosion of magnesium,” International Materials Reviews,
1993; 38(3), p. 138-153.
24. E.F. Emley, Principles of Magnesium Technology, Elsevier Science & Technology, 1966.
25. M. Pourbaix, Atlas of electrochemical equilibria in aqueous solutions (English edition),
1st ed., Pergamon press, Oxford, 1966.
26. G.G. Perrault, “The potential-pH diagram of the magnesium-water system,” Journal of
Electroanalytical Chemistry and Interfacial Electrochemistry, 1974; 51(1), p. 107-119.
27. W.S. Loose, “Corrosion and Protection of Magnesium,” Metals Handbook, ASM
International, Materials Park, OH, 1946; p. 173-260.
28. G.L. Song, A. Atrens, X. Wu, B. Zhang, “Corrosion behaviour of AZ21, AZ501, and
AZ91 in sodium chloride,” Corrosion Science, 1998; 40(10), p. 1769-1791.
29. P.J. Spellman, D.M. Larsen, R.J. Ekern, J.E. xley, “Magnesium and Aluminum
Batteries,” Handbook of Batteries, 2002, p. 9.1-9.14.
30. L. Jarvis, “The beneficial effect of increased cathode water content on magnesium battery
performance,” Journal of Power Sources, 1990; 32, p. 271-276.
31. N.G. Wang, R.C. Wang, C.Q. Peng, Y. Feng, “Effect of Manganese on Discharge and
Corrosion Performance of Magnesium Alloy AP65 as Anode for Seawater-Activated
Battery,” Corrosion, 2012; 68(5), p. 388-397.
32. L. Wang, B. Zhang, T. Shinohara, “Corrosion behavior of AZ91 magnesium alloy in
dilute NaCl solutions,” Materials and Design, 2010; 31, p. 857-863.
33. J.E. Oxley, R.J. Ekern, K.L. Dittberner, P.J. Spellman, D.M. Larsen, “Magnesium Dry
Cells,” Proceedings of the 35th
Power Sources Symposium, IEEE, New York, 1992, p. 18.
34. M.E. Wilkie, T. . Loverude, “Reserve electric battery with combined electrode and
separator member,” U.S. Patent 3,061,659, 1962.
35. G. Inzelt, F. Scholz, Conducting Polymers: A New Era in Electrochemistry, Springer,
2008.
36. . Naarmann, “Polymers, Electrically Conducting,” Ullmann’s Encyclopedia of
Industrial Chemistry, 2000.
37. H.S. Nalwa, Handbook of Nanostructured Materials and Nanotechnology, Vol. 1,
Academic Press, 2000.
38. T.V. Vernitskaya, .N. Efimov, “Polypyrrole: a conducting polymer; its synthesis,
properties, and applications,” Russian Chemical Reviews, 1997; 66(5), p. 443

105
39. D. Chen, T. Liu, X. Zhou, W.C. Tiju, . ao, “Electrospinning fabrication of high
strength and toughness polyimide nanofiber membranes containing multiwalled carbon
nanotubes,” Journal of Physical Chemistry, 2009; 113(29), p. 9741-9748.
40. Y. Kiya, A. Iwata, T. Sarukawa, J.C. Henderson, H.D. Abruña, “Poly[dithio-2,5-(1,3,4-
thiadiazole)] (PDMcT)–poly(3,4-ethylenedioxythiophene) (PEDOT) composite cathode
for high-energy lithium/lithium-ion rechargeable batteries,” Journal of Power Sources,
2007; 173(1), p. 522-530.
41. H.R. Jung, W.J. Lee, “Ag/poly(3,4-ethylenedioxythiophene) nanocomposites as anode
materials for lithium ion battery,” Solid State Ionics, 2011; 187(1), p. 50-57.
42. L.J. er, J.L ong, C.C. Chang, “Preparation and electrochemical characterizations of
poly(3.4 dioxyethylenethiophene)/LiCoO2 composite cathode in lithium-ion battery,”
Journal of Power Sciences, 2006; 157(1), p. 457-463.
43. S. Nair, E. siao, S. . Kim, “Fabrication of electrically-conducting nonwoven porous
mats of polystyrene-polypyrrole core-shell nanofibers via electrospinning and vapor
phase polymerization,” Journal of Materials Chemistry, 2008; 18(1), p. 5155-5161.
44. J. Janata, M. Josowicz, “Conducting polymers in electronic chemical sensors,” Nature
Materials, 2003; 2(1), p. 19-24.
45. S. Geetha, C.R. Rao, M. Vijayan, D.C. Trivedi, “Biosensing and drug delivery by
polypyrrole,” Analytica chimica acta, 2006; 568(1), p. 119-125.
46. Y. Kong, C. Wang, Y. Yang, C. . Too, G.G. Wallace, “A battery composed of a
polypyrrole cathode and a magnesium alloy anode – Toward a bioelectric battery,”
Synthetic Metals, 2012; 162(1), p. 584-589.
47. A. Frenot, I.S. Chronakis, “Polymer nanofibers assembled by electrospinning,” Current
Opinion in Colloid and Interface Science, 2003; 8, p. 64-75.
48. I.S. Chronakis, “Micro-/Nano-fibers by Electrospinning Technology: Processing,
Properties, and Applications,” Micromanufacturing Engineering and Technology, 2010.
49. D. Li, Y. Xia, “Electrospinning of Nanofibers: Reinventing the Wheel?” Advanced
Materials, 2004; 16(14), p. 1151-1170.
50. S.A. Theron, E. Zussman, A.L. Yarin, “Experimental investigation of the governing
parameters in electrospinning of polymer solutions,” Polymer, 2004; 45(6), p. 2017-2030.
51. C.J. Angammana, S. . Jayaram, “Investigation of the ptimum Electric Field for a
Stable Electrospinning Process,” IEEE Industry Applications, 2012; 48(2), p. 808-815.
52. A. Baji, Y. Mai, S. Wong, M. Abtahi, P. Chen, “Electrospinning of polymer nanofibers:
Effects on oriented morphology, structures and tensile structures,” Composites Science
and Technology, 2010; 70(5), p. 703-718.
53. Z. Dong, S.J. Kennedy, Y. Wu, “Electrospinning materials for energy-related
applications and devices,” Journal of Power Sources, 2011; 196(11), p. 4886-4904.
54. S.W. Choi, S.M. Jo, W.S. Lee, Y.R. Kim, “An electrospun poly(vinylidene fluoride)
nanofibrous membrane and its battery applications,” Advanced Materials, 2003; 15(23),
p. 2027-2032.

106
55. J. Miao, M. Miyauchi, T.J. Simmons, J.S. Dordick, R.J. Linhardt, “Electrospinning of
Nanomaterials and Applications in Electronic Components and Devices,” Journal of
Nanoscience and Technology, 2010; 10(9), p. 5507-5519.
56. S. Nair, E. siao, S. . Kim, “Melt-Welding and Improved Electrical Conductivity of
Nonwoven Porous Nanofiber Mats of Poly(3,4-ethylenedioxythiophene) Grown on
Electrospun Polystyrene Fiber Template,” Chemistry of Materials, 2008; 21(1), p. 115-
121.
57. L.M. Bellan, .G. Craighead, “Applications of controlled electrospinning systems,”
Polymers for Advanced Technologies, 2010; 22(3), p. 304-309.
58. R.S. Kalyoncu, “Graphite,” U.S. Geological Survey Minerals Yearbook, 2000; p. 35.1-
35.11.
59. P.L. Walker, P.A. Thrower, Chemistry and Physics of Carbon, Vol. 8, Marcel Dekker
Inc., New York, 1973.
60. K. Kinoshita, Carbon: electrochemical and physiochemical properties, John Wiley Sons,
New York, 1988.
61. A.E. Karu, M. Beer, “Pyrolytic Formation of ighly Crystalline Graphite Films,” Journal
of Applied Physics, 1965; 37(5), p. 2179-2181.
62. www.usgs.gov
63. K. Ghanbari, M.F. Mousavi, M. Shamsipur, . Karami, “Synthesis of
polyaniline/graphite composite as a cathode of Zn-polyaniline rechargeable battery,”
Journal of Power Sources, 2007; 170(2), p. 513-519.
64. R. Balasubramanian, A. Veluchamy, N. Venkatakrishnan, R. Gangadharan,
“Electrochemical characterization of magnesium/silver chloride battery,” Journal of
Power Sources, 1995; 56(2), p. 197-199.
65. R. Balasubramanian, A. Veluchamy, P.B. Mathur, “Performance characteristics of
magnesium-silver chloride bipolar battery,” Bulletin of Electrochemistry, 1986; 2(3), p.
283.
66. K. Vuorilehto, “An environmentally friendly water-activated manganese dioxide
battery,” Journal of Applied Electrochemistry, 2003; 33(1), p. 15-21.
67. N.T. Wilburn, “Magnesium perchlorate reserve battery,” Proceedings of the 21st Annual
Power Sources Conference, US Army Electronics Command, 1967, p. 113-116.
68. .R. Knapp, A.L. Almerini, “Perchlorate Reserve Batteries,” Proceedings of the 17th
Annual Power Sources Conference, 1963, p. 125.
69. L.I. Maissel, R. Glang, Handbook of Thin Film Technology, 1st ed., McGraw-Hill, 1970.
70. Jo. Singh, F. Quli, D.E. Wolfe, J.T. Schriempf, Ja. Singh, “An verview: Electron Beam-
Physical Vapor Deposition Technology – Present and Future Applications,” Pennsylvania
State University, 1999.
71. K. Schlüter, C. Zamponi, A. Piorra, E. Quandt, “Comparison of the corrosion behaviour
of bulk and thin film magnesium alloys,” Corrosion Science, 2010; 52(1), p. 3973-3977.

107
72. F. Li, Y. Zhao, Y. Song, “Core-Shell Nanofibers: Nano Channel and Capsule by Coaxial
Electrospinning,” Nanofibers, 2010.
73. J.M. Steiner, “Electrolyte evaluation for use in green batteries,” B.S. Thesis, The
Pennsylvania State University, 2013.