development of a framework for the measurement and · figure 29 - call graphs and filters on the...
TRANSCRIPT


Development of a framework for the measurement and control of customer support services
Nuno Filipe Mesquita Carvalho
Master’s Thesis
Supervisor at FEUP: Prof. Ana Camanho
Master in Industrial Engineering and Management
2015-07-01

Development of a framework for the measurement and control of customer support services
ii
To my parents,
For their great support.

Development of a framework for the measurement and control of customer support services
iii
Abstract
This project has the main goal of developing a framework for the measurement and control of
customer support services at Farfetch, an e-commerce luxury goods company. Due to the
growth of the company and the aim to provide the best customer experience in the market, it is
necessary to increasingly use the available data to optimize the three channels used on the
process of customer support: contact form/email, chat and phone.
With this project, after an initial overview of channels and former metrics used for controlling
customer support services, the Key Performance Indicators have been redefined and new
reporting methods have been created using two Business Intelligence and Analytics software
solutions: Microsoft Power Pivot and Tableau. These reporting methods enable the analysis of
the performance of the players involved in customer support at different levels: global, by team
and individual. They also allow the verification of which channels are being underused or which
employees are being overloaded. With the new framework developed in this project, senior
management will have multiple sources of information available that can help them to manage
customer relationship and to improve customer support services. The dashboards implemented
are available and automatically configured for the players involved in the three customer
support teams, located in Porto, London and Los Angeles offices.
With the contribution of the work developed in this dissertation, the performance of the
Customer Service Department has improved significantly. In the first twelve weeks after the
implementation of the first report, the most relevant improvement is related to the increase of
the Response Rate, from 60.2% to 86.4%, despite the growth of 11.7% in the number of contacts
created. Besides this metric, the improvement has also been verified in three areas of business
performance: Operational Efficiency, Service Quality and Customer Satisfaction.

Development of a framework for the measurement and control of customer support services
iv
Desenvolvimento de um sistema para medição e controlo dos serviços de apoio ao cliente
Resumo
Este projeto tem o principal objetivo de desenvolver um sistema para medição e controlo dos
serviços de apoio ao cliente da Farfetch, uma empresa de vendas online de bens de luxo. Devido
ao crescimento da empresa e ao objetivo de proporcionar a melhor experiência ao cliente do
mercado, tornou-se necessário usar a informação disponível para otimizar os três canais usados
no processo de apoio ao cliente: formulário de contacto/email, chat e telefone.
Com a realização deste projeto, depois de uma visão inicial dos canais e métricas anteriormente
utilizadas para o controlo dos serviços de apoio ao cliente, os Indicadores de Desempenho
foram redefinidos e novos relatórios foram criados em duas plataformas de Business
Intelligence: Microsoft Power Pivot e Tableau. Os relatórios permitem a análise da performance
dos membros envolvidos no apoio ao cliente a diferentes níveis: global, por equipa e
individualmente. Também permitem verificar quais os canais que estejam a ser subutilizados e
quais os funcionários que estão a ser sobrecarregados. Com o novo sistema desenvolvido neste
projeto, a gestão de topo terá várias fontes de informação disponíveis que lhes permitirão gerir
a relação com o cliente e melhorar os serviços de apoio ao cliente. Os dashboards
implementados estão disponíveis e automaticamente configurados para os funcionários
envolvidos nas três equipas de apoio ao cliente, localizados nos escritórios do Porto, Londres e
Los Angeles.
Com a contribuição do trabalho desenvolvido neste projeto, a performance do Departamento
de Apoio ao Cliente melhorou significativamente. Nas primeiras doze semanas após a
implementação do primeiro relatório, a melhoria mais relevante está relacionada com a Taxa
de Resposta, que subiu de 60.2% para 86.4%, ainda que tenha existido um aumento de 11.7%
no número de contactos criados. Além desta métrica, a melhoria tem vindo a ser verificada em
três áreas de medição de performance: Eficiência Operacional, Qualidade do Serviço e
Satisfação do Cliente.

Development of a framework for the measurement and control of customer support services
v
Acknowledgments
I would like to give my gratitude to everyone within Farfetch involved in this project. Without
the support of all of them, the work described in this dissertation would not have been possible.
In particular, a big thank you to my supervisor at Farfetch, Sara Guerreiro, for the patience,
support, advices and sharing of her knowledge. She was always available for giving me
intelligent insight and I would like to reinforce how grateful I am for that. I would also like to
thank all my colleagues at Farfetch for the good times spent together along these months.
Also I would like to express my gratitude to all my professors at FEUP, for making me become
a better student and grow as a human being. A special mention to my supervisor at FEUP, Prof.
Ana Camanho, for the time, support and valuable comments and suggestions throughout this
dissertation.
And last, but not least, I would like to express my appreciation to my parents. This is only
possible due to their endless support, continuous care and encouragement. For them, words will
never be enough.

Development of a framework for the measurement and control of customer support services
vi
Table of Contents
1 Introduction ......................................................................................................................................... 1 1.1 Farfetch Overview ................................................................................................................................ 1
1.1.1 Farfetch Structure .............................................................................................................. 2 1.1.2 Customer Service Department ........................................................................................... 3 1.1.3 Continuous Improvement Team ......................................................................................... 4
1.2 Project Motivation ................................................................................................................................. 4 1.3 Project Goals ........................................................................................................................................ 4 1.4 Methodology ......................................................................................................................................... 5 1.5 Report Structure ................................................................................................................................... 5
2 State of the Art ................................................................................................................................... 6 2.1 Customer Service in Luxury E-Commerce ........................................................................................... 6 2.2 Performance Measurement .................................................................................................................. 7 2.3 Dashboards .......................................................................................................................................... 9 2.4 Kaizen - Continuous Improvement ..................................................................................................... 10
3 Customer Service Overview ............................................................................................................. 12 3.1 Customer Service Channels ............................................................................................................... 12
3.1.1 E-mail/Contact Form ........................................................................................................ 12 3.1.2 Phone Calls ..................................................................................................................... 14 3.1.3 Chat ................................................................................................................................. 14
3.2 Former Reporting Methods ................................................................................................................ 15 3.2.1 Former Executive Weekly Report .................................................................................... 15 3.2.2 Former Daily Team Reporting .......................................................................................... 19
3.3 Conclusions ........................................................................................................................................ 20
4 Implemented Solution....................................................................................................................... 21 4.1 Requirements Verification .................................................................................................................. 21 4.2 Executive Weekly Report ................................................................................................................... 22
4.2.1 New Key Performance Indicators .................................................................................... 22 4.2.2 Main Features .................................................................................................................. 30
4.3 Executive Weekly Dashboard ............................................................................................................ 33 4.4 Daily Dashboard ................................................................................................................................. 34
4.4.1 Metrics ............................................................................................................................. 35 4.4.2 Dashboard ....................................................................................................................... 37 4.4.3 Script for Blocks of Information Shift ................................................................................ 38 4.4.4 Main Features .................................................................................................................. 40
4.5 Daily Management Dashboard ........................................................................................................... 41 4.6 Weekly Management Dashboard ....................................................................................................... 44 4.7 Main Results ...................................................................................................................................... 46
5 Conclusions and Future Projects ..................................................................................................... 49 5.1 Future Projects ................................................................................................................................... 49
References ............................................................................................................................................ 51
APPENDIX A: Executive Weekly Report ........................................................................................ 54
APPENDIX B: Weekly Queries ....................................................................................................... 56
APPENDIX C: Daily Queries........................................................................................................... 58
APPENDIX D: Daily Management Dashboard ............................................................................... 61
APPENDIX E: Weekly Management Dashboard ........................................................................... 62

Development of a framework for the measurement and control of customer support services
vii
Acronyms
B2B – Business-to-business
B2C – Business-to-consumer
BI – Business Intelligence
CS – Customer Service
ERP – Enterprise Resource Planning
GMT – Greenwich Mean Time
IT – Information Technology
KPI – Key Performance Indicator
NPS – Net Promoter Score
SLA – Service Level Agreement
SQL – Structured Query Language
VPN – Virtual Private Network

Development of a framework for the measurement and control of customer support services
viii
List of Figures
Figure 1 - Relationship among Farfetch, Partners and Customers ............................................. 2
Figure 2 - Farfetch Organizational Diagram .............................................................................. 2
Figure 3 - Customer Service Structure ....................................................................................... 3
Figure 4 - Customer Service technologies and media richness potential ................................... 7
Figure 5 - Contact Form ........................................................................................................... 12
Figure 6 - Tickets Platform Interface ....................................................................................... 13
Figure 7 - Tickets Platform Interface - Backlog Tickets .......................................................... 13
Figure 8 - Phone Number presented on the website ................................................................. 14
Figure 9 - Customer's Chat Interface ........................................................................................ 15
Figure 10 - Chat message after the implementation of the dynamic chat ................................ 27
Figure 11 - Drill Down capability on Power Pivot ................................................................... 31
Figure 12 - Slicer by year and week ......................................................................................... 31
Figure 13 - Slicer by office ....................................................................................................... 31
Figure 14 - Example of KPI presentation columns .................................................................. 32
Figure 15 - Example of a KPI chart .......................................................................................... 32
Figure 16 - Executive Weekly Dashboard ................................................................................ 33
Figure 17 - Daily Dashboard .................................................................................................... 37
Figure 18 - Daily Dashboard: Ticket Charts Block .................................................................. 38
Figure 19 - Daily Dashboard: Detailed Ticket Charts Block ................................................... 39
Figure 20 - Daily Dashboard: Call and Chat Charts Block ...................................................... 39
Figure 21 - Drill Down assessment on Tableau ....................................................................... 40
Figure 22 - Drill Down example on Tableau ............................................................................ 40
Figure 23 - Filtering option (by office) .................................................................................... 41
Figure 24 - Calls Inbound by Language/Phone Line ................................................................ 42
Figure 25 - Calls Inbound by Hour ........................................................................................... 42
Figure 26 - Filter for Calls by Phone Line................................................................................ 42
Figure 27 - Filter for customer promise results ........................................................................ 43
Figure 28 - Escalations per Solved Tickets .............................................................................. 43
Figure 29 - Call Graphs and Filters on the Weekly Management Dashboard .......................... 45
Figure 30 - Evolution of the number of contacts generated ..................................................... 46
Figure 31 - Evolution of the Response Rate ............................................................................. 46
Figure 32 - Evolution of the percentage of Calls Inbound Answered (Gross and within customer
promise results) ........................................................................................................................ 47
Figure 33 - Evolution of the percentage of Tickets Solved with Reopens ............................... 47

Development of a framework for the measurement and control of customer support services
ix
List of Tables
Table 1 - Percentage of Orders by Country (from the beginning of 2014 onwards) ................ 26
Table 2 - New Customer Promise Hours (in Local Times) by Phone Line ............................. 26
Table 3 - New KPIs implemented, responsible and areas ........................................................ 29

Development of a framework for the measurement and control of customer support services
1
1 Introduction
Online commerce has become a very interesting business. However, the use of the Internet to
sell luxury goods is not common. While the Internet is about access, luxury is usually associated
to denying access (Pruzhansky, 2014). Therefore, it is necessary a great knowledge of the two
businesses for their successful merge.
This dissertation, developed at the Continuous Improvement Team of Farfetch, a luxury goods
e-commerce company, has the main goal of developing a framework for the measurement and
control of the customer support services. Due to the company’s target audience, it is
fundamental to guarantee the provision of an excellent customer support service.
1.1 Farfetch Overview
Farfetch is an innovative e-commerce company that brings the world’s most famous luxury
fashion boutiques to customers all over the world. Launched in 2008, Farfetch is a London
based company and it has continuously grown to become a truly global company. It currently
belongs to the restricted groups of start-up companies that have soared to a $1 billion valuation
based on fundraisings.
The network of Farfetch associated stores is composed by more than 300 boutiques all over the
world and offers customers a mix of products from over 1000 designers, providing services for
customers on every continent.
The end customer is able to shop luxury fashion goods from the most famous and influential
boutiques all over the world in a unique, safe and pleasant way. Farfetch offers a catalogue of
products gathered in one place from the most renowned brands and designers and from
boutiques such as American Rag, Biondini, L’Eclaireur, Stefania Mode and Vitkac.
Farfetch works simultaneously as an e-commerce platform and a different and extra sales
channel for its various partner boutiques. The company works as a bridge between boutiques
and end customers. The services provided by the company are related to two distinct segments:
B2B segment – represented by the boutiques which gain a very strong sales channel – and B2C
segment – represented by the customers which are able to shop luxury goods in a unique and
revolutionary way.
The service provided by Farfetch stands out from competitors by its commission based and win
win business model, in which boutiques benefit from online marketing, partner relations,
customer support services, web platform and solutions for payment handling, logistics and
warehousing.
The main advantage of the Farfetch business model is the unlikelihood of success of such a
service for a single boutique, as its high costs would be hardly worth for a single entity. Farfetch
benefits from economies of scale when providing all these services to a high number of
boutiques. Moreover, Farfetch has the advantage of providing five times more labels and items
on the website than its more direct competitors. As a result, consumers can choose from a bigger
catalogue, which is only possible because the company does not hold inventory, unlike its
competitors.
The company provides a very complete service every time a purchase is made. Its services
include Fraud check, Payment processing and Customer Service (CS) as well as Courier service
either directly from the boutique to the customer or from the customer to the boutique, in case
the return is requested and accepted.
The relationship among the three players (Farfetch, Partners and Customers) is represented on
Figure 1.

Development of a framework for the measurement and control of customer support services
2
Figure 1 - Relationship among Farfetch, Partners and Customers
Farfetch aims to change the way the world shops for fashion, conquering a leading market
position.
1.1.1 Farfetch Structure
Farfetch is currently divided in nine offices in seven countries: Brazil, China, Japan, Portugal
(Porto and Guimarães), Russia, United Kingdom and United States (Los Angeles and New
York). In total, Farfetch employs about 600 people.
Regarding the departmental division, Farfetch is divided in twelve departments: Account
Management, Business Development, Customer Service, Finance, Human Resources,
Marketing, Merchandising, Office Management, Operations, Partner Services, Production and
Technology.
This project has been developed at the Continuous Improvement Team, integrated in the
Operations Department. It is related to the improvement of Farfetch customer support services,
so this dissertation is focused on the Customer Service Department.
The organizational diagram is represented on Figure 2.
Figure 2 - Farfetch Organizational Diagram

Development of a framework for the measurement and control of customer support services
3
1.1.2 Customer Service Department
Apart from Porto office, London and Los Angeles offices also have Customer Service Teams.
There is also a Customer Service Team in the Brazilian office, but it works in a different way
following procedures that are independent from the other Customer Service Teams, like most
of the other Departments in Brazil. For this reason, the Brazilian office will be excluded from
the developments made along this project.
The ever increasing number of contacts has forced the growth of the Customer Service
Department workforce. Moreover, CS Teams are expected to be extended to the Japanese and
Russian offices until the end of 2015.
Regarding the departmental structure, it is organized as follows:
Global Manager: located in Los Angeles; responsible for taking strategic decisions
and assuring that the players within the Department keep aligned with the global
strategy of the company;
Team Managers: one located in each of the offices; responsible for assuring that
the needs of customer are being satisfied, managing staff and providing direction,
instructions and guidance to supervisors and agents;
Workforce Manager: this is a new role and the manager will be located in Porto;
responsible for creating an effective global scheduling of agents and forecasting
customer demand;
Training Coordinator: located in London; responsible for training and preparing
personnel and documenting training activities within the Department;
Supervisors: two located in each of the three offices; responsible for providing
guidance to the agents of the team and reporting to team managers, ensuring that all
agents provide a good service;
Agents: located in the three offices; responsible for interacting directly with
customers and for ensuring that each customer has a pleasant experience.
The departmental structure is represented on Figure 3.
Figure 3 - Customer Service Structure
The customer can contact Customer Service Teams through three different channels:
Email/Contact Form, Chat and Phone. These channels will be further explained in the following
chapters.
However, Customer Service Teams do not communicate uniquely with customers. Queries
often require the communication either with other internal teams or with Partner Boutiques.
These queries are usually placed by customers who have completed their purchases.
The internal interaction takes place with:
Courier Team: queries related to returns and delivery issues;
Partner Services Team: queries that require the communication with boutiques;
Production Team: queries related to sizing, photos, composition, brand, gender,
friendly name or descriptions;

Development of a framework for the measurement and control of customer support services
4
Order Support Team: queries related to the detection of fraudulent customers;
Refunds Team: queries related to processing refunds.
As a consequence of the communication with internal teams and Partner Boutiques, some of
the Customer Service Department results are affected by the performance level of these entities.
Developing ways to control and measure performance within this Department will also help to
manage future process improvements of other Farfetch Teams.
1.1.3 Continuous Improvement Team
The focus of the Continuous Improvement Team is to lead organizational-level change while
training improvement methodologies. There is an ongoing effort to improve the organization’s
services and processes, focusing on efficiency, effectiveness and flexibility.
Keeping the services provided aligned with customers’ needs enforces companies to adopt
continuous improvement strategies. Both technology and customers’ requirements evolve
continuously. In order to keep the business growth, every company should have the permanent
goal of improving both services provided and internal processes.
It uses the Kaizen approach, a Japanese method that aims to make improvements based on small
changes. The Kaizen method needs the commitment of all levels of the organization and it
highly depends on the workforce. It should continually be seeking ways to improve
performance.
Once customer support services are most of the times the only means of direct contact with
online companies, it is possible to understand the importance of applying this method within
the Customer Service Department.
1.2 Project Motivation
Due to Farfetch target audience, the company strives to deliver the best customer experience in
the market. Mainly in the luxury e-commerce market, the provision of an excellent customer
support is primordial for the success of the company.
With the growth of Farfetch and the respective increase of orders, the number of contacts
received has continuously grown. It is necessary to increasingly use the available data to
optimize the channels in the process of customer support. This is essential to align the
customers’ needs with the resources available.
It is now vital to guarantee a full control of Customer Service actions through the definition of
Key Performance Indicators. These enable monitoring all players involved in Customer
Services. Therefore, it is very important to align the specification of Key Performance
Indicators with the company business model, as well as design reporting methods that make the
relevant information available to the right users.
1.3 Project Goals
When the project started, the Key Performance Indicators were reported on a weekly and daily
basis. However, most of them were not being correctly calculated. Taking actions based on
wrong KPIs is not advisable and might be risky. Moreover, the former metrics were not
sufficient for the needs of the Customer Service department. More accurate ways of reporting,
with new types of Key Performance Indicators, were needed in order to align the levels of
Customer Service provided with the strategic goals.
After this project, with the redefinition of the Key Performance Indicators as well as the
construction of new reporting methods, all Farfetch collaborators that directly interact with
customer support should be able to assess more accurately their performance. This requires the

Development of a framework for the measurement and control of customer support services
5
creation of proactive alerts, based on dashboards, that can inform managers and users that some
channels are being unused or employees are being overloaded. Furthermore, top management
should have access to more accurately performance measures, reported in different ways and
periodicities, through the creation of Executive Reports.
The dashboards will be available for Customer Service users in all the offices with Customer
Service Teams: Porto, United Kingdom and United States. In the near future, these will also be
available in Japan and Russia. Executive Reports will be available for any Executive or
Customer Service Manager on Farfetch SharePoint.
Furthermore, these reporting methods are expected to exist as an initial development to support
future processes improvements. After this project, and with the establishment of these reporting
methods, it should be possible to better understand where current customer support service
processes fail and to work on their improvement.
1.4 Methodology
The first step defined was the identification of the former Customer Service metrics and
processes. These were critically analysed and evaluated. Afterwards, the Key Performance
Indicators were redesigned and complementary metrics were created to evaluate the level of
service. It was made an analysis to the most appropriate reporting methods. Suitable software
solutions, often involving queries to large databases, were developed to calculate the new
metrics. At the same time, new reports were designed to disseminate accurately managerial
information. Through the implementation of these reports, it should be possible to quickly and
effortlessly present the new Key Performance Indicators.
A continuous interaction with the players involved in the Customer Service was necessary in
order to establish the most appropriate Key Performance Indicators according to the information
actually available in the databases. Their requirements and suggestions were always taken into
account throughout the project.
After the implementation, a follow-up process was made in order to understand possible
improvements to the reports and dashboards created. An intense dialogue with all Customer
Service users was necessary to add and modify particular points of the reporting.
By following these steps, it was implemented an iterative process that allows to assess the needs
of the players involved in the Customer Service and to promote a culture of continuous
improvement.
1.5 Report Structure
The content of this dissertation is structured as follows:
Chapter 2 presents the state of the art of the main themes addressed – Customer Service in
Luxury E-Commerce, Performance Measurement, Dashboards and Continuous Improvement.
Chapter 3 presents an overview of the main limitations found on the indicators of customer
service originally used by Farfetch, which have motivated the execution of this project. The
reports formerly utilized for measuring customer support service level were also reviewed.
Chapter 4 presents the new solutions developed along this project. It addresses the main issues
found on the redefinition of the new Key Performance Indicators and the new types of reporting
methods proposed, including their main functionalities and characteristics. It is also made a
brief overview of the results achieved after the implementation of the reporting tools.
Chapter 5 concludes the dissertation and presents ideas for future work.

Development of a framework for the measurement and control of customer support services
6
2 State of the Art
This chapter addresses the following topics: Customer Service in Luxury E-Commerce,
Performance Measurement, Dashboards and Continuous Improvement.
2.1 Customer Service in Luxury E-Commerce
Luxury is a culture and a philosophy that requires the understanding of the business, because
its intricacies and output are essentially different from other types of goods, such as daily
consumer goods (Okonkwo, 2009). In economic terms, luxury objects are those whose
price/quality relationship is the highest of the market (Kapferer, 1997). A major issue related to
the definition and measurement of luxury thus arises from its subjective character (Kapferer
and Michaut-Denizeau, 2014).
The unique luxury characteristics, such as high price and quality, are a challenge in the
integration of luxury branding within the Internet and digital environment (Okonkwo, 2009).
There is the perception that internet sales might affect the high end image that customers attach
to luxury goods (Pruzhansky, 2014). For this reason, until recently the luxury industry showed
low commitment towards integrating advanced Internet technologies in the sector’s marketing
and overall business strategies (Okonkwo, 2009). However, nowadays the consumers require
retailers to communicate with them using the Internet. The changes in the technological
environment have been rapid and relate closely to changes in consumer behavior in terms of
how they prefer to shop, communicate and receive their deliveries (McCormick et al, 2014).
The most experienced and successful businesses in using e-commerce have realized that the
key determinants of success or failure include customer service quality (Lee and Lin, 2005).
An appropriate customer contact management is a primary determinant of end customer
perceptions of overall service quality. As such, customer contact services have a great impact
on customer satisfaction and they can be a strategic asset for the company (Froehle, 2006).
Understanding customer expectations is a prerequisite for delivering superior service
(Parasuraman et al, 1991). Managing both the technologies and the personnel needed for
providing high-quality, multichannel customer support creates a complex and persistent
operational challenge. Adding to this difficulty, it is not clear how service personnel and these
communication technologies interact to influence customer perceptions of the service being
provided (Froehle, 2006).
Regarding customer support channels, telephone calls continue to be the most frequent means
of communication, although companies are also using e-mail and chat. E-mail is defined as the
sending of text-based messages of virtually any length that can be read and responded to in an
asynchronous (nonreal-time) manner. Chat, is defined as the sending and receiving of short,
text-based messages, where the sender and recipient communicate with usually no delays and
high synchronicity (Froehle, 2006).
The three technology-based media – chat, e-mail and telephone – exist along a continuum of
increasing media richness potential based on the medium’s synchronicity and primary
communication channel (text or audio). This framework is represented on Figure 4 (Froehle,
2006).

Development of a framework for the measurement and control of customer support services
7
Figure 4 - Customer Service technologies and media richness potential
The difficulty with trying to keep customers returning online is the reason why the quality of
the offering is critical (Cox and Dale, 2001). Typically, online customers can more easily
compare alternatives than offline customers (Shankar et al, 2003). Specifically in the world of
e-commerce, the interaction between a customer and a business will usually take place with a
computer as the interface. Communication is difficult on the Internet, as the customer can only
communicate directly with the company if the website offers these kind of services (Cox and
Dale, 2001).
In customer support services, a customized service is very appreciated since the personnel can
‘give’ counsels, guidance to the customized advice, understanding the customer overall goals
and needs (Olson and Olson, 2000). This happens because automated services are not intelligent
enough. They do not allow the customer to have dialogue and ask follow-up questions or ask
for explanations (Johan and Nahid, 2000). Many customers are hesitant to complete a purchase
if they have even one unanswered question. Live support, such as phone or chat, gives
customers answers to their questions on the spot, in real-time, which increases customers’
satisfaction level (Elmorshidy, 2011).
Customer service operations are often the most visible part of an IT organization to customers.
By improving the quality of these processes, organizations can easily increase the customer
satisfaction on services and products (Jäntti and Pylkkänen, 2008). Particularly in the luxury
industry, given its special characteristics, it is vital to assure that the customers get satisfied
with the service provided.
2.2 Performance Measurement
Performance measurement is a topic which is often discussed but rarely defined. Literally, it is
the process of quantifying action (Neely et al, 1995). It is a fundamental principle of
management. The measurement of performance is important because it identifies performance
gaps between current and desired performance (Weber, 2005).
Nowadays strategies and competitive realities demand new measurement systems. There has
been a shift from treating financial figures as the foundation for performance measurement to
treating them as one among a broader set of measures. The impetus was the realization that the
traditional companies’ existing systems, which were largely financial, undercut their strategies.
(Eccles, 1990)
Key Performance Indicators, commonly known as KPIs, are quantifiable metrics which reflect
the performance of an organization in achieving its goals and objectives. They measure the
business health of the enterprise and ensure that all individuals at all levels are “marching in
step” to the same goals and strategies. They also provide the focal point for enterprise-wide
standardization, collaboration and coordination. The selection of the wrong KPIs can result in

Development of a framework for the measurement and control of customer support services
8
counter-productive behavior and sub optimized results. Although all KPIs are metrics, not all
metrics are KPIs (Bauer, 2004).
One of the main issues for organizations that have information systems is data overload, as most
of them generate some redundant performance reports. Yet another problem with the
performance measures used in many organizations is that they are rarely integrated with one
another or aligned to the business process (Neely, 1999). A key principle of performance
management is to measure what you can manage. In order to maintain and improve
performance, each function in the organization must focus on the portion of the indicators that
they influence (Weber, 2005).
Selecting the right measures is vital for effectiveness. Even more importantly, the metrics must
be built into a performance measurement system that allows individuals and groups to
understand how their behaviors and activities are fulfilling the overall corporate goals
(McNeeney, 2005). The development of these performance measurement systems can be
divided into three main phases: the design of the performance measures and the identification
of the key objectives; the implementation of the performance measures, which includes an
initial collection, collation, sorting/analyse and distribution; the use of the performance
measures to assess the implementation of the strategy and to challenge strategic assumptions
(Bourne et al, 2000).
When designing the performance measures metrics, one must have the end result in mind,
focusing on what the desired outcomes of the work processes are. This might be difficult to
accomplish since organizations do not work as a set of isolated departments, as they collaborate
with each other, so a single group does not control all the key steps. Moreover, different
departments collect different silos of information that produce metrics, originating different
opinions of company performance and limiting a common understanding of the business
behaviour (McNeeney, 2005).
For the purpose of categorisation, implementation is the phase in which systems and procedures
are put in place to collect and process the data that enable measurements to be made regularly.
This may involve computer programming to trap data already being used in the system and
present them in a more meaningful form. Some new procedures may be initiated so the
information currently not recorded is captured, and completely new initiatives may occur
(Bourne et al, 2000).
Performance measurement on customer contact services is extremely relevant since customer
services are directly provided to end customers. A good communication between them and the
company can have a large impact on end customer satisfaction. Most companies seem to miss
the important link between the employee satisfaction, service quality, customer satisfaction and
profitability (Marr and Neely, 2004). A predominant focus on efficiency may be counter-
productive when trying to satisfy the customer. For example, if the agents are being measured
on the total time spent on each contact, they might not focus on solving the customer’s problem,
but instead end the contact as quickly as possible (Tate and van der Valk, 2008).
According to Tate and van der Valk (2008) the Business Performance in Customer Services is
mostly tested in the following 4 areas: Operational Efficiency, Customer Satisfaction, Service
Quality and Employee Satisfaction. These measures are usually measured as follows:
Operational Efficiency: the most commonly efficiency indicators are number of
contacts, average times, average speeds of answer, queuing times and abandonment
rates;
Customer Satisfaction: most firms send customer satisfaction surveys to a sample of
customers, others use automated surveys after the contact with the customer is finished;
Service Quality: metrics as the compliance to standards of Service-Level Agreements
(SLA). Besides classic operational measures such as queuing time or contact time, other

Development of a framework for the measurement and control of customer support services
9
aspects frequently measured include Greeting, Communication Style, Tone of voice,
Knowledge of employee, Competence in performing the task and Close;
Employee Satisfaction: the most frequently metrics used are: Staff Turnover,
Absenteeism, Timeliness, Compliance, Friendliness and Attitude (Marr and Neely,
2004).
According to Marr and Neely (2004) in order to manage well, managers “need to ensure that
the measurements accurately portray what management wants to be measured. The effective
management of high quality voice-to-voice service delivery could be adversely affected by the
absence of a valid measurement instrument.” Moreover, the performance should not be
measured in isolation from the performance of the whole organization and this service should
be used to differentiate the product or service offered and to drive customer satisfaction.
Nowadays customer contact services allow a company to build, maintain and manage customer
relationships by solving problems and resolving complaints quickly, providing information,
answering questions and being available usually 24 hours a day. Some years ago, these services
revolved around taking orders and fielding complaints by telephone. However more
communications have appeared, such as email, person to person chat and other more advanced
technologies (Tate and van der Valk, 2008).
The use of performance measures allows the organization to assess the implementation of its
strategy. When designed and implemented carefully, the key performance indicators allow to
know precisely where to take action in order to improve performance (Weber, 2005).
“The vision of the future (mission) must be supported by the how (strategy), the what
(objectives), the focus areas (critical success factors), the metrics (KPIs) and the action plan
(key action initiatives) to realize full actuation.” (Bauer, 2004)
2.3 Dashboards
The ever increasing amount of data available has become one of the main issues for managers.
Therewith, it has emerged the need for a tool able to integrate the diverse systems of a company
into a coherent picture of where the organization is heading and what needs to be done to
improve its progress (Pauwels et al, 2009).
“A dashboard is a means of presenting information to decision-makers, with a focus on visual
communication, so that important information is consolidated and arranged on a screen in
order to be easily monitored” (Few, 2006). It is expected to improve decision making by
amplifying cognition and capitalizing on human perceptual capabilities (Yigitbasioglu and
Velcu, 2012).
Dashboards are expected to collect, summarize, and present information from multiple sources
such as ERP and BI software, giving management a quick view of how various KPIs are
performing (Yigitbasioglu and Velcu, 2012). After a quick review, management should be able
to evaluate the performance of the organization and make decisions related to the results of the
performance assessment (DeBusk et al, 2003). A dashboard can give the organization objective
feedback on the outcomes achieved, which allows managers to work on the improvement of the
drivers and processes (Wind, 2005). Moreover, dashboards allow organizations to incorporate
various performance management concepts into only one solution, preventing data overload
(Yigitbasioglu and Velcu, 2012).
A dashboard enforces consistency in measures and measurement procedures across department
and business units, facilitating the standardization of metrics across them and gathering data
that has never been gathered before. They help to monitor performance through the evaluation
of current metrics and provide support to planning, as they are related to support systems that
give management guidance on decisions. Furthermore, they facilitate communication to

Development of a framework for the measurement and control of customer support services
10
important stakeholders about what the organization values as performance, by the choice of
metrics on the dashboard (Pauwels et al, 2009).
The design features that a dashboard should have can divided into functional and visual.
Functional features are related to what the dashboard can do, such as drill down capabilities,
presentation flexibility, scenario analysis or automated alerts. The visual features refer to the
visualization of data and how efficiently and effectively information is presented to senior
management, such as single screen page or frugal use of colors. In combination, these help to
improve cognition and interpretation (Yigitbasioglu and Velcu, 2012).
Regarding functional features, these should be adapted to the dashboard’s user characteristics,
as a certain way to display information might not be the most appropriate for a specific user.
Dashboards should be interactive, allowing users to drill down information so as to obtain
further details on various performance indicators through a point and click interactivity.
Therefore, it is highly recommended that the dashboard is fully integrated with the Online
Analytical Processing system or data warehouse of an organization, so as to allow users to have
full access to granular data for dimensional analysis. The presentation flexibility allows users
to view data in different ways, slicing or filtering information. Scenario analysis provide
managers a tool for planning. Finally, automated visual alerts help to identify measures that
need immediate attention (through bright colors and/or flashing) when performance metrics go
out of range (Yigitbasioglu and Velcu, 2012).
Visual features are key aspects when designing a dashboard. The visualization aspect helps
users to assess the organization performance efficiently and effectively and make decisions
according to it. It is commonly recommended that the data presented on a dashboard can fit and
be arranged on a single screen. The use of colors to improve the process of visualization should
be used carefully, since its excessive use can distract the user and may therefore have an adverse
effect on decision making.
The information presented on a dashboard should be in line with its purposes. Unnecessary
information should be eliminated, since it adds complexity and may impair cognition and the
disregard of information. One must bear in mind the goal should be to improve and not
complicate or bias perception. However, too few features can compromise its goals. Only
selecting the right quantity of information and finding an optimal point is needed in order to
make accurate decisions. A fit might be difficult to achieve as the exact goals of the dashboard
might not be always known upfront, a good strategy will be to go with dashboard solutions that
are more flexible and allow for easy upgrades (Yigitbasioglu and Velcu, 2012).
All in all, dashboards should be simple and effective in order to allow managers to assess
performance and to enhance decision making based on the key metrics displayed. The features
discussed above will help to provide managers a dashboard that will more easily serve their
interests: “Properly created dashboards will provide the mechanism to drive effective
management and resource allocation decisions.” (Wind, 2005).
2.4 Kaizen - Continuous Improvement
Nowadays organizations are constantly challenged to deliver strategic capital assets within
highly competitive marketplaces. Businesses need metrics and analytics to help them streamline
their value generating operations. These metrics also provide tangible evidence and validation
regarding the value generated for customers (España et al, 2012). In particular, given the
specificities of the e-commerce luxury industry, it is necessary to guarantee the provision of an
excellent customer service.
The need to operate more efficiently and effectively has led to the appearance of the Kaizen
philosophy. The meaning of Kaizen is “change for the better” and more and more companies
are adopting continuous improvement management systems. It is becoming a company strategy
Development of a framework for the measurement and control of customer support services
11
dedicated to the continuous improvement of operations, a truly operational strategy based on
kaizen principles and tools (Coimbra, 2013).
It means gradual and continuous progress, increase of value, intensification and improvement
(Karkoszka and Szewieczek, 2007). It is a carefully planned, structured event to improve a
specific area of an organization in a quick and focused manner. Kaizen involves setting
standards and then continually improving those standards (Isaacs and Hellenberg, 2009).
However, Kaizen is much more than continuous improvement. Everyone within the
organization should be involved in the processes optimization (Rocha, 2014). These methods
bring together all the employees of the company, ensuring the improvement of the
communication process and the reinforcement of the feeling of membership (Titu et al, 2010).
Each and every person is stimulated to look for changes in its own work according to the motto:
“everywhere”, “everybody”, “everyday Kaizen!” (Imai, 2012).
The existence of Kaizen supposes a commitment of the organization’s workers towards the
change of the working daily habits, through a continuous and daily training and experimentation
of new practices up to the moment the new process is proved to be more efficient and gets
standardized.
According to Rocha (2014), a continuous improvement model should comprise 4 vectors: (i)
Mission and objectives – each company must define its mission and strategic goals for the
continuous improvement. (ii) Improvement tools – to improve the performance of the
organization and achieve the proposed goals (iii) Change Management – development of
innovation capabilities and the clear definition of the way and control for an effective
organization; (iv) Fundamental elements – related to the creation of a clear perception of what
is waste.
The three main Kaizen Improvement tools are the following:
Plan Do Check Act (PDCA)/Standardize Do Check Act (SDCA) cycles: iterative
four-step management methods used in business for the control and continuous
improvement of processes and products;
5S methodology: an approach for productivity, quality and safety improvement; 5S
stands for the Japanese words seiri (tidiness), seiton (orderliness), seiso (cleanliness),
seiketsu (standardization) and shitsuke (discipline);
Daily Kaizen: it is currently used by Farfetch Customer Service Teams; it consists on
a simple and short meeting (around 10 minutes) around a board in which information is
exchanged. The topics discussed in this meeting should be presented in the form of KPIs
selected according to the department needs, updated action plans and 5S audit results.
The board should be located strategically, on the passageway and close to the workplace
(Rocha, 2014).
It can take years and should be implemented everywhere, every day, and by everybody (Imai,
2012). If such a culture is achieved, it will from its inception deliver significant benefits to the
company, and these will be sustained or increased over subsequent years (Coimbra, 2013).

Development of a framework for the measurement and control of customer support services
12
3 Customer Service Overview
With the increase of the number of services provided by the Customer Service Department,
particularly in terms of languages provided, the complexity of the customer support services is
continuously growing. Adding to this, the rapid growth of Farfetch and the respective increase
of orders naturally represent more contacts to be dealt by the Customer Service agents.
Due to the company luxury nature, it is fundamental to keep the service quality on an excellent
level. More efficient and adequate methods for measuring and controlling the customer support
service level became imperative. It is necessary to optimize the channels in order to align
customers’ requirements with the resources available.
As a consequence of the ever increasing numbers and customer support services provided by
Farfetch, the number of customer support agents, who directly interact with customers, has been
subject to a year-on-year growth of more than 100%. In May 2015, there were 60 people spread
over the three offices working at the Customer Service Department. The importance of having
Customer Service Teams dispersed all over the world is related to two main reasons: the very
different time zones around the globe and the availability of Customer Service agents, within
regular working hours, speaking influential languages in terms of the market share of the
company worldwide.
3.1 Customer Service Channels
The customer can contact Farfetch through three different channels, each with a different
provider. The processes associated with each of these channels are described next.
3.1.1 E-mail/Contact Form
Every email or contact form filled in the website is received on the tickets platform, generating
a new ticket. This new ticket will trigger an exchange of messages between either CS and
customer (customers receive the messages in their inbox email accounts), CS and internal teams
- Courier, Partner Services, Production, Order Support or Refunds Teams or CS and Partner
Boutiques. The Farfetch contact form is shown on Figure 5.
Figure 5 - Contact Form

Development of a framework for the measurement and control of customer support services
13
The ticket categories, available on the contact form as “Query Type”, define the subject of the
query. The categories available are the following: feedback, order, other, payment, product,
returns, shipping, shopping, supplier and technical. These can either be filled by the customer,
when the ticket is originated via contact form, or by the agent, when the ticket is originated via
email or created by him/her.
Once a new ticket is responded, the agent fills in some mandatory fields (assignee, language
and category, in case this one is still not filled in) and marks it with a tick in case it is to be
shared with an internal team. At the end of the message, the ticket is submitted with a status
according to its current stage of resolution. The interface can be seen on Figure 6.
Figure 6 - Tickets Platform Interface
When accessing the platform, each CS agent is able to check his/her assigned tickets in backlog
and the new tickets not assigned to any agent.
Figure 7 - Tickets Platform Interface - Backlog Tickets
A ticket may be in different statuses from the moment that it is created up to the moment that it
is completely resolved and the exchange of messages ends. The different ticket statuses are
explained in detail:
New: a ticket not assigned to any agent and, consequently, without an answer from a
CS agent;
Pending: a backlog ticket assigned to an agent and not solved because the agent is
waiting for the sender answer;
On-Hold: a backlog ticket assigned to an agent and not solved because he/she is waiting
for an internal answer in order to be able to answer the sender;

Development of a framework for the measurement and control of customer support services
14
Solved: a ticket that is expected to have the exchange of messages ended since the
situation is resolved;
Open: a backlog ticket assigned to an agent, waiting for his/her action. These tickets
represent the issues being worked on;
Closed: a ticket that keeps its status as solved for more than 30 days becomes
automatically closed. From this moment on, it is not possible to exchange messages
through this ticket.
Although Courier, Partner Services and Production Teams have their ticket accounts, the
Customer Service account is shared with Order Support and Refunds Teams. The account
concept is important as a ticket shared between two distinct accounts does not have mandatorily
the same status in both. Furthermore, the ticket ID (related to the ticket reference) is also
different. The statuses mentioned further in this dissertation refer to the CS account.
3.1.2 Phone Calls
The phone calls provider records all the data related to calls, whether inbound or outbound.
Inbound calls take place when customers call Farfetch through the phone number available on
the website. In contrast, outbound calls are the ones when a CS agent calls the customer, in
cases when the contact is requested to clarify a query.
Farfetch provides a specific version of the website containing, among other features, a specific
phone number, according to the customer’s IP Address region. By associating a version of the
website to a specific language and phone line, it is possible to have the right agents available
for the right phone lines at the right times.
An example of the phone number displayed on the website is represented on Figure 8.
Figure 8 - Phone Number presented on the website
The hours presented on Figure 8 are related to the times when Farfetch promises to have agents
available to answer phone calls. Before this project, Farfetch used to promise agents available
at hours when there were no agents connected for such languages and phone lines in the offices.
In order to manage customers’ expectations, it is vital to assure that the process of allocating
personnel takes into account the promises mentioned online, adjusting either the online
information or the hours covered by agents on duty. With this work, the hours displayed on the
portal have been redefined and the agents are currently being allocated accordingly.
3.1.3 Chat
With chat, Farfetch is able to offer a written real time support channel. Customers can find the
chat button through the various contact points on the portal and, clicking on it, a pop up window
opens. In case agents are available, the conversation customer–agent starts. CS agents answer
these chats on the provider’s platform, which allows to keep a history of previous chats
messages as well as metrics such as agent, duration or chat status.
Unlike phone calls, the provider does not allow the identification of the customer region and a
chat can be answered by any available agent. The chat interface as seen by the customer is
represented on Figure 9.

Development of a framework for the measurement and control of customer support services
15
Figure 9 - Customer's Chat Interface
A chat may have one of the following statuses, as defined by the provider:
Unavailable: an attempt by a visitor to initiate a chat when no agents are available;
Abandoned: a chat click by a customer that abandons it before the chat starts;
Blocked: a visitor whose IP Address is blocked to access Farfetch chat;
Unanswered: a chat not responded by an agent, when at least one of them was
available;
Answered: a chat responded by an agent.
Like phone calls, each chat answered generates a new manually created ticket with the same
purpose than the ones created by phone calls.
3.2 Former Reporting Methods
Before this project, Customer Service metrics were reported weekly for executives and team
managers and daily, only through ticket metrics, for team managers, supervisors and agents, on
the Daily Kaizen Team meetings. However, most of the metrics used were not being correctly
calculated, giving a wrong perception of the service level.
Moreover, the level of detail of the former reporting methods did not meet current requirements.
Executives and Customer Service managers did not have sufficient reporting methods to be able
to manage appropriately the customer relationship and increase the level of service provided,
according to the target quality levels required by the e-commerce luxury industry.
3.2.1 Former Executive Weekly Report
The metrics available in the original weekly reports were calculated in Structured Query
Language (SQL), which was possible due to the providers’ integrations with SQL Server
Management Studio. They allow to have all the data related to the three providers on Farfetch
databases and easily select and manipulate the desired information. The indicators were
classified in four different categories: General Metrics, Tickets, Calls and Chats.

Development of a framework for the measurement and control of customer support services
16
General Metrics
The KPIs related to general metrics are also relevant for other Farfetch departments apart from
the Customer Service. They show how well the company is performing in various areas, such
as technology or operations. The metrics in use were the following:
Total Contacts: The total number of contacts was calculated based on the sum of the
number of tickets created, the number of chats answered and the number of calls
answered (inbound or outbound). As such, this metric failed for combining contacts
solved (chats and calls answered) and contacts created (tickets not mandatorily solved).
Total contacts was calculated as follows:
𝑇𝑜𝑡𝑎𝑙 𝐶𝑜𝑛𝑡𝑎𝑐𝑡𝑠 = ∑ 𝑇𝑖𝑐𝑘𝑒𝑡𝑠 𝐶𝑟𝑒𝑎𝑡𝑒𝑑 + ∑ 𝐶ℎ𝑎𝑡𝑠 𝐴𝑛𝑠𝑤𝑒𝑟𝑒𝑑 + ∑ 𝐶𝑎𝑙𝑙𝑠
Contacts per Order: The Contacts per Order was calculated as the Total Contacts,
above explained, over the Number of Orders, for the same period of time. The formula
is represented below:
𝐶𝑜𝑛𝑡𝑎𝑐𝑡𝑠 𝑝𝑒𝑟 𝑂𝑟𝑑𝑒𝑟 =∑ 𝑇𝑖𝑐𝑘𝑒𝑡𝑠 𝐶𝑟𝑒𝑎𝑡𝑒𝑑 + ∑ 𝐶ℎ𝑎𝑡𝑠 𝐴𝑛𝑠𝑤𝑒𝑟𝑒𝑑 + ∑ 𝐶𝑎𝑙𝑙𝑠
∑ 𝑂𝑟𝑑𝑒𝑟𝑠
Net Promoter Score (NPS): The Net Promoter Score is a management tool metric to
measure customer loyalty and it is based on the satisfaction of the customer after
completing a purchase. After receiving the purchase, the customer receives an email
with a form containing 2 questions about how likely the customer would be to
recommend both Farfetch and Boutique in a 0-10 scale (0 for not likely at all and 10 for
extremely likely). The first question is used to calculate NPS Farfetch, as follows:
𝑁𝑃𝑆 = % 𝑃𝑟𝑜𝑚𝑜𝑡𝑒𝑟𝑠 − % 𝐷𝑒𝑡𝑟𝑎𝑐𝑡𝑜𝑟𝑠
Answers between 0 and 6 represent a “Detractor”, 7 and 8 represent a “Passive” and 9
and 10 represent a “Promoter”. The main goal of NPS Farfetch indicator is to minimize
the number of Detractors.
Tickets
The KPIs related to tickets included the results from Order Support and Refunds Teams.
Besides this, they also included tickets created by agents, associated to the tickets created to
follow up chats and calls conversations. These contacts will be counted on chats and calls
metrics and, for this reason, should be excluded from the tickets calculations.
According to Tate and van der Valk (2008), most of these KPIs are related to Operational
Efficiency, with the exception of the Percentage of Tickets Replied in SLA (<8h), which is
related to Service Quality, and the Satisfaction Rating, which is related to Customer
Satisfaction. The KPIs were the following:
Tickets Solved as a % of Created Tickets: This metric was calculated as the ratio
between the number of tickets solved and the tickets created within the selected week,
as follows:
𝑇𝑖𝑐𝑘𝑒𝑡𝑠 𝑆𝑜𝑙𝑣𝑒𝑑 𝑎𝑠 𝑎 % 𝑜𝑓 𝐶𝑟𝑒𝑎𝑡𝑒𝑑 𝑇𝑖𝑐𝑘𝑒𝑡𝑠 = 𝑇𝑖𝑐𝑘𝑒𝑡𝑠 𝑆𝑜𝑙𝑣𝑒𝑑
𝑇𝑖𝑐𝑘𝑒𝑡𝑠 𝐶𝑟𝑒𝑎𝑡𝑒𝑑𝑥 100%

Development of a framework for the measurement and control of customer support services
17
Based on this metric, it is not evident the number of tickets solved and created. Due to
the reduced relevance of this percentage, this indicator was not included in the new
report.
% Tickets Replied in SLA (<8h): The Service Level Agreement (SLA) has been
defined as to respond to 80% of the tickets in less than 8 hours. This KPI was calculated
as the ratio between the tickets replied in less than 8 hours and the total tickets replied,
as follows:
% 𝑇𝑖𝑐𝑘𝑒𝑡𝑠 𝑅𝑒𝑝𝑙𝑖𝑒𝑑 𝑖𝑛 𝑆𝐿𝐴 (< 8ℎ) =𝑇𝑖𝑐𝑘𝑒𝑡𝑠 𝑅𝑒𝑝𝑙𝑖𝑒𝑑 𝑖𝑛 𝑆𝐿𝐴 (< 8ℎ)
𝑇𝑖𝑐𝑘𝑒𝑡𝑠 𝑅𝑒𝑝𝑙𝑖𝑒𝑑 𝑥 100%
% One Touch Tickets: These tickets represent the tickets solved at the first time the
agent went over the ticket, representing a service quality metric. This metric was
calculated as the ratio between the tickets solved with 0 or 1 replies and the total tickets
solved.
% 𝑂𝑛𝑒 𝑇𝑜𝑢𝑐ℎ 𝑇𝑖𝑐𝑘𝑒𝑡𝑠 =𝑇𝑖𝑐𝑘𝑒𝑡𝑠 𝑆𝑜𝑙𝑣𝑒𝑑 𝑖𝑛 𝑂𝑛𝑒 𝑇𝑜𝑢𝑐ℎ
𝑇𝑖𝑐𝑘𝑒𝑡𝑠 𝑆𝑜𝑙𝑣𝑒𝑑 𝑥 100%
% Tickets Solved in One Hour: This metric represents the ratio between the tickets
that have been resolved in less than one hour - from the moment of creation to the
moment of resolution - and the total tickets solved. The formula was the following:
% 𝑇𝑖𝑐𝑘𝑒𝑡𝑠 𝑆𝑜𝑙𝑣𝑒𝑑 𝑖𝑛 𝑂𝑛𝑒 𝐻𝑜𝑢𝑟 =𝑇𝑖𝑐𝑘𝑒𝑡𝑠 𝑆𝑜𝑙𝑣𝑒𝑑 𝑖𝑛 𝑂𝑛𝑒 𝐻𝑜𝑢𝑟
𝑇𝑖𝑐𝑘𝑒𝑡𝑠 𝑆𝑜𝑙𝑣𝑒𝑑 𝑥 100%
Once this does not constitute an established target and due to the value of this ratio, this
metric was not considered relevant. As thus, it was excluded from the new report.
Satisfaction Rating: After a ticket is solved for the first time by the agent, the customer
automatically receives an email containing a form to give feedback to the support
service as “good” or “bad”. This metric was calculated as the ratio between the “good”
reviews and the total reviews. It was calculated as follows:
𝑆𝑎𝑡𝑖𝑠𝑓𝑎𝑐𝑡𝑖𝑜𝑛 𝑅𝑎𝑡𝑖𝑛𝑔 =𝑇𝑖𝑐𝑘𝑒𝑡𝑠 "𝑔𝑜𝑜𝑑" 𝑅𝑒𝑣𝑖𝑒𝑤𝑒𝑑
𝑇𝑖𝑐𝑘𝑒𝑡𝑠 𝑅𝑒𝑣𝑖𝑒𝑤𝑒𝑑 𝑥 100%
Average Full Resolution Time (Hours): The full resolution time represents the time
spent from the moment of creation to the moment of resolution of a ticket. The average
full resolution time was calculated as the ratio between the sum of the full resolution
times of the Tickets Solved and the total Tickets Solved, as follows:
𝐴𝑣𝑒𝑟𝑎𝑔𝑒 𝐹𝑢𝑙𝑙 𝑅𝑒𝑠𝑜𝑙𝑢𝑡𝑖𝑜𝑛 𝑇𝑖𝑚𝑒 (ℎ𝑜𝑢𝑟𝑠) =∑ 𝐹𝑢𝑙𝑙 𝑅𝑒𝑠𝑜𝑙𝑢𝑡𝑖𝑜𝑛 𝑇𝑖𝑚𝑒 𝑇𝑖𝑐𝑘𝑒𝑡𝑠 𝑆𝑜𝑙𝑣𝑒𝑑
𝑇𝑖𝑐𝑘𝑒𝑡𝑠 𝑆𝑜𝑙𝑣𝑒𝑑
% Ticket Categories: The unique breakdown by category was related to the percentage
that each one of them represented in terms of the number of Tickets Solved. This
breakdown give an idea of the type of queries more and less solicited. It was calculated
as follows:
% 𝑇𝑖𝑐𝑘𝑒𝑡 𝐶𝑎𝑡𝑒𝑔𝑜𝑟𝑖𝑒𝑠 =𝑇𝑖𝑐𝑘𝑒𝑡𝑠 𝑆𝑜𝑙𝑣𝑒𝑑 (𝐶𝑎𝑡𝑒𝑔𝑜𝑟𝑦 𝑥)
𝑇𝑖𝑐𝑘𝑒𝑡𝑠 𝑆𝑜𝑙𝑣𝑒𝑑 𝑥 100%

Development of a framework for the measurement and control of customer support services
18
Calls
The metrics related to calls were only reported on a weekly basis, every Monday. All the
measures referred to Operational Efficiency aspects, and were the following:
Total Calls: This metric was calculated as the sum of the calls, inbound or outbound,
answered or not answered. The formula was calculated as follows:
𝑇𝑜𝑡𝑎𝑙 𝐶𝑎𝑙𝑙𝑠 = ∑ 𝐶𝑎𝑙𝑙𝑠
Total Calls Inbound: This metric was calculated as the sum of the calls received by
agents. It was calculated as:
𝑇𝑜𝑡𝑎𝑙 𝐶𝑎𝑙𝑙𝑠 𝐼𝑛𝑏𝑜𝑢𝑛𝑑 = ∑ 𝐶𝑎𝑙𝑙𝑠 (𝐶𝑎𝑙𝑙𝐷𝑖𝑟𝑒𝑐𝑡𝑖𝑜𝑛 = 𝐼𝑛𝑏𝑜𝑢𝑛𝑑)
Total Calls Outbound: The total calls outbound was calculated as the sum of the calls
made by agents, when the contact to the customer was required. The formula was
represented as follows:
𝑇𝑜𝑡𝑎𝑙 𝐶𝑎𝑙𝑙𝑠 𝑂𝑢𝑡𝑏𝑜𝑢𝑛𝑑 = ∑ 𝐶𝑎𝑙𝑙𝑠 (𝐶𝑎𝑙𝑙𝐷𝑖𝑟𝑒𝑐𝑡𝑖𝑜𝑛 = 𝑂𝑢𝑡𝑏𝑜𝑢𝑛𝑑)
% Calls Answered: This percentage was calculated as the ratio between the calls
answered, either inbound or outbound, and the total calls, as follows:
% 𝐶𝑎𝑙𝑙𝑠 𝐴𝑛𝑠𝑤𝑒𝑟𝑒𝑑 =∑ 𝐶𝑎𝑙𝑙𝑠 (𝐶𝑎𝑙𝑙𝐶𝑜𝑛𝑛𝑒𝑐𝑡𝑒𝑑 = 𝑌𝑒𝑠)
∑ 𝐶𝑎𝑙𝑙𝑠
Average Call Duration: The average call duration was calculated as the ratio between
the sum of the calls answered durations and the total calls answered.
𝐴𝑣𝑒𝑟𝑎𝑔𝑒 𝐶𝑎𝑙𝑙 𝐷𝑢𝑟𝑎𝑡𝑖𝑜𝑛 =∑ 𝐶𝑎𝑙𝑙𝑠 𝐷𝑢𝑟𝑎𝑡𝑖𝑜𝑛 (𝐶𝑎𝑙𝑙𝐶𝑜𝑛𝑛𝑒𝑐𝑡𝑒𝑑 = 𝑌𝑒𝑠)
∑ 𝐶𝑎𝑙𝑙𝑠 (𝐶𝑎𝑙𝑙𝐶𝑜𝑛𝑛𝑒𝑐𝑡𝑒𝑑 = 𝑌𝑒𝑠)
Due to their different purposes, it is not desirable to aggregate both inbound and outbound calls
for KPIs calculations, such as the % Calls Answered. Furthermore, outbound calls, answered
or not answered, do not depend on the performance of the agents. For these reasons, it does not
make sense to aggregate the two different types of calls.
Additionally, and similarly to tickets, Order Support and Refunds Teams results were being
included on these metrics and, therefore, distorting actual CS results.
Taking into account that there are various phone lines, with different workloads and trends
associated, it will be important to have means available to measure and control each one of
them. Therefore, with the design of a tool that allows this type of refinement, it should be
possible to improve the process of the alignment of resources.

Development of a framework for the measurement and control of customer support services
19
Chats
Regarding chats, there were only three metrics available, all related to Operational Efficiency
aspects. Similarly to calls, these indicators were only reported on a weekly basis, so it was
impossible to evaluate the performance of the customer support provided on this channel in a
shorter term. The metrics were the following:
Total Clicks: The total clicks represented the total customers’ attempts to start a chat,
regardless of being answered or not. This KPI was calculated as follows:
𝑇𝑜𝑡𝑎𝑙 𝐶𝑙𝑖𝑐𝑘𝑠 = ∑ 𝐶𝑙𝑖𝑐𝑘𝑠
Total Chats Answered: This KPI represented the total chats that had been answered.
It was represented as:
𝑇𝑜𝑡𝑎𝑙 𝐶ℎ𝑎𝑡𝑠 𝐴𝑛𝑠𝑤𝑒𝑟𝑒𝑑 = ∑ 𝐶ℎ𝑎𝑡𝑠 𝐴𝑛𝑠𝑤𝑒𝑟𝑒𝑑
% Chats Answered: This metric was calculated as the ratio between chats answered
and total clicks. The formula was represented as follows:
% 𝐶ℎ𝑎𝑡𝑠 𝐴𝑛𝑠𝑤𝑒𝑟𝑒𝑑 =∑ 𝐶ℎ𝑎𝑡𝑠 𝐴𝑛𝑠𝑤𝑒𝑟𝑒𝑑
∑ 𝐶𝑙𝑖𝑐𝑘𝑠 𝑥 100%
Based on these metrics, it was not possible to understand the reasons for having unanswered
chats. One chat not answered may occur for three reasons: no agents at the office, no agents
answering chats or agents busy chatting with other customers.
The only way that top management had to assess performance was through this report. It was
not possible to assess daily results, as there was not available a visual tool (such as a dashboard)
computed on a daily basis. Furthermore, these indicators were not divided by teams, so the
values presented could not provide information of the workload for each CS team. For that
reason, it was difficult to develop enhanced methods for resource allocation.
3.2.2 Former Daily Team Reporting
For the Daily Kaizen Team meetings, attended by team managers, supervisors and agents, the
results were extracted by team managers or supervisors from the BI software platform
integrated with the tickets provider. The metrics evaluated on the daily meetings, within each
team, were only related to tickets. These ones were written on a board and discussed at the
meetings.
The KPIs reported were the following:
Solved Tickets: total tickets solved by the team;
Assigned Tickets: total tickets previously “New” assigned to the team;
Tickets Replied in SLA (<8h): total tickets replied in SLA by the team,, based on
tickets created;
Satisfaction Rate: the percentage of tickets “good” reviewed over the total tickets
reviewed solved by the team;
New Tickets: number of new tickets not assigned to any agent;
Assigned Tickets in Backlog: number of assigned tickets in backlog (open, pending
and on-hold) by the team.

Development of a framework for the measurement and control of customer support services
20
According to Tate and van der Valk (2008), these KPIs cover the following areas: Operational
Efficiency (Solved Tickets, Assigned Tickets, New Tickets and Assigned Tickets in Backlog),
Customer Satisfaction (Satisfaction Rate) and Service Quality (Tickets Replied in SLA).
Team numbers were posteriorly compared to the global numbers in order to have an idea of the
percentages that each team represented in terms of results achieved. Once again, the global
numbers included the results for Order Support and Refunds teams, which were distorting CS
metrics.
Daily Kaizen meetings were the only way for agents and supervisors to know their teams’
performances. There was not a comparison between teams (only team vs. global and distorted
by other teams results) or between agents. Apart from this, the metrics were uniquely related to
tickets. There was the need for a tool that allowed the gathering of information in a single
solution and the visualization of data through various refinements. With this type of tool, it
would be possible to take actions based on alerts whenever results present eminent or existing
problems.
3.3 Conclusions
The first issue found on the previous reporting was the inaccuracy of the data presented on both
Executive Weekly Report and Daily Team meetings. It is crucial to have the right information
when looking at KPIs. The measurement of the wrong KPIs, as well as their wrong calculations,
can result in counter-productive behavior.
The metrics available were not enough to address the current Customer Service needs. Both the
Executive Weekly Report and the Daily Team metrics did not allow an immediate evaluation
of performance. Furthermore, the information was very limited for the different players
involved in the Customer Service. Executives did not have available a visual tool and the
performance was only reported on a weekly basis. Moreover, data refinements, such as results
per team, were not possible for team managers. Agents and supervisors only had available
distorted daily ticket results. It was not possible to assess individual performances and the KPIs
measured were insufficient for the type of analysis required at the Daily Kaizen Team meetings.
After the analysis of the existing KPIs, it was not easy to understand what actually took place
in each of the channels. Given that, there was the clear need to improve the performance
evaluation, both in terms of KPIs and presentation methods. It was necessary the identification
and measurement of complementary performance indicators to give a more comprehensive
view of performance in each one of the channels and the development of methods of
presentation with multiple refinement options. These developments should allow the
improvement of performance of the Customer Service Department at all levels, particularly in
terms of Operational Efficiency, Service Level and Customer Satisfaction.

Development of a framework for the measurement and control of customer support services
21
4 Implemented Solution
4.1 Requirements Verification
The design phase started with the verification of requirements, both from meetings with
Customer Service members (from team managers to agents) and with executives, as well as
from the analysis of existing processes. This work led to the development of the following types
of reporting approaches:
1. Executive Weekly Report: reconstruction of the former report in terms of SQL queries
and KPIs. This report is sent on a weekly basis to executives and CS managers;
2. Executive Weekly Dashboard: similar to the previous one in terms of KPIs,
summarizing the main metrics on a dashboard for executives;
3. Daily Dashboard: implementation of a dashboard on Tableau with daily metrics for
the three teams;
4. Daily Management Dashboard: implementation of a management version of the Daily
Dashboard;
5. Weekly Management Dashboard: implementation of a weekly version similar to the
Daily Management Dashboard, with various options for data refinement.
These reports enable the different players of the Customer Service to conduct performance
assessments covering three different areas: Operational Efficiency, Customer Satisfaction and
Service Quality. According to the classification proposed by Tate and van der Valk (2008), the
only area that is not covered by these reporting tools is Employee Satisfaction, which is
measured through surveys sent by the Human Resources Department to every employee. This
is done twice a year, and discussed in performance review meetings.
As mentioned previously, new teams in the Japanese and Russian offices will be in operation
until the end of 2015. The reports and dashboards have been designed in a way that
contemplates this fact, so only small changes will be necessary in order to adapt them to future
needs.
Taking into account the software platforms for Business Intelligence and Analytics used at
Farfetch and the requirements identified, the two software solutions chosen were Microsoft
Excel Power Pivot and Tableau. Both solutions allow to import data directly via queries in SQL
language, through their integrations with SQL Server. Moreover, both allow having the files
available on Farfetch Intranet, which can also be accessed from outside Farfetch via VPN
connection, through Microsoft SharePoint and Tableau Server.
The main functionality requirements are listed next. All can be fulfilled by the two software
solutions proposed.
Automatic data refreshment
Drill Down capability
Filtering capability
Integrated alert system
Data Security
Different levels of access
Access outside Farfetch network
Power Pivot was selected for implementing reports with detailed KPIs and big amounts of
information, as it is able to process and aggregate easily millions of rows of data. As such, it
was chosen to implement the Executive Weekly Report.

Development of a framework for the measurement and control of customer support services
22
Tableau’s data visualization capabilities determined its choice for the creation of daily/weekly
dashboards for the teams, management and executives.
4.2 Executive Weekly Report
The first report implemented was the Executive Weekly Report for executives and Customer
Service managers. The first phase was the redesign of the Key Performance Indicators.
Afterwards, once most of the SQL queries were not being correctly calculated, these were
rewritten.
This report is automatically updated every Monday, the beginning day of a CS week, showing
the previous week metrics. The goal is to provide executives and Customer Service managers
a tool to quickly assess performance covering three main areas: Operational Efficiency,
Customer Satisfaction and Service Quality.
4.2.1 New Key Performance Indicators
Tickets
All the KPIs exclude the tickets created by agents, related to the ones created to follow up calls
and chats conversations. These contacts will only be counted on calls and chats metrics. The
KPIs included in the new report are the following:
Tickets Solved: It represents the total number of tickets solved during the week. Its
formula is represented as follows:
𝑇𝑖𝑐𝑘𝑒𝑡𝑠 𝑆𝑜𝑙𝑣𝑒𝑑 = ∑ 𝑇𝑖𝑐𝑘𝑒𝑡𝑠 (𝑆𝑡𝑎𝑡𝑢𝑠 = 𝑆𝑜𝑙𝑣𝑒𝑑)
Previously, all the metrics related to tickets were represented as percentages. As such,
it was verified the need of a KPI that represented ticket occurrences through real
numbers.
% One Touch Tickets: This KPI has transited from the former report.
% Tickets Solved with Reopens: When a ticket is solved, and if no more than 30 days
have spent from that moment, it can be reopen. This occurs when the agent considers
the subject ended and the receiver still answers the ticket. This KPI was implemented
to control Service Quality.
The goal is to minimize this percentage, so that agents only solve tickets when queries
are completely clarified. It is represented as:
% 𝑇𝑖𝑐𝑘𝑒𝑡𝑠 𝑆𝑜𝑙𝑣𝑒𝑑 𝑤𝑖𝑡ℎ 𝑅𝑒𝑜𝑝𝑒𝑛𝑠 = 𝑇𝑖𝑐𝑘𝑒𝑡𝑠 𝑆𝑜𝑙𝑣𝑒𝑑 (𝑅𝑒𝑜𝑝𝑒𝑛𝑠 ≥ 1)
𝑇𝑖𝑐𝑘𝑒𝑡𝑠 𝑆𝑜𝑙𝑣𝑒𝑑
Average Full Resolution Hours: This KPI has transited from the former report.
% Satisfaction Rate: This KPI has transited from the former report.

Development of a framework for the measurement and control of customer support services
23
Satisfaction Survey Response Rate: Although there was already a KPI related to the
satisfaction rate, there was no measurement concerning the percentage of tickets
reviewed over the total tickets solved. This is a Customer Satisfaction KPI and it is
calculated as follows:
𝑆𝑎𝑡𝑖𝑠𝑓𝑎𝑐𝑡𝑖𝑜𝑛 𝑆𝑢𝑟𝑣𝑒𝑦 𝑅𝑒𝑠𝑝𝑜𝑛𝑠𝑒 𝑅𝑎𝑡𝑒 =𝑇𝑖𝑐𝑘𝑒𝑡𝑠 𝑅𝑒𝑣𝑖𝑒𝑤𝑒𝑑
𝑇𝑖𝑐𝑘𝑒𝑡𝑠 𝑆𝑜𝑙𝑣𝑒𝑑 𝑥 100%
Breakdown of Ticket Categories: Previously, the unique KPI breakdown was related
to the percentage of tickets solved by category. However, there was no evidence of the
breakdown through real numbers. This KPI is calculated as follows:
𝑇𝑖𝑐𝑘𝑒𝑡𝑠 𝑆𝑜𝑙𝑣𝑒𝑑 (𝐶𝑎𝑡𝑒𝑔𝑜𝑟𝑦 𝑥) = ∑ 𝑇𝑖𝑐𝑘𝑒𝑡𝑠 (𝑆𝑡𝑎𝑡𝑢𝑠 = 𝑆𝑜𝑙𝑣𝑒𝑑 𝑎𝑛𝑑 𝐶𝑎𝑡𝑒𝑔𝑜𝑟𝑦 𝑥)
Average Full Resolution by Category (Hours): Complementary to the previous KPI,
it has been created a breakdown related to the average full resolution hours by category.
Topics that require communication with other teams will most likely have higher
resolution times than the most common and easily resolved ones. The formula is
represented as follows:
𝐴𝑣𝑒𝑟𝑎𝑔𝑒 𝐹𝑢𝑙𝑙 𝑅𝑒𝑠𝑜𝑙𝑢𝑡𝑖𝑜𝑛 (𝐶𝑎𝑡𝑒𝑔𝑜𝑟𝑦 𝑥) =∑ 𝐹𝑢𝑙𝑙 𝑅𝑒𝑠𝑜𝑙𝑢𝑡𝑖𝑜𝑛 𝑇𝑖𝑐𝑘𝑒𝑡𝑠 𝑆𝑜𝑙𝑣𝑒𝑑 (𝐶𝑎𝑡𝑒𝑔𝑜𝑟𝑦 𝑥)
𝑇𝑖𝑐𝑘𝑒𝑡𝑠 𝑆𝑜𝑙𝑣𝑒𝑑 (𝐶𝑎𝑡𝑒𝑔𝑜𝑟𝑦 𝑥)
Tickets Created: Similarly to the Tickets Solved KPI, this value was not being directly
measured. It is relevant for forecasts and identification of trends. The formula is
represented as:
𝑇𝑖𝑐𝑘𝑒𝑡𝑠 𝐶𝑟𝑒𝑎𝑡𝑒𝑑 = ∑ 𝑇𝑖𝑐𝑘𝑒𝑡𝑠 (𝐶𝑟𝑒𝑎𝑡𝑒𝑑𝐴𝑡 𝑏𝑒𝑡𝑤𝑒𝑒𝑛 ′𝑆𝑡𝑎𝑟𝑡𝐷𝑎𝑦′ 𝑎𝑛𝑑 ′𝐸𝑛𝑑𝐷𝑎𝑦′)
% Tickets Replied in SLA (<8h): This KPI has transited from the former report.
% Tickets Created with Reopens: This Service Quality KPI measures the percentage
of tickets created which have already been reopen. These represent tickets with a short
duration that have been solved, most likely at the first reply. It is calculated as follows:
% 𝑇𝑖𝑐𝑘𝑒𝑡𝑠 𝐶𝑟𝑒𝑎𝑡𝑒𝑑 𝑤𝑖𝑡ℎ 𝑅𝑒𝑜𝑝𝑒𝑛𝑠 =𝑇𝑖𝑐𝑘𝑒𝑡𝑠 𝐶𝑟𝑒𝑎𝑡𝑒𝑑 (𝑅𝑒𝑜𝑝𝑒𝑛𝑠 ≥ 1)
𝑇𝑖𝑐𝑘𝑒𝑡𝑠 𝐶𝑟𝑒𝑎𝑡𝑒𝑑
Tickets Carryover: This number represents all the backlog tickets (open, pending or
on-hold) and all the new tickets that had already been created at the moment of the
previous report and that have not been solved at the moment of the new report. In a
weekly perspective, these are the tickets carried unsolved from the previous weeks,
since they have been created more than one week ago. This is a relevant concept to
calculate the weekly workload. It is calculated as:
𝑇𝑖𝑐𝑘𝑒𝑡𝑠 𝐶𝑎𝑟𝑟𝑦𝑜𝑣𝑒𝑟 = ∑ 𝑇𝑖𝑐𝑘𝑒𝑡𝑠𝐶𝑎𝑟𝑟𝑦𝑜𝑣𝑒𝑟 (𝐸𝑥𝑡𝑟𝑎𝑐𝑡𝑖𝑜𝑛𝐷𝑎𝑡𝑒 = ′𝐶𝑢𝑟𝑟𝑒𝑛𝑡𝐷𝑎𝑦′)
For this, it has been created a static table on SQL Server that every Monday extracts
these tickets. The goal is to have as little carryover as possible, since these ones
represent the oldest tickets in backlog.

Development of a framework for the measurement and control of customer support services
24
Tickets Carryover – Range: It was created a breakdown by duration range (1-2, 2-3,
3-4 or >=4 weeks), from the moment of creation to the current moment, in addition to
the previous KPI. With this KPI is possible to realize the number of tickets carryover
according to their duration times. It is calculated as follows:
𝑇𝑖𝑐𝑘𝑒𝑡𝑠 𝐶𝑎𝑟𝑟𝑦𝑜𝑣𝑒𝑟 (𝑅𝑎𝑛𝑔𝑒 𝑥 − 𝑦) = ∑ 𝑇𝑖𝑐𝑘𝑒𝑡𝑠 𝐶𝑎𝑟𝑟𝑦𝑜𝑣𝑒𝑟 (𝐷𝑢𝑟𝑎𝑡𝑖𝑜𝑛 𝑏𝑒𝑡𝑤𝑒𝑒𝑛 𝑥 − 𝑦 )
% Tickets Carryover with Reopens: This metric represents the percentage of tickets
carryover that have been reopen and it is also a service quality KPI. Typically, these
ones should be tickets that are the result of conversations within teams. It is represented
as follows:
% 𝑇𝑖𝑐𝑘𝑒𝑡𝑠 𝐶𝑎𝑟𝑟𝑦𝑜𝑣𝑒𝑟 𝑤𝑖𝑡ℎ 𝑅𝑒𝑜𝑝𝑒𝑛𝑠 =𝑇𝑖𝑐𝑘𝑒𝑡𝑠 𝐶𝑎𝑟𝑟𝑦𝑜𝑣𝑒𝑟 (𝑅𝑒𝑜𝑝𝑒𝑛𝑠 ≥ 1)
𝑇𝑖𝑐𝑘𝑒𝑡𝑠 𝐶𝑎𝑟𝑟𝑦𝑜𝑣𝑒𝑟
Calls
The KPIs for calls included in the new reports are the following:
Total Calls: This KPI has transited from the previous report.
Total Inbound: This KPI represents all the calls received. The formula is the following:
𝑇𝑜𝑡𝑎𝑙 𝐼𝑛𝑏𝑜𝑢𝑛𝑑 = ∑ 𝐶𝑎𝑙𝑙𝑠 (𝐶𝑎𝑙𝑙𝐷𝑖𝑟𝑒𝑐𝑡𝑖𝑜𝑛 = 𝐼𝑛𝑏𝑜𝑢𝑛𝑑)
Total Inbound Answered: It represents all the calls received answered by CS agents.
It is calculated as follows:
𝑇𝑜𝑡𝑎𝑙 𝐼𝑛𝑏𝑜𝑢𝑛𝑑 𝐴𝑛𝑠𝑤𝑒𝑟𝑒𝑑 = ∑ 𝐶𝑎𝑙𝑙𝑠 (𝐶𝑎𝑙𝑙𝐷𝑖𝑟𝑒𝑐𝑡𝑖𝑜𝑛 = 𝐼𝑛𝑏𝑜𝑢𝑛𝑑 𝑎𝑛𝑑 𝐶𝑎𝑙𝑙𝐶𝑜𝑛𝑛𝑒𝑐𝑡𝑒𝑑 = ′𝑌𝑒𝑠′)
Total Inbound Not Answered: This metric represents all the calls received that were
not answered. It is calculated as follows:
𝑇𝑜𝑡𝑎𝑙 𝐼𝑛𝑏𝑜𝑢𝑛𝑑 𝑁𝑜𝑡 𝐴𝑛𝑠𝑤𝑒𝑟𝑒𝑑 = ∑ 𝐶𝑎𝑙𝑙𝑠 (𝐶𝑎𝑙𝑙𝐷𝑖𝑟𝑒𝑐𝑡𝑖𝑜𝑛 = 𝐼𝑛𝑏𝑜𝑢𝑛𝑑 𝑎𝑛𝑑 𝐶𝑎𝑙𝑙𝐶𝑜𝑛𝑛𝑒𝑐𝑡𝑒𝑑 = ′𝑁𝑜′)
% Inbound Answered: It is calculated as the ratio between Total Inbound Answered
and Total Inbound. The formula is represented as:
% 𝐼𝑛𝑏𝑜𝑢𝑛𝑑 𝐴𝑛𝑠𝑤𝑒𝑟𝑒𝑑 =𝑇𝑜𝑡𝑎𝑙 𝐼𝑛𝑏𝑜𝑢𝑛𝑑 𝐴𝑛𝑠𝑤𝑒𝑟𝑒𝑑
𝑇𝑜𝑡𝑎𝑙 𝐶𝑎𝑙𝑙𝑠
% Inbound Answered in SLA (<20s): This is a Service Quality KPI and it is an
industry standard SLA for measuring the percentage of calls answered in less than 20s.
Even though this KPI can be calculated in various ways, it has been chosen to calculate
it as follows:
% 𝐼𝑛𝑏𝑜𝑢𝑛𝑑 𝐴𝑛𝑠𝑤𝑒𝑟𝑒𝑑 𝑖𝑛 𝑆𝐿𝐴 (< 20𝑠) =𝑇𝑜𝑡𝑎𝑙 𝐼𝑛𝑏𝑜𝑢𝑛𝑑 𝐴𝑛𝑠𝑤𝑒𝑟𝑒𝑑 𝑖𝑛 𝑆𝐿𝐴 (< 20𝑠)
𝑇𝑜𝑡𝑎𝑙 𝐼𝑛𝑏𝑜𝑢𝑛𝑑 𝐴𝑛𝑠𝑤𝑒𝑟𝑒𝑑

Development of a framework for the measurement and control of customer support services
25
Average Call Ring Inbound Not Answered: It measures the average time a customer
was waiting for the call to be answered unsuccessfully. The formula is the following:
𝐴𝑣𝑒𝑟𝑎𝑔𝑒 𝐶𝑎𝑙𝑙 𝑅𝑖𝑛𝑔 𝐼𝑛𝑏𝑜𝑢𝑛𝑑 𝑁𝑜𝑡 𝐴𝑛𝑠𝑤𝑒𝑟𝑒𝑑 =∑ 𝐶𝑎𝑙𝑙 𝑅𝑖𝑛𝑔 (𝑇𝑜𝑡𝑎𝑙 𝐼𝑛𝑏𝑜𝑢𝑛𝑑 𝑁𝑜𝑡 𝐴𝑛𝑠𝑤𝑒𝑟𝑒𝑑)
𝑇𝑜𝑡𝑎𝑙 𝐼𝑛𝑏𝑜𝑢𝑛𝑑 𝑁𝑜𝑡 𝐴𝑛𝑠𝑤𝑒𝑟𝑒𝑑
Total Outbound: This KPI represents all the calls made by CS agents. It is calculated
as follows:
𝑇𝑜𝑡𝑎𝑙 𝑂𝑢𝑡𝑏𝑜𝑢𝑛𝑑 = ∑ 𝐶𝑎𝑙𝑙𝑠 (𝐶𝑎𝑙𝑙𝐷𝑖𝑟𝑒𝑐𝑡𝑖𝑜𝑛 = 𝑂𝑢𝑡𝑏𝑜𝑢𝑛𝑑)
Total Outbound Answered: It is calculated as the total number of calls outbound that
were answered by the customer. Its formula is the following:
𝑇𝑜𝑡𝑎𝑙 𝑂𝑢𝑡𝑏𝑜𝑢𝑛𝑑 = ∑ 𝐶𝑎𝑙𝑙𝑠 (𝐶𝑎𝑙𝑙𝐷𝑖𝑟𝑒𝑐𝑡𝑖𝑜𝑛 = 𝑂𝑢𝑡𝑏𝑜𝑢𝑛𝑑 𝑎𝑛𝑑 𝐶𝑎𝑙𝑙𝐶𝑜𝑛𝑛𝑒𝑐𝑡𝑒𝑑 = ′𝑌𝑒𝑠′)
Total Outbound Not Answered: This metric is calculated as the sum of the calls
outbound that did not have an answer from the customer. It is represented as follows:
𝑇𝑜𝑡𝑎𝑙 𝑂𝑢𝑡𝑏𝑜𝑢𝑛𝑑 = ∑ 𝐶𝑎𝑙𝑙𝑠 (𝐶𝑎𝑙𝑙𝐷𝑖𝑟𝑒𝑐𝑡𝑖𝑜𝑛 = 𝑂𝑢𝑡𝑏𝑜𝑢𝑛𝑑 𝑎𝑛𝑑 𝐶𝑎𝑙𝑙𝐶𝑜𝑛𝑛𝑒𝑐𝑡𝑒𝑑 = ′𝑁𝑜′)
The KPIs related to inbound calls are different from those applied to outbound calls, since the
responsibility for these calls is on the customers’ side.
Additionally to the metrics represented, similar metrics were created specifically for calls done
within customer promise hours. As described previously, the Farfetch page varies with the
customers’ IP address region, such that different phone numbers are displayed on the website
according to the location where the page is visualized.
Before this project, the hours promised were not realistic. Furthermore, there was no control
regarding the number of calls answered within promised hours and the calls answered when
Farfetch does not promise to provide customer support for this specific channel. When this issue
was discussed with Customer Service managers, customer promise hours were updated and the
resources are currently being allocated accordingly.
The redefinition of these hours seeks to guarantee that the most relevant countries and regions
in terms of orders have an associated phone line that is available within regular working hours
(from 09:00 to 18:00). The Farfetch expansion to new markets was also taken into account
when redefining these hours.
The percentage of orders for the top 15 countries, from the beginning of the year 2014 onwards,
is represented on Table 1.

Development of a framework for the measurement and control of customer support services
26
Table 1 - Percentage of Orders by Country (from the beginning of 2014 onwards)
Country % Orders
United States of America 32,64%
United Kingdom 9,43%
Hong Kong 7,39%
Australia 7,03%
Brazil 4,71%
Germany 3,28%
South Korea 3,25%
France 2,65%
Canada 2,20%
Japan 1,87%
Russia 1,64%
Singapore 1,55%
China 1,22%
Switzerland 1,20%
Italy 1,11%
Even though some of the countries do not yet have a specific phone line, their inclusion will
happen in the near future. The new Customer Promise Hours, in local times and by phone lines,
are presented on Table 2.
Table 2 - New Customer Promise Hours (in Local Times) by Phone Line
Phone Line Time Zone Mon-Fri Sat-Sun
Start Hour End Hour Start Hour End Hour
Japan GMT +9 09h00 18h00 - -
China GMT +7 09h00 18h00 - -
Russia GMT +2 10h00 19h00 - -
France GMT +1 09h00 18h00 - -
Germany GMT +1 09h00 18h00 - -
Spain GMT +1 09h00 18h00 - -
United Kingdom GMT 08h00 23h00 09h00 21h00
USA GMT -5 08h00 23h00 09h00 21h00
Mexico GMT -6 09h00 18h00 - -
The support for English lines (USA and United Kingdom phone lines) is provided beyond the
standard hours and it includes weekends. This is relevant because these are the two top countries
in terms of orders. Furthermore, English lines support every other customers from countries
apart from the ones mentioned on Table 1. This redefinition also took into account the feasibility
of working hours for agents. This is the reason why the Russian line has one hour deviation
(from 10:00 to 19:00) from the standard hours.
The goal is to have the maximum number of calls inbound answered within customer promise
hours, reducing the number of calls answered outside these hours. This is possible through the
provider’s feature that allows agents to log in/off from phone lines accounts.
It has been decided to present the two types of KPIs of calls answered (gross and within
customer promise) in order to gain insights on the difference between both. Furthermore, it
becomes possible to understand how accurately personnel is being allocated to these hours and
how well the hours are adjusted to customers’ real needs.

Development of a framework for the measurement and control of customer support services
27
Chats
Regarding chats, it has been made a breakdown by the statuses previously described. The
following KPIs are currently in use:
Total Clicks: The total chat clicks, regardless of having agents available or not;
Unavailable Chats: The sum of the attempts by visitors to initiate a chat when no agents
are available;
Others (Abandoned + Blocked Chats): The total clicks from customers, when CS did
not have the chance to answer the chat, either because the customer abandoned it before
starting or because the user is blocked by Farfetch chat;
Available Chats: The total clicks when at least one agent was available for answering
chats;
% Available Chats: This percentage represents the ratio between available chats and
total clicks, as follows:
% 𝐴𝑣𝑎𝑖𝑙𝑎𝑏𝑙𝑒 𝐶ℎ𝑎𝑡𝑠 =∑ 𝐴𝑣𝑎𝑖𝑙𝑎𝑏𝑙𝑒 𝐶ℎ𝑎𝑡𝑠
∑ 𝐶𝑙𝑖𝑐𝑘𝑠 𝑥 100%
Unanswered Chats: The total chats not answered, when at least one agent was available
to answer;
Answered Chats: The total chats actually answered by Customer Service agents;
% Answered Chats: It is calculated as the ratio between the answered chats and the
available chats, as follows:
% 𝐴𝑛𝑠𝑤𝑒𝑟𝑒𝑑 𝐶ℎ𝑎𝑡𝑠 =∑ 𝐴𝑛𝑠𝑤𝑒𝑟𝑒𝑑 𝐶ℎ𝑎𝑡𝑠
∑ 𝐴𝑣𝑎𝑖𝑙𝑎𝑏𝑙𝑒 𝐶ℎ𝑎𝑡𝑠 𝑥 100%
At the beginning of the implementation of this report it was noticed that customers tended to
click several times in cases when the chat was unavailable. This represents a customer’s
dissatisfaction sign and, besides that, the Unavailable Chats KPI was being affected by this.
Managing customers’ expectations is a key aspect for the achievement of customer satisfaction.
Initially, the solution found to minimize this was counting chats by IP Address per minute. This
means several clicks in the same minute from the same customer would only count once.
However, a more appropriate solution has been put in practice. The chat feature on the portal
has been turned completely dynamic. This means that when all the agents are unavailable, the
chat button disappears from all contact points. This will assure that customers only visualize
the chat option when Farfetch is able to guarantee at least one agent available.
The message currently shown on Farfetch website when no agents are available is presented on
Figure 10.
Figure 10 - Chat message after the implementation of the dynamic chat

Development of a framework for the measurement and control of customer support services
28
General Metrics
Regarding general metrics, the following KPIs are currently in use:
Workload: The workload represents the maximum number of contacts that Customer
Service can solve within one week. Its formula includes measures related to the three
channels (tickets, chats and calls) and it is calculated as follows:
𝑊𝑜𝑟𝑘𝑙𝑜𝑎𝑑 = ∑ 𝑇𝑖𝑐𝑘𝑒𝑡𝑠 𝐶𝑟𝑒𝑎𝑡𝑒𝑑
+ ∑ 𝑇𝑖𝑐𝑘𝑒𝑡𝑠 𝐶𝑎𝑟𝑟𝑦𝑜𝑣𝑒𝑟 (𝐸𝑥𝑡𝑟𝑎𝑐𝑡𝑖𝑜𝑛𝐷𝑎𝑡𝑒 = ′𝐶𝑢𝑟𝑟𝑒𝑛𝑡𝐷𝑎𝑦′)
+ ∑ 𝑇𝑜𝑡𝑎𝑙 𝐶𝑎𝑙𝑙𝑠 𝐼𝑛𝑏𝑜𝑢𝑛𝑑 𝑤𝑖𝑡ℎ𝑖𝑛 𝐶𝑢𝑠𝑡𝑜𝑚𝑒𝑟 𝑃𝑟𝑜𝑚𝑖𝑠𝑒
+ ∑ 𝑇𝑜𝑡𝑎𝑙 𝐶𝑎𝑙𝑙𝑠 𝑂𝑢𝑡𝑏𝑜𝑢𝑛𝑑 𝐴𝑛𝑠𝑤𝑒𝑟𝑒𝑑
+ ∑ 𝑇𝑜𝑡𝑎𝑙 𝐶ℎ𝑎𝑡 𝐶𝑙𝑖𝑐𝑘𝑠
Regarding tickets, this calculation includes all the tickets created in the week under
analysis and the tickets carryover from previous weeks. Therefore, it represents the total
amount of tickets workload.
In terms of calls, the formula includes calls inbound within customer promise, since
these are the hours that Farfetch actually promises to answer. Every call inbound outside
these hours will be excluded from the calculation. Additionally, outbound calls are
counted when answered, since the workload generated by not answered calls can be
considered insignificant in terms of time spent.
Finally, after the introduction of dynamic chat and the guarantee of agents available
when the customer is faced to the click option, chats are being counted as all the clicks
on the portal.
Total Solved: This KPI includes all the contacts solved concerning the three contact
channels. It includes tickets solved, calls inbound answered within customer promise,
calls outbound answered and chats answered. The calculation is represented as follows:
𝑇𝑜𝑡𝑎𝑙 𝑆𝑜𝑙𝑣𝑒𝑑 = ∑ 𝑇𝑖𝑐𝑘𝑒𝑡𝑠 𝑆𝑜𝑙𝑣𝑒𝑑
+ ∑ 𝐶𝑎𝑙𝑙𝑠 𝐼𝑛𝑏𝑜𝑢𝑛𝑑 𝐴𝑛𝑠𝑤𝑒𝑟𝑒𝑑 𝑤𝑖𝑡ℎ𝑖𝑛 𝐶𝑢𝑠𝑡𝑜𝑚𝑒𝑟 𝑃𝑟𝑜𝑚𝑖𝑠𝑒
+ ∑ 𝐶𝑎𝑙𝑙𝑠 𝑂𝑢𝑡𝑏𝑜𝑢𝑛𝑑 𝐴𝑛𝑠𝑤𝑒𝑟𝑒𝑑
+ ∑ 𝐶ℎ𝑎𝑡𝑠 𝐴𝑛𝑠𝑤𝑒𝑟𝑒𝑑
Response Rate: The response rate is calculated as the ratio between the Total Solved
and the Workload, above explained. It is one of the most relevant metrics, as it
represents the percentage of contacts that Customer Service was able to solve in
comparison to the total workload. It is calculated as follows:
𝑅𝑒𝑠𝑝𝑜𝑛𝑠𝑒 𝑅𝑎𝑡𝑒 =𝑇𝑜𝑡𝑎𝑙 𝑆𝑜𝑙𝑣𝑒𝑑
𝑊𝑜𝑟𝑘𝑙𝑜𝑎𝑑 𝑥 100%
Contacts per Order: The contacts per order calculation compares the number of
contacts requested (including tickets created, calls inbound answered within customer
promise, calls outbound answered and chats requested) with the number of orders for
the same period. The formula is calculated as:

Development of a framework for the measurement and control of customer support services
29
𝐶𝑜𝑛𝑡𝑎𝑐𝑡𝑠 𝑝𝑒𝑟 𝑂𝑟𝑑𝑒𝑟
= (∑ 𝑇𝑖𝑐𝑘𝑒𝑡𝑠 𝐶𝑟𝑒𝑎𝑡𝑒𝑑
+ ∑ 𝐶𝑎𝑙𝑙𝑠 𝐼𝑛𝑏𝑜𝑢𝑛𝑑 𝑅𝑒𝑞𝑢𝑒𝑠𝑡𝑒𝑑 𝑤𝑖𝑡ℎ𝑖𝑛 𝐶𝑢𝑠𝑡𝑜𝑚𝑒𝑟 𝑃𝑟𝑜𝑚𝑖𝑠𝑒
+ ∑ 𝐶𝑎𝑙𝑙𝑠 𝑂𝑢𝑡𝑏𝑜𝑢𝑛𝑑 𝐴𝑛𝑠𝑤𝑒𝑟𝑒𝑑
+ ∑ 𝐶ℎ𝑎𝑡 𝐶𝑙𝑖𝑐𝑘𝑠) / (∑ 𝑂𝑟𝑑𝑒𝑟𝑠)
NPS: This KPI has transited from the previous report.
Table 3 summarizes the KPIs currently in use for the Executive Weekly Report. For a better
perception, it has been associated a responsible to each metric (either Farfetch, CS or Customer)
as well as the business aspects it covers.
Table 3 - New KPIs implemented, responsible and areas
Key Performance Indicator Type Responsible Area
General
Metrics
Workload New Farfetch Operational Efficiency
Total Solved New CS Operational Efficiency
Response Rate New CS/Farfetch Operational Efficiency
Contacts per Order Old Farfetch Service Quality
NPS Old Farfetch Customer Satisfaction
Solved
Tickets
Tickets Solved New CS Operational Efficiency
% One Touch Tickets Old CS Service Quality
% Tickets Solved with Reopens New CS Service Quality
Average Full Resolution Hours Old CS/Farfetch Operational Efficiency
Satisfaction Rate Old CS Customer Satisfaction
Satisfaction Survey Response Rate New CS Customer Satisfaction
Breakdown of Ticket Categories New CS Operational Efficiency
Average Full Resolution by Category New CS Operational Efficiency
Created
Tickets
Tickets Created New Farfetch Operational Efficiency
% Tickets Replied in SLA (<8h) Old CS Service Quality
% Tickets Created with Reopens New CS Service Quality
Carryover
Tickets
Tickets Carryover New CS Operational Efficiency
% Tickets Carryover with Reopens New CS Service Quality
Range (in weeks) New CS Operational Efficiency
Calls
(Gross
and within
Customer
Promise
results)
Total Calls Old CS/Farfetch Operational Efficiency
Total Inbound New Farfetch Operational Efficiency
Total Inbound Answered New CS Operational Efficiency
Total Inbound Not Answered New CS/Farfetch Operational Efficiency
% Calls Inbound Answered New CS Operational Efficiency
% Calls Inbound Answered SLA New CS Service Quality

Development of a framework for the measurement and control of customer support services
30
Average Call Ring Not Answered New CS Operational Efficiency
Total Outbound New CS Operational Efficiency
Total Outbound Answered New CS/Customer Operational Efficiency
Total Outbound Not Answered New CS/Customer Operational Efficiency
Chats
Total Clicks Old Farfetch Operational Efficiency
Unavailable New CS Operational Efficiency
Others (Blocked + Abandoned) New Farfetch Operational Efficiency
Available New CS Operational Efficiency
% Available Chats New CS Operational Efficiency
Unanswered New CS Operational Efficiency
Answered Old CS Operational Efficiency
% Answered over Available New CS Operational Efficiency
Although most of the metrics can be directly controlled by Customer Service actions, others
depend on the performance of Farfetch in other departments. For instance, ticket resolution
hours highly depend on the performance of internal teams and the workload is highly influenced
by the performance of Farfetch in several areas, such as technology and operations. For this
reason, it has been included a column on the previous table indicating the entity responsible for
the performance indicator.
More than creating means to control and measure the performance of the Customer Service
Department, this type of report will allow to implement improvement processes within Farfetch,
and influence the way Farfetch is able to please customers.
All in all, these KPIs are focused in the three areas: Operational Efficiency, Service Quality and
Customer Satisfaction. Even though there has been the goal of implementing KPIs covering
these three business aspects, the implementation of KPIs related to Service Quality or Customer
Satisfaction was not always possible due to unavailability of this type of data for calls and chats.
This was one of the main limitations affecting the implementation of this project.
4.2.2 Main Features
This report, developed on Power Pivot, is shown on Appendix A. It has the following main
features:
Automatically update
This report is programmed to be updated every Monday at 06:00, and no manually updates are
required. Furthermore, it is also possible to manually request a data update without interfering
with the weekly scheduling.
Drill Down
This capability allows the user to dig into the numbers and get to the data source. When double
clicking at the values, a new spreadsheet opens containing the data that feed the result. This
feature is one of the most powerful ones, as the user can explore the data, moving from the
numbers to the tabular data related to the result. An example of the drill down for calls is
represented on Figure 11.

Development of a framework for the measurement and control of customer support services
31
Figure 11 - Drill Down capability on Power Pivot
Slicering
Through the slicering feature, it is possible to filter data according to the user’s personal needs
by office and by year and week. For instance, executives are more interested on getting a global
performance perspective, whereas team managers are more interested on looking at their teams’
performances. For an easier perception, teams and respective offices have been represented
through two-letter country codes, where PT stands for Portugal, UK for United Kingdom and
US for United States of America.
Beyond the office filter, it is possible to check results from previous weeks through the week
slicer.
The slicers are represented on Figures 12 and 13.
Figure 12 - Slicer by year and week
Figure 13 - Slicer by office
The blank option on the slicer by office represents metrics and values for which it is not possible
to allocate to an office, such as New Tickets, Calls Inbound Not Answered or Chats Not
Available. These slicers can be applied individually or simultaneously, allowing the user to
choose the views according to his/her needs.
Previous Week Comparison
The three columns represented for each KPI are: week selected result, week before result and
comparison week select versus week before in terms of percentage, the % vs. Week Before.
This percentage is calculated as follows:
% 𝑣𝑠 𝑊𝑒𝑒𝑘 𝐵𝑒𝑓𝑜𝑟𝑒 = [(𝑊𝑒𝑒𝑘 𝑆𝑒𝑙𝑒𝑐𝑡𝑒𝑑 𝑅𝑒𝑠𝑢𝑙𝑡 − 𝑊𝑒𝑒𝑘 𝐵𝑒𝑓𝑜𝑟𝑒 𝑅𝑒𝑠𝑢𝑙𝑡) − 1] 𝑥 100%
An example of the presentation method for each KPI is represented on Figure 14.

Development of a framework for the measurement and control of customer support services
32
Figure 14 - Example of KPI presentation columns
According to the KPI and to the result presented, the background color of the percentage column
varies. This is done through the implementation of the conditional formatting feature available
at Microsoft Excel. As such, good results appear in green, alarming results in red and neutral
results in yellow, symbolizing the traffic lights and facilitating the user's reading on the recent
performance and on the results obtained in comparison to the previous week.
Charts
Apart from the spreadsheet mentioned before, it is possible to assess the evolution of every KPI
in a long period of time (from the beginning of 2014 onwards). With this, it is possible to have
a detailed view and have an idea of trends, outliers, forecast future results and take actions based
on the historical data.
An example of one of these charts is presented on Figure 15.
Figure 15 - Example of a KPI chart
Online Publishing
This report is published on the web on Farfetch SharePoint. In order to guarantee the data
security, it is necessary authentication for accessing it. Furthermore, it is possible to access it
outside Farfetch Intranet through VPN connection.
Regarding the queries developed in SQL, they allow to import the data from Farfetch databases
through the Power Pivot integration with SQL Server. The queries created were the following:
Solved Tickets
Created Tickets
Carryover Tickets
Calls
Chats
NPS
These queries can be seen on Appendix B.

Development of a framework for the measurement and control of customer support services
33
4.3 Executive Weekly Dashboard
The Executive Weekly Dashboard arose from the executives need to assess Customer Service
performance in a more visual way. As such, it was developed on Tableau. Besides this, there
were some types of KPIs presented on the Executive Weekly Dashboard that were not relevant
for the type of analysis that executives need. This dashboard was designed to fit in an email
body and it is updated and sent every Monday.
Regarding the queries, they were similar to the ones previously presented. The only difference
lies on the period of time analyzed: only from 4 weeks ago to the current moment. With this, it
is possible to have an overview of the recent performance in a quick and efficient way. The
dashboard is presented on Figure 16.
Figure 16 - Executive Weekly Dashboard

Development of a framework for the measurement and control of customer support services
34
Even though there is no visual limitation separating the different KPIs/areas on this dashboard,
it is organized in four different groups:
1st Tier: All the General Metrics are listed on the top of the dashboard. Starting with the graphs
that include both Total Solved and Workload and below the ratio between the two, the Response
Rate. Besides these metrics, also the Contacts per Order and NPS are listed in this order.
2nd Tier: The left and center graphs present KPIs related to Service Quality: % One Touch
Tickets and % Tickets with Reopens over Tickets Solved. On the right side, the Satisfaction
Rate and the Satisfaction Survey Response Rate are listed together, since both are related to
Customer Satisfaction. Moreover, they are located just below the NPS, another Customer
Satisfaction KPI.
3rd Tier: This tier represents Operational Efficiency KPIs, such as Numbers of Tickets (Solved,
Created and Carryover), Average Full Resolution Times, Tickets Carryover by Range for the
current week, % Chats Answered over Available and Numbers of Chats Answered. Due to the
high backlog of tickets at the beginning of the implementation of the Weekly Executive Report,
executives required a detailed previous week overview on Tickets Carryover by Range.
4th Tier: This tier shows uniquely call KPIs, comparing gross vs. customer promise results.
Due to the unexpected low service level in terms of calls found at the very beginning of the
implementation of the Executive Weekly Report, executives required a week to week as well
as a day to day view on calls. Besides these two graphs, on the left side it is presented the
Number of Calls Inbound Connected (gross and within customer promise) and on the right side
the % Calls Connected SLA (<20s), a Service Quality KPI.
The main issue addressed when designing this dashboard was to find a way to present the most
relevant metrics facilitating the understanding of the main recent occurrences. The frugal use
of colors was taken into account when designing it to facilitate the visual perception. Regarding
the KPIs presented, all General Metrics were included, given their importance for senior
management. Besides these ones, detailed Operational Efficiency call and chat KPIs and the
breakdowns by ticket categories were excluded from this dashboard, due to their irrelevance
for the type of analysis needed by these users.
This dashboard, developed on Tableau, is also published on Tableau Server. Therefore, users
can drill down and get to the source of the data in case they are interested in a specific view of
some of the values presented.
4.4 Daily Dashboard
The Daily Dashboard resulted from the need of a tool that allows the measurement and control
of Operational Efficiency results for shorter periods of time. With this dashboard, team
managers, supervisors and agents are able to quickly access their teams’ performances,
replacing the manual process of extracting tickets data for Daily Kaizen Team meetings and
providing Customer Services players with accurate information about the previous day.
Furthermore, with this tool it is possible to aggregate data related to the three channels in a
single solution. This dashboard has also been designed in a way that allows the future insertion
of the Japanese and Russian teams.
It is daily updated at 06:00 (GMT time) providing the previous day metrics for Porto, London
and Los Angeles teams. This time was chosen because it is the exact moment when the day
ends for Los Angeles team and the new day starts for London and Porto teams, providing a
complete overview of a 24 hour day for the three teams.
Using the filtering option, it is possible to filter data by office. With this, team managers can
have a detailed view of their team results and take action plans based on the current situation.

Development of a framework for the measurement and control of customer support services
35
4.4.1 Metrics
On the Daily Dashboard, there are three types of representations: Global, Filter by office and
Teams Benchmarking.
Global: it represents metrics that are measured for the three teams globally due to the preclusion
of allocating them to an office, such as New Tickets metrics (tickets are still not assigned to a
specific agent), Calls Inbound (connected or not connected – for the second ones it is not
possible to allocate a responsible) or Chats Status (the same issue for not available chats).
Filter by office: it represents metrics for which the filter is applied. This means that when the
user switches the office, these metrics will automatically change accordingly. This allows
Customer Service managers to quickly assess their teams’ performances. There is also an “all”
option that allows to view results together for all the teams.
Teams Benchmarking: it is associated to pie charts in which the three teams’ results are
compared in terms of percentages. These pie charts were a request from team managers, so that
they can compare their teams’ performances.
The following results are presented on the Daily Dashboard:
Solved Tickets
Solved Tickets by Range (Filter by office): Number of tickets solved according to
their duration time (from the moment of creation to the moment of resolution) in days
by range: 0-1, 1-7, 7-14, 14-28, >=28 days, represented through the traffic light color
range;
Solved Tickets by Agent (Filter by office): Number of tickets solved by agent, listed
from the highest to the lowest in terms of solved tickets. As per Customer Service
managers’ request, all the agents that have solved less than 40 tickets will have their
names in red, all the others will have them in green;
Solved Tickets by Category (Filter by office): Number of tickets solved by ticket
category. This metric is very relevant to understand the type of queries most solicited in
the previous day and to detect eventual issues on some specific area of the company.
For instance, if there are many tickets related to payment, it might indicate that there is
some technical issue related to it;
Average Full Resolution Time by Category (Filter by office): For all the categories,
it is possible to see the average time of resolution of those tickets;
Solved Tickets Distribution (Teams Benchmarking): Percentage of solved tickets
among the three teams represented in a pie chart.
Backlog Tickets
Backlog Tickets by Range (Filter by office): Number of tickets in backlog according
to their current duration time (from the moment of creation to the current moment) in
days by range: 0-1, 1-7, 7-14, 14-28, >=28 days, represented through the traffic light
color range;
Backlog Tickets by Agent (Filter by office): Number of tickets in backlog by Agent,
listed from the lowest to the highest in terms of backlog tickets. As per Customer Service
Managers’ request, all the agents that have in backlog less than 40 tickets will have their
names in green, all the others will have them in red;
Backlog Tickets by Category (Filter by office): Number of tickets in backlog by ticket
category;
Average Backlog Time by Category (Filter by office): Average backlog time (from
the moment of creation to the current moment) by category;
Backlog Tickets Distribution (Teams Benchmarking): Percentage of backlog tickets
among the three teams represented in a pie chart;

Development of a framework for the measurement and control of customer support services
36
New Tickets
New Tickets by Range (Global): This number represents all the new tickets, still not
assigned to an agent, according to their duration time in days by range: 0-1, 1-2, 2-4, 4-
7, >=7 days, represented through the traffic light color range. The range of these tickets
is more tightened than the previous ones, since these are tickets not yet assigned to an
agent.
Assigned Tickets
% Tickets Replied in SLA <8h (Filter by office): Although this is a Service Quality
metric, it has been included so that Customer Service managers know the quickest and
slowest teams responding new tickets;
Assigned Tickets Distribution (Teams Benchmarking): Percentage of assigned
tickets among the three teams represented in a pie chart.
Chats
Chats by Status (Global): Represented through a pie chart, it represents the distribution
of the previous day chat clicks according to the statuses mentioned previously
(unavailable, blocked, abandoned, not answered and answered);
Available Chats (Filter by office): This pie chart represents the relation, in percentage
and numbers, between answered (in green) and not answered chats (in red). In both
cases there were agents available;
Average Duration Answered Chats (Filter by office): It represents the average
duration of the answered chats. According to Customer Service managers, in this phase
it has been defined that an average under 10min is a good result (represented in green)
and an average over 10min is an out of target result (represented in red);
Chats Answered Distribution (Teams Benchmarking): Percentage of chats answered
among the three teams represented in a pie chart.
Calls
Calls Inbound (Global): Represented through a pie chart, it represents the global calls
inbound connected and not connected. For their obvious meanings, calls connected are
represented in green and calls not connected are represented in red;
Calls Answered (Filter by office): Once it is not possible to allocate calls not connected
to an office, this chart only shows answered calls: inbound in less than 20s (represented
in dark green), remaining inbound (represented in light green) and outbound
(represented in black);
Average Duration Answered Calls (Filter by office): It represents the average
duration of the calls answered. According to Customer Service managers, in this phase
it has been defined that an average under 5min is a good result (represented in green)
and an average over 5min is an out of target result (represented in red);
Calls Inbound Answered Distribution (Teams Benchmarking): Percentage of calls
inbound answered among the three teams represented in a pie chart;
Although the goal of this dashboard is to give an overview of the daily operational efficiency,
two service quality metrics have been included, the % Tickets Replied in SLA and Number of
Calls Answered in SLA (<20s), in order to reinforce the need to rise Service Quality
performances. This dashboard is presented on Figure 17.

Development of a framework for the measurement and control of customer support services
37
4.4.2 Dashboard
Figure 17 - Daily Dashboard

Development of a framework for the measurement and control of customer support services
38
The layout of this dashboard is organized as follows:
Top: graphs related to chats (chats by status, average duration answered chats and
available chats) and calls (calls inbound, average duration calls answered and calls
answered) and filtering option by office;
Middle Left: graphs related to teams benchmarking and % tickets responded in SLA
(<8h);
Middle Center and Right: detailed views by agent and by category (number and
average time) for solved and backlog tickets;
Bottom: graphs related to the New, Solved and Backlog Tickets (open, pending, on-
hold) by duration range – from the moment of creation to the current moment – in days.
The colors used in this dashboard seek to give the end user an easy visual perception on good
and bad results. For this reason, it has been used a traffic light color ranging from green hues,
representing good results, to alarming results, in red hues. Moreover, an intermediate scale in
yellow and orange hues has been created, for representing results that are close to be alarming
in some of the metrics, such as ranges and breakdowns by category. Regarding the teams
benchmarking, each team is represented by a different blue hue, so that it is easy to distinguish
from the previously presented results.
4.4.3 Script for Blocks of Information Shift
Through the use of VNC software, it is possible to remotely access a computer. This software
solution allows to show the Daily Dashboard on the monitors located in each one of the offices.
With them, Customer Service players are able to regularly view and know their individual, team
and global performances.
However, due to the high number of charts presented on the Daily Dashboard, it was not easy
to quickly assess performance through the use of the monitors. For this reason, it has been
developed a script that automatically changes the information presented every minute.
According to this feature, the Daily Dashboard was branched in three different blocks of
information. With this, it should be possible to easily assess performance visualizing related
data. The three different blocks are described and presented on Figures 18, 19 and 20.
Ticket Charts: Solved Tickets by Range, Solved Tickets Distribution, Backlog Tickets
by Range, Backlog Tickets Distribution, % Tickets Replied in SLA (<8h), Created
Tickets Distribution and New Tickets by Range;
Figure 18 - Daily Dashboard: Ticket Charts Block

Development of a framework for the measurement and control of customer support services
39
Detailed Ticket Charts: Solved Tickets by Agent, Solved Tickets by Category,
Average Full Resolution Time by Category, Backlog Tickets by Agent, Backlog Tickets
by Category, Average Backlog Time by Category;
Figure 19 - Daily Dashboard: Detailed Ticket Charts Block
Call and Chat Charts: Chats by Status, Average Duration Chats Answered, Available
Chats, Chats Distribution, Calls Inbound, Average Duration Calls Answered, Calls
Answered and Calls Inbound Distribution;
Figure 20 - Daily Dashboard: Call and Chat Charts Block
With this development, the dashboard branched in blocks of information and containing the
script feature is exposed on the monitors and the initial Daily Dashboard constitutes a laptop
version for assessment through Tableau Server for all the Customer Service players, enabling
the use of all Tableau capabilities.
The realization of the current Daily Kaizen Team meetings, where the previous day
performance is discussed, is accompanied by the exhibition of the metrics presented on the
Daily Dashboard. It provides valuable and visual information for the players involved in the
Customer Service and a tool for rapid assessment of individual, team and global performances.

Development of a framework for the measurement and control of customer support services
40
4.4.4 Main Features
The dashboard, developed on Tableau, has the following main features:
Automatically update: The queries on this dashboard are programmed to automatically
update every day at 06h00 (GMT), showing the previous 24 hours results for the three
teams. This is a very relevant characteristic, specially taking into account the periodicity
of this dashboard.
Drill Down: This capability is one of the most valuable ones, once the user can get to
the granular data that feeds the results. When clicking at a chart on the dashboard, the
user can find an option to view data, as represented on Figure 21.
Figure 21 - Drill Down assessment on Tableau
Clicking on this option, it is possible to see the tabular data related to the number. An
example of drill down is represented on Figure 22.
Figure 22 - Drill Down example on Tableau
Furthermore, it is possible to download this information in a CSV (“Comma Separated
Values”) file format.
Filtering Option by Office: It is possible to filter data by office according to the user’s
personal needs. As previously explained, the filter will not be applied to all the metrics.
The filtering option is shown on Figure 23.

Development of a framework for the measurement and control of customer support services
41
Figure 23 - Filtering option (by office)
Alerts: Similarly to the conditional formatting applied to the Weekly Executive Report,
visual alerts have been created in order to alert the dashboard’s users for results that
passed or failed the target, following the same traffic light logic previously applied.
The concept of target is very relevant for the analysis of results. However, due to the
initial low service level provided on Farfetch customer support services, many targets
for these metrics have not yet been established. The idea is to apply most of them some
months after the implementation of these reporting methods, as soon as the performance
has increased to stable values.
Online Publishing: This dashboard is published on Tableau Server, allowing any user
to consult it in any device connected to the Internet. It is also possible to access it outside
Farfetch through VPN connection. The data security is assured, since this dashboard
requires authentication and the access to the dashboard is by invitation only.
Regarding the queries created in SQL language, they are the following:
Solved Tickets
New Tickets
Backlog Tickets
Created Tickets
Calls
Chats
These queries are available on Appendix C.
4.5 Daily Management Dashboard
As a result of the previous reports presented and the low response rate on calls inbound,
Customer Service managers required a tool that allows their visualization in various ways. As
such, it has been created a Daily Management Dashboard. It is similar to the Daily Dashboard,
containing a few changes in terms of the metrics represented. As it is also developed on
Tableau, the features are similar to those previously described.
Whilst the Daily Dashboard constitutes a tool for agents and supervisors, providing a
visualization of detailed data on several operational performance aspects whenever needed, the
Management version is to be used by CS managers, providing different types of information
according to their specific needs.
This dashboard excludes the breakdowns by categories in terms of number of tickets solved and
backlog as well as average times, as they do not represent essential views for the type of analysis
management needs. By replacing them, it is possible to include more insights on calls.
Furthermore, it has also been included a presentation of the number of tickets escalated by team.
These are the tickets transferred on a daily basis from agents to supervisors and team managers,
when their resolution is requested either by the agent or by the customer. In addition to this, it
has been included the ‘Management’ team on the filtering by office.

Development of a framework for the measurement and control of customer support services
42
This dashboard is represented on Appendix D. The new views and filters included are the
following:
Calls by Phone Number: graph with the calls inbound connected/not connected
distributed by Called Phone Number. With this, it is possible to understand the daily
workload of calls for each phone line and language associated. It is presented on Figure
24.
Figure 24 - Calls Inbound by Language/Phone Line
Calls by Hour: graph with the distribution of the calls connected/not connected by hour
(from 6am to 6am GMT, in order to comprise the Customer Service 24 hour day). This
graph is represented on Figure 25.
Figure 25 - Calls Inbound by Hour
Filter - Calls by Language/Phone Line: filter applied to the graph “Calls by Hour”.
Selecting one of the phone lines available, the previous graph is automatically adjusted
so that it is possible to see “Calls by Hour” for the chosen phone line. It is represented
on Figure 26.
Figure 26 - Filter for Calls by Phone Line
Filter – Customer Promise Hours: with this filter it is possible to switch between gross
and customer promise results for calls. This filter has been applied to all the call metrics
(Calls Inbound, Calls Answered, Calls by Hour, Calls by Phone Number, Average
Duration Answered and Calls Inbound Answered Distribution). It also gives an idea of
the number of calls connected/not connected within and outside customer promise
hours. Moreover, it will be possible to observe trends on calls not connected outside

Development of a framework for the measurement and control of customer support services
43
customer promise hours and, in the future, adjust customer promise hours to the actual
demand. This filter is presented on Figure 27.
Figure 27 - Filter for customer promise results
Regarding the filters presented, they can be applied individually or simultaneously,
acquiring multiple levels of data refinement. These graphs and filters are placed just
below the previous existent call charts (Calls Inbound, Calls Answered and Average
Duration Call Inbound).
In the near future it is expected to expand the number of phone lines offered for customer
support. With the inclusion of these new services, these charts will be automatically
updated.
Escalations: These numbers allow the perception of the average percentage of tickets
that agents escalate, on a daily basis, to their supervisors and team managers. This
happens when the resolution of the tickets is required either by agents or by the
customers, representing a time consuming activity for supervisors and team managers.
It is presented on Figure 28.
Figure 28 - Escalations per Solved Tickets
Through the implementation of these numbers on the dashboard, it is expected to raise
the perception of the more solicited supervisors and team managers by office. It
represents both the Service Quality, for the capability or not of the agent to solve the
customer’s issue, and the Customer Satisfaction, for the need of the customer to request
further clarifications.
With the inclusion of the ‘Management’ team on the filter by office, it is possible to
check the same type of metrics and graphs for the tickets assigned to supervisors and
team managers. The confidentiality of this type of information is guaranteed, once
agents are not provided with the access to this dashboard.
The goal is to check thoroughly each one of these tickets and to act through training
processes on the most frequent type of queries escalated. This type of data will be
fundamental for the future internal processes improvement.

Development of a framework for the measurement and control of customer support services
44
4.6 Weekly Management Dashboard
This dashboard arose as a request from Customer Service managers for a tool that allows them
to visualize weekly performance in different ways and data refinements. It is updated every
Monday, providing data from the previous seven days. It consists on a similar dashboard to the
previously presented Daily Management Dashboard in terms of metrics and charts.
The main purpose is to have a weekly overview of Operational Efficiency aspects and, in
particular, to measure and control calls by language/phone line, hour and day of the week. With
the introduction of the new phone lines, such as the Chinese, German, Japanese, Mexican and
Spanish, associated to the uncertainty related to trends and needs in terms of personnel on each
one of these lines, it became necessary to create means of data refinement for calls. With this
type of data, in the future it should be possible to forecast demand and to allocate personnel to
all the phone lines more accurately.
Regarding the charts, New Tickets by Range has been removed, due to its little meaning in a
weekly perspective. In addition to the Solved Tickets by Agent and the Backlog Tickets by
Agent, it has been included the Assigned Tickets by Agent, making possible to have a complete
overview of the weekly performance of each one of the agents.
This new list allows to know the total tickets that each agent assigned, including chat and call
tickets, therefore providing a correct comparison among agents. If individual comparisons
excluded chat and call follow up tickets, agents who had been on call or chat services would be
impaired in relation to the ones who had only been responding to tickets generated via email or
contact form.
The layout of this dashboard, represented on Appendix E, is the following:
Left: on the top graphs related to chats (chats by status, average duration answered and
available chats); below graphs related to distribution among teams and % tickets replied
in SLA (<8h);
Center: filter by office and detailed views by agent: solved tickets, assigned tickets and
backlog tickets;
Right: graphs and filters related to calls; escalations per solved tickets;
Bottom: graphs related to the Solved and Backlog Tickets (open, pending, on-hold) by
duration range – from the moment of creation to the current moment – in days.
For the assigned tickets by agent, and considering an agent works on average five days per
week, it has been considered that a positive result is to assign and solve more than 200 tickets
and to keep in backlog less than 40 tickets. Although this is not an established target, it
constitutes an initial way to push the global performance up.
All the features apart from the day of the week filter are similar to the previous Daily
Management Dashboard. The filter as well as the other graphs/filters related to calls are
presented on Figure 29.

Development of a framework for the measurement and control of customer support services
45
Figure 29 - Call Graphs and Filters on the Weekly Management Dashboard
With this dashboard, it should be possible to turn scheduling processes easier, to find changes
on trends as well as to act on staffing processes and customer promise hours whenever
necessary. Therefore, this dashboard constitutes an important source of information for
Customer Service managers to allocate personnel accurately.
Since these dashboards are integrated with Farfetch databases and are automatically updated,
any change in terms of customer promise hours, personnel or offices just needs to be registered
on the databases.
After the implementation of these reporting methods and the stabilization of the results as to
approach the excellence level required, the goal is to analyze customer support processes. With
this type of analysis and the reporting methods available, it should be possible to understand
where improvements can be made. More than improving the performance on the customers’
point of view, it should be possible to guarantee the quality of the processes that are the basis
for the customer support. With the elimination of the causes of non-conformity and the
stabilization of the processes, it should be possible to improve efficiency and to guarantee the
continuous improvement of the performance of Farfetch as a whole.
Given that good customer relations are fundamental for the success of any business and that
customers within the luxury market require excellence, every small step taken forward is
essential for keeping the business growth.

Development of a framework for the measurement and control of customer support services
46
4.7 Main Results
After the implementation of the new Key Performance Indicators and the new report and
dashboards, all the players that are directly involved in the Customer Service have become more
aware of the performance of the Department, whether globally, by team or individually. These
reporting methods are being used daily and weekly to control Farfetch customer support
services.
Since the requirements came from different players, each one of the reporting tools
implemented and their visualisations have been the result of intense dialogues with the main
end users involved. For the ones who were not so closely involved in the progress of the project,
it was necessary to guide them at the beginning of the implementation so that they could
understand the meaning of each of the KPIs measured.
One of the difficulties found, especially for the metrics updated on a daily basis, was the
different time zones and working hours among CS teams. The solution found for this was the
normalization of the hours to GMT standard time and the establishment of the concept of the
CS day (from 6am to 6am), in order to comprise the time that European offices start the day
and that Los Angeles office ends the day, hence providing a correct comparison among teams.
With the contribution of the solutions developed along this project, the Customer Service
performance levels have improved significantly, though there has been the rise of the number
of contacts generated after the implementation of the first report. The evolution of the total
number of contacts generated (through tickets created via contact form/email, calls inbound
requested, calls outbound answered and chats available), covering a period of twelve weeks
since the implementation of the first report, is represented on Figure 30.
Figure 30 - Evolution of the number of contacts generated
The number of contacts generated increased 11.7%, from the first to the last week in analysis.
The most visible improvements during this time frame can be seen on:
Response Rate: The response rate has increased significantly, from 60.2%, on the week that
the Weekly Executive Report was launched, to 86.4%, twelve weeks later. This evolution is
represented on Figure 31.
Figure 31 - Evolution of the Response Rate

Development of a framework for the measurement and control of customer support services
47
Despite the readjustments in the customer promise hours and the dynamic chat, which have also
contributed to the rapid growth of this rate, Farfetch is currently able to guarantee a very higher
response on its customer support services.
% Calls Inbound Answered: after the establishment of the first report and the readjustment
of the customer promise hours, the percentage of calls inbound answered, both in terms of gross
and within customer promise results, has increased from 67.2% (gross) and 73.6% (within
customer promise) to 80.2% (gross) and 87.4% (within customer promise). This evolution is
represented on Figure 32.
Figure 32 - Evolution of the percentage of Calls Inbound Answered (Gross and within customer promise results)
Although the increase of languages provided could lead to the decline of the percentage of calls
inbound answered, as a consequence of the major complexity of resources allocation, this
indicator has been increasing continuously.
The results of both Service Quality and Customer Satisfaction KPIs have also been improving.
Since Service Quality is an antecedent to Customer Satisfaction, the KPIs established for
measuring it are very relevant for Farfetch. Furthermore, Customer Satisfaction is directly
linked to Customer Loyalty, and if not managed correctly, this can be one of the main issues
that companies have to face when competing online (Cox and Dale, 2001).
The most visible improvement on these areas of KPIs can be seen on:
% Tickets Solved with Reopens: This Service Quality KPI has decreased from 29.4% to
24.4%, for the same weeks in comparison. The evolution of this KPI can be seen on Figure 33.
Figure 33 - Evolution of the percentage of Tickets Solved with Reopens
With the reporting methods developed, executives and CS managers are currently provided
with multiple ways to measure and control performance. According to their roles and
responsibilities, they can develop action plans for the short or long term based on reliable data.

Development of a framework for the measurement and control of customer support services
48
Customer Service managers have been continuously working on ways to improve teams’
performances through the use of these reporting tools. Once Farfetch has three contact channels
available for customers using several languages, many different resource allocations are
possible. The goal is to have the right number of resources at the right times for the right
languages. Defining the optimal combination is an iterative process, which requires accurate
and reliable data to do the right adjustments.
Even though the Customer Service Department is not responsible for some of the metrics, they
have an impact on the performance of the Department as a whole. With the inclusion of this
type of KPIs and the division of indicators according to their sources, CS teams have the
perception of what type of metrics they are directly responsible for, and top management has
means available for acting on the areas of the company that present the worst results.
Furthermore, after the implementation of these reporting methods and based on the recent
results, understanding where the current processes fail will be an easier task. This continuous
improvement activity should lead to the improvement of internal processes, not only in the CS
Department, but in all other departments that interact with customer services. This type of
management should help Farfetch to boost the quality of customer support processes with a
positive effect on customer perceptions.
Beyond the reporting tools and the new measurements implemented, the modification of the
way how chat works can also be considered an action taken to improve customer experience.
With the dynamic chat, Farfetch avoids the legitimate customers’ dissatisfaction generated by
the unsuccessful attempts to start a chat conversation, managing at the same time customers’
expectations. Although the impact of this new feature cannot be directly measured, it is evident
the improvement on customers’ experience when the chat option is hidden in cases when
Farfetch is not able to offer an available agent. Despite not being part of this dissertation, this
development arose from the problem identified when redesigning the Key Performance
Indicators.
The redefinition of customer promise hours for calls was another measure taken to improve
customer experience. Since Farfetch was not able to provide customers the hours promised on
the website for the various phone lines and languages, it did not make sense to keep them
announced. The hours have been updated based on the evaluation of the most influential
countries in terms of orders. For this reason, specific language support lines cover the standard
working hours period (Mon-Fri, from 09:00 to 18:00) in the respective countries and regions,
and English support lines, which cover USA, United Kingdom and all the other countries that
do not have a specific phone line, cover extra week hours (from 08:00 to 23:00) and weekends
(from 09:00 to 21:00). Furthermore, the feasibility of working hours for agents was also taken
into account and, for this reason, Russian line has one hour deviation from the standard
language lines hours. Currently, Customer Service teams can guarantee that the hours offered
on the portal are covered by agents.
Despite the visible improvements on the performance level after this project, it is expected that
the benefits delivered are significantly bigger in the future. Improvement is a longstanding
process that involves a cultural shift, therefore it can take months or years until this shift is
completely implemented. If this is achieved, it will certainly allow the company to provide an
excellent customer support service level.

Development of a framework for the measurement and control of customer support services
49
5 Conclusions and Future Projects
Online luxury customers have been continuously increasing their requirements in terms of the
offer provided. In order to maintain competitiveness in this industry, it is necessary to guarantee
the provision of an excellent service in many ways, including quality, price and the range of
products available. A first-rate service at all the levels is primordial for the global success of
the company. Especially customer support services assume vital importance, since these are
often the only direct means of communication between the customers and the company.
The needs of Farfetch in terms of customer support services have increased continuously.
However, the former level of quality offered was short of expectations. In this segment,
customers do not hesitate to express their demands. For these reasons, Farfetch recognized the
need to act in order to provide customers an excellent support service. This dissertation intended
to create the means to increase the customer support service level, through the redefinition of
Key Performance Indicators and the development of mechanisms for their measurement and
control, such as reports and dashboards.
After this project, all the players involved in the Customer Service have become more aware of
the performance of the Department at different levels: global, by team and individual. Through
the framework developed, the players have multiple sources of information available that can
help them to improve customer support services. With the various reporting tools, they can
assess performance in different ways and periodicities. Furthermore, with the increasing
complexity of Farfetch support services, mainly caused by the addition of new languages, it is
vital to guarantee that these ones can be measured and controlled, in order to guarantee a full
control of the Customer Service actions.
With the contribution of the solutions developed, the performance of the Department has
improved significantly. In the first twelve weeks after the implementation of first report, the
Response Rate increased from 60.2% to 86.4%, despite the growth of 11.7% in the number of
contacts generated. Besides this KPI, the improvements have also been verified in the three
areas assessed on this project: Operational Efficiency, Service Quality and Customer
Satisfaction. The most relevant ones are related to the increase of the percentage of calls
answered, from 67.2% (gross) and 73.6% (within customer promise) to 80.2% (gross) and
87.4% (within customer promise), and the reduction of the percentage of tickets solved with
reopens, from 29.4% to 24.4%. Furthermore, the dynamic chat and the redefinition of the hours
promised on the portal and were two actions taken to improve the customer experience.
5.1 Future Projects
Businesses are becoming more and more competitive and companies’ strategies have to take
this into account. Creating means to measure and control performance in different ways and
adopting different viewpoints is currently considered one of the most important assets for big
companies.
The selection of the metrics was limited by the data available from each of the channels
providers. For instance, the creation of extra metrics, such as Service Quality and Customer
Satisfaction KPIs, was not possible in terms of calls and chats. As a further development, it
would be important to consider the change of providers. With benchmarking studies and SWOT
(Strengths, Weaknesses, Opportunities and Threats) analysis, it should be possible to select the
providers that best fit Farfetch needs in terms of customer support services. Apart from their
functionalities, these providers should be able to make available multiple types of data so that
the creation of meaningful metrics is possible.
Another important development would be the creation of a real-time dashboard. The more up
to date and accurate the information is, the more quick can be the reaction to changes in the
business environment. However, due to the current data synchronization periodicity, it is not

Development of a framework for the measurement and control of customer support services
50
possible to have such type of reporting. With this type of dashboard, peaks of volume in the
different channels could be rapidly assessed and personnel allocation could be configured
accordingly.
When defining KPIs, the establishment of targets is essential. The measurement of the values
should be assessed as meeting expectations or not. However, for most of the metrics the targets
have not yet been defined. Since the company aims to deliver the best customer experience in
the market, the targets will have to be very tight. Their establishment would not make sense
within the time frame of this project, once the performance of the Customer Service Department
is very low and the targets would certainly not be reached. These ones should be established as
soon as the values of the KPIs implemented stabilize. Together with the establishment of the
targets, it will also be relevant to adapt the visuals, for example through the addition of straight
lines, conditional formatting and traffic light colors.
Even though customer promise hours for calls have been established according to the standard
working hours and feasible working hours for agents, it will be important to keep an eye out on
these hours and, eventually, in the future adapt them to customers’ demand. Through the use of
the dashboards, it should be possible to understand the need to readjust them.
As mentioned in the first chapter of this dissertation, Brazilian CS Team works in a separated
way, with different providers for each one of the channels. In addition to this, the Brazilian
team only supports Brazilian customers. The development of the same type of reporting
methods for this team should be considered in the future. With this implementation, Farfetch
should also be able to increase the performance and the service provided to the Brazilian market.
Currently, it is implemented a very simple process for the global and team weekly productivity
evaluation. It consists on a comparison between the total hours expected to solve the number of
contacts actually solved for the three contact channels (including tickets solved, chats answered,
calls inbound answered within customer promise and calls outbound answered) and the total
hours available by the agents during the week. The first one is calculated through the attribution
of an estimated average resolution time by contact channel, based on the measurement of
handling times by channel. Due to the providers’ limitation, it is not possible to calculate them
accurately. As a future work, and with the eventual change of providers, it should be possible
to find a way to accurately know the number of contacts solved and working time by agent.
With this, it would be possible to calculate weekly and daily productivities on a global, team
and individual scale.
After the creation of these reporting methods for the Customer Service Department, similar
projects for other areas of the company can be created. For example, a similar framework should
be created for the Partner Services Department, once this one is related to the services provided
by the suppliers of Farfetch, the Partner Boutiques. Therefore, the quality of the services
provided by them also influences the end customers’ perception of the company.
Farfetch has continuously been developing new solutions to provide its customers the best
experience in the market. The number of services provided will certainly continue to increase
in the future and the creation of means to measure and control them is imperative. The
establishment of KPIs and the design of reporting tools, such as the report and dashboards
developed along this project, will be one of the keys for the achievement of the strategic goals
of the company.

Development of a framework for the measurement and control of customer support services
51
References
Bauer, Kent. 2004. "KPIs–the metrics that drive performance management." DM Review 14
(9):63-64.
Bourne, Mike, John Mills, Mark Wilcox, Andy Neely, and Ken Platts. 2000. "Designing,
implementing and updating performance measurement systems." International Journal
of Operations & Production Management 20 (7):754-771.
Chaudhury, Abhijit, Debasish Mallick, and H. Raghav Rao. 2001. "Web channels in e-
commerce." Commun. ACM 44 (1):99-104. doi: 10.1145/357489.357515.
Coimbra, E. 2013. Kaizen in Logistics and Supply Chains: McGraw-Hill Education.
Cox, J., and B.G. Dale. 2001. "Service quality and e‐commerce: an exploratory analysis."
Managing Service Quality: An International Journal 11 (2):121-131. doi:
doi:10.1108/09604520110387257.
DeBusk, Gerald K, Robert M Brown, and Larry N Killough. 2003. "Components and relative
weights in utilization of dashboard measurement systems like the Balanced Scorecard."
The British Accounting Review 35 (3):215-231.
Eccles, Robert G. 1990. "The performance measurement manifesto." Harvard business review
69 (1):131-137.
Elmorshidy, A. 2011. "Benefits Analysis of Live Customer Support Chat in E-commerce
Websites: Dimensions of a New Success Model for Live Customer Support Chat."
Machine Learning and Applications and Workshops (ICMLA), 2011 10th International
Conference on, 18-21 Dec. 2011.
España, Fernando, Cynthia CY Tsao, and Mark Hauser. 2012. "Driving Continuous
Improvement by Developing and Leveraging Lean Key Performance Indicators."
Few, Stephen. 2006. Information dashboard design: O'Reilly.
Froehle, Craig M. 2006. "Service Personnel, Technology, and Their Interaction in Influencing
Customer Satisfaction*." Decision Sciences 37 (1):5-38.
Imai, M. 2012. Gemba Kaizen: A Commonsense Approach to a Continuous Improvement
Strategy, Second Edition: McGraw-Hill Education.
Isaacs, A. A., and D. A. Hellenberg. 2009. "Implementing a structured triage system at a
community health centre using Kaizen." South African Family Practice 51 (6):496-501.
doi: 10.1080/20786204.2009.10873913.
Jäntti, Marko, and Niko Pylkkänen. 2008. "Improving Customer Support Processes: A Case
Study." In Product-Focused Software Process Improvement, edited by Andreas
Jedlitschka and Outi Salo, 317-329. Springer Berlin Heidelberg.
Johan, Åberg, and Shahmehri Nahid. 2000. "The role of human Web assistants in e‐commerce:
an analysis and a usability study." Internet Research 10 (2):114-125. doi:
10.1108/10662240010322902.
Kapferer, J. N. 1997. "Managing luxury brands." J Brand Manag 4 (4):251-259. doi:
10.1057/bm.1997.4.
Kapferer, Jean-Noel, and Anne Michaut-Denizeau. 2014. "Is luxury compatible with
sustainability[quest] Luxury consumers/' viewpoint." J Brand Manag 21 (1):1-22. doi:
10.1057/bm.2013.19.

Development of a framework for the measurement and control of customer support services
52
Karkoszka, T, and D Szewieczek. 2007. "Risk of the processes in the aspect of quality, natural
environment and occupational safety." Journal of Achievements in Materials and
Manufacturing Engineering 20 (1-2):539-542.
Lee, Gwo-Guang, and Hsiu-Fen Lin. 2005. "Customer perceptions of e-service quality in online
shopping." International Journal of Retail & Distribution Management 33 (2):161-176.
Marr, Bernard, and Andrew Neely. 2004. "Managing and measuring for value: the case of call
centre performance."
McCormick, Helen, Jo Cartwright, Patsy Perry, Liz Barnes, Samantha Lynch, and Gemma Ball.
2014. "Fashion retailing – past, present and future." Textile Progress 46 (3):227-321.
doi: 10.1080/00405167.2014.973247.
McNeeney. 2005. "Selecting the Right Key Performance Indicators."
Neely, Andy. 1999. "The performance measurement revolution: why now and what next?"
International Journal of Operations & Production Management 19 (2):205-228.
Neely, Andy, Mike Gregory, and Ken Platts. 1995. "Performance measurement system design."
International Journal of Operations & Production Management 15 (4):80-116. doi:
doi:10.1108/01443579510083622.
Okonkwo, Uche. 2009. "Sustaining the luxury brand on the Internet." J Brand Manag 16 (5-
6):302-310.
Olson, Judith S., and Gary M. Olson. 2000. "i2i trust in e-commerce." Commun. ACM 43
(12):41-44. doi: 10.1145/355112.355121.
Parasuraman, Anantharanthan, Leonard L Berry, and Valarie A Zeithaml. 1991.
"Understanding customer expectations of service." Sloan Management Review 32
(3):39-48.
Pauwels, Koen, Tim Ambler, Bruce H Clark, Pat LaPointe, David Reibstein, Bernd Skiera,
Berend Wierenga, and Thorsten Wiesel. 2009. "Dashboards as a service: why, what,
how, and what research is needed?" Journal of Service Research.
Pruzhansky, Vitaly. 2014. "Luxury goods, vertical restraints and internet sales." European
Journal of Law and Economics 38 (2):227-246. doi: 10.1007/s10657-012-9335-2.
Rocha, Mafalda. 2014. "Impacto Do Kaizen Numa Empresa De Serviços." Available at SSRN.
Shankar, Venkatesh, Amy K. Smith, and Arvind Rangaswamy. 2003. "Customer satisfaction
and loyalty in online and offline environments." International Journal of Research in
Marketing 20 (2):153-175. doi: http://dx.doi.org/10.1016/S0167-8116(03)00016-8.
Singh, Jagdeep, and Harwinder Singh. 2009. "Kaizen philosophy: a review of literature." IUP
Journal of Operations Management 8:51-73.
Tate, Wendy L, and Wendy van der Valk. 2008. "Managing the performance of outsourced
customer contact centers." Journal of Purchasing and Supply Management 14 (3):160-
169.
Titu, Mihail Aurel, Constantin Oprean, and Daniel Grecu. 2010. "Applying the Kaizen Method
and the 5S Technique in the Activity of Post-Sale Services in the Knowledge-Based
Organization." Hong Kong.
Weber, Al. 2005. "Key Performance Indicators – Measuring and Managing the Maintenance
Function." Ivara Corporation.
Wind, Yoram Jerry. 2005. "Marketing as an engine of business growth: a cross-functional
perspective." Journal of Business Research 58 (7):863-873.

Development of a framework for the measurement and control of customer support services
53
Yigitbasioglu, Ogan M, and Oana Velcu. 2012. "A review of dashboards in performance
management: Implications for design and research." International Journal of
Accounting Information Systems 13 (1):41-59.

Development of a framework for the measurement and control of customer support services
54
APPENDIX A: Executive Weekly Report

Development of a framework for the measurement and control of customer support services
55

Development of a framework for the measurement and control of customer support services
56
APPENDIX B: Weekly Queries
Solved Tickets
Created Tickets

Development of a framework for the measurement and control of customer support services
57
Carryover Tickets
Calls
Chats
NPS
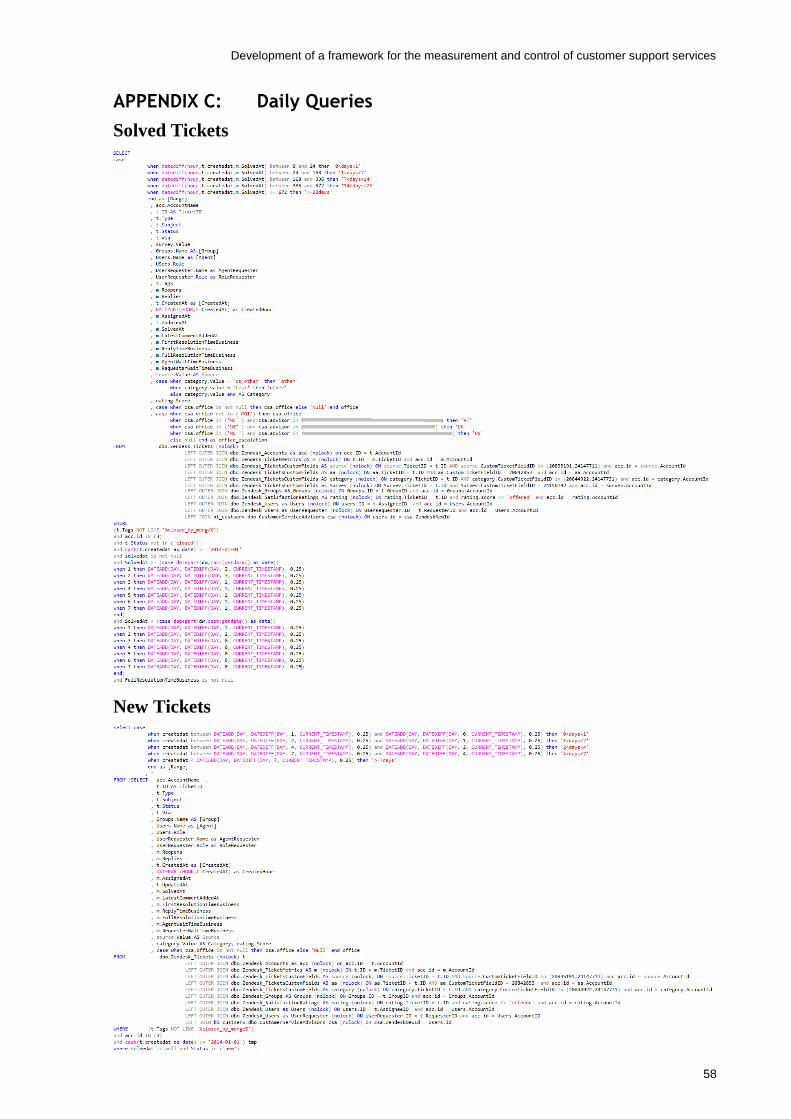
Development of a framework for the measurement and control of customer support services
58
APPENDIX C: Daily Queries
Solved Tickets
New Tickets

Development of a framework for the measurement and control of customer support services
59
Backlog Tickets
Created Tickets

Development of a framework for the measurement and control of customer support services
60
Calls
Chats

Development of a framework for the measurement and control of customer support services
61
APPENDIX D: Daily Management Dashboard

Development of a framework for the measurement and control of customer support services
62
APPENDIX E: Weekly Management Dashboard