development of a â•œ2-dâ•š test system for …
TRANSCRIPT

Syracuse University Syracuse University
SURFACE SURFACE
Dissertations - ALL SURFACE
May 2016
DEVELOPMENT OF A “2-D” TEST SYSTEM FOR VISUALIZING DEVELOPMENT OF A “2-D” TEST SYSTEM FOR VISUALIZING
FRETTING CORROSION: A STUDY OF THE FRETTING CORROSION FRETTING CORROSION: A STUDY OF THE FRETTING CORROSION
BEHAVIOR OF Co-Cr-Mo ALLOY BEHAVIOR OF Co-Cr-Mo ALLOY
DongKai Zhu Syracuse University
Follow this and additional works at: https://surface.syr.edu/etd
Part of the Engineering Commons
Recommended Citation Recommended Citation Zhu, DongKai, "DEVELOPMENT OF A “2-D” TEST SYSTEM FOR VISUALIZING FRETTING CORROSION: A STUDY OF THE FRETTING CORROSION BEHAVIOR OF Co-Cr-Mo ALLOY" (2016). Dissertations - ALL. 497. https://surface.syr.edu/etd/497
This Thesis is brought to you for free and open access by the SURFACE at SURFACE. It has been accepted for inclusion in Dissertations - ALL by an authorized administrator of SURFACE. For more information, please contact [email protected].

i
ABSTRACT
Fretting corrosion, one of the most common forms of mechanically-assisted corrosion
(MAC), has become a major concern in orthopedic medical devices. In order to a better
understand of the mechanism of fretting corrosion in orthopedic alloys and the ways to
prevent implants from corroding, custom test systems need to be developed to simulate
fretting corrosion in vitro and to allow visualizing of the process. This study aimed to
develop a new “two dimensional” fretting crevice corrosion test system with the capacity
to visualize damage progression during systematic controlled fretting corrosion
processes. Another goal of the study was to experimentally verify a tribocorrosion
heredity integral approach to predict abrasion-current-impedance-voltage relationships by
systematic variation of fretting frequency and area. The results of Open Circuit Potential
(OCP) tests, fretting current tests and visualization of fretting showed this device could
achieve the basic requirement for triboelectrochemical testing and also provided direct
evidence of debris generation during fretting corrosion. The fretting region was
surrounded by a halo of fretting debris after removal from the solution. One possible
explanation for this phenomenon could be the redeposition of fretting product. It was also
found that higher fretting frequency and smaller second electrode areas lead to larger and
faster voltage drops during abrasion. This is because the smaller area of the second
electrode resulted in less surface area for electrons to be reduced. Higher frequency
abrasion also resulted in higher film currents and faster electron generation rate which
would cause more electrons accumulating at the working electrode.

ii
DEVELOPMENT OF A “2-D” TEST SYSTEM FOR VISUALIZING FRETTING
CORROSION: A STUDY OF THE FRETTING CORROSION BEHAVIOR OF
Co-Cr-Mo ALLOY
By
Dongkai Zhu
B.E. Prosthetic and Orthotic Engineering, Capital Medical University, China
Thesis
Submitted in partial fulfillment of the requirements for degree of Master of Science
(M.S.) in Bioengineering
Syracuse University
May 2016

iii
© Copyright 2016 Dongkai Zhu
All rights reserved

iv
ACKNOWLEDGEMENT
I would like to use this opportunity to thank all people who helped me to finish this
thesis and encouraged me for moving forward.
First, I would like to express my deepest gratitude to my advisor, Dr. Jeremy
Gilbert. Without his selfless guidance, not only from his knowledge and deep insight in
science but also his scientific attitude when we have face-to-face interaction, I could not
become who I am now. I feel so lucky and proud that I could be one of his student to
finish my Master degree. As an advisor, he believes that I could overcome every obstacle
that I met during the whole project and still holds strong faith on me that I can go further
in my future.
I would like to thank my committee member Dr. Alan J. Levy, Dr. Julie M.
Hasenwinkel and Dr. Pranav Soman and all professors that I have taken courses with
during these years. And all the help from the machine shop at link hall, Richard Chave,
William Patrick Dossert and the machine shop from department of physics, Charlie
Brown. I cannot build my fretting device without their help.
I would also like to thank all my friends and labmates for their support and help.
Dr.Soman group, Shiril Sivan, Sachin Mali, Yangpin liu, Eric S. Ouellete, Greg
Kubacki,David Pierre, Aarti Shenoy and Huiyu Shi. Zhe li deserves my special thanks
for his help to develop the LabVIEW program for data collection.
My last thanks will go to my parents. The love they give to me is the best gift that I
could ever had. They always have the deepest faith on me that I could do anything I want,

v
which will support me against all difficulties I will meet in the rest of my life. I also want
to thank my girlfriend for her love and support, which strengthen my courage to face any
difficulties.

vi
TABLE OF CONTENTS
LIST OF FIGURES………………………………………………………………..….…vii
1. Introduction………………………………………………….......………...…………1
2. Goal and Hypotheses…………………………………………………………..…...11
3. Instrument Development………………………………………………………..…13
3.1. Introduction…………………………………………………………………….13
3.2. Mechanical Part………………………………………………………………..14
3.3. Electrochemical Part…………………………………………………………..16
3.4. Data Acquisition and Analysis Part…………………………………………..18
4. Experimental Methods and Material…………………………………………...…20
5. Experiment Results………………………………………………………..………..24
5.1. Basic Operation Experiments…………………………………………………24
5.2. Observation of Fretting Debris Generation………………………………….29
5.3. Frequency and Electrode Area Affection of Voltage Drop during Fretting.34
6. Discussion…………………………………………………………………………...40
7. Conclusion………………………………………………………………………..…46
8. Summary………………………………………………………………………….....47
9. Appendix……………………………………………………………………..……...49
10. Reference……………………………………………………………………..……..50
11. Vita…………………………………………………………………………..………56

vii
LIST OF FIGURE
Figure 1: Schematic of the consequence of fretting corrosion. Note that green arrow
stands for the direction of fretting motion………………………………………………...3
Figure 2: Two visualized-involved fretting test system build by Geringer et al, (right) and
Kim et al, (left)…………………………………………………………………………….9
Figure 3. Second draft schematic of fretting corrosion test system from SolidWorks
program…………………………………………………………………………………..16
Figure 4. Figure 4. Top view of schematic of electrochemical part………………..……18
Figure 5. Screenshot of LabVIEW program front panel that could graph and collect
electrochemical and mechanical data simultaneously………………………………….. 19
Figure 6: A representative plot of the OCP vs. time of both pin (CoCrMo) and disk
(CoCrMo)…………………………..…………………………………………………….24
Figure 7. Potential vs time and fretting current vs time during fretting corrosion (5-7
s).........................................................................................................................................26
Figure 8. Stage movement vs time, lateral deflection vs time and friction force vs time
during fretting corrosion (5-7)……………………………..…………………………….27
Figure 9. COF vs time and energy loop during fretting corrosion (5-7 s)…………….…28
Figure 10. Average fretting current vs. normal load for CoCrMo pin and CoCrMo disk at
-100 mV vs. Ag/AgCl (n=1)………………………………………………………..……29

viii
Figure 11. Digital microscope image of debris generation from CoCrMo pin and disk at
different times....................................................................................................................30
Figure 12. Digital microscope picture for fretting trace at different magnifications …....32
Figure 13. Digital microscope images of both pin and disk. ……………………..……..33
Figure 14. The voltage versus time for different second electrode area (0.018 cm2, 0.213
cm2, 0.352 cm2, 0.927 cm2) and frequencies (0.2 Hz to 10.0 Hz)………………….……35
Figure 15. Voltage drop vs. frequency for different second electrode area (n=3)…...…..37
Figure 16. Voltage drop vs. second electrode area for different frequencies (n=3)……. 38
Figure 17. Detail of voltage drop vs. time during fretting for a single sample at different
frequencies……………………………………………………………………………….39
Figure 18. Schematic of one possible mechanism of halo generation…………...............42
Figure 19. Schematic of the fretting electrochemical circuit…………………….………45
Figure 20. Screenshot of CorrWare (up) and ZPlot (down) working window with
experiment setup…………………………………………………………………………49

1
INTRODUCTION
Metallic orthopedic devices, such as joint replacements, spinal screws as well as
bone plates, have been widely used over decades. Many biometallic materials like
stainless steel (316LSS), titanium-based alloy (Ti6Al4V) and cobalt-chromium alloy
(CoCrMo) have been documented as suitable implant materials. The main reason behind
these popular materials is that they have excellent mechanical properties and
biocompatibility. There are usually five contact combinations for total hip replacements:
metal-on-body (MOB), metal-on-ceramic (MOC), ceramic-on-polymer (COP), metal-on-
metal (MOM) and metal-on-polymer (MOP). The interface of each combination has its
own unique characteristics. There are many designs for different material combinations
that depend on the specific situation.
Implant material failures have been reported in vivo and many of them occur prior
to the ideal lifetime of implant system [1][2][3][4]. Metal-on-metal (MOM) connections
(e.g., modular taper junction) cannot avoid the generation of corrosion and wear debris
that may result in biocompatibility concerns [5][6]. Degradation of implants is associated
with loosening, local tissue reactions and other issues. Biological reactions, like local
inflammatory reactions, stress shielding, pain in the joint and osteolysis, to name a few
have been associated with metal degradation processes [7][8][9][10]. Typically, failed
implant surgery results in revisions.
Many techniques and designs have been developed to help prevent implant
corrosion. Surface coating is one approach to minimize interface corrosion [11][12][13].

2
For instance, Swaminathan et al., showed that chromium oxide-coated Ti6Al4V and
CoCrMo alloy have suitable electrochemical properties as a hard bearing surface [14].
Two retrieval studies also showed that bearing surface materials and head size affect
corrosion behavior at modular junctions for total hip replacement while other literature
found that large femoral heads might increase the damage at the modular taper junction
of MOP implants [15][16][17].
Implant materials modification is also a useful tool to enhance bearing surface
corrosion resistance [18]. For instance, Kaushik et al., [19] developed a metallic glass
thin film (TiCuNi) with good biocompatibility upon exposure to muscle cells. Low coast,
viscoelastic behavior, high electrical conductivity, and the capability to coat various
materials make this metallic glass thin film (TiCuNi) as an accretive material for
biomedical application. However, failures still happens.
Many retrieved implants show evidence of corrosion and wear phenomena [20].
Mechanically assisted corrosion (MAC) is due to an interaction between mechanical and
electrochemical factors leading to accelerated damage. MAC happens at the interface of
two phases and may damage both surfaces. MAC consists of micro-motion, which is less
than 100 µm, between two surfaces that disrupt the passive oxide film and accelerates
corrosion. Asperities on both surfaces (if a metal-metal junction) will abrade the surface
oxide film, when fretting motion in initiated, it will give rise to a series of redox reactions
due to abrasion of the two surfaces. The redox reactions will shift the potential of the
implant and generate currents called fretting corrosion current.
Oxide films are the most significant feature of the surface of the implant metal to
limit corrosion (see Fig. 1). The potential of oxide-covered surfaces is relatively stable if

3
there is no fretting motion causing oxide disruption. The potential when no oxide
disruption occurs is called the resting Open Circuit Potential (OCP) and it depends on the
characteristics of the metal itself and the reduction reactions present. When the oxide film
is disrupted, oxide repassivation and metal ion release into the solution will generate
significant drops in electrode potential and will affect the local environment. For
Ti6Al4V alloy, the oxide film formed is usually TiO2. The main composition of oxide
film for CoCrMo alloy and 316LSS is Cr2O3. The valance of Cr ion depends on the
potential and may become Cr6+ at high potentials. These toxic species may have a
negative effect on the human body [21][22]. Fretting motion can cause not only oxide
film fracture but also debris generation. Debris may accumulate at the junction or be
released into the periprosthetic tissue.
Figure 1. Schematic of the consequence of fretting corrosion. Note that green arrow
stands for the direction of fretting motion.
4
The disruption and reformation of oxide films usually occurs in conjunction with
ion release. Redox reactions, which happen at interface, will generate different ions,
including metal ions (e.g. Ti2+, Cr3+) and other ions with positive or negative charge (e.g.
H+, OH-). The ions will be released into the solution once the oxide film is disrupted and
reformed. For phosphate buffered saline (PBS) solution, H+ will attract Cl- due to the
charge attraction force and form HCl. This environment can lead to a pH drop, thus
creating a highly localized aggressive condition and will give rise to further corrosion
known as crevice corrosion. Fretting corrosion is usually accompanied by crevice
corrosion. Pitting corrosion is another reason for device failure and has been observed
and documented in many studies [23][24][25][26]. Pitting corrosion results, in part, from
depassivation of a very small region of the surface. Corrosion attack penetrates the oxide
film and leaves a tiny hole in the surface. Many reasons may cause pitting corrosion, such
as fretting, metal combination and surface geometry, etc. Recently, Gilbert et al,
proposed that inflammatory cells may release chemical species that can cause corrosion
on CoCrMo alloy based on retrieval analysis [27].
Although implant materials, including metals, have been studied for decades, there
is more to be understood about fretting corrosion. There are several reasons for studying
the fretting corrosion of CoCrMo alloys. Pearson et al., concluded that individual blood
shows different responses to CoCrMo alloy debris and the responses can be an indicator
of suitability for patient to receive MOM arthroplasty [28]. Liao et al., revealed that many
studies point out that Cr ions show up in patient serum and urine and the concentration
increases with time [29].

5
Many theories have been developed to better understand device failure and the
study methods can be divide into several aspects: retrieved study, cell culture study, in
vitro study and in vivo study. For example, Swaminathan and Gilbert developed a
tribocorrosion equation to describe the interaction of mechanical and electrochemical
factors: [30]
Eq. 1
The calculation of fretting current, denoted as Ifilm, is based on many parameters such as
oxide density (ρ), effective valance of oxide (n), Faraday’s constant (F) and Mw is the
molecular weight of oxide. Vnom is the nominal abrasion volume of oxide film and ∆ is
the average interasperity distance on the contact area. The time derivative of amplitude
(δ) can be defined as sliding speed and it equals the frequency (ν) times two times (δ).
This equation shows that fretting currents are determined by a combination of mechanical
factors and material properties. In addition, there are many other factors that affect the
fretting currents such as the potential across the interface, the solution chemistry, the
impedance of the whole system and the surface geometry, etc.
The potential drop across the electrode interface and the current. Though it can be
measured using a three-electrode electrochemical cell. This system contains a working
electrode (WE), which usually is the sample itself, a counter electrode (CE) and a
reference electrode (RE). Carbon rod or platinum electrode are the most common counter
electrodes and Ag/AgCl or saturated calomel electrode (SCE) is usually used as the
reference electrode. As for the mechanical data, different sensors, such as linear variable

6
differential transformers (LVDTs) and differential variable reluctance transducer
(DVRTs), are used depending on the situation. Electrochemical impendence spectroscopy
(EIS) is another useful technique to study the electrochemical phenomenon of different
materials and has been used to study corrosion behavior [31][32][33]. Haeri et al,
developed a time-based equation to better describe the metallic biomaterials non-ideal
impedance behavior of CoCrMo surface [34]. The basic principle for EIS is to apply an
oscillating voltage, usually a sinusoidal wave, as input and to analyze the corresponding
output of current. The results are then fit to one of several classic electrical analog
models, like the Randles circuit, to obtain the resistance and capacitance of the test
system.
Many factors affect EIS results based on published papers. Gilbert et al, showed
that small increases in H2O2 concentration in phosphate buffered saline (PBS) solution
result in large decreases in the low frequency (i.e., oxide) impedance of CoCrMo surface
[27]. Ribeiro et al., revealed that 10% hydroxyapatite coating on CoCrMo (CoCrMo-
10HAP) can decrease the low frequency impendence as well [35]. Time was another
underlying factor that would lead to the change of impendence. Also, exposed electrode
area is another factor known to affect impendence.
Electrode area affects current and potential behavior during fretting corrosion.
Large electrode areas will cause lower voltage drops but higher fretting currents, and vice
versa. The key factor of this phenomena is the electron reduction reaction rate. Electrons
are generated from oxidation reactions and are accumulated at the metal surface and are
removed by reduction reactions, usually at the counter electrode (CE). Greater electron
generation and accumulation cause a larger potential drop due to the increased

7
accumulation of negative charges. Large areas provide more space for reduction
reactions, which means more electrons from the fretting surface can be distributed on the
surface to be reduced. This behavior will lead to less electron accumulation beneath
fretting surface, which will thereby lead to lower voltage drops. It is important to study
the relationship between electrode area and electrochemical parameters (potential and
current) because both voltage and current affect fretting corrosion and electrode area is
one of several parameters that can control their behavior.
For in-vitro testing, fretting currents are affected by normal load, fretting
amplitude, surface roughness, exposure area, fretting frequency and solution chemistry.
In order to control and capture these parameters simultaneously, fretting test systems
have been established to help scientists understand fretting corrosion and wear behavior
of different materials [36] [37][38][39][40][41]. Swaminathan and Gilbert, developed a
pin-on-disk fretting testing system that can capture electrochemical data, like fretting
current, and mechanical data, frictional force and relative displacement simultaneously.
This device can also test different material combinations instead of only using fixed
sample couples [30]. Billi et al., also presented a system to characterize modified
Ti6Al4V alloy surfaces after exposure to fretting corrosion. The most attractive feature of
this test system is that it can test three different sample combinations at same time [42].
Another set up from Royhman et al., can study the fretting corrosion of a single sample
rod while it is in contact with two different materials. Note that all three alloys materials
are in the same solution in same set up [43].
Even though the goal for each test is different, there are still many similarities for
different fretting corrosion testing devices. They all need three elements, which include a

8
way to set enough load to make sample contact, a motor that can generate micro motion
with appropriate amplitude and an electrochemical test device to adjust or record the
corrosion behavior of whole system, to perform fretting corrosion tests. For each system,
the ways to collect data depend on the goals that this system wants to achieve. But they
all have something in common. For instance, a three electrode cell is widely used for
most fretting corrosion test system. However, other corrosion test set ups may be
designed to capture specific electrochemical data [44][45]. Different load and
displacement sensors are used in fretting test systems to collect mechanical and
kinematical data as well. It is essential to list all requirements before designing and
building test system.
Even though numerous designs and theories help scientists have a better
understanding of fretting corrosion, the process of how implants fail is still not clear, in
part, due to a lack of ability to visualize the fretting corrosion process, especially dynamic
video data. There are few case reports or papers involved in this aspect of the process.
Geringer et al, designed a custom fretting corrosion test system to investigate the
degradation between 316L steel and poly(methyl methacrylate), known as PMMA. In this
study, a CCD camera was used to allow the continuous recording of contact conditions
during fretting through transparent PMMA. Many pictures were acquired from that
camera and showed a clear trend of increasing wear degradation with increasing load
[46]. Other published literature from Kim et al, introduced a fretting test system which
has similar features as the previous one, to study the coefficient of friction and fretting
wear rate between 316L stainless steel and PMMA. This machine allows the operator to
observe the fretting conditions or let the camera record the whole process [47]. However,

9
both systems focus on the mechanical aspects of fretting corrosion, such as friction force
and energy loss, and pay little attention to the details of fretting corrosion, like debris
generation, and changing of electrochemical parameters, (e.g. voltage and fretting
current). It is useful to combine electrochemical and mechanical testing with visualization
to better understand the fretting corrosion process.
Figure 2. Two fretting test systems with visualization capabilities build by Geringer et al,
(up) and Kim et al, (down).

10
In this study, a new fretting corrosion testing system is developed to perform
visualized testing and to collect electrochemical and mechanical data concurrently. Some
of the advantages of this system are that it has less solution volume between two glass
slides to capture debris, it interrogates small contact areas, and the transparent glass
allows the operator to use a microscope to observe and record the details of fretting
corrosion during the whole process. Another novel feature of this system relates to
sample preparation. As a modified pin-on-disk fretting test system, the contact area is
small and leads to relatively large contact stresses even with small normal forces applied
to the surface. This combined set of capabilities should provide an ability to explore a
range of research questions associated with the process of fretting corrosion.

11
GOALS AND HYPOTHESES
Long-term goal
The long-term goal of this thesis is to develop an in vitro visualized fretting
corrosion testing system to explore and understand the corrosion process of metallic
biomaterials and to use this system to answer fundamental questions related to the
mechanism of fretting corrosion. As the first step, this thesis has three specific aims and
underlying hypotheses as follows:
Specific Aim 1
Design and develop a “two dimensional” visualizing fretting test system to study
the interaction between two CoCrMo alloys engaged in fretting corrosion. The device
should be able to control and monitor mechanical and electrochemical parameters during
the fretting corrosion test and record dynamic data, like video, at the contact area, where
the fretting corrosion is taking place during the entire experiment.
Specific Aim 2
To observe and record the phenomenon of debris generation that results from
fretting corrosion interaction between two CoCrMo alloys.
Hypothesis

12
Metal and metal oxide debris is one of the main products resulting from fretting
corrosion that may cause some local tissue process or even potentially affect device
failure. Debris generation will occur during fretting and the quantities of debris will be
affected by fretting duration. Longer fretting duration can generate more debris. Fretting
corrosion will also leave obvious corrosion damage areas after fretting and this should be
observed on the fretting surface. Fretting area may be surrounded by debris deposition
due to the disruption of surface oxide film.
Specific Aim 3
To study the effect of fretting frequency and second electrode area on the current
and open circuit potential drop during fretting corrosion of CoCrMo alloys.
Hypothesis
The voltage will become more negative during fretting due to the fracture and
electrochemical repassivation of the oxide film. In addition, the fretting current will also
be affected by the changes in OCP during fretting. These effects are linked together by
the impedance character of the electrode surface which is, itself, affected by the area of
the electrode. As more area of second electrode is exposed in the solution, there will be
more surface for reduction reactions to occur, thus leading to less voltage drop. For the
same area, higher frequency will give rise to higher fretting currents and a larger and
more rapid voltage drop. These effects will be modeled based on the theory put forward
by Gilbert and Swaminathan and Gilbert, and the tests of frequency and area will be
assessed in this thesis.

13
INSTRUMENT DEVELOPMENT
Introduction
In order to have a better understanding of fretting corrosion, a new fretting test
instrument was developed to visualize and record the dynamic process of fretting
corrosion in vitro. From the visualization perspective, this system should contain
transparent components to allow the operator to watch and record the whole process of
fretting using a microscope or other observation devices. As for the mechanical aspect, a
thin-section pin-on-disk model is designed to achieve this purpose. The pin-on-disk
system has both mechanical and electrochemical aspects of testing. For corrosion, a three
electrode method was used to control and monitor voltage and current. Like many
traditional fretting test systems, this instrument can control the normal force, frequency,
contact area, displacement, voltage and current by adjusting different components in the
system. The operator can easily obtain many results, like coefficient of friction and the
work per fretting cycle, based on the measurement outcomes. However, beyond that, this
system can also allow the operator to observe the whole process of fretting corrosion,
such as debris generation. This novel feature can lead to a better understanding of the in
vitro fretting test and provide a visualized integration of the materials, mechanical and
electrochemical field. The system was designed using SolidWorks2013® software and
fabricated with the help of the department machine shop. It can be divided into three
parts: mechanical part, electrochemical part and observational part. Each of them work
independently. There are two systems for data collection, one uses a potentiostat to

14
measure and record impedance results and another one was designed with
LabVIEW2013® software for mechanical control and measurement.
Mechanical Elements
The mechanical part includes three sub-components: load cell, movement system,
and mechanical measurement system and each component has its own characteristics.
The load cell was a double-cantilever design with an aluminum mount, two brass
cantilevers, a displacement sensor (LVDT) with a core inside and a brass rod support.
This custom load cell generated a spring-like system with lateral rigidity to achieve its
function. There was a relative displacement between the stage mount and the senor itself
when two samples contacted with each other. The two cantilevers begin to bend and
continuously deflect with increasing relative displacement. This process generated force
that could be measured by the sensor. The more deflection of the cantilevers, the larger
force that the load cell applied. The load was perpendicular to a stage that performed
fretting motion.
The movement system (see Fig 3.) contained two parts, one was the fretting part
and another was the vertical position adjustment. For the fretting part, fretting motion
was performed by a piezoelectric actuator (burleigh®), which had a piezoelectric crystal
inside, an amplifier (PZ-300M, buleigh®), and a function generator (FG-8002, EZ
Digital®). The crystal could adjust its own length by receiving different magnitude of
voltage. In order to have fretting motion, a triangle wave signal was generated by the
function generator into the amplifier to change voltage magnitude from 0 V to 100 V.

15
The voltage allowed the piezoelectric actuator to provide up to 80 µm of micromotion. A
stage was mounted to the actuator and moved along with it to preform fretting motion.
Vertical position adjustment was accomplished by a linear stage (460A-X, Newport®).
This stage could adjust the height of the disk stage relative to the pin for proper
alignment.
In order to have complete measurement for the whole mechanical aspect of the
system, three sensors were used to measure the normal load, friction load and the lateral
displacement. Normal load could be measured through the relative displacement between
the load cell stage and the cantilever sensor, which uses a linear variable differential
transformers (LVDT) (DC 750-50, Macro Sensors®). The LVDT could measure the
relative displacement between the coil and the core, which is connected with the rod in
the load cell. Frictional force was obtained through a non-contact differential variable
reluctance transducer (DVRT) (SN3327, micro-epsilon®). This sensor could measure the
distance, which changed with frictional force, between the target and the sensors. The last
parameter was relative displacement between the pin and disk samples and it was the
difference between the stage movement, which could be measured by another LVDT
connected with sample stage, and the deflection of the pin. The raw data captured by
computer was in voltage and the data need to be converted to force based on the
calibration of each sensor.

16
Figure 3. This is a schematic of the fretting corrosion test system from the SolidWorks
program. Note that pin and disk are recognized by smaller rectangle and will be detailed
in the electrochemical section below.
Electrochemical Elements
The detailed relationship between working, reference and counter electrodes are
detailed in Fig. 14. The impedance of the electrode system was measured before and after
a fretting test. A three electrode configuration was used with a 10 mV sinusoidal voltage
Micrometer
Normal Load
Cell
LVDT
DVRT: Friction
Force and Lateral
Deflection
Measurement
Piezoelectric
Actuator
Vertical Position
Controller
Stage
Movement
Measurement
Movement
Stage
Glass Slides
and Sample
LVDT
Pin and Disk

17
applied to the working electrode (WE) over a range of frequencies from 20K Hz to 0.01
Hz. )Solartron 1280C Potentiostat/Frequency Response Analyzer (Solartron Analytical
Inc) and a software called ZPlot™).
As for studying the relationship between voltage drop and second electrode area, a
revised three electrode method was established to meet the purpose. A custom built
bipotentiostat was used to measure the OCP between working electrode (pin and disk)
and reference electrode (Ag/AgCl) and a zero resistance ammeter (485, KEITHLEY®)
was used to measure the current from the working electrode to a second electrode of
known area (i.e. CoCrMo alloy slice). The surface of the pin, other than the contact
surface, was covered with electrically isolating material (nail polish, Ciate). The disk
sample was attached to a thin slice of PLA using super glue (Gorilla® super glue).The
slice, made from polylactic acid (PLA), was printed from a 3-D printer into a rectangular
shape (Replicator™2, Makerbot®). The combined sample was stuck to a glass slide
(Fisherbrand®) using super glue. In order to ensure the alignment between the pin and
disk, a holder, which mounted onto the stage was made for this purpose. A metal screw
penetrated through the top of the holder and contacted with the disk sample, thus leading
to an electrical connection between the disk sample and the outside circuit. Another glass
slide was mounted to the top using double face tape (Scotch®) which left a small gap
between the two glass slides to allow for free sliding motion. Considering the thickness
of the tape, about 0.2 mm, there were two layers in the front area of the glass slide and
three layers in the rear to keep the two glasses slides separated from each other. The
reason for doing this was to keep the solution in the fretting region and prevent it leaking
(see Fig. 4).

18
Figure 4. Top view of schematic of electrochemical part. Note that WE is the working
electrode, RE stands for reference, CE stands for counter electrode and SE stands for
second electrode.
Data Acquisition and Analysis Elements
All mechanical and electrochemical data were acquired using two National
Instrument (NI) data acquisition boards (DAQs). A custom LabVIEW program (see Fig
5.) was developed to graph and save data from DAQ simultaneously. The program
CoCrMo Pin
CoCrMo Disk
DVRT
RE CE/SE
Solution Region
Fretting
Direction
FN
WE
WE

19
include some parts that are specific to acquire data from two LVDTs and the DVRT.
Electrochemical data, voltage and fretting current, was acquired from the biopotentiostat
and ammeter and was transferred into a digital signal in order to be read by the DAQ. All
data was saved as an Excel® file and was analyzed in Excel®.
Figure 5. Screenshot of LabVIEW program front panel that could graph and collect
electrochemical and mechanical data simultaneously. Note that number 1 and number 2
waveform chart graphed voltage and current data while number 3 and number 4
displayed the frictional force and relative displacement at same time. Number 5 was a
support waveform chart for the output voltage of DVRT.

20
EXPERIMENTAL METHODS & MATERIAL
The samples tested were CoCrMo alloy (ASTM 1537) slices and cone-shaped flat
bottomed pins (interfacing surface area nominally: 0.002 cm2 to 0.009 cm2). The disc
slice was cut using a low speed diamond saw in rectangle shape (thickness nominally:
0.34 mm to 0.89 mm). Each disc test surface was polished by hand to 600 grit using
emory paper until the scratches were aligned in a single direction and the whole process
of polishing was done after the disk slice was attached to the glass slide. After polishing,
the samples were cleaned in ethanol and DI water to remove any possible remaining
particles from the sand paper. In order to have a better electrochemical environment, a
relatively constant area, approximately 0.0045 cm2 (nominally: 0.003 to 0.006 cm2), was
exposed while the rest of the surface was covered by an electrically insulating material.
Only one trial was used for initial simple demonstration but three trials were performed
for each particular test where statistical analysis was performed. For basic operation
experiments, like voltage vs time, current vs time and frictional force vs time etc., the
results were to demonstrate that this system had the capability to meet the basic
requirements for a fretting corrosion test system. One trial was sufficient to demonstrate
system capabilities. As for fretting visualization experiments, three trials were needed to
prove that debris showed up at each trials. In addition, three trials were also needed to
explore the relationship between the potential drops and the other two factors: fretting
frequency and electrode area.

21
In order to show that this fretting corrosion test system can achieve the expected
goals, a series of tests were performed to demonstrate different functions of this system.
1. Basic Operation Experiment
The instrument’s basic operations were assessed in a series of preliminary
experiments at room temperature (RT). After calibration of all motion and load sensors,
the experimental set up, with phosphate buffered saline (PBS) solution, was assessed in
its OCP vs time behavior with both pin and disk exposed to the solution. The three
electrode electrochemical cell (WE, RE, CE) was used in this experiment. Test samples
were the working electrode (WE), a custom-made Ag/AgCl electrode was the reference
electrode (RE) and the gold foil was the counter electrode (CE). Then, impedance tests
were performed until the OCP stabilizing (about 2200 s). Solartron 1280C and ZPlot®
was used to record impedance data with the scanning frequency from 20K Hz to 0.01 Hz
under 10 mV scanning potential. Fretting corrosion tests were performed at the following
conditions: OCP condition, 0.5 N for normal load, 65 µm for sliding amplitude and 1.0
Hz for fretting frequency, to generate fretting corrosion current. The potential and fretting
currents were measured by the custom biopotentistat. The results were collected by DAQ
and graphed by the custom LabVIEW program. Pin and disk were separated but still
exposed in the solution to measure the impedance after fretting using the same software.
The next experiment was to assess the capability of load adjustment. Test samples
were exposed in the PBS solution for the same time as the first experiment. The fretting
amplitude was 65 µm and fretting frequency was 1.0 Hz. Eight different loads were

22
applied to the system from 0.08 N to 1.16 N at a fixed potential controlled by another
potentiostat (Model 263, EG&G®), -100 mV vs Ag/AgCl, to generate fretting corrosion
currents. Each test lasted for 5 second and under the same condition as the first
experiment except for the load. There was a 30 s gap between each test. All parameters,
including fretting current, normal load, frictional force and relative displacement, were
still collected by the DAQ system and graphed by the custom LabVIEW program. For
two experiments, one group of samples, including a single pin and a single disk, were
used for each experiment.
2. Observation of Debris Generation
To show that metal debris was generated during fretting corrosion, the whole
system was combined with a digital microscope (KH-870, Hirox®). The electrochemical
cell used in this experiment was the same as the first. Both pin and disk was exposed in
the PBS solution for 2200 s at room temperature (RT) before each test. Three trials were
performed for this experiment. The potential, -100 mV, was controlled by a potentiostat
(Model 263, EG&G®) during fretting. In order to have a better debris generation rate, 5
Hz and 0.7 N was used with 65 µm sliding amplitude. 350x magnification was used to
provide high resolution result during fretting. Video, which lasted for 5 seconds, was first
recorded at 12 min after the test started and continually recorded after 20min, 30 min, 60
min, and 120 min. The solution was removed after the test finished and images were
captured for both fretting interfaces and observation surface (on the side).

23
3. Frequency and Electrode Area Affects on Voltage Drop During Fretting
Four pieces of CoCrMo alloy covered by electrical insulation material were
exposed to solution with different areas: 0.018 cm2, 0.213 cm2, 0.352 cm2, 0.927 cm2.
Both pin and disk was exposed in phosphate-buffered solution (PBS) for 2200 s at room
temperature (RT) before test initiation and the impedance was measured using the basic
three electrodes cell (WE, CE, RE). Then a modified three electrode electrochemical cell,
where the counter electrode (CE) was replaced by the second electrode (SE), while the
other electrodes stayed the same. The normal load for the whole experiments was 0.5 N
and sliding amplitude was controlled at 65 µm. Three trials were needed for this
experiment. There were five different frequency (0.2 Hz, 0.5 Hz, 1.0 Hz, 5.0 Hz, 10.0Hz)
performed for each second electrode. For each test, the fretting duration lasted for 300 s
and the next test frequency started until the potential recovered to the beginning because
the potential would drop during fretting corrosion. Both mechanical and electrochemical
data were collected by the DAQ system and graphed by the custom LabVIEW program.
The impedance was also measured for each electrode after testing.

24
EXPERIMENTS RESULTS
1. Basic Operation Experiments
The OCP of both CoCrMo pins and disks stayed in a range from -400 mV to -150
mV (vs Ag/AgCl) in this experiment (see Fig 6. as an example). The OCP started around
-12 mV and continued to fall exponentially with time, about -170 mV at 2000 s.
Figure 6. A representative plot of the OCP vs. time of both pin (CoCrMo) and disk
(CoCrMo).
The impedance values for the different working electrode area varied with area (see
Table 1.) Rs stands for the solution resistance, Rp is the oxide film resistance and CPE-T
is the oxide film capacitance. There are several observations to discuss. First the
Pote
nti
al v
s A
g/A
gC
l
Time (s)

25
relationship between total area and Rp follows the trend that is larger area relates to
smaller Rp. The second concern is about the oxide film capacitance is increasing as the
total exposed area increases. These trends with area are also present after fretting. The
last one is about Rs, which is far smaller than Rp. It is clear that all Rs values before
fretting, in the table, is larger than the value after fretting.
Table 1. A representative impendence data before and after fretting. Note that the area in
this chart is total area which includes both the surface area of the pin and disk and the
exposed area of second electrode. The Rp of 0.93283 cm2 after fretting has extremely
high error percentage, which is not reliable.
These is a specific and direct link between the mechanics of fretting motion and the
electrochemical response (current and voltage). Potential keeps dropping during fretting
corrosion while the corresponding fretting current rises at each time (Fig. 7). When the
stage is moving, the pin first begins to bend which leads to the friction force changing
and then sliding through the fretting surface, which makes the friction force stay
relatively stable (Fig 8.). The coefficient of friction (COF) follows the same trend as
friction force. The energy loop shows the relationship between relative displacement,
Unit 0.02433 0.21883 0.35783 0.93283 0.02433 0.21883 0.35783 0.93283
Rs Ω 311.1 358 255.5 315.3 247.1 278.9 146.3 293.8
CPE-T F 1.25E-05 1.57E-05 1.87E-05 4.04E-05 1.29E-05 1.46E-05 2.11E-05 3.29E-05
Rp Ω 2.47E+06 1.32E+06 1.09E+06 9.26E+05 2.95E+06 1.48E+06 9.30E+05 2.14E+06
Second Electrode Area (cm²)
Before Fretting After Fretting

26
which is the difference between stage movement and lateral deflection of the pin, and the
friction force (Fig 9.).
Figure 7. Potential vs time and fretting current vs time during fretting corrosion (5-7 s).
Note that potential drop when fretting current rise. The phenomenon indicate that the
oxide film is disrupted and corrosion initiation.

27
Figure 8. Stage movement vs time, lateral deflection vs time and friction force vs time
during fretting corrosion (5-7 s). Note that the pin first deflect (sticking) and then slide
(sliding) through the fretting surface, thus causing fretting current. The friction force vs
time plot follow the same trend.
Sticking
Sliding

28
Figure 9. COF vs time and energy loop during fretting corrosion (5-7 s). Note that
coefficient of friction (COF) change a lot at sticking condition and stay relative stable at
sliding condition. Energy loop shows the relationship between friction force and relative
displacement.
In figure 10, the average fretting current vs. normal load is shown. It is clear that
the average fretting current increases as normal load increases and reaches to a peak,
which of almost 0.082 µA. After passing this point, the average fretting current begins to
decrease as the load increases. The error bars in this plot is the RMS about the mean of
Sticking
Sliding

29
the fretting corrosion current. As the load increases, there will be more contact area for
the interface causing more asperities to have a chance to abrade the oxide film. However,
the pin and disk will stick together as the load increases and this will lead to less relative
motion, which will decrease the average fretting current.
Figure 10. Average fretting current vs. normal load for CoCrMo pin and CoCrMo disk at
-100 mV vs. Ag/AgCl (n=1). Note that the error bar stands for the root mean square
(RMS) about the mean.
2. Observation of Fretting Debris Generation
Based on many retrieval studies and observational results, metal debris and/or
oxide debris is generated through fretting corrosion which is thought to be associated
with the optical image (see Fig 11.) of the debris generation process. The interface-
generated debris stated as early as 12 min and continued over 60 min. Debris first showed
up at the fretting interface and grew with time. Newer debris generated during fretting

30
pushed the older debris to the peripheral area. This lead to a phenomena where the outer
layer of debris was pushed faster away from the source.
( a ) 12 min ( b ) 20 min
( c ) 30 min ( d ) 60 min
Figure 11. Image (e) and the caption is on next page.
200 µm 200 µm
200 µm 200 µm

31
( e ) 120 min
Figure 11. Digital microscope image of debris generation from CoCrMo pin and disk at
different times. Note that the black part (left) is the pin covered by electrical insulation
material and the light gray material was the mirror-polish surface of the CoCrMo disk. (a)
12 min after fretting (b) 20 min after fretting (c) 30 min after fretting (d) 60 min after
fretting (e) 120 min after fretting
Two images (Fig. 12a and 12b) are captured after fretting by simply removing the
solution between two glass slides and the disk sample was placed under the microscope
until the observation surface dried. The left image (a) shows the region of the observation
surface and the surrounding corrosion debris halo after fretting under 350x while the right
one (b) is a high (700x) magnification of the same region. It is obvious that the contact
point is corroded and a halo area is formed at the outer region of the contact area. Figure.
12(c) is a side-view schematic comparing the ideal contact situation and real contact
condition. Note the red circle stands for the different situation about the contact interface.
The ideal condition is that pin and disk have full contact with each other, like the upper
200 µm

32
condition in figure. 12(c), and the observation surface can reflect what happens at the
interface. However, the fretting surface of the disc sample is too small to polish to a
mirror-like finish and the observation surface needed to be mirror-like instead of 600 grit.
The roughness of the fretting surface is 600 grit whereas the observation surface was
polished to a mirror-like condition. This caused the edge of disk sample to become
curved, which is demonstrated as the lower condition of figure. 12 (c).
The edge condition described in last paragraph (shown at Fig. 12) shows
significant debris generated. In figure 13, image (a) and (b) are the fretting contact
surface with different regions in focus. Red circle indicates the abrasion region, which
can also be observed on the pin as well in figure 13(c), where the fretting direction is
perpendicular to the original polished scratch direction. It is worth noting that the contact
region is surrounded by a corrosion halo area and some debris, which is the dark parts at
the interface.
( a ) 350x ( b ) 700x
Figure 12. Picture (c) and the caption is on next page.
Corrosion area Rainbow area
200 µm 200 µm

33
( c ) Comparison between real and ideal situation
Figure 12. Digital microscope image for fretting trace on the observation surface at
different magnifications: (a) 350x and (b) 700x. Picture (c) is the schematic (side-view)
for the comparison for ideal and real contact circumstance.
( a ) Fretting surface of disk (part 1) ( b ) Fretting surface of disk (part 2)
Figure 13. Image (c) and the caption is on next page.
Disk Pin
Observation direction
Abraded region Debris
200 µm 200 µm

34
( c ) Fretting surface of pin
Figure 13. Digital microscope images of both pin and disk. Image (a) and (b) are the
fretting surface of the disk sample with different focus points due to the surface
geometry. Image (c) is the fretting surface of the corresponding pin sample.
3. Frequency and Electrode Area Affection of Voltage Drop during Fretting
The voltage drop associated with the four different second electrode areas (Fig. 14)
at five different frequencies show that higher frequencies cause faster voltage drops,
which can be measured through the initial slope of each curve, and result in larger drops.
For larger second electrode areas, smaller voltage drops (at a specific frequency) is also
shown. A summary of area and frequency effects (Fig. 15) show that the voltage drop for
10.0 Hz and of 0.018 cm2 second electrode area is -0.2 V and for 0.213 cm2 is -0.17 V,
for 0.352 cm2 is -0.14 V and for 0.927 cm2 is -0.11 V. Figure 15 shows that larger second
electrode area results in smaller voltage drop.
Abraded region
200 µm

35
(a) E1 (0.018 cm2)
(b) E2 (0.213 cm2)
Figure 14. Plot (c), (d) and the caption are on next page.

36
(c) E3 (0.352 cm2)
(d) E4 (0.927 cm2)
Figure 14. The voltage versus time for different second electrode area (0.018 cm2, 0.213
cm2, 0.352 cm2, 0.927 cm2) and frequencies (0.2 Hz to 10.0 Hz).

37
Figure 15. Voltage drop vs. frequency for different second electrode area. Note that the
value of voltage drop equal to average value of the last second minus the average value of
the first second. Mean and SD n=3.
Data are replotted (see Fig. 16) voltage drop versus area for different frequencies to
emphasis the effect of area on voltage change. The plot shows that the voltage drop for
0.018 cm2 and 0.2 Hz is -0.03 V, for 0.5 Hz is -0.06 V, for 1.0 Hz is -0.09 V, for 5.0 Hz is
-0.15 V and for 10.0 Hz is -0.185 V. The plot also shows that higher fretting frequency
results in larger voltage drop.

38
Figure 16. Voltage drop vs. second electrode area for different frequencies. Note the
voltage drop in average potential just prior to fretting minus the average potential at the
last second of fretting. Mean and SD n=3.
These data show that the voltage dropped exponentially with time and reached a
plateau. However, for lower frequency tests (see Fig. 17), the voltage drops in an
oscillating form and this behavior can be affected by different frequencies. The voltage
drop for a single experimental sample during fretting at different frequencies shows this
oscillation and how it is directly related to fretting frequency. Although frequencies (i.e.
10 Hz), the oscillation is eliminated whereas its process increase with lower frequencies.

39
Figure 17. Detail of voltage drop vs. time during fretting for a single sample at different
frequencies. Note that the red circle and arrow (in the left plot) is enlarged and displayed
at the right plot to demonstrate the effect.

40
DISCUSSION
Fretting corrosion and its mechanism have been studied for many years from
different perspectives [48][49][50][51]. However, the details of the fretting corrosion
processes are still not well understood. Many custom devices have been established to
either focus on measuring the electrochemical parameters during fretting or to study the
mechanical influence, like weight loss, of the fretting process. Few of the devices,
mentioned in the introduction, have visualization capabilities but they still lack the
capability to have high-resolution observations of the processes of fretting corrosion. In
addition, it is hard for these devices to collect and study the fretting products due to the
typically large solution volumes involved. Another objection for many fretting corrosion
test systems is that they usually have a relative large contact areas compare with the
sample contact condition in this study. This study was undertaken to develop a custom
fretting crevice corrosion test system that combined electrochemical and mechanical
features together and measured all parameters simultaneously. The whole device can be
placed under a digital microscope to visualize the process of fretting corrosion directly.
The sample chamber is made of two glass slides and regimes much less solution volume.
This feature can be used to study the products of fretting corrosion. In addition, the small
thickness of disk sample provides small contact areas and which is useful to study the
fundamental theory of fretting corrosion.
The results show that debris, which is one of the products of fretting corrosion, is
generated during fretting corrosion. The debris accumulated at the fretting region as time

41
increased. There is a halo that appeared on both fretting interfaces and the slide
observation surface after the solution was removed. The fretting region was surrounded
by the halo. The relationship between voltage drop and fretting frequency and second
electrode area through the impedance of the surface, shows that higher frequency resulted
in larger voltage drops at similar second electrode area. A similar phenomenon happens
for smaller second electrode areas under different fretting frequencies. In addition, an
oscillation phenomenon during the voltage drop at different frequencies was observed
when enlarged plots of voltage versus time are generated. The oscillation was not obvious
at lower frequency (i.e. 0.2 Hz) but became clear as the fretting frequency increased. This
phenomenon was eliminated at higher fretting frequency (i.e. 10.0 Hz). These basic
experiments show that the change of mechanical parameters (i.e. frictional force and
relative displacement) have a direct connection with the electrochemical parameters (i.e.
voltage and fretting current).
This study provides a new direction for the study of fretting corrosion. However,
the test system still has some weakness. The first one is about the sample preparation.
The sample edge was curved during polishing due to lack of a suitable holder. This
circumstance influences the ability to visualize fretting corrosion. According to a
published literature by Swaminathan and Gilbert [30], the change of mechanical
parameters is different from this study. This is because the lateral stiffness of pin holder
was not large enough and the pin was easier to be bend.
Even though this system has some weakness, many valuable insights were gained
for future study. The visualization of debris generation during fretting corrosion can be
used to collect debris. This system can also combined with many devices in the cell

42
culture field to study the effect of fretting products on different types of cells. There was
one possible explanation for the halo which it is demonstrated in figure 17. The
schematic shows some possible compounds based on the solution chemistry. Metal ions
release into solution after the oxide film is ruptured. Some of them may combine with
different anions in the solution to form some compounds. These possible compounds may
gather together and adhere onto the oxide film or even the bare metal surface. It is likely
that there is some form of deposition and/or redox reaction related to local impedance
behavior. The compounds may reflect different color under light and cause the halo
phenomenon.
Figure 18. Schematic of one possible mechanism of halo generation. Note that yellow
triangles stand for surface asperity and orange rectangle means surface oxide film.
The relationship between voltage drop and the other two parameters (area and
frequency) can be combined with the impedance and the current data together to develop
a heredity integral approach of impedance-voltage-current model to better understand
fretting corrosion. The theory is based on the assumption:

43
Eq.2
where the oxide film abrasion rate (left part of equation) equal to the oxide film
repassivation rate (right part of equation). Two equations are used to predict the current
and the potential behavior during fretting corrosion:
Eq.3
Eq.4
where Vvol is oxide film volume. AT is called the repassivation admittance and Z(t) is the
time-dependent impedance of the Randle’s circuit. AT can be calculated by following
equation:
Eq.5
where φ is constant for each oxide as follow:
Eq.6

44
where ρ is the oxide density, n is the effective valance of oxide, F is the Faraday’s
constant and Mw is the molecular weight of oxide. Z(t) can be described using the
following equation:
Eq.7
The fretting current behavior during fretting corrosion is described by Eq. 3 and
has close connection with the fretting frequency. Higher fretting frequency will lead to
larger oxide generation rate, which is described as dVvol/dλ. The potential behavior
during fretting corrosion is well-predicted by Eq. 4. Rs is relatively stable while Rox
decreases as electrode area increases (see Table.1). This is one of the reasons why larger
second electrodes have smaller potential drops.
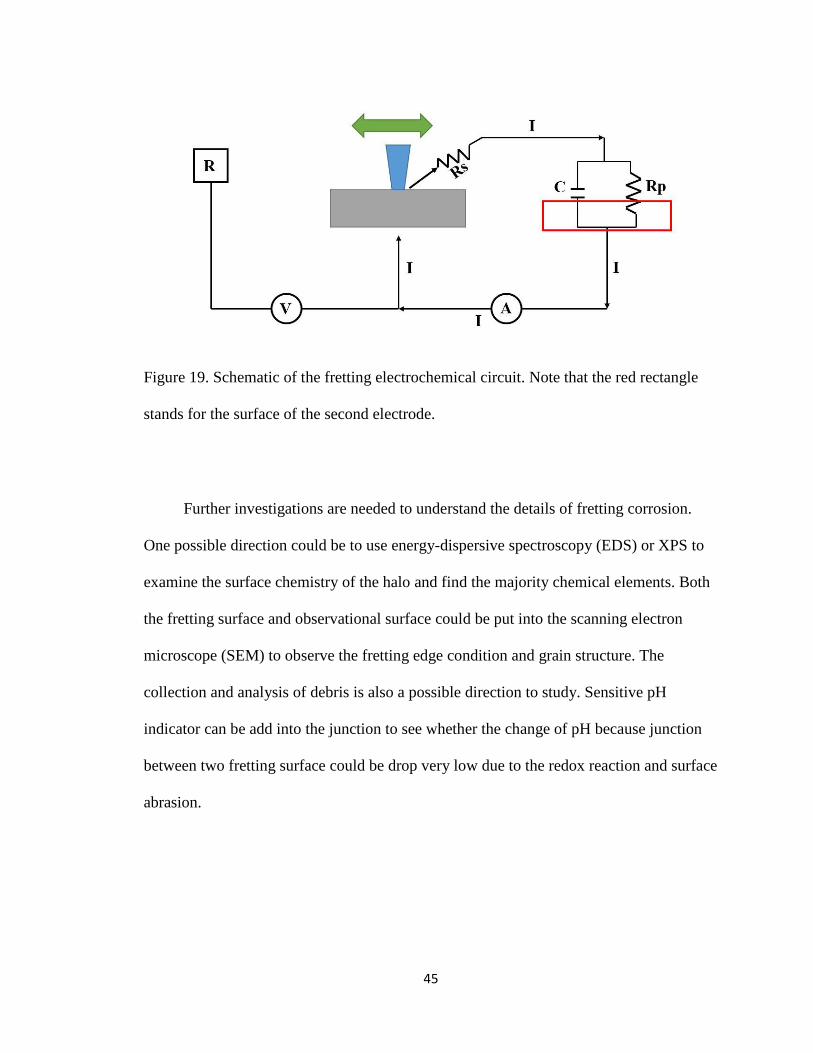
The electrochemical circuit has two parts (see Fig. 19). During fretting, electrons
are going through the right circuit and generate current. The ammeter is used for
measuring the current flow through the circuit (i.e., the combined pin-disk sample and the
second electrode) and the voltmeter can measure the voltage between reference electrode
and the sample.
45
Figure 19. Schematic of the fretting electrochemical circuit. Note that the red rectangle
stands for the surface of the second electrode.
Further investigations are needed to understand the details of fretting corrosion.
One possible direction could be to use energy-dispersive spectroscopy (EDS) or XPS to
examine the surface chemistry of the halo and find the majority chemical elements. Both
the fretting surface and observational surface could be put into the scanning electron
microscope (SEM) to observe the fretting edge condition and grain structure. The
collection and analysis of debris is also a possible direction to study. Sensitive pH
indicator can be add into the junction to see whether the change of pH because junction
between two fretting surface could be drop very low due to the redox reaction and surface
abrasion.

46
CONCLUSION
The primary conclusions of this study are as follows:
1. A 2-D fretting corrosion test system was designed, developed and evaluated. The
system can contact and measure both mechanical and electrochemical properties,
while also directly image microscopically the damage generation at the fretting
surface.
2. The frequency of fretting corrosion motion is one factor that affects the potential
drop of the electrode. Higher frequency leads to faster and larger potential drop
under same second electrode area.
3. The area of the second electrode where reduction reactions take place is another
factor that affects the potential drop of the fretting corrosion sample. Larger
second electrode area causes lower and slower potential drops at the same fretting
frequency.
4. The impedance characteristic of the fretting electrodes are area dependent and
directly affect the fretting current-potential drop relationship.

47
SUMMARY
Fretting corrosion, as a major form of mechanically assisted corrosion, is one of the
causes of implant material damage, especially for metal implants. This form of corrosion
is caused by relative micromotion between two surfaces. Oxide films at each surface will
be disrupted and repassivated after fretting and this will give rise to a series of redox
reactions, which can cause the metal surface to corrode. Fretting corrosion can lead to
many consequences, such as metal and oxide debris generation and is associated with
local tissue reactions that may lead to device failure, etc.
Many studies have been performed to understand fretting corrosion from different
aspects. Some of the factors are solution chemistry, applied potential, applied load,
surface roughness, etc. This study focuses on developing a 2-D fretting corrosion test
system that allow to observe the fretting process and collect mechanical and
electrochemical data at same time. The disk samples were cut into very small thickness
and polished to 600 grit to achieve appropriate roughness. Different frequency, from 0.2
Hz to 10.0 Hz, and second electrode area, from 0.018 cm2 to 0.927 cm2, were performed
to test the potential behavior under OCP circumstance.
It was found that debris generated during fretting and accumulated as fretting
continued. Fretting corrosion was found on both fretting surfaces of two samples and left
a halo of corrosion products around the corrosion region, which could be the deposition
of different compounds. The voltage drop of the fretting surface was affected by

48
frequency and second electrode area. Higher frequency with smaller area lead to the
largest and fastest potential drop.
Although this system still needs to be refined including the depth of the holder, it is
still a useful tool to use testing fretting corrosion in vitro. One of the possible topics to
explore is the development of the halo and its effect on cell viability. Another topic for
further study might be about solution chemistry effects (e.g., pH, etc.) and grain boundary
behavior during fretting corrosion.

49
APPENDIX
The following figure is a screenshot of CorrWare® and ZPlot® working window
with experiment parameters setup.
Figure 20. Screenshot of CorrWare (up) and ZPlot (down) working window with
experiment setup. CorrWare is for OCP test and fretting current test at fixed potential,
which is -0.1 V vs Ag/AgCl. ZPlot is for impedance measurement. Note that the scanning
voltage amplitude is 10 mV vs. Open Circuit Potential.

50
REFERENCE
[1] M. K. Harman, S. a. Banks, and W. Andrew Hodge, “Wear analysis of
a retrieved hip implant with titanium nitride coating,” J. Arthroplasty,
vol. 12, no. 8, pp. 938–945, 1997.
[2] G. B. Higgs, J. a. Hanzlik, D. W. MacDonald, W. M. Kane, J. S. Day,
G. R. Klein, J. Parvizi, M. a. Mont, M. J. Kraay, J. M. Martell, J. L.
Gilbert, C. M. Rimnac, and S. M. Kurtz, “Method of Characterizing
Fretting and Corrosion at the Various Taper Connections of Retrieved
Modular Components from Metal-on-Metal Total Hip Arthroplasty,”
Met. Total Hip Replace. Devices, pp. 146–156, 2013.
[3] R. Pivec, R. M. Meneghini, W. J. Hozack, G. H. Westrich, and M. a.
Mont, “Modular taper junction corrosion and failure: How to approach
a recalled total hip arthroplasty implant,” J. Arthroplasty, vol. 29, no.
1, pp. 1–6, 2014.
[4] J. L. Gilbert, S. Mali, R. M. Urban, C. D. Silverton, and J. J. Jacobs,
“In vivo oxide-induced stress corrosion cracking of Ti-6Al-4V in a
neck-stem modular taper: Emergent behavior in a new mechanism of
in vivo corrosion,” J. Biomed. Mater. Res. - Part B Appl. Biomater.,
vol. 100 B, no. 2, pp. 584–594, 2012.
[5] M. Kiran and P. J. Boscainos, “Adverse Reactions to Metal Debris in
Metal-On-Polyethylene Total Hip Arthroplasty Using a Titanium-
Molybdenum-Zirconium-Iron Alloy Stem,” J. Arthroplasty, vol. 30,
no. 2, pp. 277–281, 2015.
[6] J. Geringer, J. Pellier, F. Cleymand, and B. Forest, “Atomic force
microscopy investigations on pits and debris related to fretting-
corrosion between 316L SS and PMMA,” Wear, vol. 292–293, pp.
207–217, 2012.
[7] S. Grosse, H. K. Haugland, P. Lilleng, P. Ellison, G. Hallan, and P. J.
Høl, “Wear particles and ions from cemented and uncemented
titanium-based hip prostheses-A histological and chemical analysis of
retrieval material,” J. Biomed. Mater. Res. Part B Appl. Biomater., vol.
103, no. 3, pp. 709–717, 2015.

51
[8] G. Gkagkalis, P. Mettraux, P. Omoumi, S. Mischler, and H. a. Rüdiger,
“Adverse tissue reaction to corrosion at the neck-stem junction after
modular primary total hip arthroplasty,” Orthop. Traumatol. Surg. Res., vol. 101, no. 1, pp. 123–126, 2015.
[9] I. De Martino, J. Assini, M. E. Elpers, T. M. Wright, and G. H.
Westrich, “Corrosion and Fretting of a Modular Hip System: A
Retrieval Analysis of 60 Rejuvenate Stems,” J. Arthroplasty, vol. 30,
no. 8, pp. 1470–1475, 2015.
[10] B. J. McGrory and B. R. McKenney, “Revision for taper corrosion at
the head-neck junction: pearls and pitfalls,” Curr. Rev. Musculoskelet. Med., vol. 9, no. 1, pp. 97–102, 2016.
[11] J. H. Chern Lin, K. S. Chen, and C. P. Ju, “Biocorrosion behavior of
hydroxyapatite/bioactive glass plasma sprayed on Ti6A14V,” Mater. Chem. Phys., vol. 41, no. 4, pp. 282–289, 1995.
[12] J. R. Goldberg and J. L. Gilbert, “The electrochemical and mechanical
behavior of passivated and TiN/AlN-coated CoCrMo and Ti6Al4V
alloys,” Biomaterials, vol. 25, no. 5, pp. 851–864, 2004.
[13] C. M. Lee, J. P. Chu, W. Z. Chang, J. W. Lee, J. S. C. Jang, and P. K.
Liaw, “Fatigue property improvements of Ti-6Al-4V by thin film
coatings of metallic glass and TiN: A comparison study,” Thin Solid Films, vol. 561, pp. 33–37, 2014.
[14] V. Swaminathan, H. Zeng, D. Lawrynowicz, Z. Zhang, and J. L.
Gilbert, “Electrochemical investigation of chromium nanocarbide
coated Ti-6Al-4V and Co-Cr-Mo alloy substrates,” Electrochim. Acta,
vol. 59, pp. 387–397, 2012.
[15] S. Munir, M. B. Cross, C. Esposito, A. Sokolova, and W. L. Walter,
“Corrosion in modular total hip replacements: An analysis of the head–
neck and stem–sleeve taper connections,” Semin. Arthroplasty, vol. 24,
no. 4, pp. 240–245, 2013.
[16] R. M. R. Dyrkacz, J. M. Brandt, O. a. Ojo, T. R. Turgeon, and U. P.
Wyss, “The influence of head size on corrosion and fretting behaviour
at the head-neck interface of artificial hip joints,” J. Arthroplasty, vol.
28, no. 6, pp. 1036–1040, 2013.

52
[17] G. K. Triantafyllopoulos, M. E. Elpers, J. C. Burket, C. I. Esposito, D.
E. Padgett, and T. M. Wright, “Otto Aufranc Award: Large Heads Do
Not Increase Damage at the Head-neck Taper of Metal-on-
polyethylene Total Hip Arthroplasties,” Clin. Orthop. Relat. Res.,
2015.
[18] F. a. España, V. K. Balla, S. Bose, and A. Bandyopadhyay, “Design
and fabrication of CoCrMo alloy based novel structures for load
bearing implants using laser engineered net shaping,” Mater. Sci. Eng. C, vol. 30, no. 1, pp. 50–57, 2010.
[19] N. Kaushik, P. Sharma, S. Ahadian, A. Khademhosseini, M.
Takahashi, A. Makino, S. Tanaka, and M. Esashi, “Metallic glass thin
films for potential biomedical applications,” J. Biomed. Mater. Res. - Part B Appl. Biomater., pp. 1544–1552, 2014.
[20] D. C. Rodrigues, R. M. Urban, J. J. Jacobs, and J. L. Gilbert, “In vivo
severe corrosion and hydrogen embrittlement of retrieved modular
body titanium alloy hip-implants,” J. Biomed. Mater. Res. - Part B Appl. Biomater., vol. 88, no. 1, pp. 206–219, 2009.
[21] S. J. Stohs and D. Bagchi, “Oxidative mechanisms in the toxicity of
metal ions,” Free Radic. Biol. Med., vol. 18, no. 2, pp. 321–336, 1995.
[22] G. M. Keegan, I. D. Learmonth, and C. P. Case, “Orthopaedic metals
and their potential toxicity in the arthroplasty patient: A review of
current knowledge and future strategies.,” J. Bone Joint Surg. Br., vol.
89, no. 5, pp. 567–573, 2007.
[23] F. Witte, J. Fischer, J. Nellesen, C. Vogt, J. Vogt, T. Donath, and F.
Beckmann, “In vivo corrosion and corrosion protection of magnesium
alloy LAE442,” Acta Biomater., vol. 6, no. 5, pp. 1792–1799, 2010.
[24] Y. Okazaki, E. Nishimura, H. Nakada, and K. Kobayashi, “Surface
analysis of Ti-15Zr-4Nb-4Ta alloy after implantation in rat tibia,”
Biomaterials, vol. 22, no. 6, pp. 599–607, 2001.
[25] L. Reclaru, R. Lerf, P. Y. Eschler, a. Blatter, and J. M. Meyer, “Pitting,
crevice and galvanic corrosion of REX stainless-steel/CoCr orthopedic
implant material,” Biomaterials, vol. 23, no. 16, pp. 3479–3485, 2002.

53
[26] A. Shahryari, S. Omanovic, and J. a. Szpunar, “Electrochemical
formation of highly pitting resistant passive films on a biomedical
grade 316LVM stainless steel surface,” Mater. Sci. Eng. C, vol. 28, no.
1, pp. 94–106, 2008.
[27] J. L. Gilbert, S. Sivan, Y. Liu, S. B. Kocagöz, C. M. Arnholt, and S.
M. Kurtz, “Direct in vivo inflammatory cell-induced corrosion of
CoCrMo alloy orthopedic implant surfaces,” J. Biomed. Mater. Res. - Part A, pp. 1–13, 2014.
[28] M. J. Pearson, R. L. Williams, H. Floyd, D. Bodansky, L. M. Grover,
E. T. Davis, and J. M. Lord, “The effects of cobalt-chromium-
molybdenum wear debris in vitro on serum cytokine profiles and T cell
repertoire,” Biomaterials, vol. 67, pp. 232–239, 2015.
[29] Y. Liao, E. Hoffman, M. Wimmer, A. Fischer, J. Jacobs, and L. Marks,
“CoCrMo metal-on-metal hip replacements,” Phys. Chem. Chem. Phys., vol. 15, no. 3, pp. 746–756, 2013.
[30] V. Swaminathan and J. L. Gilbert, “Fretting corrosion of CoCrMo and
Ti6Al4V interfaces,” Biomaterials, vol. 33, no. 22, pp. 5487–5503,
2012.
[31] F. Mansfeld, “Use of electrochemical impedance spectroscopy for the
study of corrosion protection by polymer coatings I ---I I,” J. Appl. Electrochem., vol. 25, pp. 187–202, 1995.
[32] S. Kumar and T. S. N. S. Narayanan, “Corrosion behaviour of Ti-
15Mo alloy for dental implant applications,” J. Dent., vol. 36, no. 7,
pp. 500–507, 2008.
[33] F. Contu and B. Elsener H Bhni, “Characterization of implant
materials in fetal bovine serum and sodium sulfate by electrochemical
impedance spectroscopy. I. Mechanically polished samples,” J. Biomed. Mater. Res., vol. 62, no. 3, pp. 412–421, 2002.
[34] M. Haeri, S. Goldberg, and J. L. Gilbert, “The voltage-dependent
electrochemical impedance spectroscopy of CoCrMo medical alloy
using time-domain techniques: Generalized Cauchy–Lorentz, and
KWW–Randles functions describing non-ideal interfacial behaviour,”
Corros. Sci., vol. 53, no. 2, pp. 582–588, 2011.

54
[35] a. M. Ribeiro, a. C. Alves, F. S. Silva, and F. Toptan, “Electrochemical
characterization of hot pressed CoCrMo–HAP biocomposite in a
physiological solution,” Mater. Corros., no. 8, pp. 790–795, 2014.
[36] N. J. Hallab, C. Messina, A. Skipor, and J. J. Jacobs, “Differences in
the fretting corrosion of metal-metal and ceramic-metal modular
junctions of total hip replacements,” J. Orthop. Res., vol. 22, no. 2, pp.
250–259, 2004.
[37] K. Sadiq, M. M. Stack, and R. a. Black, “Wear mapping of CoCrMo
alloy in simulated bio-tribocorrosion conditions of a hip prosthesis
bearing in calf serum solution,” Mater. Sci. Eng. C, vol. 49, pp. 452–
462, 2015.
[38] X. Li, Z. Zuo, and W. Qin, “Fretting fatigue mechanism of bearing cap
bolted joints,” Rev. Sci. Instrum., vol. 85, no. 5, p. 055106, 2014.
[39] S. Wang, F. Wang, Z. Liao, Q. Wang, Y. Liu, and W. Liu, “Study on
torsional fretting wear behavior of a ball-on-socket contact
configuration simulating an artificial cervical disk,” Mater. Sci. Eng. C, vol. 55, pp. 22–33, 2015.
[40] L. Zhang, S. Ge, H. Liu, Q. Wang, L. Wang, and C. J. Xian, “Contact
damage failure analyses of fretting wear behavior of the metal stem
titanium alloy–bone cement interface,” J. Mech. Behav. Biomed. Mater., vol. 51, pp. 132–146, 2015.
[41] F. Alam, A. Kumar, A. K. Patel, R. K. Sharma, and K. Balani,
“Processing, Characterization and Fretting Wear of Zinc Oxide and
Silver Nanoparticles Reinforced Ultra High Molecular Weight
Polyethylene Biopolymer Nanocomposite,” Jom, vol. 67, no. 4, pp.
688–701, 2015.
[42] F. Billi, E. Onofre, E. Ebramzadeh, T. Palacios, M. L. Escudero, and
M. C. Garcia-Alonso, “Characterization of modified Ti6Al4V alloy
after fretting-corrosion tests using near-field microscopy,” Surf. Coatings Technol., vol. 212, pp. 134–144, 2012.
[43] D. Royhman, M. Patel, M. J. Runa, J. J. Jacobs, N. J. Hallab, M. a.
Wimmer, and M. T. Mathew, “Fretting-corrosion in hip implant

55
modular junctions: New experimental set-up and initial outcome,”
Tribol. Int., vol. 91, pp. 235–245, 2015.
[44] M. A. Arenas, A. Conde, and J. J. De Damborenea, “The role of
mechanically activated area on tribocorrosion of CoCrMo,” Metall.
Mater. Trans. A Phys. Metall. Mater. Sci., vol. 44, no. 9, pp. 4382–
4390, 2013.
[45] S. Barril, S. Mischler, and D. Landolt, “Influence of fretting regimes
on the tribocorrosion behaviour of Ti6Al4V in 0.9 wt.% sodium
chloride solution,” Wear, vol. 256, no. 9–10, pp. 963–972, 2004.
[46] J. Geringer, B. Forest, and P. Combrade, “Fretting-corrosion of
materials used as orthopaedic implants,” Wear, vol. 259, no. 7–12, pp.
943–951, 2005.
[47] K. Kim, J. Geringer, J. Pellier, and D. D. MacDonald, “Fretting
corrosion damage of total hip prosthesis: Friction coefficient and
damage rate constant approach,” Tribol. Int., vol. 60, pp. 10–18, 2013.
[48] M. Bryant, R. Farrar, R. Freeman, K. Brummitt, J. Nolan, and A.
Neville, “Galvanically enhanced fretting-crevice corrosion of
cemented femoral stems,” J. Mech. Behav. Biomed. Mater., vol. 40,
pp. 275–286, 2014.
[49] F. Contu, B. Elsener, and H. Böhni, “Corrosion behaviour of CoCrMo
implant alloy during fretting in bovine serum,” Corros. Sci., vol. 47,
no. 8, pp. 1863–1875, 2005.
[50] R. English, A. Ashkanfar, and G. Rothwell, “A computational
approach to fretting wear prediction at the head–stem taper junction of
total hip replacements,” Wear, vol. 338–339, pp. 210–220, 2015.
[51] Z. Guo, X. Pang, Y. Yan, K. Gao, A. a. Volinsky, and T.-Y. Zhang,
“CoCrMo alloy for orthopedic implant application enhanced corrosion
and tribocorrosion properties by nitrogen ion implantation,” Appl. Surf. Sci., vol. 347, pp. 23–34, 2015.

56
VITA
Name of Author: Dongkai Zhu
Date of Birth: Oct 06, 1990
Mobile Phone: (+1) 315-391-0385
Email Address: [email protected]
Education Background:
2009.8-2013.6, School of Biochemical Engineering, Capital Medical University, China
Major in Prosthetics and Orthotics Engineering
GPA: 3.3/4.0, ranking: 10/29
2013.8-present, College of Engineering and Computer Science, Syracuse University, US
Major in Bioengineering, research advisor: Dr. Jeremy L Gilbert
GPA: 3.75/4.0
Software and Programming Skill:
Office Software: Word, Excel, PowerPoint
Engineering Software: SolidWorks, AutoCAD
Image Process Software: Insight Segmentation and Registration Toolkit (ITK),
Visualization Toolkit (VTK)
Corrosion Test Software: CorrWare®, ZPlot®
Programming Language: C++, Visual Basic, LabVIEW, MATLAB
Extracurricular Activities:

57
2009.9-2010.5, Cadre of Sports Department of Students’ Union, School of Biomedical
Engineering, China Capital Medical University.
2009-2010, the title of “Excellent Cadre of Youth League”
2009-2010, Scholarship of Social Work and for Progress in Scholastic Performance.
2010.05-2011.04, Secretary of Sports Department of Students’ Union, School of
Biomedical Engineering, China Capital Medical University. Organizing sports activities
for freshmen.
2013.5, Outstanding Graduate Student of Capital Medical University
Internship:
2012.9-2013.5, China Rehabilitation Research Center, response for making prosthesis
and orthotics. Have experience working with doctor and other hospital faculties.