development and validation of a theoretical model for ... · theoretical model for rotational cars...
TRANSCRIPT

1
Development and Validation of a Theoretical Model for Rotational CARS Measurements on CO2
Master of Science Thesis Kristin Nilsson
Supervisor Per-Erik Bengtsson

2
Abstract A theoretical model for the rotational CARS spectrum of CO2 was developed. The model was used to evaluate experimental CARS spectra by spectral fitting. The experimental spectra were taken using a Nd:YAG laser able to run in single-mode and multimode and both modes were used. The results from evaluations using two line width models, MEG and ECS, were compared to the results from CARS investigations on CO2 previously performed by others. In an investigation at room temperature, evaluations using the MEG model gave the best accuracy and the average evaluated temperatures were within one degree from the actual value. The precision was 8.4 K and 11.4 K when the Nd:YAG laser was run in single-mode and multimode, respectively. Further experiments were performed with a relay-imaging system to improve the spectral resolution of the system. Better resolution was achieved, but experimental background problems were realised in these initial investigations. An attempt at recording spectra at elevated temperatures was made and with the higher resolution peaks originating from excited vibrational levels could be resolved.

3
Contents Abstract............................................................................................................................... 1 Contents .............................................................................................................................. 3 1 Introduction...................................................................................................................... 4
1.1 The Aim ............................................................................................................. 4 1.2 Overview of the Thesis ...................................................................................... 5
2 Theory.............................................................................................................................. 6 2.1 Molecular Structure and Energy Levels of CO2 ................................................ 6 2.2 Raman Scattering............................................................................................... 8 2.3 CARS................................................................................................................. 9
2.3.1 Dual-Broadband Rotational CARS........................................................... 11 3 Development of Theoretical Model for Rotational CARS on CO2 ............................... 13
3.1 CARS Computer Code..................................................................................... 13 3.1.1 Theoretical Library ................................................................................... 13 3.1.2 Comparison between experimental and theoretical spectra...................... 13 3.1.3 Line width models .................................................................................... 14
3.2 Procedure for Development of the Model ....................................................... 14 4 Experimental Setup........................................................................................................ 18
4.1 Lasers ............................................................................................................... 18 4.2 The Measured Gas ........................................................................................... 19 4.3 Detector System............................................................................................... 19
5 Measurements and Results............................................................................................. 21 5.1 Preparation ....................................................................................................... 21 5.2 Results from evaluations.................................................................................. 22
6 Discussion (with analysis) ............................................................................................. 25 7 High Resolution Experiments........................................................................................ 27
7.1 Setup ................................................................................................................ 27 7.2 Experiment....................................................................................................... 28 7.3 Measurements and Results............................................................................... 28 7.4 Experiment at Higher Temperature ................................................................. 30 7.5 Discussion........................................................................................................ 32
8 Summary and Outlook ................................................................................................... 33 Acknowledgements........................................................................................................... 34 References......................................................................................................................... 35 Appendix........................................................................................................................... 36
A1. The original experimental series..................................................................... 36 A2. The experimental series with higher resolution .............................................. 37

4
1 Introduction Energy and combustion is a big issue all over the globe today with the ongoing warming of the atmosphere. Carbon dioxide is one of the most discussed green house gases, which emphasizes that more investigations on CO2 should be undertaken. One method that can be utilized for this is rotational Coherent anti-Stokes Raman Spectroscopy, rotational CARS, which is an important non-intrusive tool for measuring temperatures and concentrations in combustion processes with high spatial and temporal resolution. Laser beams of certain frequencies are focused together in an intersection point, and after interacting with molecules in this point a laser like signal beam is created. The laser like signal makes detection far from the point of measurement possible, which give efficient suppression of the background luminosity. This signal is spectrally resolved and can be evaluated using a theoretical model. Drawbacks with this method are that only point measurements are possible, only small molecules can be measured and it is complicated to measure more than a few species at a time. CARS is not limited to combustion processes but can be used anywhere where there are at least two optical windows. Usually this technique is used to evaluate temperatures from the spectra of nitrogen since this spectrum is known and air-fed combustion contains a large amount of N2. Product gases from hydrocarbon combustion also contain carbon dioxide, which gives a stronger signal for CARS than N2. So a fairly small amount of CO2 can contribute to spectra from combustion measurements and make an adequate evaluation more difficult. Hence, it would be very good to develop a theoretical model for CO2. Not only could this be used to do measurements on CO2, but also together with other species, e.g. N2.
1.1 The Aim The aim is to develop a theoretical model for the CO2-spectrum for rotational CARS. The model will be compared to experimental spectra of room temperature CO2 to ensure it corresponds to the CO2 spectrum. The model is based on theory and improved through comparison with averaged spectra. It is then supposed to be used to evaluate single-shot spectra taken with the Nd:YAG laser run in single-mode and in multimode. By evaluating experimental spectra the validity and accuracy of the model is investigated. Although a German group [1] already has made a rotational CARS model for CO2 it is still motivated that one is developed at this department. Access to an accurate model may improve results from earlier experiments in combustion. The aim is also set on better results than the German group had. This may be achieved with a Nd:YAG laser that can be run in single-mode, as opposed to the German group’s Nd:YAG laser which was in multimode, as resolution may be improved. The laser is

5
more stable in single-mode, where there are not any mode fluctuations, so single-shot spectra vary less from shot to shot than with the multimode laser.
1.2 Overview of the Thesis Following this chapter of introduction is Chapter 2 with some of the theory needed for further understanding. After that the procedure for the development of the model is explained in Chapter 3 followed by a description of the experimental setup in Chapter 4. Measurements and results are then shown in Chapter 5 and discussed in Chapter 6. Then follows Chapter 7 describing and discussing an experiment on higher resolution, where an experiment on 550 K also was carried out. Finally Chapter 8 with conclusions sums up the thesis.

6
2 Theory In this chapter some of the molecular structure of carbon dioxide will be described as well as the basics of Raman scattering and rotational CARS for CO2.
2.1 Molecular Structure and Energy Levels of CO2 Carbon dioxide is a linear molecule with three atoms and three atoms give four vibrational modes. It has two stretching modes, a symmetric and an anti-symmetric, and two degenerate bending modes [2]. The energy levels for the different modes are normally easily calculated, but because of Fermi resonance the equation for vibrational energy levels does not always hold for CO2. When two vibrational levels, from different vibrational modes, are close in energy they move apart. Fermi resonances [2] shift the more energetic vibrational mode to a higher energy and the lower level loose energy. Because of this the vibration energy levels of CO2 are not so easy to model with a few equations. In figure 1 the vibrational notation is (v1 v2 l v3 r) where v1 and v3 numerates the symmetric and anti-symmetric mode, v2 is the doubly degenerate bending mode, l is the absolute value of the angular momentum quantum number and r numerates the Fermi level. Data is taken from Ref. 3.
00001
10002 10001
20003
01101
02201
03301 1110211101
00011
v1 v2 v1 + v2 v3
1000
0
2000
Energy /cm-1
Figure 1: The lowest vibrational levels of CO2. Thick line indicates doubly degenerated levels.

7
The Fermi resonance, however, does not affect the rotational energy. Within a vibrational level the rotational energy, Jε , is given by equation 1. J is the rotational quantum number [2].
( ) ( ) ( )3322 111 +++−+= JJHJJDJJB vvvJε (Eq.1) B is the rotational constant, D is the centrifugal distortion constant and H is further correcting the rotational energy. B, D and H differ slightly between different vibrational levels, hence the ν-notation. For CO2 B is approximately 0.39 cm-1, D is approximately 1.3*10-7 cm-1 and H is approximately 1*10-13 cm-1 [3]. How likely a molecule is to be in a certain excited vibration level, and rotational level, at a given temperature can be calculated with the Boltzmann distribution (Eq.2) [8]:
[ ]kTEJgQ
NN JJ
vrot
vvJ −+= exp)12(
)(
(Eq.2)
Qrot is the rotational partition function, which is the sum of the possibility to be in all rotational states. The degeneracy of rotational levels gives different possibilities for the state to be populated, which is expressed in the equation as (2J+1). At room temperature most molecules are in the vibrational ground level but at higher temperatures higher levels will be populated as well, according to the Boltzmann equation. This is important not only because the rotational constants are slightly different, but also because the statistical weights (gJ) of the rotational levels are different for different vibrational levels. For CO2 the statistical weight of the ground level (00001) is 1 for even J and 0 for odd J. For the doubly degenerate first excited bending mode level it is 0 for even and 1 for odd for (01101e) and again 1 for even and 0 for odd for (01101f). All populated vibrational levels contribute to the signal but excitations do not go from one vibration level to another. At room temperature, with most of the population in the ground level, because of the statistical weight only every second rotational level will contribute to the spectrum. If (01101e) is populated peaks in-between those will show. The population of (01101f) will add to the first peaks but a little shifted since the rotational constants differ slightly between different vibrational levels. To record the peaks from (01101e) a detector with high resolution is required, since these peaks are spectrally close to the peaks from the ground level and therefore hard to resolve.

8
2.2 Raman Scattering Light sent through a gas can be scattered. Molecules will scatter light in all directions; if the light does not change in energy it is elastic and called Rayleigh scattering. Another type of elastic scattering is Mie scattering, which occurs when the particles have sizes of the same magnitude as the incident laser light. Since this work deals with small molecules Mie scattering will not be discussed any further. Some of the molecules will give or take energy from the photons, hence the light changes in frequency, inelastic scattering, this is Raman scattering. In Raman scattering the photon excites a molecule to a higher energy level; a so-called virtual level. When the molecule is de-excited it emits a photon, see figure 2. Depending on whether the molecule goes back to the original energy state or to a lower or higher one, the emitted photon will have the same, higher or lower frequency than the photon exciting the molecule had.
The probability that a molecule will scatter a photon depends on the molecule’s ability to be polarized. When looking at many molecules, i.e. a gas, the total polarizability is called susceptibility, χ. The Raman scattered light from a gas will have a spectrum with distinct peaks at different energies shifted from the incident light. The Raman shifts are the energy differences between the rotational or vibrational energy levels involved in the excitation/de-excitation process. The rotational energy is calculated according to Eq.1. The shape of the spectrum depends on the species, concentration and temperature. The spectral position of the peaks is
ωR
Figure 2: The molecule absorbs a photon and moves to a higher energy level. When it moves back to a lower level it emits a photon.
Photon in
Photon out

9
specific for each species, the concentration gives the intensity of the total spectrum and the Boltzmann distribution gives the intensity of each peak. Raman scattering can be used for temperature measurements as well as relative concentration measurements, or a combination of both. The main drawback with Raman scattering is the weak signal, which in addition spreads out in a wide angle.
2.3 CARS A nonlinear technique, using the advantages from the Raman scattering and increasing the signal, was developed in the mid-seventies. It is called Coherent Anti-Stokes Raman Spectroscopy, CARS. Instead of just sending light through the gas, three laser beams are used. Two intersecting beams (ω1 and ω2) create a polarisation in the molecules. The third beam (ω3) is scattered by the polarised molecules and a laser like CARS signal (ω4) is created. The energy of the CARS signal is calculated with ω4 = ω1 - ω2 + ω3. Another way to explain CARS is that the first two beams excite the molecules to a higher energy level. The third beam then excites them even further to a virtual level. The CARS-signal then appears when the molecules fall back to the original level. This is visualized in figure 3. The CARS-signal is higher in energy than the ω3-beam. If the signal had been lower in energy it had been called CSRS, Coherent Stokes Raman Spectroscopy.

10
The CARS-signal can be detected a long way away from the source without becoming noticeably weaker, hence stray light and florescence interference can be eliminated before the signal has reached the detector. This is an advantage over Raman spectroscopy. The intensity of the CARS signal can be calculated with the following equation [5]:
( ) 222
32120
4321
2
2/2/sin
∆∆
⋅⋅⋅⋅=kL
kLLIIIcnnnn
I CARSCARS
CARSCARS χ
εω
(Eq.3)
The spectral information of the CARS spectrum, which is the interesting part of the signal for temperature measurements, lies within the factor CARSχ [6]. This is the third-order susceptibility of the gas that is being investigated. The susceptibility consists of two parts, the resonant part that is dependent on wavelength, and the non-resonant part that is the same for all wavelengths.
( )( )∑ Γ−+−+=
J JJi
rrJJ
JJnrCARS p
a
'221'
'
ωωωχχ (Eq.4)
J+2
J ωR
ω1 ω2 ω3 ω4
Figure 3: Laser beams with wavelengths ω1 and ω2 excite the molecules to a virtual level and de-excite them to a level higher than the original. A beam with wavelength ω3 then excites the same molecules to another virtual level. When the molecules are de-excited from this level the CARS-signal, ω4, appears.

11
The first term in equation 4 is the non-resonant part of the CARS-signal and the second term is the resonant part containing the spectral information. 'JJa is an amplitude factor, 'JJω is the frequency of the transition from J to J’ and is calculated from the energy levels (see eq.5), 1rω and 2rω are frequencies from the two broadband laser beams, p is pressure and 'JJΓ is the molecular line width. The selection rule for rotational anti-Stokes Raman lines is ∆J=2. The rotational energy and the relative energy for the CARS peaks are expressed as [2]:
( ) 12 64 −
+ +≈−=∆ cmJBvJJ εεε (Eq.5) where Jε was defined in Eq.1
2.3.1 Dual-Broadband Rotational CARS There are different kinds of CARS techniques. Focus in this work will be on Dual-Broadband Rotational CARS. Rotational meaning that the excitations and de-excitations are between different rotational energy levels within the same vibrational level. Dual-Broadband indicates that the beams with wavelengths ω1 and ω2, according to figure 3, are both from a broadband dye laser. Using a broadband dye laser instead of a narrow laser means that with one single-shot from the laser the entire spectrum can be recorded. This makes time resolved measurements possible. Since several pairs of photons within the broadband laser profile can give the same Raman resonant frequency, the spectrum is less affected by statistical mode fluctuations from the laser. This is an advantage over conventional CARS where a narrow laser is used, instead of the broadband dye laser, and is scanned over all the frequencies needed for the CARS spectrum. The width of the peaks is often defined as Full Width at Half Maximum (FWHM), which depends on several different factors. One of them is the spectral width of the laser. Also, the setup for the experiment with lenses, mirrors and apertures broaden the signal. The detector with the CCD chip can also take some information from the signal. If a peak is spectrally divided between two pixels, both pixels will detect part of the peak and thus the detected intensity maximum is decreased and the width of the peak is increased. Experimental broadening factors are summarized as a slit function, also known as an instrument function. There is also the broadening from

12
collisions between molecules. This molecular line broadening depends on the molecule, temperature and rotational number J. The slit function can be estimated by measuring how much the setup increases the line width of a known spectrum of N2. The line width function of the molecules has to be calculated using a line width model. Two possible models are the ECS model (energy-corrected sudden power) and the MEG model (modified energy gap) [1]. Dual-Broadband rotational CARS has previously been used on N2 for temperature measurements. In figure 4 is an example of a CARS spectrum of N2 at room temperature.
0 20 40 60 80 100 120 140 160 180 2001
2
3
4
5
6
7
8
9
10
Wavenumbers / cm-1
Inte
nsity
/ ar
bitra
ry u
nits
Figure 4: Rotational CARS spectrum of N2 at room temperature.

13
3 Development of Theoretical Model for Rotational CARS on CO2
3.1 CARS Computer Code When developing the theoretical model a rotational CARS computer code for acetylene [4], developed within the department, is used and modified. The code consists of two sets of programs. One to build a theoretical library of spectra at different temperatures, and the other to compare the experimental spectrum to the theoretical library to see what temperature gives the best match. These programs can also be used to determine relative concentrations of different species.
3.1.1 Theoretical Library The first set of programs is used to create a library of theoretical CO2 spectra at different temperatures. Molecular rotational constants, as well as a file containing information about the molecular line width, are in-data for the library. The computer code calculates the energy levels and the Raman shifts for CO2 and returns the shape of the theoretical CARS spectrum at requested temperatures.
3.1.2 Comparison between experimental and theoretical spectra The theoretical spectrum must be convoluted with a slit function before the comparison between experimental and theoretical spectra can be done. A program is used to calculate how the spectrum of N2 is broadened by the arrangement of the experimental setup, this broadening is the slit function and is specific for each experiment. Another program is used to find the best match between experimental and theoretical spectra. Information needed to run this program is the experimental spectrum as well as the library of theoretical ones, but also Raman shift for a reference channel in the experimental spectrum and the linear as well as the quadratic dispersion. Other facts needed are the non-resonant susceptibility (χNR), pressure, pump laser frequency and estimated temperature. The program can be given the possibility to change some of these parameters to values that will give a better fit between experimental and theoretical spectra. Parameters that can be adjusted for are temperature, linear dispersion, Raman shift for the reference channel and the non-resonant susceptibility. The program was set to adjust for temperature and the other parameters were known and set as “fixed”.

14
3.1.3 Line width models The width of the peaks in the CARS-spectrum depends on the molecules’ movements and collisions between the molecules. This line width is different for different species and varies with temperature and rotational quantum number. There are different ways to model the line width. The two models used in this work are MEG and ECS. Molecular data for these models are taken from Ref. 7. In figure 5 the modelled CO2 line width, as a function of rotational quantum number J, can be seen.
0
0,05
0,1
0,15
0,2
0,25
0,3
1 5 9 13 17 21 25 29 33 37 41 45 49 53 57 61 65 69 73
J quantum numbers
FWH
M /
cm-1
MEG 300KECS 300 KMEG 400KECS 400 KMEG 500 KECS 500 K
3.2 Procedure for Development of the Model The model was compared to experimental spectra that have been accumulated from 300 laser shots during the development. The actual evaluation of the finished model was carried out on single-shot spectra.
Figure 5: Line width models for CO2. The line width decreases with increasing temperature.
T

15
In the simple first model line width data for N2 was used and only the ground vibrational level for CO2 was considered. Molecular rotational constants from Ref. 3 were used. From this model it was obvious that the experimental spectra were from CO2, but the fits were poor. It was clear that a more sophisticated model was needed. The three lowest vibrational levels were then considered, still with N2 line width data. In Ref. 4, where the same computer code was being used in the same manner, the measurements were carried out on acetylene and every vibrational mode was treated as a unique in the code. Since there are Fermi resonances in CO2 [2], every vibration level is treated as a unique species to make the calculations less complicated. A literature value for the CO2 χNR [5] was also added to the program as well as line width data for CO2. The molecular constants and the line width model constants are listed in tables 1 and 2. The result from the evaluation with MEG line width model can be seen in figure 6. Table 1. The molecular constants used in the theoretical model for CO2 [3], [1]and[5]. First vibrational level (00001): Vibrational frequency ωv 1285.408 cm-1 Rotational constant Bv 0.3902 cm-1 Centrifugal distortion constant Dv 1.3334 · 10-7 cm-1
Molecular constant Hv 0.077 · 10-13 cm-1 Statistical weights gJ 1 (even J), 0 (odd J) Second vibrational level (01101e): Vibrational frequency ωv 667.380 cm-1 Rotational constant Bv 0.3906 cm-1 Centrifugal distortion constant Dv 1.35 · 10-7 cm-1 Molecular constant Hv 0.099 · 10-13 cm-1 Statistical weights gJ 0 (even J), 1 (odd J) Third vibrational level (01101f): Vibrational frequency ωv 667.380 cm-1 Rotational constant Bv 0.3903 cm-1 Centrifugal distortion constant Dv 1.36 · 10-7 cm-1 Molecular constant Hv 0.149 · 10-13 cm-1 Statistical weights gJ 1 (even J), 0 (odd J) Additional constant: The nonresonant CARS-signal χNR 0.80·10-10 cm3 /J
16
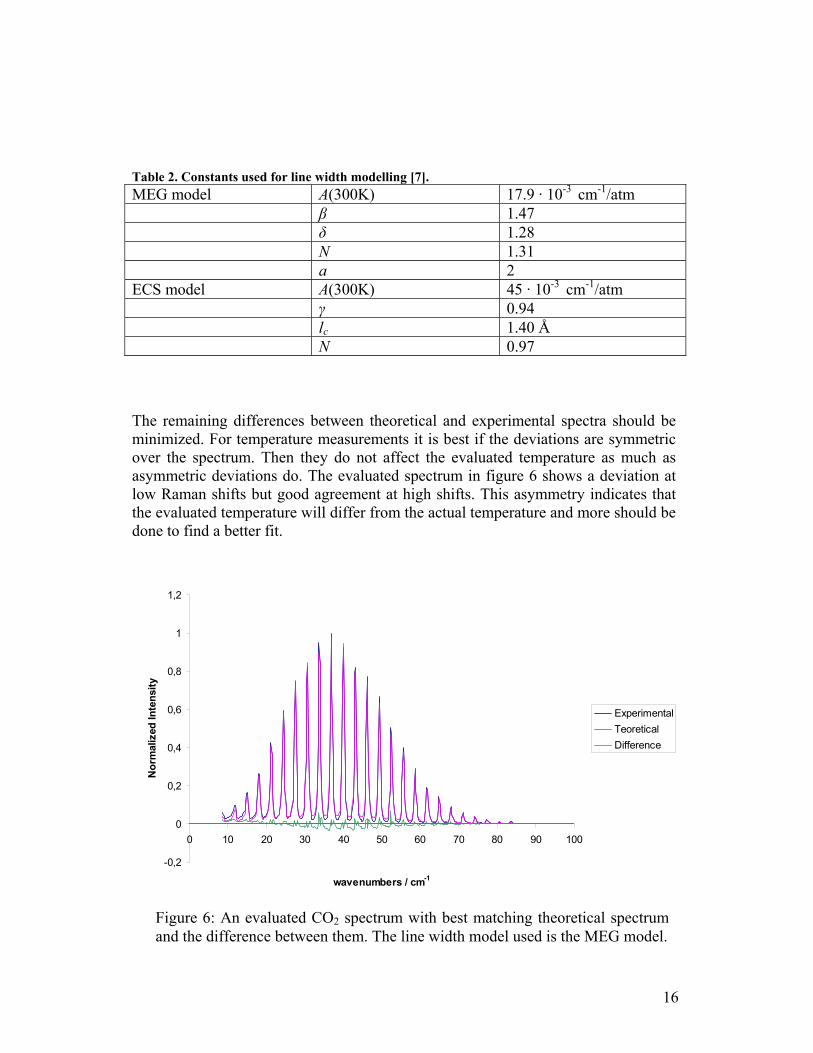
Table 2. Constants used for line width modelling [7]. MEG model A(300K) 17.9 · 10-3 cm-1/atm β 1.47 δ 1.28 N 1.31 a 2 ECS model A(300K) 45 · 10-3 cm-1/atm γ 0.94 lc 1.40 Å N 0.97 The remaining differences between theoretical and experimental spectra should be minimized. For temperature measurements it is best if the deviations are symmetric over the spectrum. Then they do not affect the evaluated temperature as much as asymmetric deviations do. The evaluated spectrum in figure 6 shows a deviation at low Raman shifts but good agreement at high shifts. This asymmetry indicates that the evaluated temperature will differ from the actual temperature and more should be done to find a better fit.
-0,2
0
0,2
0,4
0,6
0,8
1
1,2
0 10 20 30 40 50 60 70 80 90 100
wavenumbers / cm-1
Nor
mal
ized
Inte
nsity
ExperimentalTeoreticalDifference
Figure 6: An evaluated CO2 spectrum with best matching theoretical spectrum and the difference between them. The line width model used is the MEG model.

17
The spectrum for carbon dioxide has very low Raman shifts, hence it will appear close to the CSRS spectrum (Coherent Stokes Raman Spectroscopy). This may have an effect on the peaks with the lowest Raman shifts. When the effect of the CSRS was taken into account in the program the theoretical spectra were significantly closer to the experimental one than before, see figure 7. The deviations were more symmetric.
-0,2
0
0,2
0,4
0,6
0,8
1
1,2
0 20 40 60 80 100
wavenumbers /cm-1
Nor
mal
ized
Inte
nsity
ExperimentalTheoreticalDifference
One more constant was added to the energy equation describing the spectral position of the rotational energy levels, in the program. This was the constant H, see equation 1 in chapter 2.1. However, the insertion of H did not noticeably alter the spectrum. The evaluated temperature was still too far from the one expected. The parameters mentioned in chapter 3.1.2, such as linear dispersion and Raman shift, that had been set “fixed” in the program were now set “not fixed” to see if better correspondence could be found. Allowing the program to find a dispersion and Raman shift for the chosen reference channel gave a better fit. To see whether the slit function could be improved different experimental spectra were used to find slit functions. These were then used in the evaluation of the carbon dioxide spectrum. To try and further improve the agreement between experimental and theoretical spectra the slit function which gave the best fit was altered to make an even better fit until the agreement was satisfying. The best slit function for spectra recorded with the Nd:YAG laser run in multimode was then found in the same way.
Figure 7: An evaluated CO2 spectrum with best matching theoretical spectrum and the difference between them. The influence of CSRS on the CARS spectrum has been accounted for.

18
4 Experimental Setup
4.1 Lasers There are two lasers, a pulsed Neodymium YAG laser (YG 980) and a broadband dye laser (TDL 90). The Nd:YAG laser can operate at multimode, with a spectral width of approximately 0.7 cm-1, or single-mode, with a width of approximately 0.005 cm-1. It works with 10 pulses per second, each pulse being 10 ns long. The dye laser uses the dye DCM. The broadband spectrum is in the red region, centred around 635 nm and approximately 300 cm-1 broad. The fundamental wavelength of the Nd:YAG laser, 1064 nm, is frequency doubled to 532 nm. Part of the laser beam is used in the CARS process, the remainder is used for pumping the dye laser. The beam from the dye laser is divided into two beams, one of which is nearly overlapping the Nd:YAG beam. Before the lens L1 (see figure 8) the distance between beam 1 (and 3) and 2 is 15 mm. All three beams are focused by L1 on the same spot in the gas sample that is to be measured. L1 has a focal length of 500 mm.
Figure 8: Schematic experimental setup [8].

19
4.2 The Measured Gas The gas is lead to the focus point through a tube ending with a T-junction-shaped nozzle, with a flow sufficient to press air out of the nozzle. The laser beams are free to go straight through the nozzle and overlap in the middle where the gas exits the tube, see figure 9.
After the measurement point one of the dye laser beams and the 532 nm beam are blocked in beam dumps, while the CARS beam together with the alone red beam is collimated by lens L2 (figure 8) and propagates towards the spectrograph. The focal length of L2 is 300 mm. By transporting the CARS beam further away from the source, which is the focus point in the gas, virtually all stray light at 532 nm is removed from the CARS beam. Before entering the spectrograph the co-propagating red beam is suppressed with dichroic mirrors and two short-pass filters. The CARS signal intensity is also reduced by a neutral density filter so as not to saturate or burn the CCD camera.
4.3 Detector System The detector system consists of a spectrometer, a back illuminated CCD camera and a computer. The CARS beam is focused onto the entrance of the spectrometer with a lens. A mirror at the other end inside the spectrometer reflects the beam towards a blazed grating where the beam is spread out horizontally in wavelength. A second mirror focuses the spread out beam onto the CCD camera. The signal is recorded on a CCD chip with 1100 × 330 pixels. There is no Multiple Channel Plate (MCP) to increase the strength of the signal. However, the laser like signal from CARS is strong in itself. Not using a MCP gives
Figure 9: Simplified drawing of the T-junction nozzle. The arrows indicate the direction of the gas flow.

20
a possibility to higher resolution since it is the actual signal that is detected. Almost every charge on the CCD chip originates from a photon and the CCD chip has a quantum efficiency of ~90%. The drawback is that the detector cannot be opened and closed for small periods to shut out stray light. To avoid some of the stray light an external shutter is used (opened 2 ms, closed 98 ms). This is open for far longer times than the laser pulses, nevertheless this is of no great problem because the CARS signal can be detected far from the source and hence stray light from the source is decreased. The computer makes it possible to, amongst other things, save single-shot spectra and averaged spectra. Single-shot spectra are CARS spectra from one laser pulse. Averaged spectra are accumulated from several laser pulses.

21
5 Measurements and Results Experimental CARS spectra are collected. Not only spectra from carbon dioxide are needed. Some other spectra are used to calculate effects from this specific experimental setup, e.g. air-spectra for calculation of the dispersion of the detector system and nitrogen-spectra for the calculation of how much the setup broadens the signal. The setup was discussed in chapter 4.
5.1 Preparation An experiment is carried out to provide experimental room temperature CARS spectra on CO2. Averaged and single-shot spectra of air, nitrogen, argon and carbon dioxide are recorded. The injection seeded Nd:YAG laser is able to run multimode as well as single-mode with a simple on/off button for the seeding single-mode diode laser, and spectra from both are taken. An example of an averaged CO2 spectrum at room temperature can be seen in figure 10.
0
0,2
0,4
0,6
0,8
1
1,2
0 20 40 60 80 100
Wavenumber / cm-1
Norm
aliz
ed In
tens
ity
Figure 10: Averaged spectrum of CO2, from 300 single-shot spectra at 300 K. The Nd:YAG laser was run in single-mode.
22
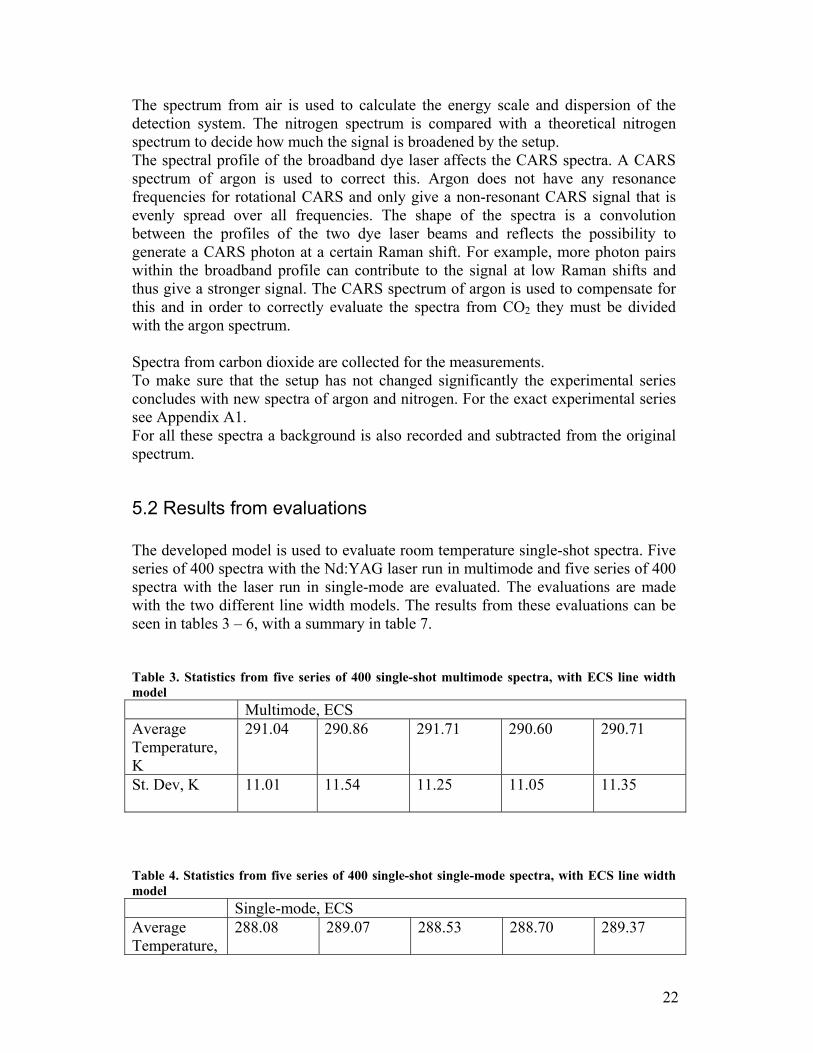
The spectrum from air is used to calculate the energy scale and dispersion of the detection system. The nitrogen spectrum is compared with a theoretical nitrogen spectrum to decide how much the signal is broadened by the setup. The spectral profile of the broadband dye laser affects the CARS spectra. A CARS spectrum of argon is used to correct this. Argon does not have any resonance frequencies for rotational CARS and only give a non-resonant CARS signal that is evenly spread over all frequencies. The shape of the spectra is a convolution between the profiles of the two dye laser beams and reflects the possibility to generate a CARS photon at a certain Raman shift. For example, more photon pairs within the broadband profile can contribute to the signal at low Raman shifts and thus give a stronger signal. The CARS spectrum of argon is used to compensate for this and in order to correctly evaluate the spectra from CO2 they must be divided with the argon spectrum. Spectra from carbon dioxide are collected for the measurements. To make sure that the setup has not changed significantly the experimental series concludes with new spectra of argon and nitrogen. For the exact experimental series see Appendix A1. For all these spectra a background is also recorded and subtracted from the original spectrum.
5.2 Results from evaluations The developed model is used to evaluate room temperature single-shot spectra. Five series of 400 spectra with the Nd:YAG laser run in multimode and five series of 400 spectra with the laser run in single-mode are evaluated. The evaluations are made with the two different line width models. The results from these evaluations can be seen in tables 3 – 6, with a summary in table 7. Table 3. Statistics from five series of 400 single-shot multimode spectra, with ECS line width model Multimode, ECS Average Temperature, K
291.04 290.86 291.71 290.60 290.71
St. Dev, K 11.01
11.54 11.25 11.05 11.35
Table 4. Statistics from five series of 400 single-shot single-mode spectra, with ECS line width model Single-mode, ECS Average Temperature,
288.08 289.07 288.53 288.70 289.37

23
K St. Dev, K 8.38
8.43 8.85 8.11 8.13
Table 5. Statistics from five series of 400 single-shot multimode spectra, with MEG line width model Multimode, MEG Average Temperature, K
295.68 295.48 296.34 295.24 295.33
St. Dev, K 11.11
11.67 11.33 11.20 11.43
Table 6. Statistics from five series of 400 single-shot single-mode spectra, with MEG line width model Single-mode, MEG Average Temperature, K
292.88 293.93 293.43 293.54 294.20
St. Dev, K 8.43
8.51 8.94 8.13 8.16
Table 7. A comparison of evaluated temperature and precision from two line width models and laser run in single and multimode.
ECS MEG
Average over five series: Multimode Single-mode Multimode Single-mode
Average, K
290.98
288.75 295.61 293.60
St. Dev, K 11.24
8.38 11.35 8.43
The approximate temperature, according to a thermometer, at the time of the experiment was 294 K. From table 7 one can see that although the ECS model gives marginally smaller standard deviation from the evaluated temperature, the MEG model is by far more accurate and still has very good standard deviation. This is the case when evaluating at room temperature.

24
To see weather it is motivated, at room temperature, to use the model with account taken for three vibrational levels the evaluations in table 6 are carried out with only the ground vibrational level accounted for, the results are presented in table 8. Table 8. Evaluations using the model with only one vibrational level taken account for. Five series of 400 single-shot spectra are evaluated using the MEG line width model. Single-mode, MEG Average Temperature, K
292.6 293.9 293.4 293.2 294.2
St. Dev, K 9.44
9.51 10.03 9.07 9.08

25
6 Discussion (with analysis) The standard deviations from the measurements with the Nd:YAG laser run in multimode were 11-12 K. This was only slightly better than similar measurements in Ref. 1, where the standard deviations were in the range of 11-15 K. By running the Nd:YAG laser in single-mode the standard deviations were decreased to 8-9 K. At room temperature the MEG line width model proved most accurate, with an inaccuracy of less than one degree, even though ECS gave marginally lower standard deviation. Over all evaluations using the ECS model gave lower temperature than evaluations using the MEG model, which is consistent with the work in Ref. 1, although they found ECS the better line width model at higher temperatures and/or pressures. According to their work MEG line widths strongly deviated from the actual line width for rotational quantum numbers over 50. Even though vibrational levels other than the ground level are barely populated at room temperature, the model taking account for the ground level and the first excited level of the degenerated bending mode gave better precision than the simpler model which only accounted for the ground level. Evaluating the CO2 spectra was anticipated to lead to better precision than the spectra from N2 because the CO2 spectra show more peaks and a spectrum with many peaks to evaluate may give a more correct result than a spectrum with fewer peaks to evaluate. The results may be compared to experiments with CARS on N2 [9], which had been carried out earlier at the department. With the same lasers as the ones used in this experiment the standard deviations where approximately 12 K and 24 K with the Nd:YAG laser run in single-mode and multimode, respectively. The use of the model for CO2 has proved to give significantly better precision. It should be noted that the mentioned experiment on N2 has been improved with the use of a modeless broadband dye laser [10]. This gave better results with standard deviations of approximately 6 K and 11 K for single-mode and multimode Nd:YAG laser, respectively. This is slightly better or in the region of the results from the model on CO2. It would be interesting to investigate what precision could be achieved with rotational CARS experiments using a modeless dye laser on CO2. There were signs of cosmic radiation in the spectra. The cosmic radiation made the argon spectra look noisy, with some high very narrow peaks, and not as smooth as expected. Since the CO2 spectra are divided with the argon spectra the noise may have affected the evaluations and it is possible that the results had been better if the cosmic radiation had been filtered out. A way of minimizing the effect of the cosmic radiation may be to only summarize the CARS-signal over the pixels where most of the signal is. So instead of summarizing the signal over the 330 pixels in every vertical channel, it may have been better to risk losing some of the signal and only summarize over the few pixels where most of the signal was collected.
26
The method used to compare the experimental spectra to theoretical spectra is based on the sum of squares. The difference in every channel between the two spectra is squared and summarized. It was checked whether there was a correlation between sum-of-squares and evaluated temperatures. No such correlation could be found. Some constants that were ignored in this model need to be taken into account when using the model to evaluate spectra from CO2 together with other species. These are the polarizability anisotropy constants and affect the intensity of the spectra compared to other species. When measuring the temperature from CO2 alone they do not add any information to the measurement since it is the spectral shape and not the intensity that is evaluated.

27
7 High Resolution Experiments The results so far are satisfying. However, it was considered interesting to disperse the spectra more with the potential to improve the spectral resolution which in turn could give more accurate temperature measurements.
7.1 Setup The setup was almost the same as in the previous experiment. The only places in the setup that were changed were before the spectrometer and between the spectrometer and the CCD-camera. The lens used to focus the CARS signal on the entrance of the spectrometer was changed from f = 150 cm to f = 100 cm. This was done in order to get a smaller beam waist on the entrance of the spectrometer, and to better take advantage of the size of the mirrors and the grating inside the spectrometer When the signal leaves the spectrometer it has been spectrally separated. In the previous experiment it was only separated enough to hit one third of the CCD chip. In order to get better dispersion the chip needs to be better used. A relay system [11] was used to magnify the signal. The relay system applied in this experiment consisted of two camera lenses put on a translator. Both were adjusted to focus in the eternity, see figure 11. The two camera lenses have focal lengths of 50 mm and 135 mm. This gives an enlargement of approximately 2.7 times, which spreads the signal over the whole CCD chip and gives a lower dispersion. Since the camera used was a back-illuminated camera, time-gating was difficult. To stop stray light from reaching the camera through the relay system sellotape and a piece of cloth was wrapped around the lenses, covering the space between the spectrometer and the CCD camera.

28
7.2 Experiment An experiment with room temperature measurements was performed. Initially there was a problem with strange peaks appearing in the spectrum. They did not seem to come from the spectrometer but was possibly light reflected within the relay system. A mirror inside the spectrometer was tilted to move the signal and the strange peaks seemed to disappear from the spectrum. Measurements were performed in a similar order as in the previous experiment. See Appendix A2.
7.3 Measurements and Results The width of the peaks (FWHM) in the N2 spectrum had decreased from approximately 0.7 cm-1 to 0.35 cm-1 with the relay system. A double peak in the air spectrum was better resolved with the new set-up, see figure 12. Hence the combination of the change of lens before the spectrometer and lower dispersion had given a higher resolution. Evaluation was performed as before, see chapter 5.
CCD
SPECTROMETER
Relay system made up with two camera lenses
CARS-signal
Figure 11: The detection system with the relay system.
grating
mirrors

29
0
0,2
0,4
0,6
0,8
1
1,2
0 10 20 30 40 50 60 70 80
Wavenumber / cm-1
Nor
mal
ized
inte
nsity
The expectations on better results with higher resolution were not met. It seems that the tilting of the mirror in the spectrometer added an even background of stray light to the spectrum. The peaks are very narrow but at low intensities they widen out, see figure 13. This makes it difficult to find the appropriate slit function. It also shows difficult to evaluate the temperature correctly, see results in tables 9 and 10. The results are not better than with the lower resolution, they are not even equally good.
2202402602803003203403603804001
2
3
4
5
6
7
8
9
10
11x 10
5
220 225 230 235 240 245 250 255 260 265 270 2751 2 3 4 5 6 7 8 x 10 5
Figure 13: Averaged spectrum of CO2, accumulated from 300 single-shot spectra at 300 K. The Nd:YAG laser was run in single-mode and the relay system was used.
Figure 12: A double peak at 60 cm-1 in the air spectrum. To the left is the double peak taken with the original dispersion and to right it has been taken with the better dispersion achieved with the relay system.

30
Table 9. Statistics from five series of 400 single-shot spectra taken with the Nd:YAG laser run in single-mode. The line width model used was the MEG model. The relay system was used for higher resolution. Single-mode Average Temperature, K
323.6 324.1 322.9 324.1 323.4
St. Dev, K 9.61 9.97 10.58 10.04 9.42 Table 10. Statistics from five series of 400 single-shot spectra taken with the Nd:YAG laser run in multimode. The line width model used was the MEG model. The relay system was used for higher resolution. Multimode Average Temperature, K
314.5 314.3 314.1 314.3 315.0
St. Dev, K 11.66 11.97 11.65 11.67 12.46
7.4 Experiment at Higher Temperature Higher resolution means that it may be possible to resolve the peaks from the first excited level of the bending mode (01101e), populated at higher temperatures. While the equipment was set up a bonus experiment was performed. The gas was heated with a hot air gun before the measurement was performed. This was with little control over the exact temperature the gas was heated to. Albeit poor experimental conditions a nice spectrum of carbon dioxide at approximately 550 K showed up on the screen. In figure 14 is a zoomed picture of CO2 at approx. 550 K. Small peaks can be seen between the higher ones. These are presumed to originate from the first excited bending mode of CO2, as similar peaks can be seen in the theoretical spectrum in figure 15.

31
605040301.4
1.5
1.6
1.7
1.8
1.9
2
2.1
2.2
2.3x 10
5
Wavenumber / cm-1
Inte
nsity
/ ar
b. u
nits
0
0,2
0,4
0,6
0,8
1
1,2
0 20 40 60 80 100 120
Wavenumber / cm-1
Nor
mal
ized
inte
nsity
Figure 15: Theoretical spectrum of CO2 at 500 K.
Figure 14: Part of an averaged spectrum of CO2, accumulated from 300 single-shot spectra. The small peaks, presumably originating from the second vibrational level, can be seen between the higher peaks.
Wavenumber / cm-1

32
The developed CO2 model was used to evaluate two averaged spectrum from CO2 heated to approximately 550 K. The result from the first spectrum is illustrated in figure 16. The evaluated temperatures were 545 K and 531 K. But due to the uncertainty of the temperature of the gas the accuracy of the evaluated temperatures is not known. However, the difference shown in figure 16 is very asymmetrical and this indicates bad accuracy.
-0,4
-0,2
0
0,2
0,4
0,6
0,8
1
1,2
0 20 40 60 80
Wavenumber / cm-1
Norm
aliz
ed in
tens
ity
ExperimentalTheoreticalDifference
7.5 Discussion The resolution was improved with the simple relay system. In the CO2 spectra at 550 K peaks that had not been resolved before could be seen. But the temperature measurements gave worse average temperature and standard deviation than the measurements done with lower resolution. This is probably due to the tilting of the spectrometer mirror to remove the ghost peaks, but also the primitive setup of the relay system. If the mirror had not been tilted, the system was improved and stray light averted more efficiently it is most probable that the results could be improved.
Figure 16: An evaluated spectrum of CO2 at approximately 550 K. Unfortunately the CARS-signal with wavenumbers over 80 cm-1 was not detected.

33
8 Summary and Outlook A theoretical model for the CARS spectra for CO2 was developed. In the model, the ground energy level and the first excited levels of the doubly degenerate bending modes were taken into account. The population of vibrational levels of higher energy were considered negligible, and these levels were not included in the model. To validate the model it was used to evaluate experimental room temperature spectra taken with the Nd:YAG laser running in single-mode and in multimode. Two line width models, MEG and ECS, were used and the results were compared. The best results were achieved running the Nd:YAG laser in single-mode and using the MEG line width model. This gave an inaccuracy of less than one Kelvin and a standard deviation of 8 – 9 K. The results for the spectra taken with the Nd:YAG laser in multimode were 1 – 2 K inaccuracy and 11 – 12 K standard deviation, when using the MEG model. When using the ECS model the standard deviations were the same as for the MEG model, but the inaccuracies were 3 – 5 K. The developed model for the rotational CARS spectrum for CO2 was shown to be accurate at room temperature, and has good precision as was expected. The results from the model were compared to those of the German group and proved better, in that the standard deviation was smaller. The model also proved to give better results than the experiments on N2 performed within the department with the same equipment. To improve the resolution of the experimental spectra, and possibly also the precision of the evaluated temperatures, a relay-imaging system was used. The resolution was improved, but because of experimental difficulties in these first measurements no statement can be made regarding accuracy and precision. With the higher resolution, an attempt at recording spectra at higher temperature was made. Due to poor experimental conditions during the experiment it was difficult to determine the model’s validity at temperatures over room temperature. It is possible that more vibrational levels must be included in the model to ensure equally good results when evaluating at higher temperatures. To enable measurements on CO2 and other species simultaneously the polarizability anisotropy constant for CO2 must be included in the model since this constant affect the strength of the spectrum. It may be possible to further improve the precision by using a modeless broadband dye laser in the experiment as has previously been done on N2 within the department.

34
Acknowledgements I want to thank my supervisor Per-Erik Bengtsson, whom it has been a pleasure to work with. I am also grateful for the help from Fredrik Vestin. Thank you, everybody at the Combustion Department for making me feel so welcome from the very first start of my Master Thesis. I have much enjoyed lunch and coffee break conversations. And my dear husband, thank you for all the love and support.

35
References [1] M. Schenk , T. Seeger and A. Leipertz., “Time-resolved CO2 thermometry for pressures as great as 5 MPa by use of pure rotational coherent anti-Stokes Raman scattering”, Appl. Optics 44 (31), 6526–6536 (2005). [2] C. Banwell and E. McCash, “Fundamentals of Molecular Spectroscopy” , Fourth Edition, McGraw-Hill (1994). [3] L. S. Rothman, R. L. Hawkins, R. B. Wattson and R. R. Gamache , “Energy Levels. Intensities, and Linewidths of Atmospheric Carbon Dioxide Bands”, J. Quant. Spectrosc. Radiat. Transfer 48 (5), 537-566 (1992). [4] J. Bood, P.-E. Bengtsson and M. Aldén., “Temperature and concentration measurements in acetylene-nitrogen mixtures in the range 300-600 K using dual-broadband rotational CARS”, Appl. Phys. B 70, 607-620 (2000). [5] A. Eckbreth, ”Laser Diagnostics for Combustion Temperature and Species”, Second Edition, Gordon and Breach Publishers (1996). [6] L. Martinsson, P.-E. Bengtsson, M. Aldén and S. Kröll, “A test of different rotational Raman linewidth models: Accuracy of rotational coherent anti-Stokes Raman scattering thermometry in nitrogen from 295 to 1850 K”, J. Chem. Phys. 99 (4), 2466-2477 (1993). [7] B. Lavorel, G. Millot, R. Saint-Loup, H. Berger, L. Bonamy, J. Bonamy and D. Robert, “Study of collisional effects on band shapes of the ν1/2ν2 Fermi dyad in CO2 gas with stimulated Raman spectroscopy. I. Rotational and vibrational relaxation in the 2ν2 band”, J. Chem. Phys. 93 (4), 2176-2184 (1990). [8] J. Bood, ”Development of Dual-broadband Rotational CARS for Combustion Diagnostics”, Doctorial thesis, Lund Institute of Technology (2000). [9] M. Afzelius and P.-E. Bengtsson, “Precision of single-shot dualbroadband rotational CARS thermometry with single-mode and multimode Nd:YAG lasers,” J. Raman Spectrosc. 34, 940–945 (2003). [10] F. Vestin, M. Afzelius and P.-E. Bengtsson, “Improved temperature precision in rotational coherent anti-Stokes Raman spectroscopy with a modeless dye laser”, Appl. Optics 45 (4), 1-4 (2006). [11] M. Woodmansee, R. Lucht and C. Dutton, ”Development of high resolution N2 coherent anti-Stokes Raman scattering for measuring pressure, temperature, and density in high-speed gas flows”, Applied Optics 39 (33), 6243-6256 (2000).

36
Appendix
A1. The original experimental series Nr Data collected Name of
saved file Name of background
Nd:YAG run in single-/multimode
1 2 spectra of 300 shots air luft-1 luft-b1 single-mode 2 2 spectra of 300 shots N2 n2-1 n2-b1 single-mode 3 2 spectra of 300 shots N2 n2-2 single-mode 4 5 spectra of 300 shots Ar ar-1 ar-b1 single-mode 5 5 spectra of 300 shots Ar ar-2 single-mode 6 5 spectra of 300 shots CO2 co2-1 co2-b1 single-mode 7 5 spectra of 300 shots CO2 co2-2 single-mode 8 500 spectra of 1 shot CO2 co2-s1 single-mode 9 500 spectra of 1 shot CO2 co2-s2 single-mode 10 500 spectra of 1 shot CO2 co2-s3 single-mode 11 500 spectra of 1 shot CO2 co2-s4 single-mode 12 500 spectra of 1 shot CO2 co2-s5 single-mode 13 500 spectra of 1 shot CO2 co2mm-s1 multimode 14 500 spectra of 1 shot CO2 co2mm-s2 multimode 15 500 spectra of 1 shot CO2 co2mm-s3 multimode 16 500 spectra of 1 shot CO2 co2mm-s4 multimode 17 500 spectra of 1 shot CO2 co2mm-s5 multimode 18 5 spectra of 300 shots CO2 co2mm-1 co2mm-b1 multimode 19 5 spectra of 300 shots CO2 co2mm-2 single-mode 20 2 spectra of 300 shots air luft-2 luft-b2 single-mode 21 2 spectra of 300 shots N2 n2-3 n2-b3 single-mode 22 2 spectra of 300 shots N2 n2mm-4 n2mm-b4 multimode 23 5 spectra of 300 shots Ar ar-3 ar-b3 single-mode 24 5 spectra of 300 shots Ar ar-4 single-mode 25 5 spectra of 300 shots Ar ar-mm-1 ar-mm-b1 multimode 26 5 spectra of 300 shots Ar ar-mm-2 multimode Pulse energies during the experiment: Green beam 4 mJ (with Nd:YAG laser in single-mode)
4 mJ (with Nd:YAG laser in multimode) Red beam, overlapping the green 21 mJ (with Nd:YAG laser in single-mode)
21.5 mJ (with Nd:YAG laser in multimode) Red alone beam 20 mJ (with Nd:YAG laser in single-mode)
20.5 mJ (with Nd:YAG laser in multimode)

37
A2. The experimental series with higher resolution Nr Data collected Saved file Background Nd:YAG run in single-
/multimode 1 2 spectra of 300 shots air aluft-1 aluft-b1 single-mode 2 2 spectra of 300 shots N2 an2-1 an2-b1 single-mode 3 2 spectra of 300 shots N2 an2-2 single-mode 4 5 spectra of 300 shots Ar aar-1 aar-b1 single-mode 5 5 spectra of 300 shots Ar aar-2 single-mode 6 5 spectra of 300 shots CO2 aco2-1 aco2-b1 single-mode 7 5 spectra of 300 shots CO2 aco2-2 single-mode 8 500 spectra of 1 shot CO2 aco2-s1 single-mode 9 500 spectra of 1 shot CO2 aco2-s2 single-mode 10 500 spectra of 1 shot CO2 aco2-s3 single-mode 11 500 spectra of 1 shot CO2 aco2-s4 single-mode 12 500 spectra of 1 shot CO2 aco2-s5 single-mode 13 500 spectra of 1 shot CO2 aco2m-s1 multimode 14 500 spectra of 1 shot CO2 aco2m-s2 multimode 15 500 spectra of 1 shot CO2 aco2m-s3 multimode 16 500 spectra of 1 shot CO2 aco2m-s4 multimode 17 500 spectra of 1 shot CO2 aco2m-s5 multimode 18 5 spectra of 300 shots CO2 aco2m-1 aco2m-b1 multimode 19 5 spectra of 300 shots CO2 aco2m-2 multimode 20 2 spectra of 300 shots air aluft-2 aluft-b2 single-mode 21 2 spectra of 300 shots N2 an2-3 an2-b3 single-mode 22 2 spectra of 300 shots N2 an2m-4 an2m-b4 multimode 23 5 spectra of 300 shots Ar aar-3 aar-b3 single-mode 24 5 spectra of 300 shots Ar aarm-1 aarm-b1 multimode 25 5 spectra of 300 shots Ar aarm-2 multimode Pulse energies during the experiment: Green beam 1 mJ Red beam, overlapping the green 16 mJ Red alone beam 14 mJ