development and evaluation of a simulation system … · development and evaluation of a simulation...
TRANSCRIPT
Central Washington UniversityScholarWorks@CWU
All Master's Theses Master's Theses
2007
Development and Evaluation of a SimulationSystem Based Upon Standard PedestrianThoroughfare MethodologiesCharles O. PringleCentral Washington University
Follow this and additional works at: http://digitalcommons.cwu.edu/etd
Part of the Computer-Aided Engineering and Design Commons, and the TransportationEngineering Commons
This Thesis is brought to you for free and open access by the Master's Theses at ScholarWorks@CWU. It has been accepted for inclusion in All Master'sTheses by an authorized administrator of ScholarWorks@CWU.
Recommended CitationPringle, Charles O., "Development and Evaluation of a Simulation System Based Upon Standard Pedestrian ThoroughfareMethodologies" (2007). All Master's Theses. Paper 456.

DEVELOPMENT AND EVALUATION OF A S IMULATION SYSTEM BASED
UPON STANDARD PEDESTRIAN THOROUGHFARE METHODOLOGIES
. ( A Thesis
Presented to
The Graduate Faculty
Central Washington University
In Partial Fulfillment
of the Requirements for the Degree
Master of Science
Engineering Technology
by
Charles 0. Pringle
June 2007

BROOKS LIBRARY
CENTRAL WASHINGTOO UNIVERSITY
ELLENSBURG. WASHINGTON 98926
CENTRAL WASHINGTON UNIVERSITY
Graduate Studies
We hereby approve the thesis of
Charles O. Pringle
Candidate for the degree of Master of Science
APPROVED FOR THE GRADUATE FACULTY
5/23/2007 __________________________________________ Dr. Geoffrey Dean, Committee Chair 5/24/2007 __________________________________________ Dr. William Bender 5-23-2007 __________________________________________ Bill Vertrees 6/20/08 __________________________________________ Associate Vice President of Graduate Studies

ABSTRACT
DEVELOPMENT AND EVALUATION OF A SIMULATION SYSTEM BASED
UPON STANDARD PEDESTRIAN THOROUGHFARE METHODOLOGIES
by
Charles 0. Pringle
June 2007
This study integrated Highway Capacity Manual 2000 (HCM) methodologies
into the ProModel simulation software package and then compared and contrasted the
resultant data. The HCM methodologies were used to create the ProModel algorithms.
Pedestrian thoroughfare system simulations were then run with these algorithms, and
the software simulation outcomes were compared to the HCM outcomes for the same
situational parameters.
The Central Washington University main campus thoroughfares were used as a
case s tudy. Videography at three locations for 4 days per location provided the
pedestrian count and rate data. Peak pedestrian counts were entered into the simulation
model for HCM level of service computation.
The model that resulted from this applied research effort can be used to
evaluate the variables that influence the design of pedestrian thoroughfares elsewhere
on the Central Washington University main campus because the HCM and simulation
iii
model computations produced the same level of service values with the same
situational parameters.
IV
ACKNOWLEDGMENTS
I would like to thank my family (Deanna, Colin, and Aidan) for their patience,
support, endurance of unfinished home projects, and absences from some family
activities in my efforts toward a master's degree.
Thank you to the Central Washington University's Facilities Management
Department and my supervisors (Robert Tosch and Mickey Parker) for their support in
completing my degree. I would not have finished on time if they had not allowed me
the necessary time off to complete my thesis. Thanks again to Robert Tosch for
making an exception and allowing me to video from the roof of Randall and Black
Halls. Thanks to Bill Lovell for his assistance with the videography setup. Thank you
to J adon Berry for allowing me to use his office for a week to video pedestrians.
A big "thank you" to all my editors (Lori St. John, Trina Lanegan, Karen
Bicchieri, Fennelle Miller, Pat Nahan P.E., and Stephanie Arington of Ellensburg,
Washington and Dr. Ron Carson of Seattle, Washington) for their suggestions,
corrections, and willingness to endure repeated readings. Thanks to Diane Houser and
Dr. Lila Harper for correcting all my formatting errors.
Thank you to Rick Holmstrom who provided me with the Highway Capacity
Manual 2000 and insightful suggestions. Thank you to Doug Ryder and Kelley
Cadman for providing me with reports and data to use in my thesis .
Thanks to my committee members (Dr. Geoffrey Dean, Dr. William Bender,
and Bill Vertrees) whose enthusiasm and support propelled me to completion. I would
also like to honor Dr. Walt Kaminski (1935-2004), with whom I started this process.
v

TABLE OF CONTENTS
Chapter Page
I INTRODUCTION .................................... ...................................................... 1
Purpose ........................................... .... ..................................................... 1 Assumption .............................................................................................. 2 Delimitation ..................................................... ........................................ 2 Problem Statement .................................................................................. 2 Research Questions ................................................................................. 2 Definition of Terms ................................................................................. 3
II DESCRIPTION OF RESEARCH .................................................................. 6
Research Validity ........... ......................................................................... 6 Methodology ........................................................................................... 6 Research Procedure .......................................................................... ....... 9
III LITERATURE REVIEW ............................................................................. 22
Body of Knowledge ...................... . . . . . . . .................................................. 22
N MODEL ANALYSIS ................... . . ............. . ................................................ 24
Highway Capacity Manual 2000 Methodologies .................................. 24 ProModel Software ................... ............................................................. 26
V DISCUSSION AND CONCLUSIONS ........................................................ 31
Simulation ........ ..................................................................................... 31 Evaluation ......................................... .................. ................................... 33 Conclusion ............................................................................................. 34
REFERENCES ...................................... ..... .................................................. 36
APPENDIXES ..... ........ ................................................................................. 38
Appendix A--Additional Setup Photographs ........................................ 38 Appendix B--Pedestrian Data for Central Washington University Campus .............................. .................................................................... 42 Appendix C--Simulation Logic .. ........ . . . . .... ....... . . ........... ....................... 54 Appendix D--ProModel Parameters for Bidirectional Flow ................. 55
vi
TABLE OF CONTENTS (continued)
Chapter Page
Appendix E--ProModel Parameters for Cross Flow ............................. 60 Appendix F--ProModel Simulation Model Screen Shots ...................... 66
vii
L IST OF T A B L ES
Table Page
1 Ave rage F low Level of Se rvice C rite ria f or Wal kways and Sidewal ks ....... 19
2 Platoon- Adjusted Ave rage Flow Level of Se rvice C rite ria for Wal kways and Sidewal ks .... .................... ................. ........ ........................... 20
3 Pea k 1 5-m in Pedestrian Counts pe r Location pe r Day ................................. 2 5
4 Ave rage F low Level of Se rvice E C rite ria fo r Wa lkways and Sidewal ks .... 2 6
5 Compa rison of Empi rical Data and Simulation Model Data ..... . . . . . . . . . . . .. ...... 29
vm
L IST OF F IGU R ES
Figu re Page
Map of Centra l Washington Unive rsity campus pedestrian obse rvation locations ........................................................................ ............ 10
2 Came ra view from Randa ll Ha ll roof to Wa l nut Ma ll ................................. . 11
3 Came ra view from second floo r of the Student Union and Rec reation Cente r to Wa lnut Ma l l ........... . . ................. ................................. 12
4 Came ra view from the roof of B lac k Ha ll to Wa lnut Ma ll.. .......... ............... 12
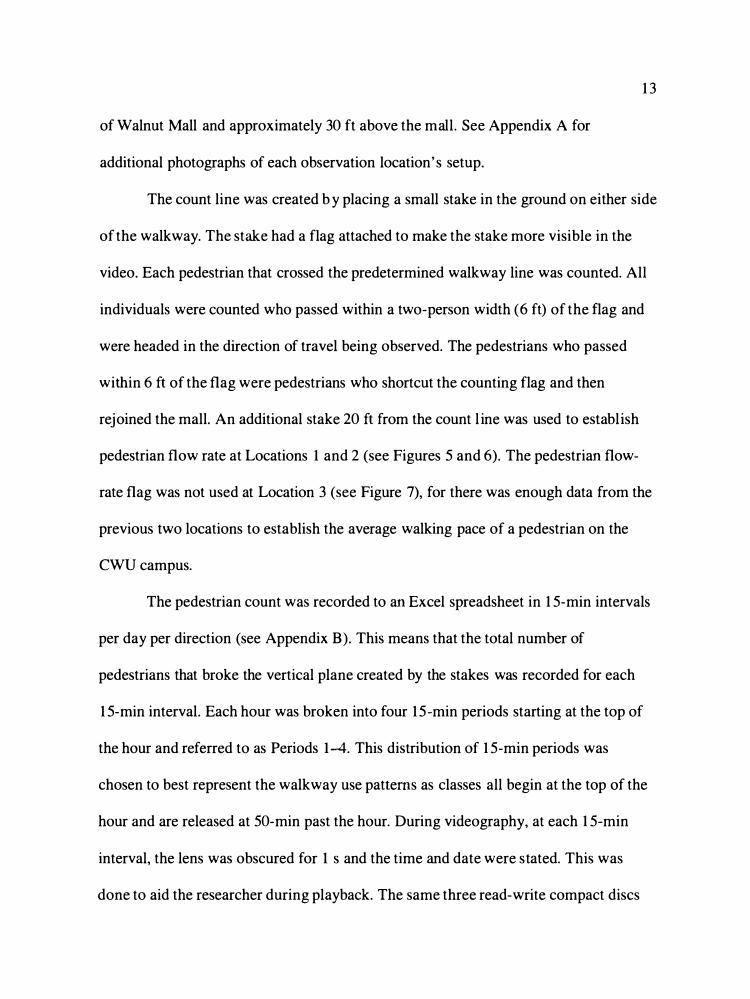
5 P lan view of Location 1 ( Wa lnut Ma ll and Randa ll Ha ll) .................. .......... 14
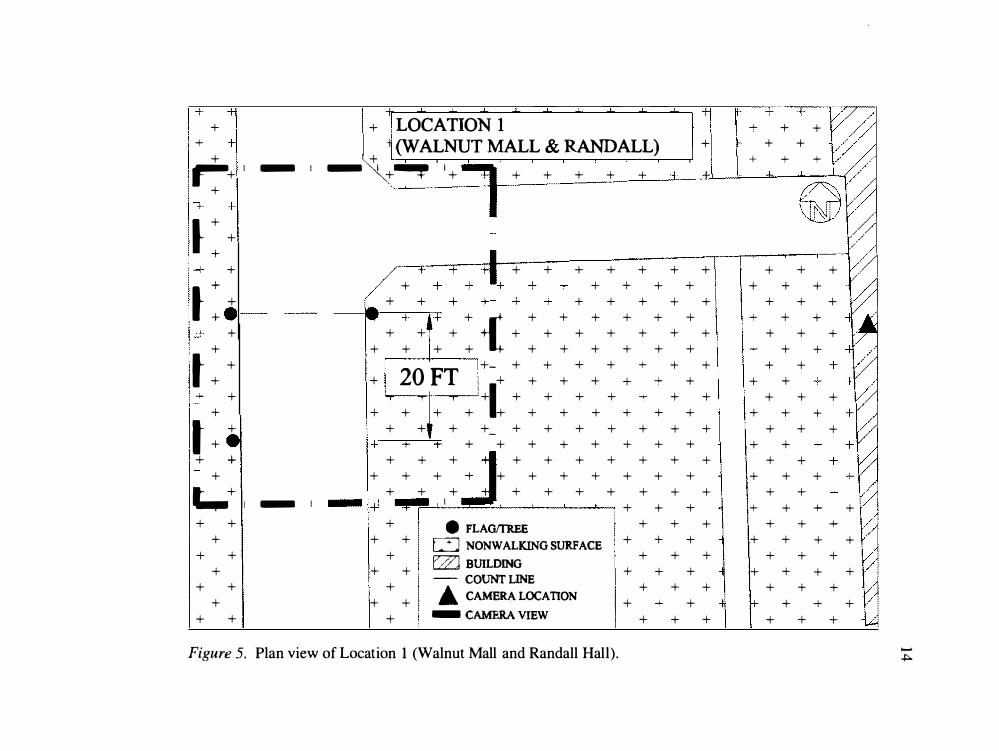
6 P lan view of Location 2 ( Wa lnut Ma ll and Student Union and Rec reation Cente r [SU R C]) ...... ....................... ........ .................................... 1 5
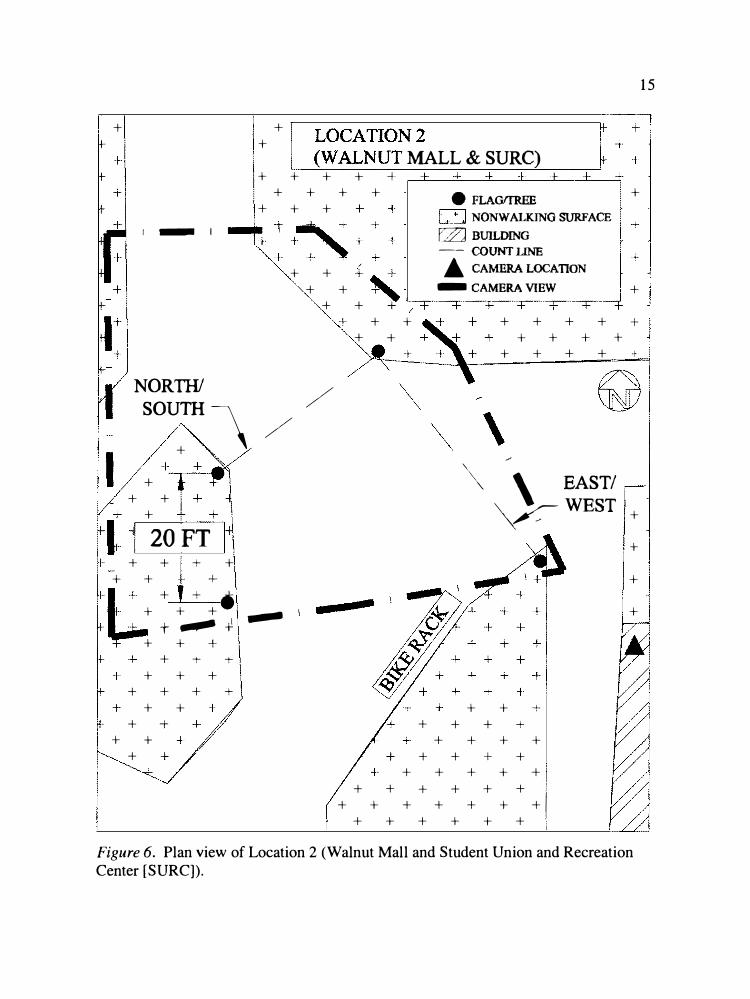
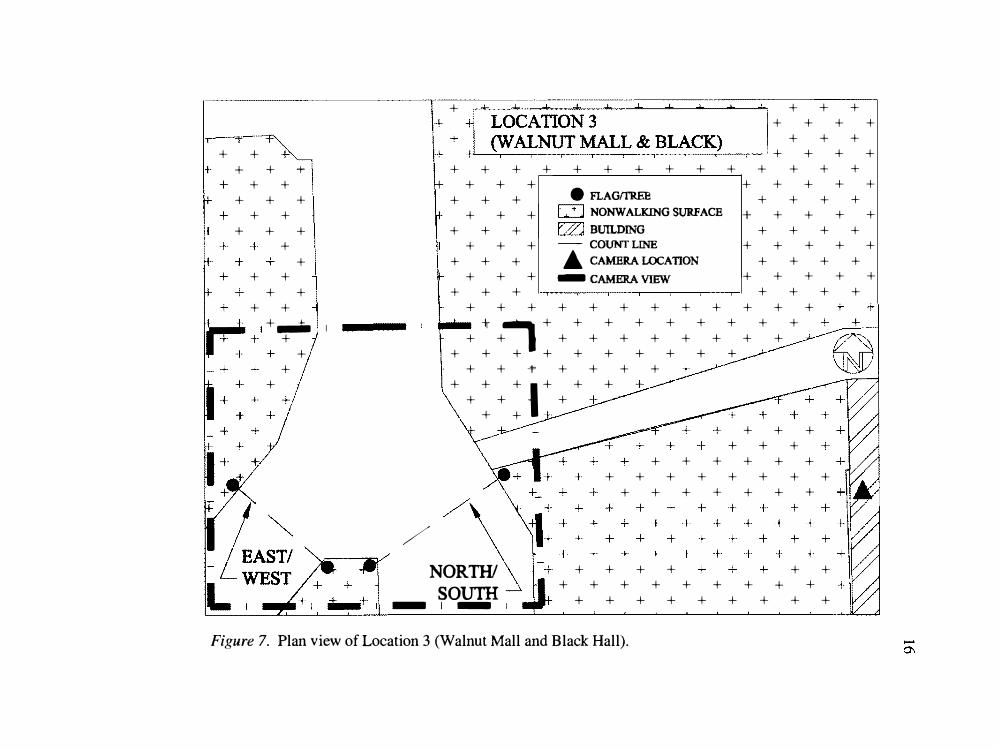
7 P lan view of Location 3 ( Wa lnut Ma ll and B lac k Ha ll) ......... .... ........ ... ....... 16
8 P roMode l simu lation mode l sc reen shot of Location 2 (Student Un ion and Rec reation Cente r [SU R C]) ........ . . .............................................. 30
9 Pe rcentage di ffe rence when compa ring simu lation mode l data to empi rica l data ............................................................................................... 31
10 Numbe r of students en ro lled at Centra l Washington Unive rsity and pe rcentage of en ro llment inc rease . . . ........... . ..... ............... ............. .... ... ......... 34
Al Setup photog raph of Location 1 ( Randal l Ha ll) roof ............... . .................... 38
A2 Setup photog raph of Location 1 ( Randa ll Ha ll) loo king no rth ................. .... 38
A3 Setup photog raph of Location 1 ( Randa ll Ha ll) loo king west.. .................... 39
A 4 Setup photog raph of Location 2 (Student Union and Rec reation Cente r) no rthwest co me r of the bui ld ing ..... ................................. . ... ........... 39
AS Setup photog raph of Location 2 (Student Un ion and Rec reation Cente r) loo king west ........................ ......... .............................. ..................... 40
ix
L IS T OF F IGU R ES (co nt inued)
F igu re Page
A 6 Setup photog raph of Locatio n 2 (Student U nio n a nd Rec reatio n Ce nte r) loo ki ng no rth .............................. ....................................... . . . . . . . ....... 40
A 7 Setup photog raph of Locat io n 3 ( B lac k Ha ll) roof ............................. ... ..... .4 1
F l P roModel simu latio n mode l sc ree n shot of Locat io n 1 ( Ra nda ll Ha ll) ....................... .................. ...... ............................................................... 66
F2 P roMode l simulatio n model sc ree n shot of Locatio n 3 ( Blac k Hall) .......... 67
x
C HA P T E R I
IN T RO DU C T ION
Purpose
This study was undertaken to determine whether existing simulation and
modeling systems could be used to analyze and model pedestrian traffic flows. The
study incorporates the Highway Capacity Manual 2000 (HCM) ( Transportation
Research Board, National Research Council [ T R B], 2000a) methodologies into a
ProModel simulation and then compares and contrasts the results of the HCM
calculations with the ProModel simulation. The Central Washington Uni versity
( C WU) campus was used for the case study.
The T R B, a di vision of the National Research Council, ad vises the federal
go vernment on transportation facilities. ProModel is a simulation and analysis
software tool, which pro vided the visualization of the HCM methodologies ( ProModel
Corporation, 2005).
Prior to this study, the researcher had used ProModel to simulate vehicle tra ffic
flow on the C WU campus for the C W U Site and De velopment Committee . Analysis
of pedestrian flow density is an extension of pre vious work, and an ongoing concern,
for the C W U Site and De velopment Committee. The HCM de votes a complete chapter
(chapter 18) to analyzing pedestrian flow ( T R B, 2000a). While the HCM pro vides
methodologies for determining the capacity and le vel of ser vice ( LOS) for pedestrians,
it does not pro vide a graphical simulation tool. The C WU pedestrian traffic is modeled
using the methods in the HCM.
1
2
Assumption
The area under observation for each location is a uniform segment of the
walkway. The pedestrian walkway is between -3% and +3% grade, and there can be
no doorway in the middle of the walkway segment where large volumes of pedestrians
would emerge (TRB, 2000a). This phenomenon would be different from a cross flow
of pedestrians at a walkway intersection. This is an outside environment with mild
weather conditions.
Delimitation
The scope of this study focuses on pedestrian traffic on the CWU campus.
Minor modifications to the simulation model would allow it to be applied to any
pedestrian walkway.
Problem Statement
HCM methodologies rely on calculations and worksheets to determine
pedestrian flow and LOS. Once the calculations are made, there is no way to visually
simulate the pedestrian behavior characterized by the calculated solution. The
simulation model provides a means of visualizing the various levels of service. Since
many people are visually oriented, having a simulation tool becomes an important
means of presenting information (Anderson, 2002).
Research Questions
1 . Does the ProModel simulation allow us to simulate and analyze pedestrian
traffic flow?
2. If ProModel does allow us to analyze pedestrian tra ffic flow, will it allow
us to e valuate the range of situations that may occur?
3. How does ProModel simulation compare to the HCM model f or
determining walkway use?
Definition of Terms
3
Arri vals: " Any time new entities are introduced into the system, it is called an
arri val" ( ProModel Corporation, 2005). Using the path network, e very pedestrian
arri ves at one end ( Location A) of the simulation walkway segment and then arri ves at
its opposite end ( Location B).
Capacity: " Person capacity is the maximum number of persons that can pass a
gi ven point during a specified period under pre vailing conditions" ( T R B, 2000a, p. 2 -
2). A capacity is calculated for a segment or point, so segments with di fferent
pre vailing conditions will ha ve di fferent capacities. Capacity is not necessarily the
maximum flow rate obser ved. The units f or capacity are distance per time ( T R B,
2000a, p. 2-2).
Demand: " Demand is the principal measure of the amount of traffic using a
gi ven facility" ( T R B, 2000a, p. 2-2).
Entity: " Anything that a model processes is called an entity" ( ProModel
Corporation, 2005). Each pedestrian is considered an entity by the simulation software.
LOS: "a quality measure describing operational conditions within a traffic
stream, generally in terms of such ser vice measures as speed and tra vel time, freedom
to maneu ver, traffic interr uptions, and com fort and con venience" ( T R B, 2000a, p. 2-2).
4
Location: " Locations represent places in the system where entities are routed
for processing, storage, or some other acti vity or decision making" ( ProModel
Corporation, 2005). All the pedestrians in the simulation model arri ve at a location
prior to being processed (mo ving through the system). There are locations at each end
of the simulation walkways ( Locations A and B).
Path network: " Entities mo ving by themsel ves between locations may also
mo ve on path networks if referenced in the mo ve logic of the routing" ( ProModel
Corporation, 2005). All the pedestrians in the model mo ve on the path network from
one end ( Location A) of the walkway to the other end ( Location B) of the walkway.
Platoon: " A group of vehicles or pedestrians tra veling together as a group"
( T R B, 2000a, p. 5 - 12). These "groups" can be voluntary or in voluntarily established.
Sometimes factors like signal control or geometrics will cause platooning.
Processing: " Processing defines the routing of entities through the system and
the operations that take place at each location they enter" ( ProModel Corporation,
2005). Processing contains the HCM methodology algorithms .
Ser vice flow rates: " The ser vice flow rate is the maximum hourly rate at which
persons or vehicles reasonably can be expected to tra verse a point of uni form segment
of a lane or roadway during a gi ven period under pre vailing roadway, traffic, and
control conditions while maintaining a designated le vel of ser vice. The ser vice flow
rates generally are based on a 15 -min period" ( T R B, 2000a, p. 2 -3).
Shy distance: The distance a pedestrian maintains between him/herself and an
obstruction in the walkway ( T R B, 2000a).
Pedestrians: Indi viduals that are walking or jogging, not including bicyclists,
indi viduals in wheel chairs, skateboarders, or indi viduals on scooters.
5
C HA P T E R II
DES C RIP T ION OF R ES E A R C H
Research Validity
Best and Kahn ( 1993) define reliability and validity as "the degree of
consistency that the instrument or procedure demonstrates: whate ver it is measuring, it
does so consistently. Validity is that quality of a data-gathering instrument or
procedure that enables it to measure what it is supposed to measure" ( Best & Kahn p.
208). The methods chosen f or this research adhere to this definition of research
validity.
Methodology
The HCM is a product of the T R B (2000a). The Washington State Department
of Transportation uses the HCM f or all its traffic planning and roadway designs ( R.
Holmstrom, personal communication, April 18, 2007). The HCM model was chosen
because it contains methodologies and procedures f or determining capacities and LOS
for pedestrian traffic flows, as well as traffic flows along freeways, highways,
signalized and unsignalized intersections.
Establishing the LOS required obtaining field data f or two parameters: the
peak 15-min of pedestrian use and the pedestrian rate of tra vel. The peak 15-min
parameter is the easiest to apply. The rate of tra vel can augment the peak 15-min
parameter. Either parameter can be used to calculate the LOS f or a walkway segment.
Videography was employed to obtain data about pedestrian use at three
locations on the C WU main campus. All three locations were located along Walnut
6
Mall, the main campus pedestrian thoroughfare. Vehicle access to Walnut Mall was
restricted to special permits, so the lack of vehicles allowed on the mall was another
reason for using Walnut Mall to observe pedestrians. HCM pedestrian walkway
calculation methodologies were applied after completing the videography and
gathering the pedestrian data ( T R B, 2000a).
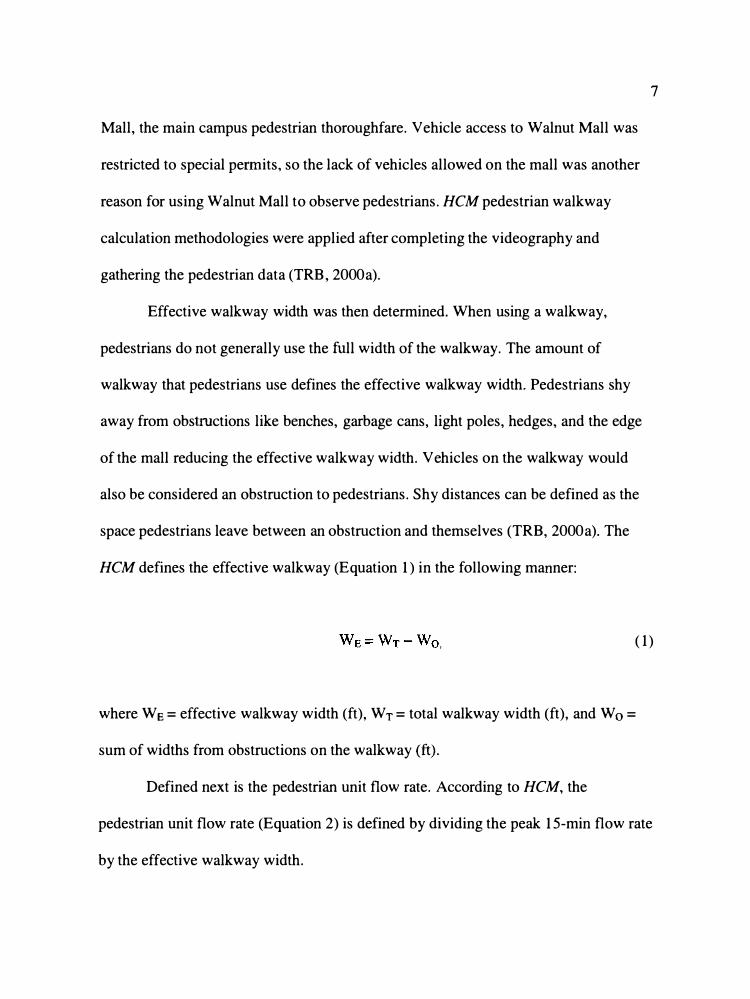
E ffective walkway width was then determined. When using a walkway,
pedestrians do not generally use the full width of the walkway. The amount of
walkway that pedestrians use defines the e ffective walkway width. Pedestrians shy
away from obstructions like benches, garbage cans, light poles, hedges, and the edge
of the mall reducing the e ffective walkway width. Vehicles on the walkway would
also be considered an obstruction to pedestrians. Shy distances can be defined as the
space pedestrians leave between an obstruction and themselves ( T R B, 2000a). The
HCM defines the e ffective walkway ( Equation 1) in the following manner:
7
( 1)
where WE = e ffective walkway width (ft), WT = total walkway width (ft), and W0 =
sum of widths from obstructions on the walkway (ft).
Defined next is the pedestrian unit flow rate. According to HCM, the
pedestrian unit flow rate ( Equation 2) is defined by dividing the peak 15-min flow rate
by the e ffective walkway width.
8
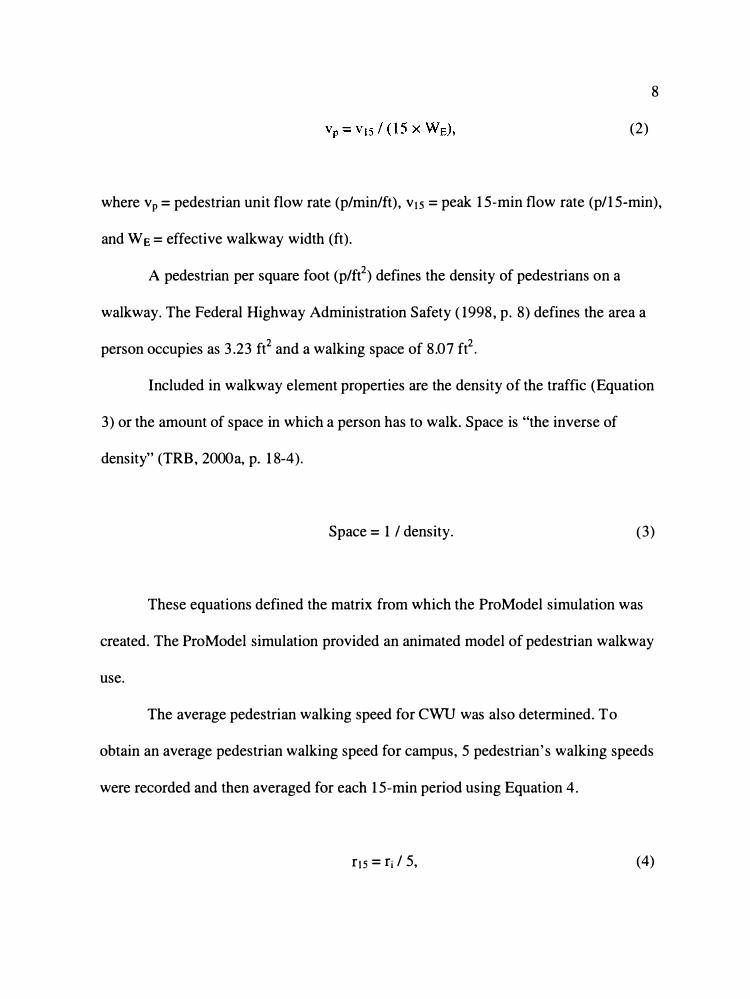
(2)
where vp =pedestrian unit flow rate (p/min/ft), v15 =peak 15-min flow rate (p/ 15-min),
and WE = e ffective walkway width (ft).
A pedestrian per square foot (p/ft2) defines the density of pedestrians on a
walkway. The Federal Highway Administration Safety ( 1998, p. 8) defines the area a
person occupies as 3.23 ft2 and a walking space of 8.07 ft2.
Included in walkway element properties are the density of the traffic ( Equation
3) or the amount of space in which a person has to walk . Space is "the inverse of
density" ( T R B, 2000a, p. 18- 4).
Space = 11 density. (3)
These equations defined the matrix from which the ProModel simulation was
created. The ProModel simulation provided an animated model of pedestrian walkway
use.
The average pedestrian walking speed for CWU was also determined. To
obtain an average pedestrian walking speed for campus, 5 pedestrian's walking speeds
were recorded and then averaged for each 15-min period using Equation 4.
r1s = ri / 5, ( 4)
where ri =individual pedestrian rate (ft/s) and r15 =average rate for 15-min period
(ft/s). All 15-min periods were then averaged. Equation 5 established the average rate
of pedestrians on the C W U campus.
9
r = Sum of all r15 I Total number of r15, ( 5)
where r15 =average rate for 15-min period (ft/s) and r =average pedestrian rate for
C W U campus (ft/s).
Research Procedure
The initial study phase consisted of videography of pedestrians using
walkways and intersections on C W U's main campus in Ellensburg. Prior to the
commencement of videography, a human subjects' review application was completed,
and authorization was given by the C W U Human Subjects Review Committee to
proceed. While the pedestrians were recorded, the image was slightly out of f ocus to
preserve the anonymity of the pedestrians.
A report of classroom use demonstrates that 79 to 93, of a total 1 14,
classrooms are in use for each of the 9:00, 10:00, and 1 1 :00 a.m. hours ( Ryder, 2003 ).
No other hours of the day match these classroom usage numbers. Videography was
conducted on Monday through Thursday mornings from 8:30 to 1 1:30 at each location
to observe the pe ak pedestrian traffic flows.
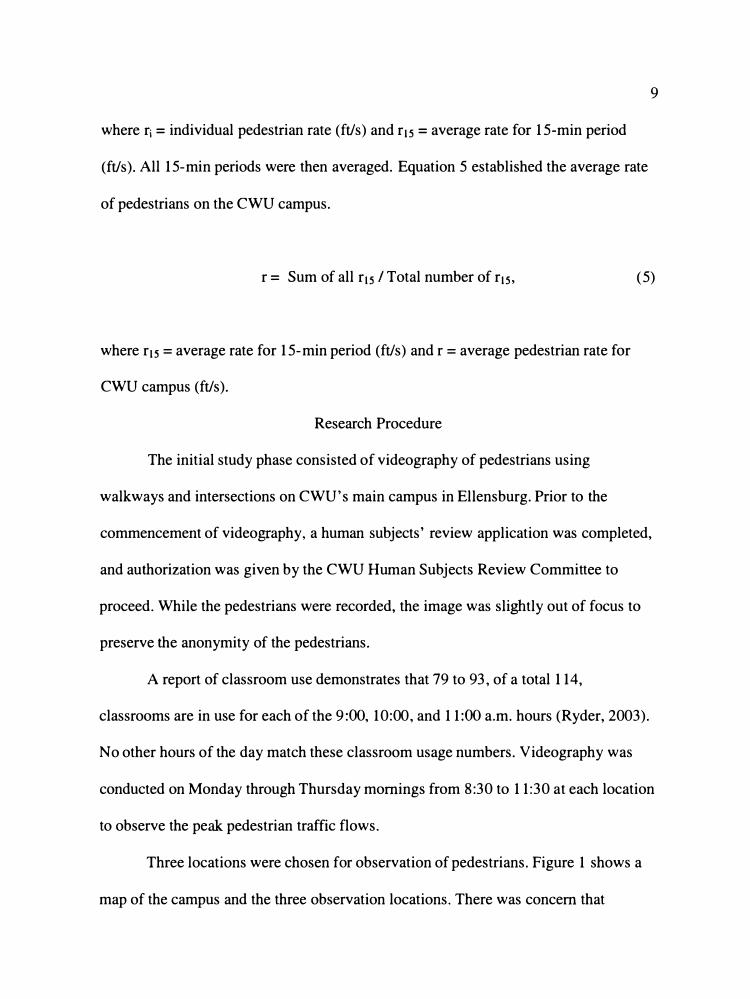
Three locations were chosen f or observation of pedestrians. Figure 1 shows a
map of the campus and the three observation locations. There was concern that
10
Figure 1. Map of Central Washington University campus pedestrian observation locations. Arrows indicate camera line of sight. Shading indicates observation segment.
pedestrians would alter their behavior if they knew they were being observed.
Observation was then conducted from a vantage point that was least likely to alter
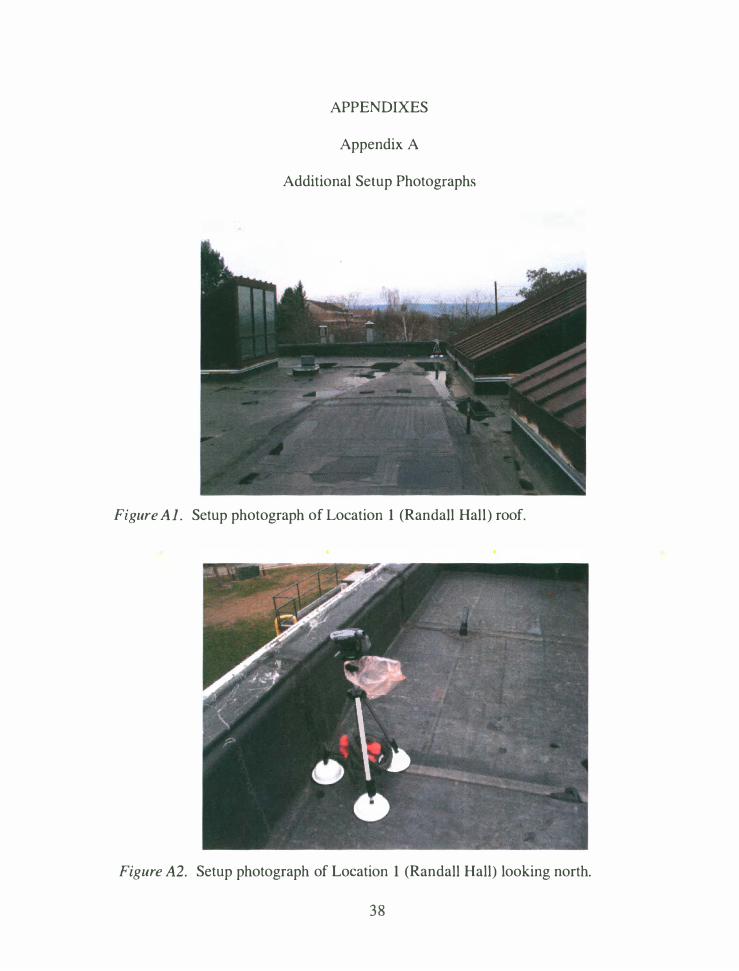
pedestrian behavior. Location 1 was at the north end of the Walnut Mall, and
pedestrians were observed from the Randall Hall roof. There are two major
intersections near the middle of Walnut Mall. Location 2 was at the Student Union and
Recreation Center (SURC), the first of the two major intersections. This segment of
Walnut Mall was observed from the second floor of the SURC. Location 3 was from
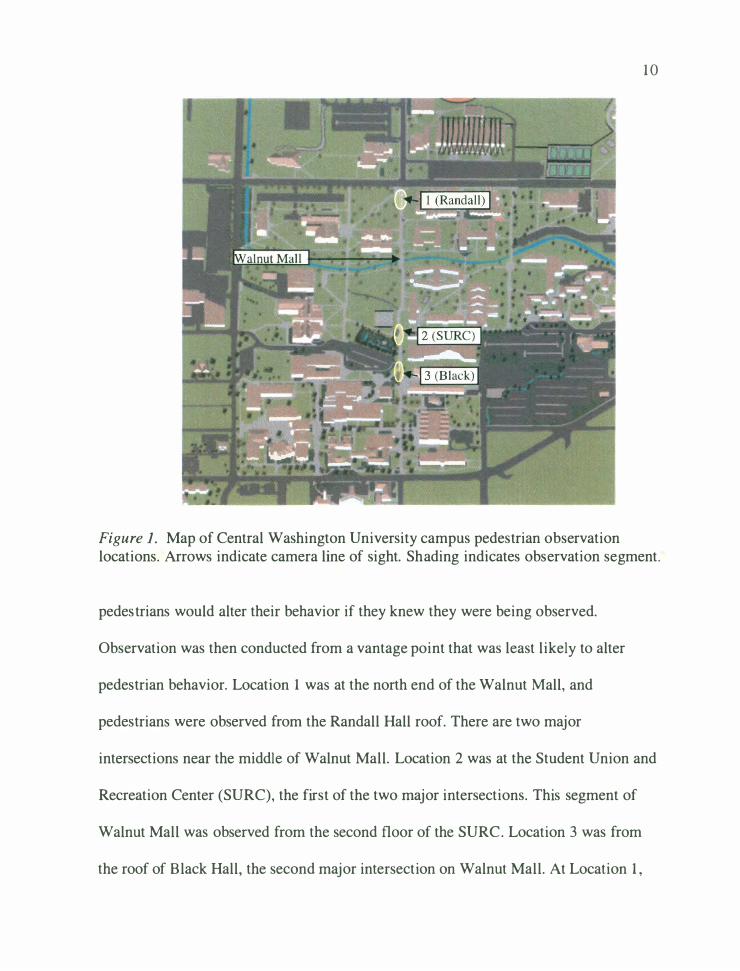
the roof of Black Hall, the second major intersection on Walnut Mall. At Location 1,
the roof of Randall Hall, the video camera was mounted on a tripod located on the
west end of the building looking west onto the Walnut Mall (see Figure 2). The
camera was approximately 90 ft to the east of Walnut Mall and approximately 30 ft
above the mall.
Figure 2. Camera view from Randall Hall roof to Walnut Mall.
11
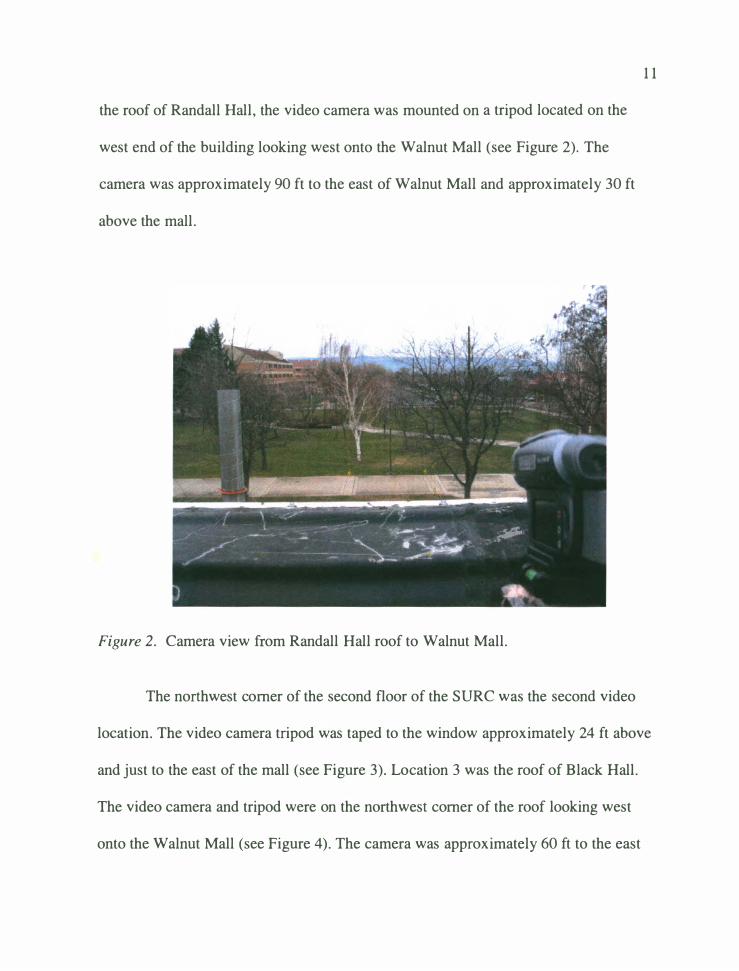
The northwest co mer of the second floor of the S UR C was the second video
location. The video camera tripod was taped to the window approximately 24 ft above
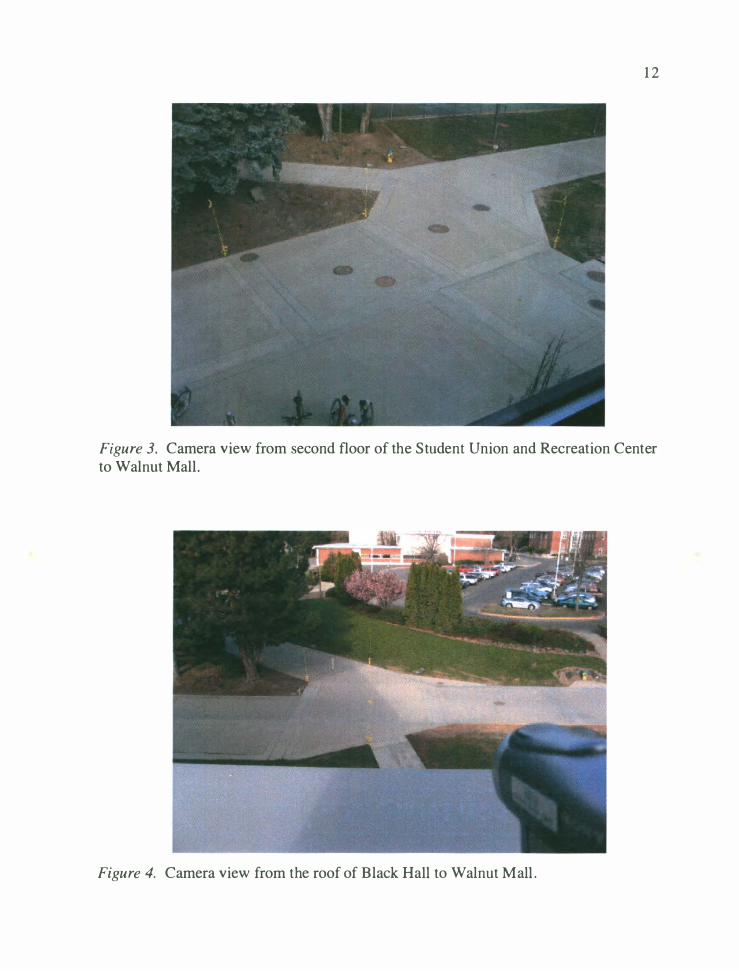
and just to the east of the mall (see Figure 3). Location 3 was the roof of Black Hall.
The video camera and tripod were on the northwest co mer of the roof looking west
onto the Walnut Mall (see Figure 4). The camera was approximately 60 ft to the east
12
Figure 3. Camera view from seco nd floor of t he St ude nt Unio n a nd Rec reatio n Ce nter to Wal nut Mall.
Figure 4. Camera view from t he roof of Black Ha ll to Wal nut Ma ll.
of Walnut Mall and approximately 30 ft above the mall. See Appendix A for
additional photographs of each observation location's setup.
1 3
The count line was created b y placing a small stake in the ground on either side
of the walkway. The stake had a flag attached to make the stake more visible in the
video. Each pedestrian that crossed the predetermined walkway line was counted. All
individuals were counted who passed within a two-person width (6 ft) of the flag and
were headed in the direction of travel being observed. The pedestrians who passed
within 6 ft of the flag were pedestrians who shortcut the counting flag and then
rejoined the mall. An additional stake 20 ft from the count l ine was used to establish
pedestrian flow rate at Locations 1 and 2 (see Figures 5 and 6). The pedestrian flow
rate flag was not used at Location 3 (see Figure 7), for there was enough data from the
previous two locations to establish the average walking pace of a pedestrian on the
CWU campus.
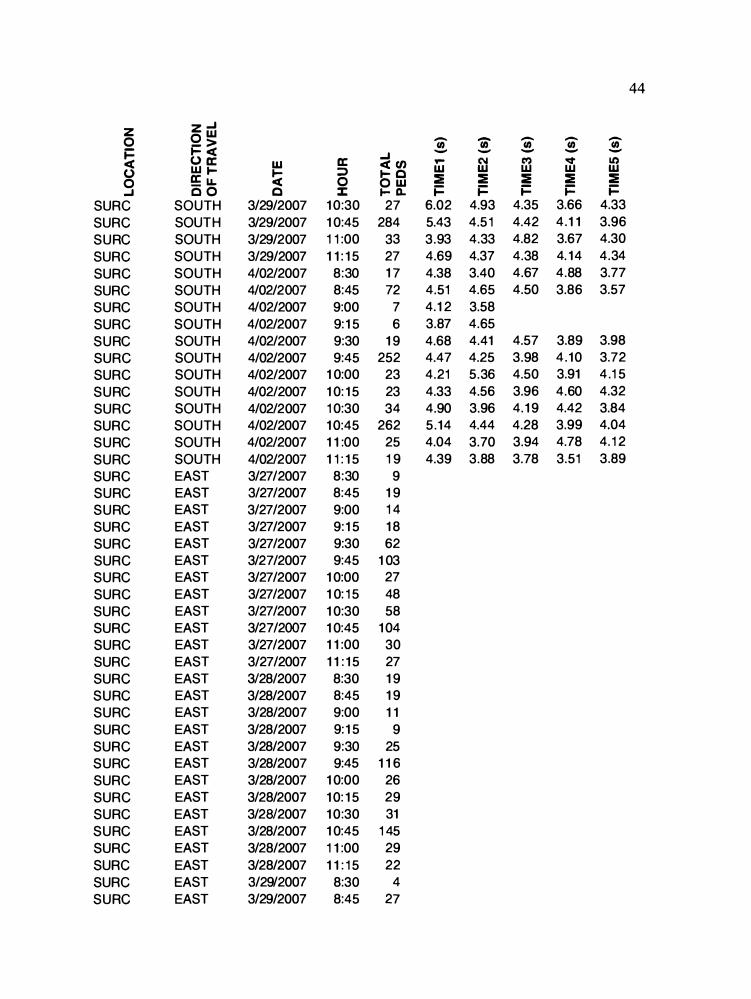
The pedestrian count was recorded to an Excel spreadsheet in 1 5-min intervals
per day per direction (see Appendix B). This means that the total number of
pedestrians that broke the vertical plane created by the stakes was recorded for each
1 5-min interval. Each hour was broken into four 15-min periods starting at the top of
the hour and referred to as Periods 1 -4. This distribution of 1 5-min periods was
chosen to best represent the walkway use patterns as classes all begin at the top of the
hour and are released at 50-min past the hour. During videography, at each 1 5-min
interval, the lens was obscured for 1 s and the time and date were stated. This was
done to aid the researcher during playback. The same three read-write compact discs
+ + + LOCATION 1 -r + +
+ (WALNUT MALL & RANDALL) + + + + �+ + + +
r+I - I - {+....,. I+ + + + + + / ' � +
+ + � +
+ +
+ + + + + + + + + + + + /
t :+ + + + + + + + +
,/ + + + + + + + + + + + { + + + + + + + + +
± + + +, + + + + + + + + + + + + + + + + + + + + + + + + +
t++
20FT +- + + + + + + + + +
+ I f + + + + + + + + + + + + + + + + + + + + + + + + + + + + + + + + + + +
t++ + + + +_ + + + + + + + + + +
+ + + + + + + + + + + + + + + + + + + + + + + + +
+ + + + + + + + + + + + + + L..+1
+ + + + + + + + + + + + - I - +! � I + + + + + + +
+ + + • FLAG/TREE + + + + + + / + + + � NONWALK.ING SURFACE + + + + + + +
+ + + � BUILDING + + + + + +
+ + + - COUNTLINE + + + + + + +
+ + + • CAMERA LOCATION + + + + + +
+ + + + ..... + + + + + + + - CAMERA VIEW + + + + + +
Figure 5. Plan view of Location 1 (Walnut Mall and Randall Hall). ...... .+:>.
+
1-1
NORTH/ SOUTII
\ +
. + +
+ l _L�o_c _
A_T_1o_N_2 _____ _
� _ (WALNUT MALL & SURC)
+ + +
+ + +
+ + +
+ + + .FLAG/l'REB
NONW ALK.ING SURFACE rL2'J BUILDING -- COUNT LINE .. CAMERA LOCATION
- CAMERA VIEW + + + � +
+ +
'"' + + + �/-r-
�....-----,
�--,-�-.-
�..----r
/ /
+ + + + +
+ + + + + + + +
+ + + +
/
+
+ +
+
I + + +
+ 20FT
"" \ EAST/ � WEST +
+ + + + + + +
+ +
+ +
+•
-
i a t - -f
+ + + + -t- -t-
+ + + + + + +
+ + + +
+ + +
9 1
+ + + + + + +
+ + + + + + + +
+ + + + + + + + + + + . + + + + + + + / + + + + + + .
+ + +
Figure 6. P lan view of Location 2 ( Wa lnut Ma ll and Student Union and Recreation Center [S UR C]).
15
�--------------�- -,--------�
+ +
+
+
+
+
+
+
-f + +
+ + +
+ + +
+ +
+ + +
+ + + ......iim I
+ +
+ +
+ L * + + � k k k k
: + j ��N�� &,Bl,��) + + + + + + + + + +
+ + + • FLAG/TR.EE + + +
+ + + NONWALKING SURFACE + + + BUILDING
+ + + - COUNTLINE + + + .. CAMERA LOCATION
+ + + - CAMERA VIEW + + +
+
+
+
+
..L, + + +
+
+
+
+
I+ + + + + + +
!+ + + + + + +
+ + + + + + +
+ + + + + + +
+ + + + + + +
+ + + + + + + +
+ + + + + + + + + + + + -lr , + + + + + + + + +
+ + + + + + + + + + + + + + + + + + + +
/
+ + f + + + + + + + I+ + +
+ + + + + +
+ + + +
+ + + + + + + + +
NORTH/
SOUTH
+ + + + + + + + + +
+ + + + + + -1-1
+ + + + +
+ + + + + +
+ + +
+ + + + +
+ + +
Figure 7. Plan view of Location 3 (Walnut Mall and Black Hall).
1 7
were used each day of videography and then copied to a hard disk. S tating the time
and date ensured that there was no confusion about the date and time being observed if
the file were accidentally copied to the incorrect folder on the computer hard drive.
Obscuring the camera lens for 1 s allowed the researcher to play the video at four and
eight times the normal speed, and to know when the 15-min period had completed.
Increasing the playback speed of the video reduced the time to complete the pedestrian
counts . During peak pedestrian traffic time, the video was reduced to normal speed.
After completing each 3-hr video session, the video was played back to count
each of the pedestrians as they broke the plane of the line created by the stakes. With
an Excel spreadsheet open while playing back the video, the researcher can press the
"a" key every time a pedestrian breaks the plane of the flag line. This created a string
of characters in the spreadsheet cell. The Excel function LEN (returns the number of
characters in a text string) was used to return the number of characters in the string to
give the pedestrian count. After all the data was entered, the peak 1 5-min pedestrian
numbers were determined.
The next parameter to establish was the average pedestrian walking speed. The
HCM states, "If 0 to 20 percent of the pedestrians are elderly, a walking speed of 4 ft/s
is recommended for computations for walkways" (TRB, 2000a, p. 1 8-1 ) . While there
was a wide range of pedestrian ages on campus, the average pedestrian rate for CWU
was established for persons from the ages of 1 8 to 25 years. The average age of the
students on the CWU campus was 22.7 years in 2004, 22.6 years in 2005, and 22.3
years in 2006 (Cadman, 2007a).
18
As described previously, stakes with flags were installed adjacent to the
walkway 20 ft apart (Figures 5 and 6). Twenty feet was a reasonable distance to fit in
the camera viewfinder and provide enough distance to time a pedestrian moving from
one flag to the other. At 4 ft/s, 10 ft seemed too short a distance to attempt to time
accurately on the video. A 50 ft distance would make it difficult to remain fixed on the
same subject in the video among all the other pedestrians. The walking speed of 4.5%
of all the observed pedestrians was taken. This equated to 905 pedestrians of a total
20,352. The location of the flags for determining the pedestrian travel rate dictated that
only pedestrians traveling north and south were timed. A maximum of 10 individuals'
walking speed was recorded during a 15-min period. At Location 1, on occasion, there
were not 5 pedestrians traveling in the direction being observed; thus the total of 10
individuals per 15-min period could not be reached. Five pedestrians were arbitrarily
selected throughout the 15-min period and their speed recorded. The 5 pedestrians'
travel speeds would then be averaged. Five were selected because two would not be
enough to give an accurate average and 10 were too many individuals to keep track of
because the video software being used is not sophisticated enough to put tags on
individuals for tracking. Another reason for choosing 5 pedestrians was to help
mitigate the human error in recording the time between flags. As the video was played
back, a stopwatch was used to determine the number of seconds it took the pedestrian
to travel from flag to flag. The human reaction time and any parallax in the video are
sources of error. Parallax is when an object appears to change positions when the
observer changes his/her position in relation to the object.
1 9
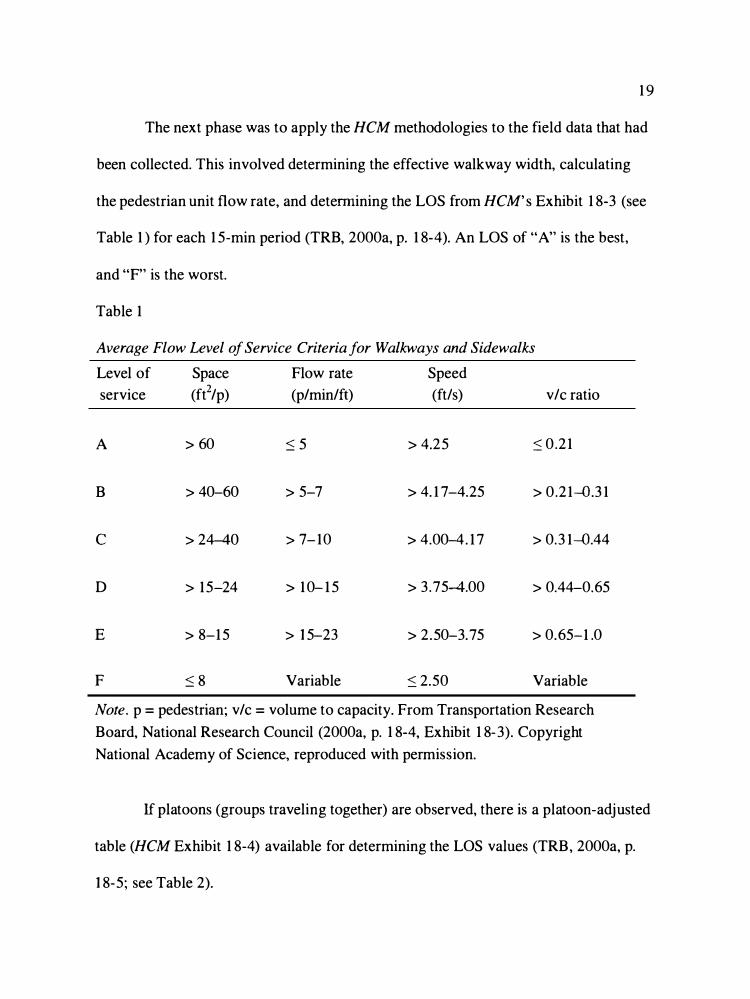
The next phase was to apply the HCM methodologies to the field data that had
been collected. This involved determining the effective walkway width, calculating
the pedestrian unit flow rate, and determining the LOS from HCM's Exhibit 1 8-3 (see
Table 1 ) for each 1 5-min period (TRB, 2000a, p. 1 8-4). An LOS of "A" is the best,
and "F" is the worst.
Table 1
Average Flow Level of Service Criteria for Walkways and Sidewalks
Level of Space Flow rate Speed
service (ft2/p) (p/min/ft) (ft/s) v/c ratio
A > 60 s5 > 4.25 :::; 0.21
B > 40-60 > 5-7 > 4. 1 7-4.25 > 0.21 -0.3 1
c > 24-40 > 7-10 > 4.00-4. 1 7 > 0.3 1 -0.44
D > 15-24 > 1 0- 1 5 > 3 .75-4.00 > 0.44-0.65
E > 8-15 > 15-23 > 2.50-3.75 > 0.65-1 .0
F s8 Variable ::;2.50 Variable
Note. p =pedestrian; v/c =volume to capacity. From Transportation Research
Board, National Research Council (2000a, p. 1 8-4, Exhibit 1 8-3). Copyright
National Academy of Science, reproduced with permission.
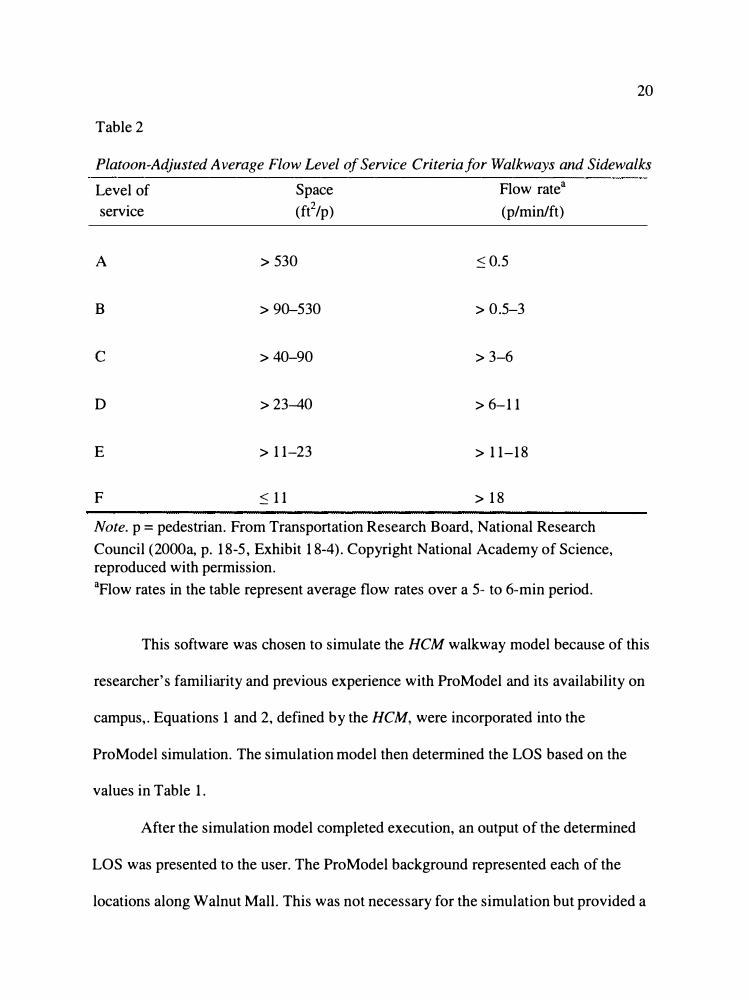
1f platoons (groups traveling together) are observed, there is a platoon-adjusted
table (HCM Exhibit 1 8-4) available for determining the LOS values (TRB, 2000a, p.
18-5; see Table 2).
20
Table 2
Platoon-Adjusted Average Flow Level of Service Criteria for Walkways and Sidewalks
Level of Space Flow ratea
service (ft2/p) (p/min/ft)
A > 530 :s 0. 5
B > 90 -530 > 0.5 -3
c > 40 -90 >3 -6
D >23 -40 > 6-11
E > 11-23 > 11-18
F :s 11 > 18
Note. p = pedestrian. From Transportation Research Board, National Research
Council (2000a, p. 18-5, Exhibit 18-4). Copyright National Academy of Science, reproduced with permission.
aFlow rates in the table represent average flow rates over a 5-to 6-min period.
This software was chosen to simulate the HCM walkway model because of this
researcher's familiarity and previous experience with ProModel and its availability on
campus,. Equations 1and 2, defined by the HCM, were incorporated into the
ProModel simulation. The simulation model then determined the LOS based on the
values in Table 1.
After the simulation model completed execution, an output of the determined
LOS was presented to the user. The ProModel background represented each of the
locations along Walnut Mall. This was not necessary for the simulation but provided a
2 1
visual frame of reference. Input parameters for peak 1 5-min pedestrian count, total
walkway width, and sum of shy distances were created to accept user input values for
HCM Equations 1 and 2.
CHAPTER III
LITERATURE REVIEW
Body of Knowledge
Many architectural design firms produce documentation on what comprises an
effective pedestrian walkway. Cities, states, and the federal government also study and
analyze pedestrian traffic flow. Several individual studies can also be found on
modeling behavior of pedestrians. Teknomo (2007) has created a Web site for the
study of pedestrian activity patterning, to be used in collaboration with other
researchers. There is a growing knowledge base in dynamic pedestrian modeling
(Asano, Sumalee, Kuwahara, & Tanaka, 2007). Companies, such as London's
Intelligent Space Partnership Ltd., specialize in software packages for predicting
pedestrian activity. The TRB (2000b) provides documentation and tools to aid in
selecting a software analytical tool.
The TRB's parent organization, the National Research Council, was formed in
1 9 1 6 by the National Academy of Science to advise the federal government and
proliferate the knowledge of the science and technology communities. The National
Research Council also supports the National Academy of Engineering, which was
formed in 1 964 as a parallel organization to the National Academy of Science. The
National Academy of Engineering is a collection of exceptional engineers autonomous
to the National Academy of Science but sharing in the responsibility of advising the
federal government. The National Academy of Science was established as :
22
a private, nonprofit, self-perpetuating society of distinguished scholars engaged in scientific and engineering research, dedicated to the furtherance of science and technology and to their use for the general welfare. Upon the authority of the charter granted to it by the Congress in 1 863, the Academy has a mandate that requires it to advise the federal government on scientific and technical matters . (TRB, 2000a, p. iii)
23
The TRB's (2000a) HCM "provides a collection of state-of-the-art techniques
for estimating the capacity and determining the level of service for transportation
facilities" (p. vii). The HCM was first published in 1 950. Since that time, the HCM has
been republished in 1 965, 1 985, and 2000. Each publication is developed and revised
through a rigorous review process overseen by the TRB .
ProModel Corporation was founded in 1 988 by Dr. Charles Harrell. It
specializes in software for simulating and analyzing processes (ProModel Corporation,
2007). The process can be a business process or a manufacturing process. As an
example, ProModel is used as a visual tool to aid companies in improving
manufacturing throughput and optimizing the manufacturing process. Companies can
run "what if' scenarios, design, and plan new production lines prior to spending any
money. ProModel software is used by 43 of the top Fortune 1 00 companies (ProModel
Corporation, 2007).
CHAPTER IV
MODEL ANALYSIS
Highway Capacity Manual 2000 Methodologies
Applying Equations 1 and 2 will produce the HCM LOS for each of the
walkway segments at each location. Equation 1 establishes the effective walkway
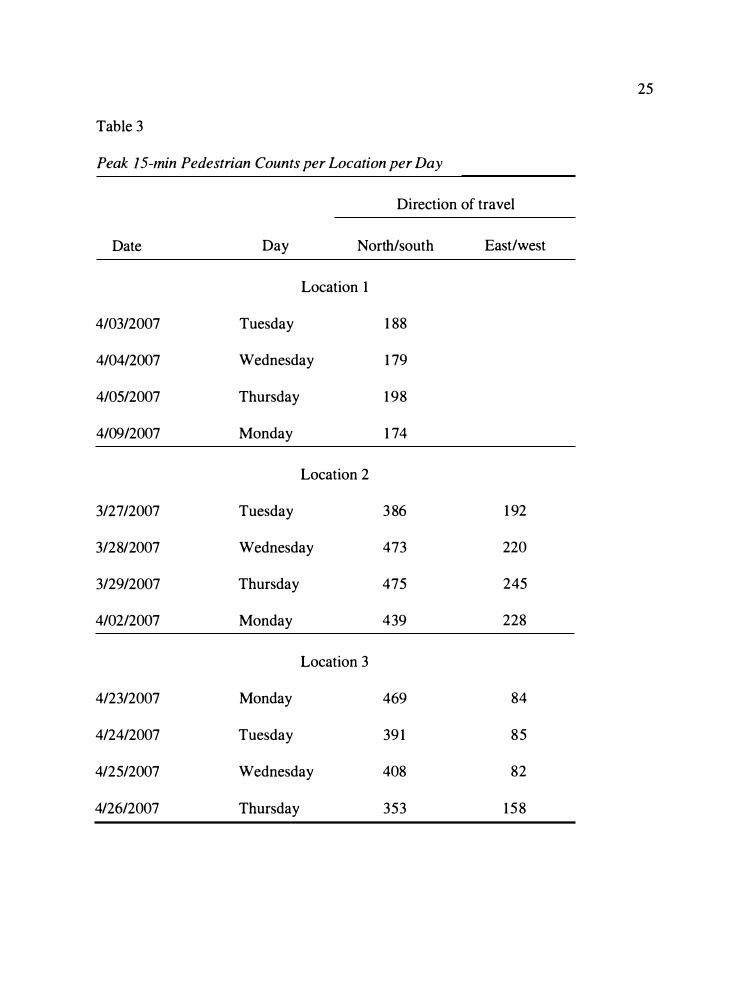
width, and Equation 2 calculates the flow rate. The peak 15-min value was selected
from the data collected at CWU (see Table 3). The mall segments that were observed
had a total walkway width of 20 ft. In the HCM, all walkway segments are assumed to
be uniform. There were no obstructions on or near the mall on the segments observed.
Movable obstructions, such as vehicles, were not considered at the time of this study.
The only shy distance was the edge of the mall for which a shy distance of 1 ft for
each side was used (TRB, 2000a). Equation 1 established the effective walkway width
at 18 ft, where 20 ft (1 ft+ 1 ft) = 18 ft. S ince the peak 15-min numbers for each
location are similar values for all 4 days, the maximum peak 15-min pedestrian count
was used (Table 3). Location 1 (Randall Hall) was a simple bidirectional simulation.
Locations 2 (SURC) and 3 (Black Hall) contained cross-flow and merging simulation
problems. The HCM specifies that pedestrian cross-flows be calculated in the same
manner as simple bidirectional traffic flow with the peak 15-min values totaled.
Equation 2 was used to calculate the pedestrian flow rate for each location. The result
for Location 1 was 198 p/15min I ( 1 5 x 18 ft) = 0.73 p/min/ft. The result for Location
2 was (475 + 245 p/15min) I (15 x 18 ft) = 2.67 p/minlft. The result for Location 3
was (469 + 84 p/15min) I (15 x 18 ft) = 2.05 p/minlft.
24
25
Table 3
Peak 15-min Pedestrian Counts per Location per Day
Direction of travel
Date Day North/south East/west
Location 1
4/03/2007 Tuesday 1 88
4/04/2007 Wednesday 1 79
4/05/2007 Thursday 1 98
4/09/2007 Monday 1 74
Location 2
3/2712007 Tuesday 3 86 1 92
3/2812007 Wednesday 473 220
3/29/2007 Thursday 475 245
4/02/2007 Monday 439 228
Location 3
4/23/2007 Monday 469 84
4/24/2007 Tuesday 391 85
412512007 Wednesday 408 82
4126/2007 Thursday 353 158
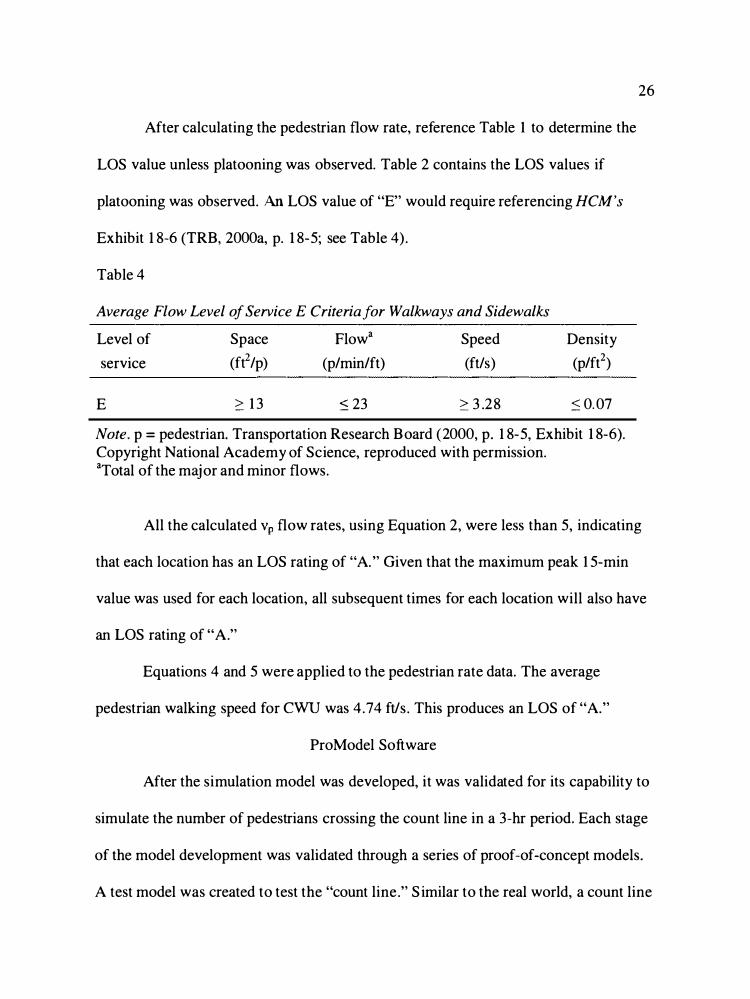
After calculating the pedestrian flow rate, reference Table 1 to determine the
LOS value unless platooning was observed. Table 2 contains the LOS values if
platooning was observed. An LOS value of "E" would require referencing HCM's
Exhibit 1 8-6 (TRB, 2000a, p. 1 8-5; see Table 4).
Table 4
Average Flow Level of Service E Criteria/or Walkways and Sidewalks
Level of Space Flowa Speed Density
service (ft2/p) (p/min/ft) (ft/s) (p/ft2)
E ?. 1 3 ::s 23 ?. 3 .28 ::s 0.07
Note. p =pedestrian. Transportation Research Board (2000, p. 1 8-5, Exhibit 1 8-6). Copyright National Academy of Science, reproduced with permission. aTotal of the major and minor flows.
26
All the calculated Vp flow rates, using Equation 2, were less than 5, indicating
that each location has an LOS rating of "A." Given that the maximum peak 1 5-min
value was used for each location, all subsequent times for each location will also have
an LOS rating of "A."
Equations 4 and 5 were applied to the pedestrian rate data. The average
pedestrian walking speed for CWU was 4. 74 ft/s. This produces an LOS of "A."
ProModel Software
After the simulation model was developed, it was validated for its capability to
simulate the number of pedestrians crossing the count line in a 3-hr period. Each stage
of the model development was validated through a series of proof-of-concept models.
A test model was created to test the "count line." S imilar to the real world, a count line
27
was created in the simulation model. Originally, the pedestrian count in the simulation
model was conducted at the count line. In the course of development, the pedestrian
count was made as the pedestrian enters the mall segment being tested. This negated
the need for a pedestrian rate.
A pedestrian counter was incorporated to confirm the correct numbers of
pedestrians were "moved" through the simulation model. Also, near the beginning of
the simulation development only one entity, or pedestrian, was used to arrive at both
locations. The locations (A and B) were at each end of the walkway segment to accept
arriving entities that would then travel to the opposite location. Through testing it was
determined that the pedestrian counts were incorrect. A second entity needed to be
added. To obtain the correct pedestrian counts, Entity A would arrive at Location A
and then travel to Location B . Conversely, Entity B would arrive at Location B and
then travel to Location A As each new proof-of-concept model was added, it was
tested and confirmed before moving on to the next step. The final simulation model
was produced through a compilation of the test models.
During the course of reviewing the videos, it was apparent that there was a
distribution of pedestrians over the course of 1 hr. At CWU, the peak pedestrian traffic
is from three-quarter past the hour until the top of the hour (Period 4 ). From 8:00 a.m.
until 9:00 a.m., the most pedestrians were observed between 8:45 a.m. and 9:00 a.m.
The same pattern was true from 9:00 a.m. until 1 0:00 a.m., and from 1 0:00 a.m. until
1 1 :00 a.m. The observation allowed for the acceptance of the peak 1 5-min pedestrian
28
count as an input to estimate the total amount of pedestrians that would cross the count
line in 1 hr.
To obtain the average pedestrian distribution, the pedestrian count for each
period ( 1 --4) was divided by the total pedestrian count for that hour. This was done for
each full hour of pedestrian observation. All the values for Period 1 on each day at
each location were then averaged to ascertain the Period 1 pedestrian distribution. This
averaging technique was then repeated for Periods 2--4. From the empirical data, the
average pedestrian count distribution for Period 1 was 8.2% of the hourly total, Period
2 was 6.2%, Period 3 was 14.2%, and Period 4 was 7 1 .3%. This distribution was then
incorporated into the s imulation model. The pedestrians who arrived to travel from
"A" to "B" in the simulation model were based on this distribution.
The s imulation model logic requires that the user input some values to enable
the software to simulate and calculate the LOS (see Appendix C). The peak 1 5-min
pedestrian count; the total walkway width; and the sum of shy distances, or walkway
obstructions, were entered by the user. For Location 2 (SURC) and Location 3 (Black
Hall), an additional peak 1 5-min parameter was added to the simulation model to
accommodate the cross flow conditions. To view the ProModel parameters, see
Appendixes D and E.
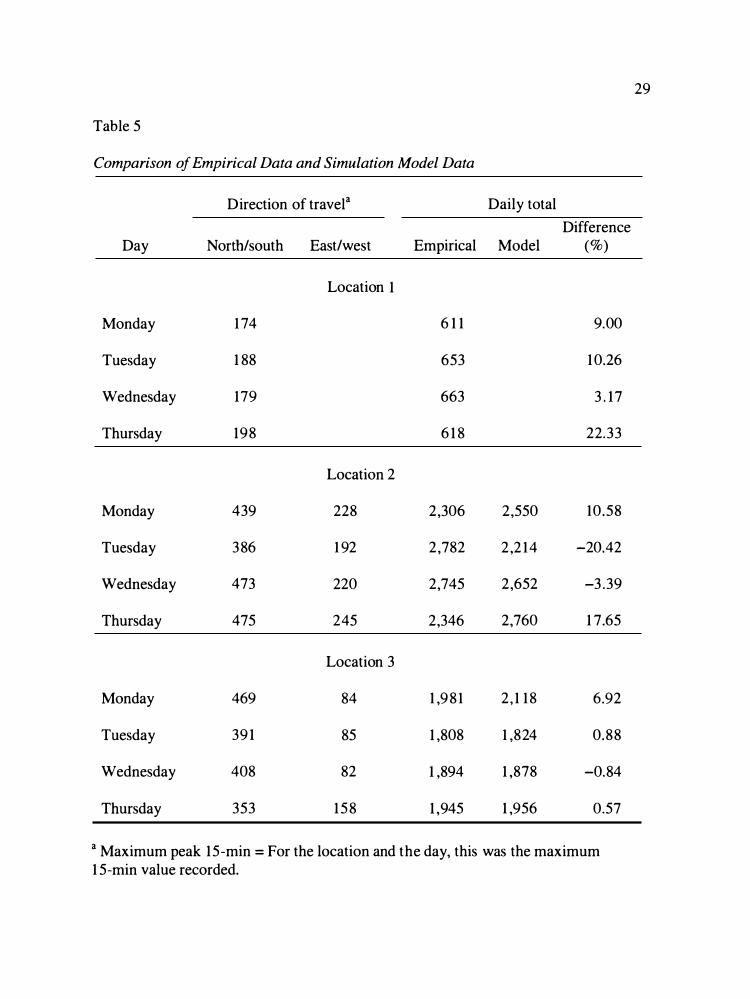
The ProModel simulation was run using the peak 1 5-min value from each
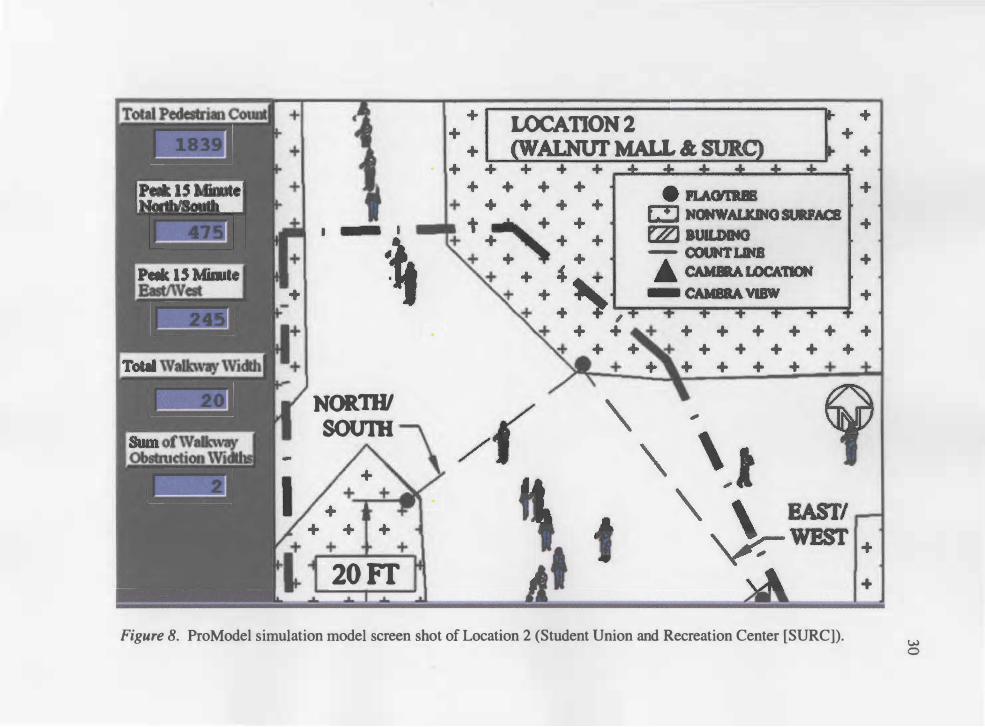
location for each day (see Table 5). For every peak 15-min value from Table 5 that
was used in the ProModel simulation, the LOS rating was "A" (see Figure 8). For
additional simulation model screen shoots, see Appendix F.
29
Table 5
Comparison of Empirical Data and Simulation Model Data
Direction of travela Daily total
Difference Day North/south East/west Empirical Model (%)
Location 1
Monday 1 74 6 1 1 9.00
Tuesday 1 88 653 1 0.26
Wednesday 179 663 3 . 17
Thursday 198 6 1 8 22.33
Location 2
Monday 439 228 2,306 2,550 10.58
Tuesday 386 1 92 2,782 2,214 -20.42
Wednesday 473 220 2,745 2,652 -3 .39
Thursday 475 245 2,346 2,760 1 7.65
Location 3
Monday 469 84 1 ,98 1 2, 1 18 6.92
Tuesday 39 1 85 1 ,808 1 ,824 0.88
Wednesday 408 82 1 ,894 1 ,878 -0.84
Thursday 353 158 1 ,945 1 ,956 0.57
a Maximum peak 15-min =For the location and the day, this was the maximum 1 5-min value recorded.
NORTH/
SOU1H
20Fr I
++
+ I LOCATION2 =
. (WALNUI' MALL ct SUR.9
,
+ + + + + + +
+ + +
Figure 8. ProModel simulation model screen shot of Location 2 (Student Union and Recreation Center [SURC]).
+
+
w 0

CHAPTER V
DISCUSSION AND CONCLUSIONS
Simulation
The correlation of empirical versus simulated data indicates as much as a 20%
error (see Figure 9 for a graph of the difference column shown in Table 5). However,
-� 0 -w 0 z w a: w u. !::!:: c
MODEL DATA COMPARISON TO EMPIRICAL DATA
25
20
15
10
5
O· -5
-10
-15
-20
-25
Monday Tuesday V\f ednesday
DAY
Thursday
Location 1 -Location 2 _.,_._Location 3
Figure 9. Percentage difference when comparing simulation model data to empirical data.
3 1
32
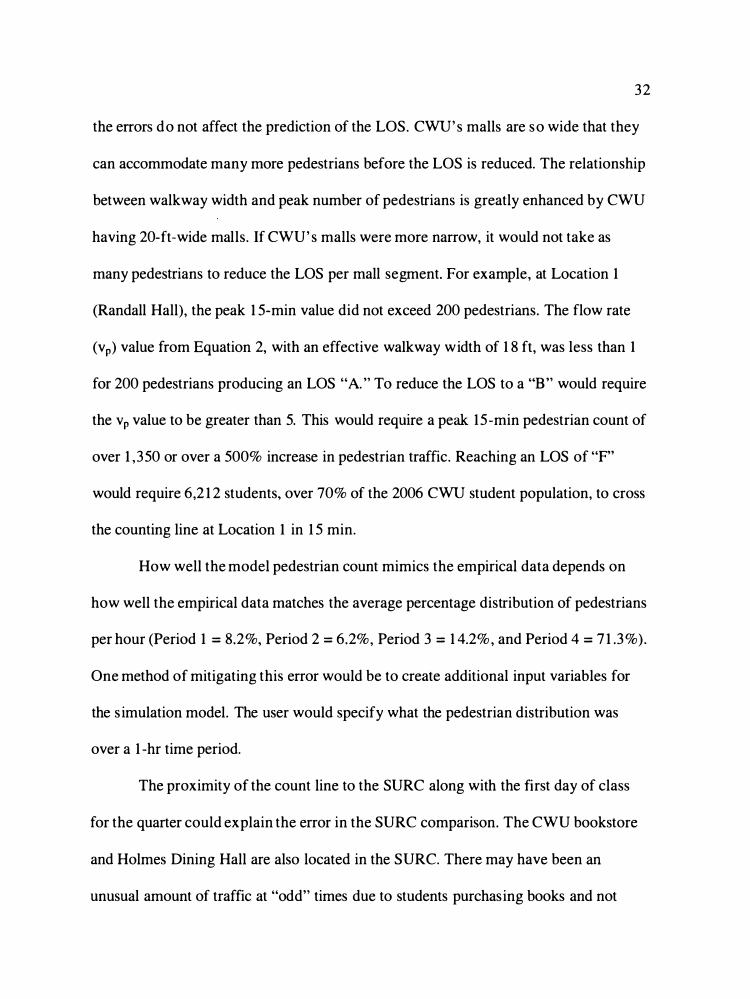
the errors do not affect the prediction of the LOS. CWU's malls are so wide that they
can accommodate many more pedestrians before the LOS is reduced. The relationship
between walkway width and peak number of pedestrians is greatly enhanced by CWU
having 20-ft-wide malls. If CWU's malls were more narrow, it would not take as
many pedestrians to reduce the LOS per mall segment. For example, at Location 1
(Randall Hall), the peak 1 5-min value did not exceed 200 pedestrians. The flow rate
(vp) value from Equation 2, with an effective walkway width of 1 8 ft, was less than 1
for 200 pedestrians producing an LOS "A. " To reduce the LOS to a "B" would require
the Vp value to be greater than 5. This would require a peak 15-min pedestrian count of
over 1 ,350 or over a 500% increase in pedestrian traffic. Reaching an LOS of "F"
would require 6,2 1 2 students, over 70% of the 2006 CWU student population, to cross
the counting line at Location 1 in 1 5 min.
How well the model pedestrian count mimics the empirical data depends on
how well the empirical data matches the average percentage distribution of pedestrians
per hour (Period 1 = 8.2%, Period 2 = 6.2%, Period 3 = 1 4.2%, and Period 4 = 7 1 .3%).
One method of mitigating this error would be to create additional input variables for
the s imulation model. The user would specify what the pedestrian distribution was
over a 1 -hr time period.
The proximity of the count line to the SURC along with the first day of class
for the quarter could explain the error in the SURC comparison. The CWU bookstore
and Holmes Dining Hall are also located in the SURC. There may have been an
unusual amount of traffic at "odd" times due to students purchasing books and not
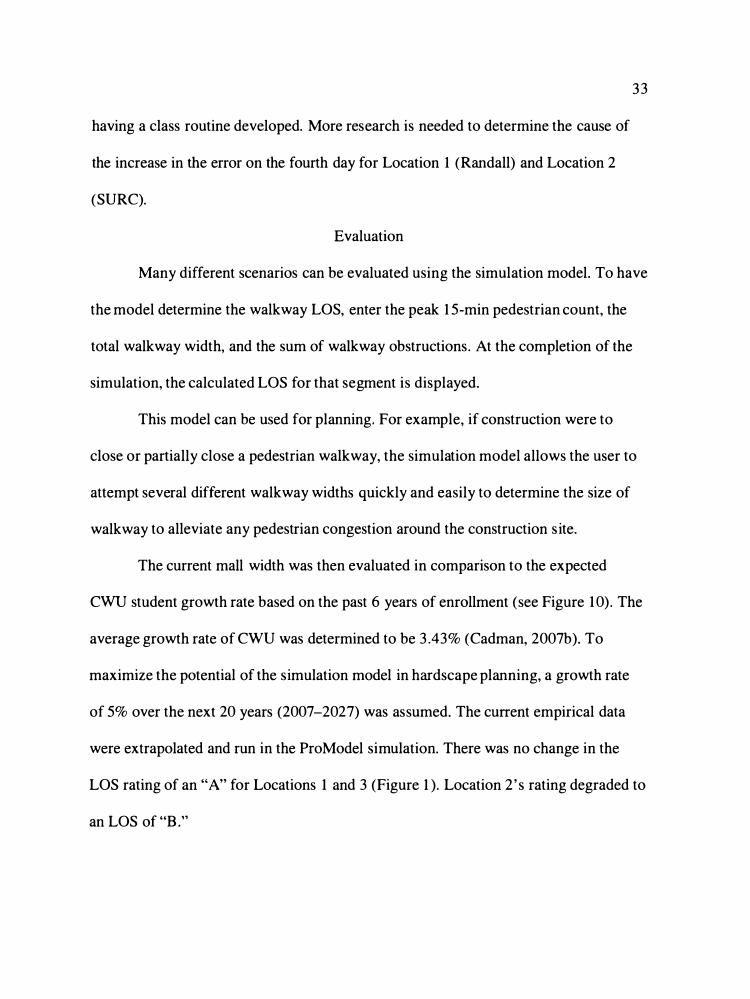
having a class routine developed. More research is needed to determine the cause of
the increase in the error on the fourth day for Location 1 (Randall) and Location 2
(SURC).
Evaluation
33
Many different scenarios can be evaluated using the simulation model. To have
the model determine the walkway LOS, enter the peak 1 5-min pedestrian count, the
total walkway width, and the sum of walkway obstructions. At the completion of the
simulation, the calculated LOS for that segment is displayed.
This model can be used for planning. For example, if construction were to
close or partially close a pedestrian walkway, the simulation model allows the user to
attempt several different walkway widths quickly and easily to determine the size of
walkway to alleviate any pedestrian congestion around the construction site.
The current mall width was then evaluated in comparison to the expected
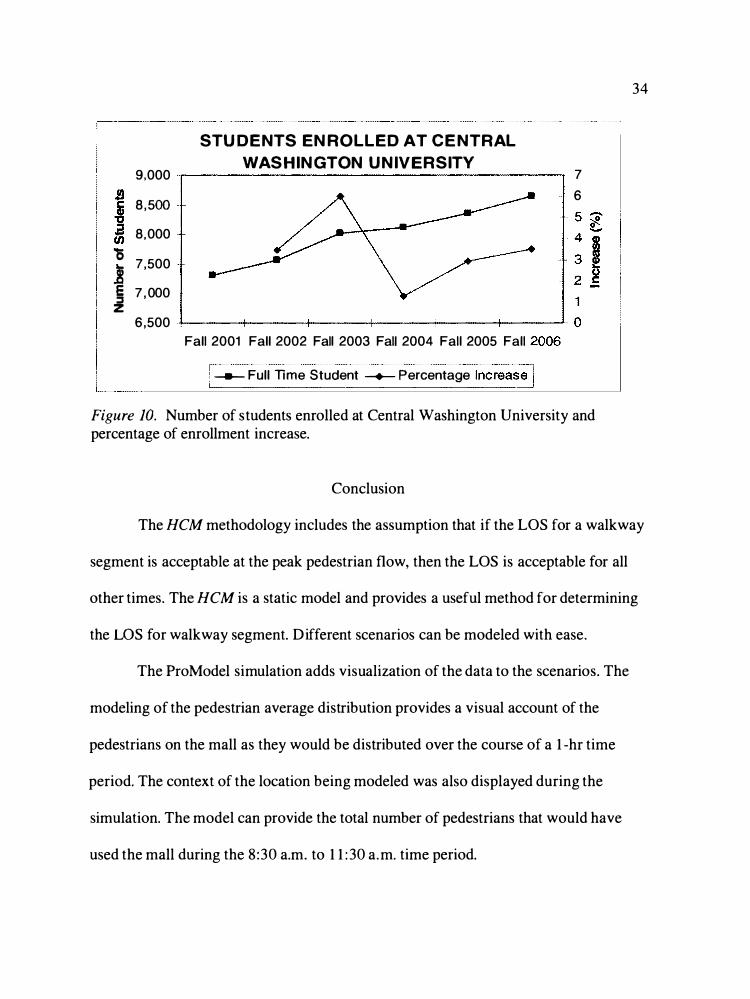
CWU student growth rate based on the past 6 years of enrollment (see Figure 1 0). The
average growth rate of CWU was determined to be 3 .43% (Cadman, 2007b). To
maximize the potential of the simulation model in hardscape planning, a growth rate
of 5% over the next 20 years (2007-2027) was assumed. The current empirical data
were extrapolated and run in the ProModel simulation. There was no change in the
LOS rating of an "A" for Locations 1 and 3 (Figure 1 ). Location 2's rating degraded to
an LOS of "B ."
9,000
8,500
8,000
15 7,500 ""'
! E 7 , 000 :I
z 6,500
STU DENTS EN ROLLED AT CE NTRAL WAS H IN GTON U N IVERSITY ���������������������-y- 7
6
Fall 2001 Fall 2002 Fall 2003 Fall 2004 Fall 2005 Fall
i--··-··-·--··-··-·-··-··-;:l I ---- Full lime Student -+- Percentage lncreas�
Figure JO. Number of students enrolled at Central Washington University and percentage of enrollment increase.
Conclusion
34
The HCM methodology includes the assumption that if the LOS for a walkway
segment is acceptable at the peak pedestrian flow, then the LOS is acceptable for all
other times. The HCM is a static model and provides a useful method for determining
the LOS for walkway segment. Different scenarios can be modeled with ease.
The ProModel simulation adds visualization of the data to the scenarios. The
modeling of the pedestrian average distribution provides a visual account of the
pedestrians on the mall as they would be distributed over the course of a 1 -hr time
period. The context of the location being modeled was also displayed during the
simulation. The model can provide the total number of pedestrians that would have
used the mall during the 8:30 a.m. to 1 1 : 30 a.m. time period.
35
The ProModel simulation does allow us to simulate and analyze pedestrian
traffic flow despite some error. The model enables us to evaluate a range of situations
quickly and easily by changing the input parameters . In comparing HCM to the
ProModel simulation, the HCM provides the necessary tools and information for
design purposes; however for a presentation or to provide a visual model of pedestrian
use, the ProModel simulation model has more impact on the viewers.
To better mitigate the errors in the simulation model, more data would need to
be collected and analyzed. A more generic simulation model could be developed to
accommodate a broader range of locations and scenarios, or consideration could be
given to a more enhanced model s imulating dynamic loading scenarios.
REFERENCES
Anderson, D. C. (2002). Effects of instructional material and learning style preference on test performance of undergraduate nursing students. Abstract retrieved May 22, 2007, from PsycINFO database.
Asano, M., Sumalee, A, Kuwahara, M., & Tanaka, S. (2007). Dynamic celltransmission-based pedestrian model with multidirectional flows and strategic route choices. Paper presented at the 2007 Annual Meeting of the Transportation Research Board (Paper No. 07-1 262). Abstract retrieved March 1 2, 2007, from ttp://pubsindex.trb.org/document/view/default.asp?lbid=801 572
Best, J. W., & Kahn, J. V. ( 1 993). Research in education (7th ed.). Boston: Allyn and Bacon.
Cadman, K. (2007a). Age distribution for fall quarters at the Central Washington University Ellensburg campus. Unpublished report, Institutional Research Central Washington University, Ellensburg.
Cadman, K. (2007b ). Ellensburg campus state funded headcount and full-time equivalent enrollments. Unpublished report, Institutional Research Central Washington University, Ellensburg.
Federal Highway Administration Safety. (1 998). Capacity analysis of pedestrian and bicycle facilities (p. 8). Retrieved March 6, 2007, from http://safety.fhwa.dot .gov/tools/docs/chap 1 3.pdf
Holmstrom, R. (2007, April 1 8) . Personal communication.
ProModel Corporation. (2005, December). ProModel Professional (Version 7.0.0. 1 8 1 ) [Computer software] . Orem, UT: Author.
ProModel Corporation. (2007). About us. Retrieved May 8, 2007, from http://www . promodel.com/aboutus/
Ryder, D. (2003). Academic space utilization study. Ellensburg: Central Washington University, Academic Facilities Planning Office.
Teknomo, K. (2007). Home page. Retrieved March 1 1 , 2007, from http://people .revoledu.comlkardi/index.html
Transportation Research Board, National Research Council [TRBJ (2000a). Highway Capacity Manual 2000. Washington, DC: National Academy of Science.
36

Transportation Research Board, National Research Council [TRB] (2000b). Traffic analysis software tools (Circular No. E-C01 4). Retrieved March 1 2, 2007, from http://onlinepubs.trb.org/onlinepubs/circulars/ecO 14. pdf
37
APPENDIXES
Appendix A
Additional Setup Photographs
Figure A l . Setup photograph of Location 1 (Randall Hall) roof.
Figure A2. Setup photograph of Location 1 (Randall Hall) looking north.
38
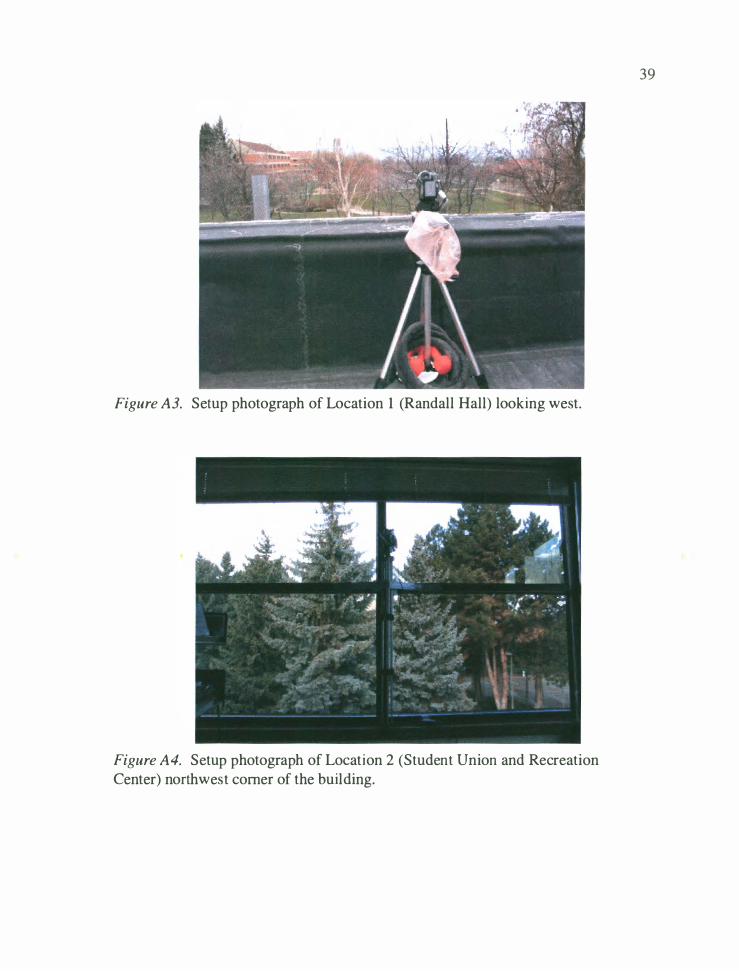
Figure A3. S etu p photogra ph o f Location 1 (Randall Hall) loo king w est.
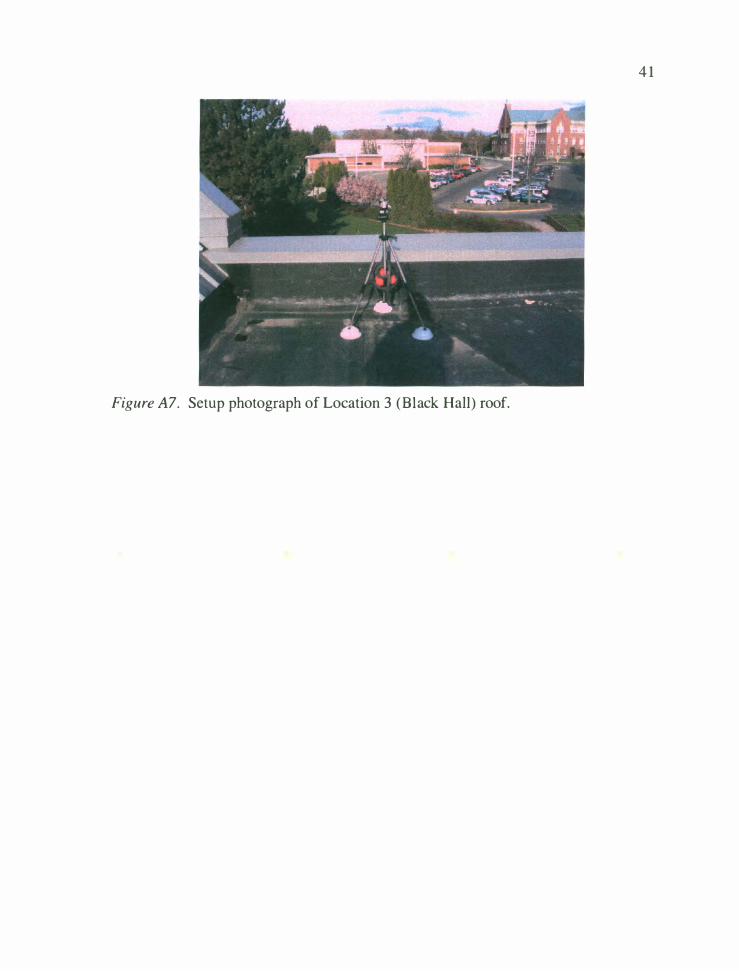
Figure A4. S etu p photogra ph o f Locat ion 2 (Stud ent Unio n and R ecr eation C ent er) no rthw est co mer o f th e bu ilding.
39

Figure AS. Set up photogra ph of Locatio n 2 (St ude nt Unio n and Recreatio n Ce nter) loo ki ng we st.
Figure A6. Set up photogra ph of Locatio n 2 (St ude nt Unio n a nd Recreatio n Ce nter) loo ki ng no rt h.
40
4 1
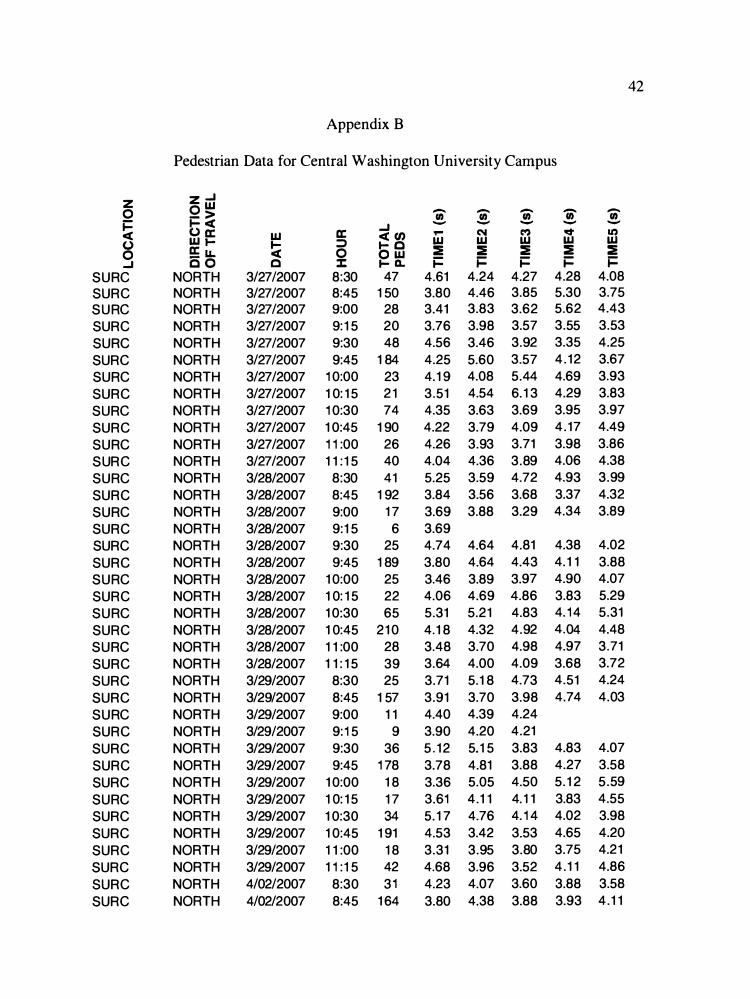
Figure A7. Setup photograph of Location 3 (Black Hall) roof.
42
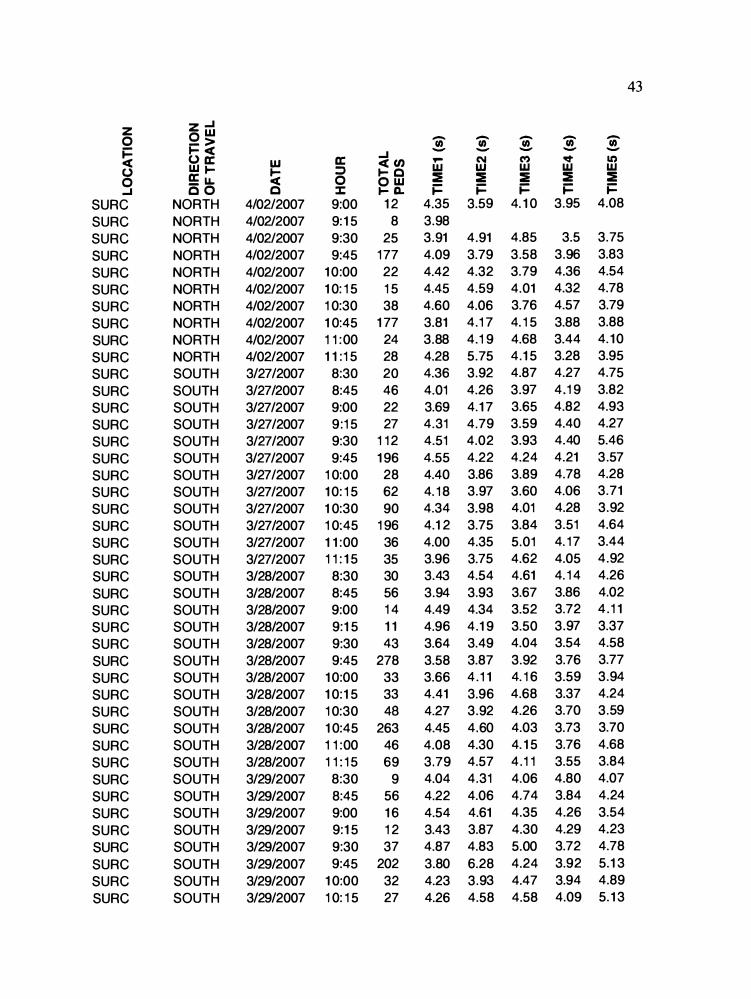
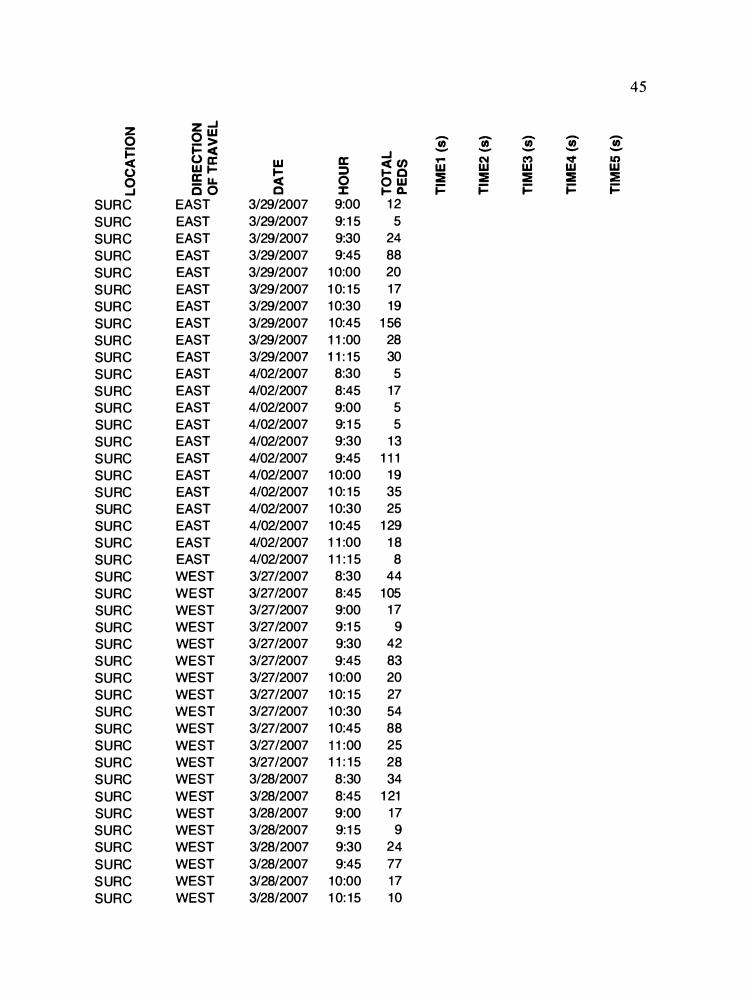
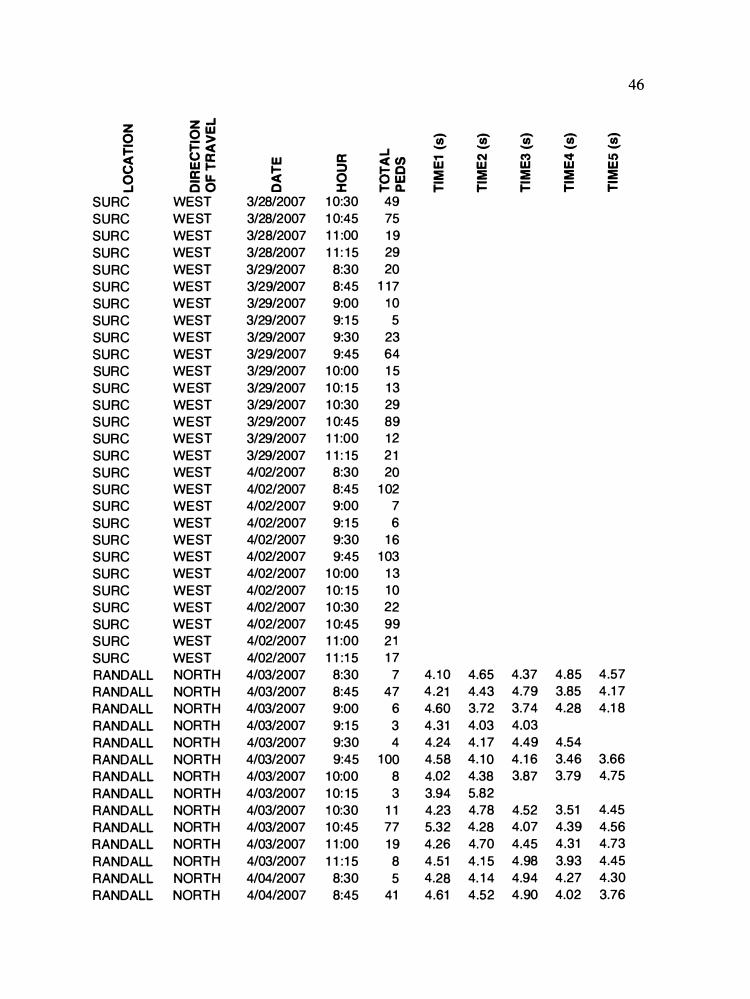
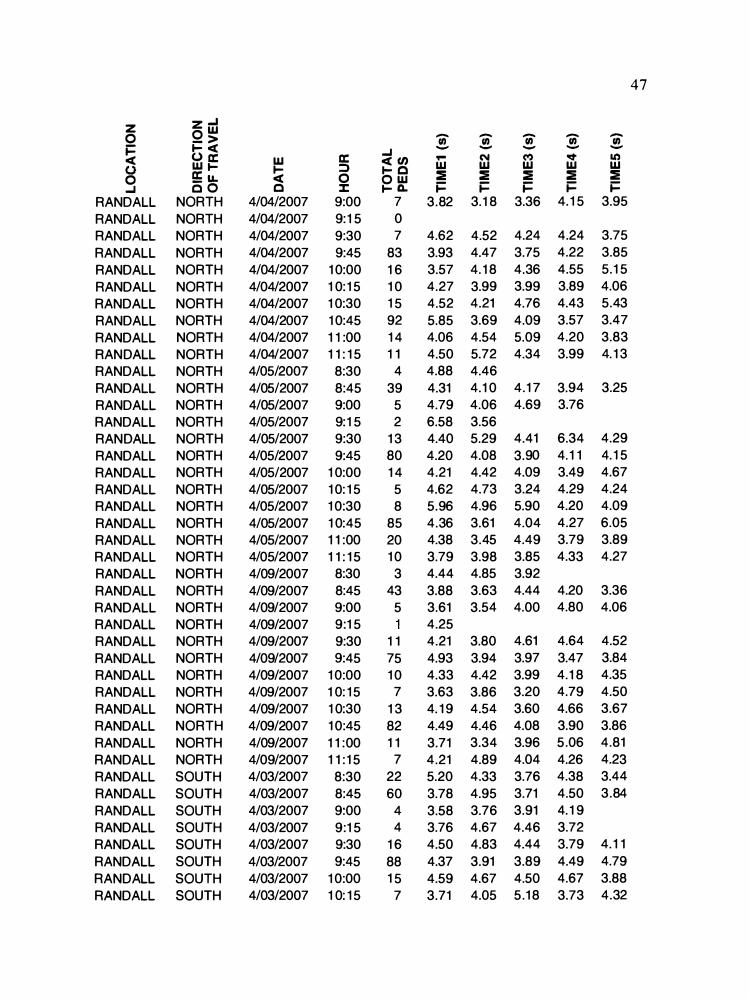
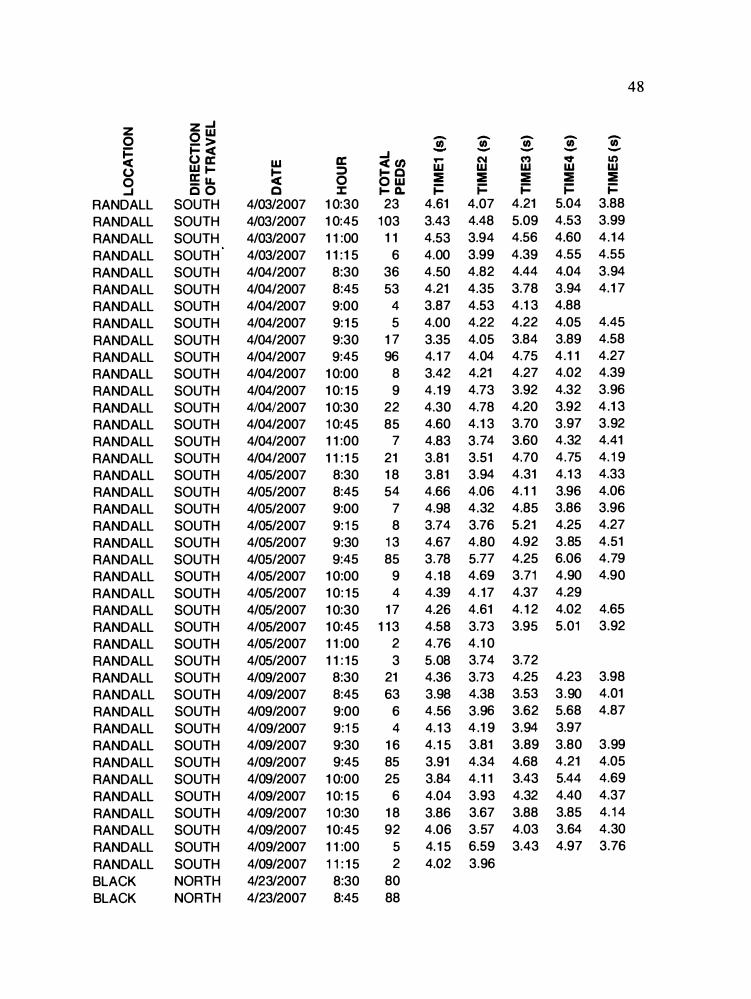
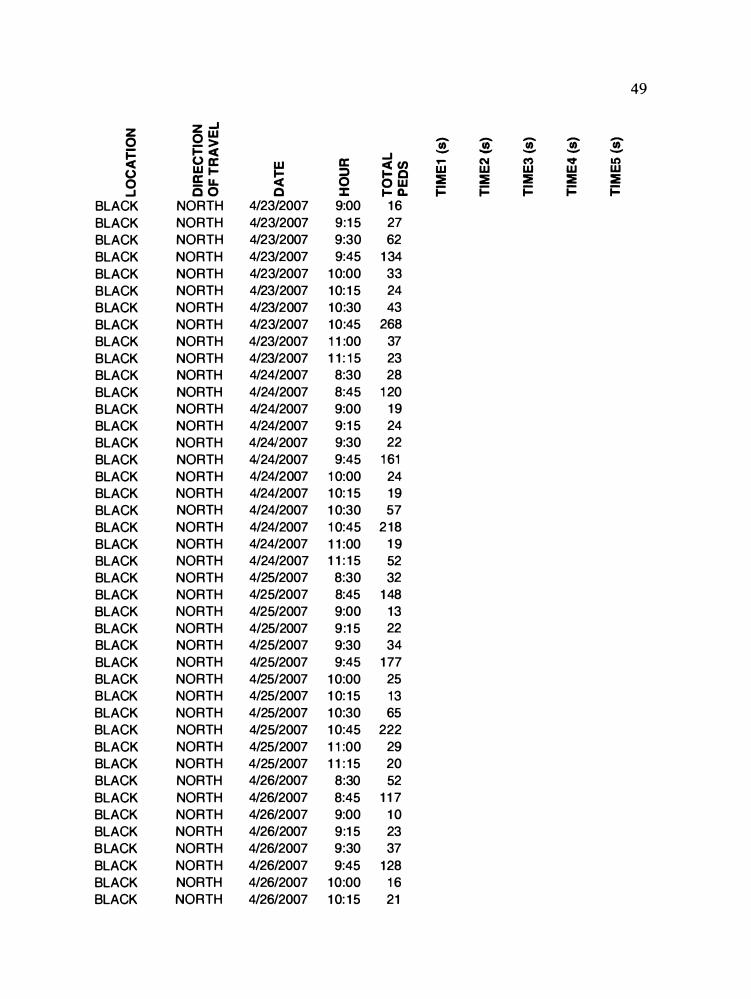
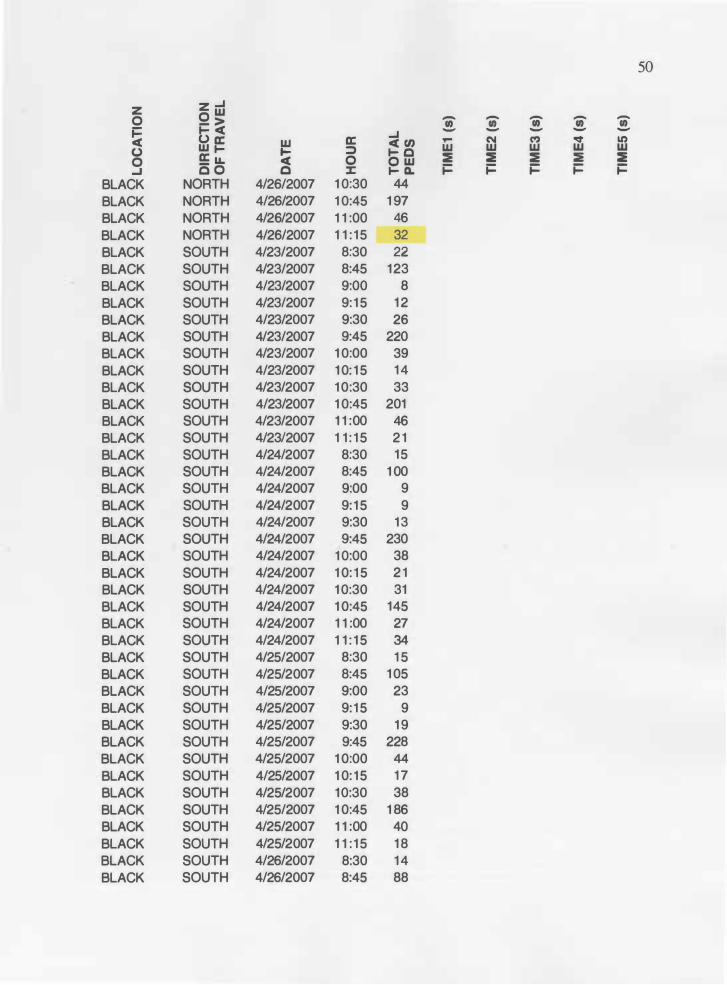
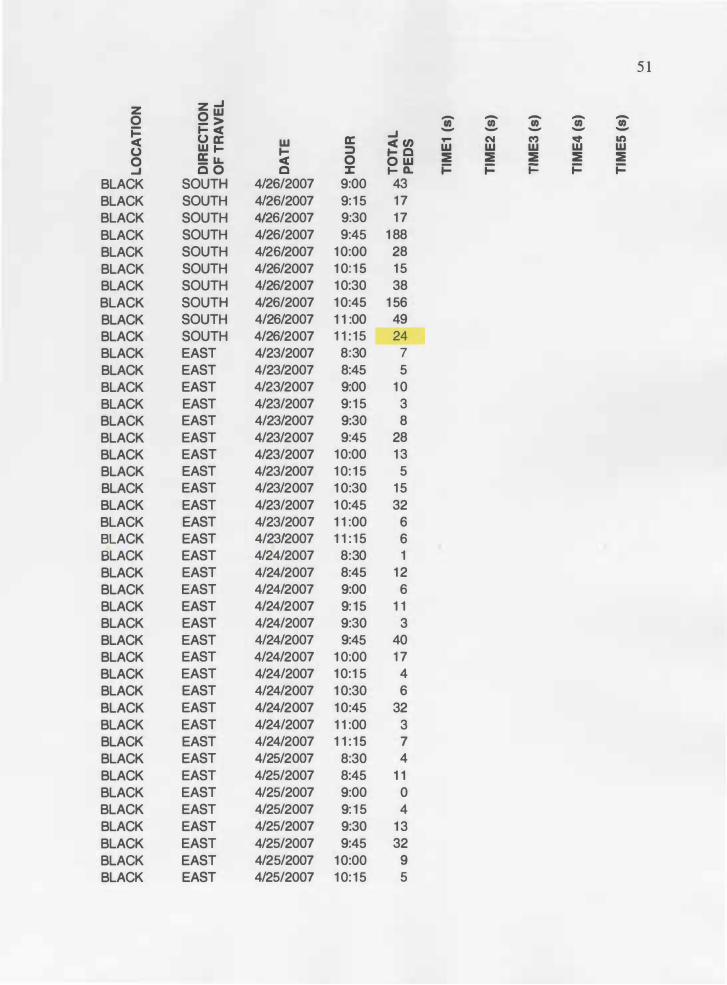
Appendix B
Pedestrian Data for Central Washington University Campus
z z ..J 0 0 W - - - 0 -- > (I) (I) (I) (I) � t> < ..J - - - - -
w � w a: <C U> ,... "' C') "It' It) (.) I- ::> 1- C w w w w w 0 a: u.. <C 0 o w :i :i :i :i :i ..J c o c ::c I- ca. j::: j::: j::: j::: j:::
SURC NORTH 3/27/2007 8:30 47 4.61 4.24 4.27 4.28 4.08
SURC NORTH 3/27/2007 8:45 1 50 3.80 4.46 3.85 5.30 3.75
S U RC NORTH 3/27/2007 9:00 28 3.41 3.83 3.62 5.62 4.43
SURC NORTH 3/27/2007 9: 1 5 20 3.76 3.98 3.57 3.55 3.53
SURC NORTH 3/27/2007 9:30 48 4.56 3.46 3.92 3.35 4.25
SURC NORTH 3/27/2007 9:45 1 84 4.25 5.60 3.57 4 . 1 2 3.67
SURC NORTH 3/27/2007 1 0:00 23 4. 1 9 4.08 5.44 4.69 3.93
SURC NORTH 3/27/2007 1 0: 1 5 2 1 3.51 4.54 6. 1 3 4.29 3.83
SURC NORTH 3/27/2007 1 0:30 74 4.35 3.63 3.69 3.95 3.97
SURC NORTH 3/27/2007 1 0:45 1 90 4.22 3.79 4.09 4 . 1 7 4.49
SURC NORTH 3/27/2007 1 1 :00 26 4.26 3.93 3.71 3.98 3.86
SURC NORTH 3/27/2007 1 1 : 1 5 40 4.04 4.36 3.89 4.06 4.38
SURC NORTH 3/28/2007 8:30 41 5.25 3.59 4.72 4.93 3.99
SURC NORTH 3/28/2007 8:45 1 92 3.84 3.56 3.68 3.37 4.32
SURC NORTH 3/28/2007 9:00 1 7 3.69 3.88 3.29 4.34 3.89
SURC NORTH 3/28/2007 9: 1 5 6 3.69
SURC NORTH 3/28/2007 9:30 25 4.74 4.64 4.81 4.38 4.02
SURC NORTH 3/28/2007 9:45 1 89 3.80 4.64 4.43 4. 1 1 3.88
SURC NORTH 3/28/2007 1 0:00 25 3.46 3.89 3.97 4.90 4.07
SURC NORTH 3/28/2007 1 0: 1 5 22 4.06 4.69 4.86 3.83 5.29
SURC NORTH 3/28/2007 1 0:30 65 5.31 5.21 4.83 4. 1 4 5.31
SURC NORTH 3/28/2007 1 0:45 2 1 0 4. 1 8 4.32 4.92 4.04 4.48
SURC NORTH 3/28/2007 1 1 :00 28 3.48 3.70 4.98 4.97 3.71
SURC NORTH 3/28/2007 1 1 : 1 5 39 3.64 4.00 4.09 3.68 3.72
SURC NORTH 3/29/2007 8:30 25 3.71 5. 1 8 4.73 4.51 4.24
SURC NORTH 3/29/2007 8:45 1 57 3.91 3.70 3.98 4.74 4.03
SURC NORTH 3/29/2007 9:00 1 1 4.40 4.39 4.24
SURC NORTH 3/29/2007 9: 1 5 9 3.90 4.20 4.21
SURC NORTH 3/29/2007 9:30 36 5 . 1 2 5. 1 5 3.83 4.83 4.07
SURC NORTH 3/29/2007 9:45 1 78 3.78 4.81 3.88 4.27 3.58
SURC NORTH 3/29/2007 1 0:00 1 8 3.36 5.05 4.50 5. 1 2 5 .59
SURC NORTH 3/29/2007 1 0: 1 5 1 7 3.61 4.1 1 4. 1 1 3.83 4.55
SURC NORTH 3/29/2007 1 0:30 34 5. 1 7 4.76 4. 1 4 4.02 3.98
SURC NORTH 3/29/2007 1 0:45 1 91 4.53 3.42 3.53 4.65 4.20
SURC NORTH 3/29/2007 1 1 :00 1 8 3.31 3.95 3.80 3.75 4.21
SURC NORTH 3/29/2007 1 1 : 1 5 42 4.68 3.96 3.52 4 . 1 1 4.86
SURC NORTH 4/02/2007 8:30 3 1 4.23 4.07 3.60 3.88 3.58
SURC NORTH 4/02/2007 8:45 1 64 3.80 4.38 3.88 3.93 4 . 1 1
43
z z ..J 0 0 W - - - - -- > tn tn tn tn tn � t- <C ..J - - - - -< o a: w a: < (/) ,... N (') 'II:!' U) 0 w t-
� :::> t- Q w w w w w
0 !!: LL 0 o w :& :& :& :& :& ..J c o Q :::c t- D. � � � � �
SURC NORTH 4/02/2007 9:00 1 2 4.35 3.59 4. 1 0 3.95 4.08
SURC NORTH 4/02/2007 9: 1 5 8 3.98
SURC NORTH 4/02/2007 9:30 25 3.91 4.91 4.85 3.5 3.75
SURC NORTH 4/02/2007 9:45 1 77 4.09 3.79 3.58 3.96 3.83
SURC NORTH 4/02/2007 1 0:00 22 4.42 4.32 3.79 4.36 4.54
SURC NORTH 4/02/2007 1 0: 1 5 1 5 4.45 4.59 4.01 4.32 4.78
SURC NORTH 4/02/2007 1 0:30 38 4.60 4.06 3.76 4.57 3.79
SURC NORTH 4/02/2007 1 0:45 1 77 3.81 4. 1 7 4. 1 5 3.88 3.88
SURC NORTH 4/02/2007 1 1 : 00 24 3.88 4. 1 9 4.68 3.44 4. 1 0
SURC NORTH 4/02/2007 1 1 : 1 5 28 4.28 5.75 4. 1 5 3.28 3.95
SURC SOUTH 3/27/2007 8:30 20 4.36 3.92 4.87 4.27 4.75
SURC SOUTH 3/27/2007 8:45 46 4.01 4.26 3.97 4.1 9 3.82
SURC SOUTH 3/27/2007 9:00 22 3.69 4.1 7 3.65 4.82 4.93
SURC SOUTH 3/27/2007 9:1 5 27 4.31 4.79 3.59 4.40 4.27
SURC SOUTH 3/27/2007 9:30 1 1 2 4.51 4.02 3.93 4.40 5.46
SURC SOUTH 3/27/2007 9:45 1 96 4.55 4.22 4.24 4.21 3 .57
SURC SOUTH 3/27/2007 1 0:00 28 4.40 3.86 3.89 4.78 4.28
SURC SOUTH 3/27/2007 1 0: 1 5 62 4. 1 8 3.97 3.60 4.06 3.71
SURC SOUTH 3/27/2007 1 0:30 90 4.34 3.98 4.01 4.28 3.92
SURC SOUTH 3/27/2007 1 0:45 1 96 4.1 2 3.75 3.84 3.51 4.64
SURC SOUTH 3/27/2007 1 1 :00 36 4.00 4.35 5.01 4. 1 7 3.44
SURC SOUTH 3/27/2007 1 1 : 1 5 35 3.96 3.75 4.62 4.05 4.92
SURC SOUTH 3/28/2007 8:30 30 3.43 4.54 4.61 4. 1 4 4.26
SURC SOUTH 3/28/2007 8:45 56 3.94 3.93 3.67 3.86 4.02
SURC SOUTH 3/28/2007 9:00 1 4 4.49 4.34 3.52 3.72 4 . 1 1
SURC SOUTH 3/28/2007 9:1 5 1 1 4.96 4.1 9 3.50 3.97 3.37
SURC SOUTH 3/28/2007 9:30 43 3.64 3.49 4.04 3.54 4.58
SURC SOUTH 3/28/2007 9:45 278 3.58 3.87 3.92 3.76 3.77
SURC SOUTH 3/28/2007 1 0:00 33 3.66 4 . 1 1 4. 1 6 3.59 3.94
SURC SOUTH 3/28/2007 1 0: 1 5 33 4.41 3.96 4.68 3.37 4.24
SURC SOUTH 3/28/2007 1 0:30 48 4.27 3.92 4.26 3.70 3.59
SURC SOUTH 3/28/2007 1 0:45 263 4.45 4.60 4.03 3.73 3.70
SURC SOUTH 3/28/2007 1 1 :00 46 4.08 4.30 4. 1 5 3.76 4.68
SURC SOUTH 3/28/2007 1 1 : 1 5 69 3.79 4.57 4 . 1 1 3.55 3.84
SURC SOUTH 3/29/2007 8:30 9 4.04 4.31 4.06 4.80 4.07
SURC SOUTH 3/29/2007 8:45 56 4.22 4.06 4.74 3.84 4.24
SURC SOUTH 3/29/2007 9:00 1 6 4.54 4.61 4.35 4.26 3.54
SURC SOUTH 3/29/2007 9:1 5 1 2 3.43 3.87 4.30 4.29 4.23
SURC SOUTH 3/29/2007 9:30 37 4.87 4.83 5.00 3.72 4.78
SURC SOUTH 3/29/2007 9:45 202 3.80 6.28 4.24 3.92 5.1 3
SURC SOUTH 3/29/2007 1 0:00 32 4.23 3.93 4.47 3.94 4.89
SURC SOUTH 3/29/2007 1 0: 1 5 27 4.26 4.58 4.58 4.09 5. 1 3
44
z z ...I 0 0 W - en
- - -- > co co co co t:= ... <C ...I - - - - -<C o a: w a: <C en .... C'll Cf) 'o::t LO 0 w ...
� :::> ... Q w w w w w 0 Q: LL 0 o w :E :E :E :E :E ...I c o Q :c ... 13. t:= t:= t:= t:= t:=
SURC SOUTH 3/29/2007 1 0:30 27 6.02 4.93 4.35 3.66 4.33
SURC SOUTH 3/29/2007 1 0:45 284 5.43 4.5 1 4.42 4 . 1 1 3.96
SURC SOUTH 3/29/2007 1 1 :00 33 3.93 4.33 4.82 3.67 4.30
SURC SOUTH 3/29/2007 1 1 : 1 5 27 4.69 4.37 4.38 4. 1 4 4.34
SURC SOUTH 4/02/2007 8:30 1 7 4.38 3.40 4.67 4.88 3.77
SURC SOUTH 4/02/2007 8:45 72 4.51 4.65 4.50 3.86 3.57
SURC SOUTH 4/02/2007 9:00 7 4.1 2 3.58
SURC SOUTH 4/02/2007 9: 1 5 6 3.87 4.65
SURC SOUTH 4/02/2007 9:30 1 9 4.68 4.41 4.57 3.89 3.98
SURC SOUTH 4/02/2007 9:45 252 4.47 4.25 3.98 4 . 1 0 3.72
SURC SOUTH 4/02/2007 1 0:00 23 4.21 5.36 4.50 3.91 4 .1 5
SURC SOUTH 4/02/2007 1 0: 1 5 23 4.33 4.56 3.96 4.60 4.32
SURC SOUTH 4/02/2007 1 0:30 34 4.90 3.96 4. 1 9 4.42 3.84
SURC SOUTH 4/02/2007 1 0:45 262 5 . 14 4.44 4.28 3.99 4.04
SURC SOUTH 4/02/2007 1 1 :00 25 4.04 3.70 3.94 4.78 4. 1 2
SURC SOUTH 4/02/2007 1 1 : 1 5 1 9 4.39 3.88 3.78 3.51 3.89
SURC EAST 3/27/2007 8:30 9
SURC EAST 3/27/2007 8:45 1 9
SURC EAST 3/27/2007 9:00 1 4
SURC EAST 3/27/2007 9: 1 5 1 8
SURC EAST 3/27/2007 9:30 62
SURC EAST 3/27/2007 9:45 1 03
SURC EAST 3/27/2007 1 0:00 27
SURC EAST 3/27/2007 1 0: 1 5 48
SURC EAST 3/27/2007 1 0:30 58
SURC EAST 3/27/2007 1 0:45 1 04
SURC EAST 3/27/2007 1 1 :00 30
SURC EAST 3/27/2007 1 1 : 1 5 27
SURC EAST 3/28/2007 8:30 1 9
SURC EAST 3/28/2007 8:45 1 9
SURC EAST 3/28/2007 9:00 1 1
SURC EAST 3/28/2007 9: 1 5 9
SURC EAST 3/28/2007 9:30 25
SURC EAST 3/28/2007 9:45 1 1 6
SURC EAST 3/28/2007 1 0:00 26
SURC EAST 3/28/2007 1 0: 1 5 29
SURC EAST 3/28/2007 1 0:30 31
SURC EAST 3/28/2007 1 0:45 1 45
SURC EAST 3/28/2007 1 1 :00 29
SURC EAST 3/28/2007 1 1 : 1 5 22
SURC EAST 3/29/2007 8:30 4
SURC EAST 3/29/2007 8:45 27
45
z z ..J 0 O W - 'iii - - -- > en en en en � ti � ..J - - - - -
w a: c( (I) ,... N C') � It) (.) W I- I- ::. 1- C w w w w w 0 !!: LI. c( 0 o w :E :E :E :E :E ..J c o c :c I- Q. j:: j:: j:: j:: j::
SURC EAST 3/29/2007 9:00 1 2
SURC EAST 3/29/2007 9: 1 5 5
SURC EAST 3/29/2007 9:30 24
SURC EAST 3/29/2007 9:45 88
SURC EAST 3/29/2007 1 0:00 20
SURC EAST 3/29/2007 1 0: 1 5 1 7
SURC EAST 3/29/2007 1 0:30 1 9
SURC EAST 3/29/2007 1 0:45 1 56
SURC EAST 3/29/2007 1 1 :00 28
SURC EAST 3/29/2007 1 1 : 1 5 30
SURC EAST 4/02/2007 8:30 5
SURC EAST 4/02/2007 8:45 1 7
SURC EAST 4/02/2007 9:00 5
SURC EAST 4/02/2007 9:1 5 5
SURC EAST 4/02/2007 9:30 1 3
SURC EAST 4/02/2007 9:45 1 1 1
SURC EAST 4/02/2007 1 0:00 1 9
SURC EAST 4/02/2007 1 0: 1 5 35
SURC EAST 4/02/2007 1 0:30 25
SURC EAST 4/02/2007 1 0:45 1 29
SURC EAST 4/02/2007 1 1 :00 1 8
SURC EAST 4/02/2007 1 1 : 1 5 8
SURC WEST 3/27/2007 8:30 44
SURC WEST 3/27/2007 8:45 1 05
SURC WEST 3/27/2007 9:00 1 7
SURC WEST 3/27/2007 9:1 5 9
SURC WEST 3/27/2007 9:30 42
SURC WEST 3/27/2007 9:45 83
SURC WEST 3/27/2007 1 0:00 20
SURC WEST 3/27/2007 1 0: 1 5 27
SURC WEST 3/27/2007 1 0:30 54
SURC WEST 3/27/2007 1 0:45 88
SURC WEST 3/27/2007 1 1 :00 25
SURC WEST 3/27/2007 1 1 : 1 5 28
SURC WEST 3/28/2007 8:30 34
SURC WEST 3/28/2007 8:45 1 21
SURC WEST 3/28/2007 9:00 1 7
SURC WEST 3/28/2007 9:1 5 9
SURC WEST 3/28/2007 9:30 24
SURC WEST 3/28/2007 9:45 77
S URC WEST 3/28/2007 1 0:00 1 7
SURC WEST 3/28/2007 1 0: 1 5 1 0
46
z z ...1 0 0 W - - - - -- > fl) fl) fl) fl) fl) t== I- c( ...I - - - - -c( (.) a: w a: c( (/) ,... N (") "If' in (.) W t- I- :::> o fa
w w w w w 0 !!: u. c( 0 :!: :!: :!: :!: :!: ...I 0 0 0 :c I- D.. t== t== t== t== t==
SURC WEST 3/28/2007 1 0:30 49
SURC WEST 3/28/2007 1 0:45 75
SURC WEST 3/28/2007 1 1 :00 1 9
SURC WEST 3/28/2007 1 1 : 1 5 29
SURC WEST 3/29/2007 8:30 20
SURC WEST 3/29/2007 8:45 1 1 7
SURC WEST 3/29/2007 9:00 1 0
SURC WEST 3/29/2007 9: 1 5 5
SURC WEST 3/29/2007 9:30 23
SURC WEST 3/29/2007 9:45 64
SURC WEST 3/29/2007 1 0:00 1 5
SURC W EST 3/29/2007 1 0: 1 5 1 3
SURC WEST 3/29/2007 1 0:30 29
SURC WEST 3/29/2007 1 0:45 89
SURC WEST 3/29/2007 1 1 :00 1 2
SURC WEST 3/29/2007 1 1 : 1 5 2 1
SURC WEST 4/02/2007 8:30 20
SURC WEST 4/02/2007 8:45 1 02
SURC WEST 4/02/2007 9:00 7
SURC WEST 4/02/2007 9: 1 5 6
SURC WEST 4/02/2007 9:30 1 6
SURC WEST 4/02/2007 9:45 1 03
SURC WEST 4/02/2007 1 0:00 1 3
SURC WEST 4/02/2007 1 0: 1 5 1 0
SURC WEST 4/02/2007 1 0:30 22
SURC WEST 4/02/2007 1 0:45 99
SURC WEST 4/02/2007 1 1 :00 2 1
SURC WEST 4/02/2007 1 1 : 1 5 1 7
RANDALL NORTH 4/03/2007 8:30 7 4. 1 0 4.65 4.37 4.85 4.57
RANDALL NORTH 4/03/2007 8:45 47 4.21 4.43 4.79 3.85 4.1 7
RANDALL NORTH 4/03/2007 9:00 6 4.60 3.72 3.74 4.28 4.1 8
RANDALL NORTH 4/03/2007 9: 1 5 3 4.31 4.03 4.03
RANDALL NORTH 4/03/2007 9:30 4 4.24 4. 1 7 4.49 4.54
RANDALL NORTH 4/03/2007 9:45 1 00 4.58 4. 1 0 4. 1 6 3.46 3.66
RANDALL NORTH 4/03/2007 1 0:00 8 4.02 4.38 3.87 3.79 4.75
RANDALL NORTH 4/03/2007 1 0: 1 5 3 3.94 5.82
RANDALL NORTH 4/03/2007 1 0:30 1 1 4.23 4.78 4.52 3.51 4.45
RANDALL NORTH 4/03/2007 1 0:45 77 5.32 4.28 4.07 4.39 4.56
RANDALL NORTH 4/03/2007 1 1 :00 1 9 4.26 4.70 4.45 4.31 4.73
RANDALL NORTH 4/03/2007 1 1 : 1 5 8 4.51 4. 1 5 4.98 3.93 4.45
RANDALL NORTH 4/04/2007 8:30 5 4.28 4. 1 4 4.94 4.27 4.30
RANDALL NORTH 4/04/2007 8:45 41 4.61 4.52 4.90 4.02 3.76
47
z z ...1 0 O W - - - - -- > ti) ti) ti) ti) ti) j:: ti <C ...I - - - - -<C w a: w a: <C (/) ,... N (') 'lit' Ln
::> w w w w w (.) a:
I- I- 1- C ::E ::E ::E ::E ::E 0 _ u. <C 0 o w ...I c o c :c I- Q. j:: j:: j:: j:: j::
RANDALL NORTH 4/04/2007 9:00 7 3.82 3. 1 8 3.36 4. 1 5 3.95
RANDALL NORTH 4/04/2007 9:1 5 0
RANDALL NORTH 4/04/2007 9:30 7 4.62 4.52 4.24 4.24 3.75
RANDALL NORTH 4/04/2007 9:45 83 3.93 4.47 3.75 4.22 3.85
RANDALL NORTH 4/04/2007 1 0:00 1 6 3.57 4. 1 8 4.36 4.55 5. 1 5
RANDALL NORTH 4/04/2007 1 0: 1 5 1 0 4.27 3.99 3.99 3.89 4.06
RANDALL NORTH 4/04/2007 1 0:30 1 5 4.52 4.21 4.76 4.43 5.43
RANDALL NORTH 4/04/2007 1 0:45 92 5.85 3.69 4.09 3.57 3.47
RANDALL NORTH 4/04/2007 1 1 :00 1 4 4.06 4.54 5.09 4.20 3.83
RANDALL NORTH 4/04/2007 1 1 : 1 5 1 1 4.50 5.72 4.34 3.99 4. 1 3
RANDALL NORTH 4/05/2007 8:30 4 4.88 4.46
RANDALL NORTH 4/05/2007 8:45 39 4.31 4. 1 0 4. 1 7 3.94 3.25
RANDALL NORTH 4/05/2007 9:00 5 4.79 4.06 4.69 3.76
RANDALL NORTH 4/05/2007 9:1 5 2 6.58 3.56
RANDALL NORTH 4/05/2007 9:30 1 3 4.40 5.29 4.41 6.34 4.29
RANDALL NORTH 4/05/2007 9:45 80 4.20 4.08 3.90 4.1 1 4. 1 5
RANDALL NORTH 4/05/2007 1 0:00 1 4 4.21 4.42 4.09 3.49 4.67
RANDALL NORTH 4/05/2007 1 0: 1 5 5 4.62 4.73 3.24 4.29 4.24
RANDALL NORTH 4/05/2007 1 0:30 8 5.96 4.96 5.90 4.20 4.09
RANDALL NORTH 4/05/2007 1 0:45 85 4.36 3.61 4.04 4.27 6.05
RANDALL NORTH 4/05/2007 1 1 :00 20 4.38 3.45 4.49 3.79 3.89
RANDALL NORTH 4/05/2007 1 1 : 1 5 1 0 3.79 3.98 3.85 4.33 4.27
RANDALL NORTH 4/09/2007 8:30 3 4.44 4.85 3.92
RANDALL NORTH 4/09/2007 8:45 43 3.88 3.63 4.44 4.20 3.36
RANDALL NORTH 4/09/2007 9:00 5 3.61 3.54 4.00 4.80 4.06
RANDALL NORTH 4/09/2007 9:1 5 4.25
RANDALL NORTH 4/09/2007 9:30 1 1 4.21 3.80 4.61 4.64 4.52
RANDALL NORTH 4/09/2007 9:45 75 4.93 3.94 3.97 3.47 3.84
RANDALL NORTH 4/09/2007 1 0:00 1 0 4.33 4.42 3.99 4. 1 8 4.35
RANDALL NORTH 4/09/2007 1 0: 1 5 7 3.63 3.86 3.20 4.79 4.50
RANDALL NORTH 4/09/2007 1 0:30 1 3 4. 1 9 4.54 3.60 4.66 3.67
RANDALL NORTH 4/09/2007 1 0:45 82 4.49 4.46 4.08 3.90 3.86
RANDALL NORTH 4/09/2007 1 1 :00 1 1 3.71 3.34 3.96 5 .06 4.81
RANDALL NORTH 4/09/2007 1 1 : 1 5 7 4.21 4.89 4.04 4.26 4.23
RANDALL SOUTH 4/03/2007 8:30 22 5.20 4.33 3.76 4.38 3.44
RANDALL SOUTH 4/03/2007 8:45 60 3.78 4.95 3.71 4.50 3.84
RANDALL SOUTH 4/03/2007 9:00 4 3.58 3.76 3.91 4. 1 9
RANDALL SOUTH 4/03/2007 9:1 5 4 3.76 4.67 4.46 3.72
RANDALL SOUTH 4/03/2007 9:30 1 6 4.50 4.83 4.44 3.79 4. 1 1
RANDALL SOUTH 4/03/2007 9:45 88 4.37 3.91 3.89 4.49 4.79
RANDALL SOUTH 4/03/2007 1 0:00 1 5 4.59 4.67 4.50 4.67 3.88
RANDALL SOUTH 4/03/2007 1 0: 1 5 7 3.71 4.05 5.1 8 3.73 4.32
48
z z .J 0 O W - - - - -- > .!!. en en en en
� I- <C .J - - - -o a: w a: <C Cl) ,... C'I ('<') � l.t)
0 W I- I- =- 1- Q w w w w w 0 !!; LL <C 0 o w 2 2 2 2 2 .J c o Q :c I- Q. j:: j:: j:: j:: j::
RANDALL SOUTH 4/03/2007 1 0:30 23 4.61 4.07 4.21 5.04 3.88
RANDALL SOUTH 4/03/2007 1 0:45 1 03 3.43 4.48 5.09 4.53 3.99
RANDALL SOUTH 4/03/2007 1 1 :00 1 1 4.53 3.94 4.56 4.60 4.1 4
RANDALL SOUTH 4/03/2007 1 1 : 1 5 6 4.00 3.99 4.39 4.55 4.55
RANDALL SOUTH 4/04/2007 8:30 36 4.50 4.82 4.44 4.04 3.94
RANDALL SOUTH 4/04/2007 8:45 53 4.21 4.35 3.78 3.94 4.1 7
RANDALL SOUTH 4/04/2007 9:00 4 3.87 4.53 4.1 3 4.88
RANDALL SOUTH 4/04/2007 9: 1 5 5 4.00 4.22 4.22 4.05 4.45
RANDALL SOUTH 4/04/2007 9:30 1 7 3.35 4.05 3.84 3.89 4.58
RANDALL SOUTH 4/04/2007 9:45 96 4. 1 7 4.04 4.75 4.1 1 4.27
RANDALL SOUTH 4/04/2007 1 0:00 8 3.42 4.21 4.27 4.02 4.39
RANDALL SOUTH 4/04/2007 1 0: 1 5 9 4. 1 9 4.73 3.92 4.32 3.96
RANDALL SOUTH 410412007 1 0:30 22 4.30 4.78 4.20 3.92 4 .1 3
RANDALL SOUTH 4/04/2007 1 0:45 85 4.60 4.1 3 3.70 3.97 3.92
RANDALL SOUTH 4/04/2007 1 1 :00 7 4.83 3.74 3.60 4.32 4.41
RANDALL SOUTH 4/04/2007 1 1 : 1 5 21 3.81 3.51 4.70 4.75 4. 1 9
RANDALL SOUTH 4/05/2007 8:30 1 8 3.81 3.94 4.31 4. 1 3 4.33
RANDALL SOUTH 4/05/2007 8:45 54 4.66 4.06 4.1 1 3.96 4.06
RANDALL SOUTH 4/05/2007 9:00 7 4.98 4.32 4.85 3.86 3.96
RANDALL SOUTH 4/05/2007 9: 1 5 8 3.74 3.76 5.21 4.25 4.27
RANDALL SOUTH 4/05/2007 9:30 1 3 4.67 4.80 4.92 3.85 4.51
RANDALL SOUTH 4/05/2007 9:45 85 3.78 5.77 4.25 6.06 4.79
RANDALL SOUTH 4/05/2007 1 0:00 9 4 . 1 8 4.69 3.71 4.90 4.90
RANDALL SOUTH 4/05/2007 1 0: 1 5 4 4.39 4 . 1 7 4.37 4.29
RANDALL SOUTH 4/05/2007 1 0:30 1 7 4.26 4.61 4. 1 2 4.02 4.65
RANDALL SOUTH 4/05/2007 1 0:45 1 1 3 4.58 3.73 3.95 5.01 3.92
RANDALL SOUTH 4/05/2007 1 1 :00 2 4.76 4.1 0
RANDALL SOUTH 4/05/2007 1 1 : 1 5 3 5.08 3.74 3.72
RANDALL SOUTH 4/09/2007 8:30 21 4.36 3.73 4.25 4.23 3.98
RANDALL SOUTH 4/09/2007 8:45 63 3.98 4.38 3.53 3 .90 4.01
RANDALL SOUTH 4/09/2007 9:00 6 4.56 3.96 3.62 5.68 4.87
RANDALL SOUTH 4/09/2007 9: 1 5 4 4. 1 3 4 .1 9 3.94 3.97
RANDALL SOUTH 4/09/2007 9:30 1 6 4.1 5 3.81 3.89 3.80 3.99
RANDALL SOUTH 4/09/2007 9:45 85 3.91 4.34 4.68 4.21 4.05
RANDALL SOUTH 4/09/2007 1 0:00 25 3.84 4.1 1 3.43 5.44 4.69
RANDALL SOUTH 4/09/2007 1 0: 1 5 6 4.04 3.93 4.32 4.40 4.37
RANDALL SOUTH 4/09/2007 1 0:30 1 8 3.86 3.67 3.88 3.85 4. 1 4
RANDALL SOUTH 4/09/2007 1 0:45 92 4.06 3.57 4.03 3.64 4.30
RANDALL SOUTH 4/09/2007 1 1 :00 5 4. 1 5 6.59 3.43 4.97 3.76
RANDALL SOUTH 4/09/2007 1 1 : 1 5 2 4.02 3.96
BLACK NORTH 4/23/2007 8:30 80
BLACK NORTH 4/23/2007 8:45 88
49
z z ..J 0 0 W - - - - -- > 0 .!. 0 0 0
� I- II( ..J - - - -0 a: w a: II( (/) ,... N (') � It) w I- ::> w w w w w 0 e:; LI. !;( t- C :E :E :E :E :E 0 0 o w
..J c o c ::c I- a. t= t= t= t= t= BLACK NORTH 4/23/2007 9:00 1 6
BLACK NORTH 4/23/2007 9:1 5 27
BLACK NORTH 4/23/2007 9:30 62
BLACK NORTH 4/23/2007 9:45 1 34
BLACK NORTH 4/23/2007 1 0:00 33
BLACK NORTH 4/23/2007 1 0: 1 5 24
BLACK NORTH 4/23/2007 1 0:30 43
BLACK NORTH 4/23/2007 1 0:45 268
BLACK NORTH 4/23/2007 1 1 :00 37
BLACK NORTH 4/23/2007 1 1 : 1 5 23
BLACK NORTH 4/24/2007 8:30 28
BLACK NORTH 4/24/2007 8:45 1 20
BLACK NORTH 4/24/2007 9:00 1 9
BLACK NORTH 4/24/2007 9:1 5 24
BLACK NORTH 4/24/2007 9:30 22
BLACK NORTH 4/24/2007 9:45 1 61
BLACK NORTH 4/24/2007 1 0:00 24
BLACK NORTH 4/24/2007 1 0: 1 5 1 9
BLACK NORTH 4/24/2007 1 0:30 57
BLACK NORTH 4/24/2007 1 0:45 2 1 8
BLACK NORTH 4/24/2007 1 1 :00 1 9
BLACK NORTH 4/24/2007 1 1 : 1 5 52
BLACK NORTH 4/25/2007 8:30 32
BLACK NORTH 4/25/2007 8:45 1 48
BLACK NORTH 4/25/2007 9:00 1 3
BLACK NORTH 4/25/2007 9 :1 5 22
BLACK NORTH 4/25/2007 9:30 34
BLACK NORTH 4/25/2007 9:45 1 77
BLACK NORTH 4/25/2007 1 0:00 25
BLACK NORTH 4/25/2007 1 0: 1 5 1 3
BLACK NORTH 4/25/2007 1 0:30 65
BLACK NORTH 4/25/2007 1 0:45 222
BLACK NORTH 4/25/2007 1 1 :00 29
BLACK NORTH 4/25/2007 1 1 : 1 5 20
BLACK NORTH 4/26/2007 8:30 52
BLACK NORTH 4/26/2007 8:45 1 1 7
BLACK NORTH 4/26/2007 9:00 1 0
BLACK NORTH 4/26/2007 9:1 5 23
BLACK NORTH 4/26/2007 9:30 37
BLACK NORTH 4/26/2007 9:45 1 28
BLACK NORTH 4/26/2007 1 0:00 1 6
BLACK NORTH 4/26/2007 1 0: 1 5 21
50
z z � 0 O W - - - - -- > en en en en en
� I- er: � - - - - -
O a: w a: er: Cl) ..... N (") ..,. Lt) (.) W t- I- ::> 1- C w w w w w 0 !!: LI. er: 0 o w :::E :::E :::E :::E :::E � c o c J: I- 11. j::: j::: j::: j::: j:::
BLACK NORTH 4/26/2007 1 0:30 44 BLACK NORTH 4/26/2007 1 0:45 1 97
BLACK NORTH 4/26/2007 1 1 :00 46
BLACK NORTH 4/26/2007 1 1 : 1 5 32
BLACK SOUTH 4/23/2007 8:30 22
BLACK SOUTH 4/23/2007 8:45 1 23
BLACK SOUTH 4/23/2007 9:00 8
BLACK SOUTH 4/23/2007 9: 1 5 1 2
BLACK SOUTH 4/23/2007 9:30 26
BLACK SOUTH 4/23/2007 9:45 220
BLACK SOUTH 4/23/2007 1 0:00 39
BLACK SOUTH 4/23/2007 1 0: 1 5 1 4
BLACK SOUTH 4/23/2007 1 0:30 33
BLACK SOUTH 4/23/2007 1 0:45 201
BLACK SOUTH 4/23/2007 1 1 :00 46
BLACK SOUTH 4/23/2007 1 1 : 1 5 2 1
BLACK SOUTH 4/24/2007 8:30 1 5
BLACK SOUTH 4/24/2007 8:45 1 00
BLACK SOUTH 4/24/2007 9:00 9
BLACK SOUTH 4/24/2007 9: 1 5 9
BLACK SOUTH 4/24/2007 9:30 1 3
BLACK SOUTH 4/24/2007 9:45 230
BLACK SOUTH 4/24/2007 1 0:00 38
BLACK SOUTH 4/24/2007 1 0: 1 5 2 1
BLACK SOUTH 4/24/2007 1 0:30 31
BLACK SOUTH 4/24/2007 1 0:45 145
BLACK SOUTH 4/24/2007 1 1 :00 27
BLACK SOUTH 4/24/2007 1 1 : 1 5 34 BLACK SOUTH 4/25/2007 8:30 1 5
BLACK SOUTH 4/25/2007 8:45 1 05
BLACK SOUTH 4/25/2007 9:00 23
BLACK SOUTH 4/25/2007 9: 1 5 9
BLACK SOUTH 4/25/2007 9:30 1 9
BLACK SOUTH 4/25/2007 9:45 228
BLACK SOUTH 4/25/2007 1 0:00 44 BLACK SOUTH 4/25/2007 1 0: 1 5 1 7
BLACK SOUTH 4/25/2007 1 0:30 38
BLACK SOUTH 4/25/2007 1 0:45 1 86
BLACK SOUTH 4/25/2007 1 1 :00 40
BLACK SOUTH 4/25/2007 1 1 : 1 5 1 8
BLACK SOUTH 4/26/2007 8:30 1 4
BLACK SOUTH 4/26/2007 8:45 88
5 1
z z ..... 0 0 W 'ii' - - - -- > U) In U) In j:: .... c( ..... - - - - -c( (.) a: w a: c( (/) .... C'I M ..:t' in u w .... .... :J .... c w w w w w 0 e: u. c( 0 o w :::E :::E :::E :::E :::E ..... c o c ::c .... Q. j:: j:: j:: j:: j::
BLACK SOUTH 4/26/2007 9:00 43
BLACK SOUTH 4/26/2007 9: 1 5 1 7
BLACK SOUTH 4/26/2007 9:30 1 7
BLACK SOUTH 4/26/2007 9:45 1 88
BLACK SOUTH 4/26/2007 1 0:00 28
BLACK SOUTH 4/26/2007 1 0: 1 5 1 5
BLACK SOUTH 4/26/2007 1 0:30 38
BLACK SOUTH 4/26/2007 1 0:45 1 56
BLACK SOUTH 4/26/2007 1 1 :00 49
BLACK SOUTH 4/26/2007 1 1 : 1 5 24
BLACK EAST 4/23/2007 8:30 7
BLACK EAST 4/23/2007 8:45 5
BLACK EAST 4/23/2007 9:00 1 0
BLACK EAST 4/23/2007 9: 1 5 3
BLACK EAST 4/23/2007 9:30 8
BLACK EAST 4/23/2007 9:45 28
BLACK EAST 4/23/2007 1 0:00 1 3
BLACK EAST 4/23/2007 1 0: 1 5 5
BLACK EAST 4/23/2007 1 0:30 1 5
BLACK EAST 4/23/2007 1 0:45 32
BLACK EAST 4/23/2007 1 1 :00 6
BLACK EAST 4/23/2007 1 1 : 1 5 6
BLACK EAST 4/24/2007 8:30 1
BLACK EAST 4/24/2007 8:45 1 2
BLACK EAST 4/24/2007 9:00 6
BLACK EAST 4/24/2007 9: 1 5 1 1
BLACK EAST 4/24/2007 9:30 3
BLACK EAST 4/24/2007 9:45 40
BLACK EAST 4/24/2007 1 0:00 1 7
BLACK EAST 4/24/2007 1 0:1 5 4
BLACK EAST 4/24/2007 1 0:30 6
BLACK EAST 4/24/2007 1 0:45 32
BLACK EAST 4/24/2007 1 1 :00 3
BLACK EAST 4/24/2007 1 1 : 1 5 7
BLACK EAST 4/25/2007 8:30 4
BLACK EAST 4/25/2007 8:45 1 1
BLACK EAST 4/25/2007 9:00 0
BLACK EAST 4/25/2007 9: 1 5 4
BLACK EAST 4/25/2007 9:30 1 3
BLACK EAST 4/25/2007 9:45 32
BLACK EAST 4/25/2007 1 0:00 9
BLACK EAST 4/25/2007 1 0: 1 5 5
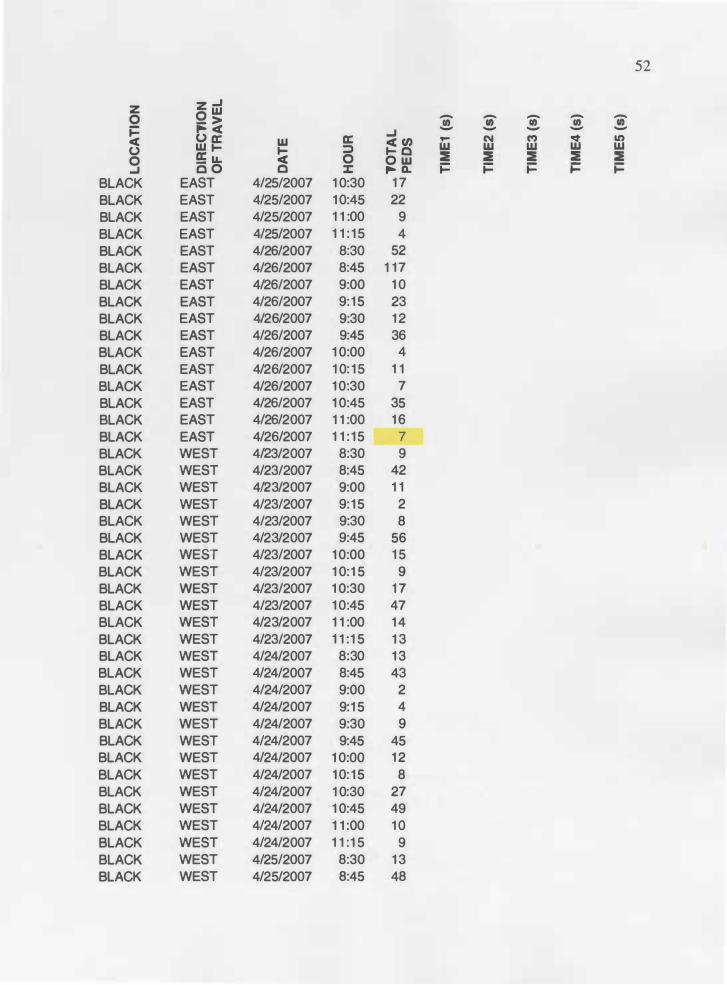
52
z z ..J 0 0 W - - - - -- > II) II) Cl) II) II) j::: .... c ..J - - - - -c (,) a: w a: c (/) � N (') "If' It) (,) W t- .... :::> t- 0 w w w w w 0 !!:; LL. c 0 o w ::E ::E ::E ::E ::E ..J c o 0 :c .... Q. j::: j::: j::: j::: j:::
BLACK EAST 4/25/2007 1 0:30 1 7
BLACK EAST 4/25/2007 1 0:45 22
BLACK EAST 4/25/2007 1 1 :00 9
BLACK EAST 4/25/2007 1 1 : 1 5 4
BLACK EAST 4/26/2007 8:30 52
BLACK EAST 4/26/2007 8:45 1 1 7
BLACK EAST 4/26/2007 9:00 1 0
BLACK EAST 4/26/2007 9: 1 5 23
BLACK EAST 4/26/2007 9:30 1 2
BLACK EAST 4/26/2007 9:45 36
BLACK EAST 4/26/2007 1 0:00 4
BLACK EAST 4/26/2007 1 0: 1 5 1 1
BLACK EAST 4/26/2007 1 0:30 7
BLACK EAST 4/26/2007 1 0:45 35
BLACK EAST 4/26/2007 1 1 :00 1 6
BLACK EAST 4/26/2007 1 1 : 1 5 7
BLACK WEST 4/23/2007 8:30 9
BLACK WEST 4/23/2007 8:45 42
BLACK WEST 4/23/2007 9:00 1 1
BLACK WEST 4/23/2007 9: 1 5 2
BLACK WEST 4/23/2007 9:30 8
BLACK WEST 4/23/2007 9:45 56
BLACK WEST 4/23/2007 1 0:00 1 5
BLACK WEST 4/23/2007 1 0:1 5 9
BLACK WEST 4/23/2007 1 0:30 1 7
BLACK WEST 4/23/2007 1 0:45 47
BLACK WEST 4/23/2007 1 1 :00 1 4
BLACK WEST 4/23/2007 1 1 : 1 5 1 3
BLACK WEST 4/24/2007 8:30 1 3
BLACK WEST 4/24/2007 8:45 43
BLACK WEST 4/24/2007 9:00 2
BLACK WEST 4/24/2007 9:1 5 4
BLACK WEST 4/24/2007 9:30 9
BLACK WEST 4/24/2007 9:45 45
BLACK WEST 4/24/2007 1 0:00 1 2
BLACK WEST 4/24/2007 1 0: 1 5 8
BLACK WEST 4/24/2007 1 0:30 27
BLACK WEST 4/24/2007 1 0:45 49
BLACK WEST 4/24/2007 1 1 :00 1 0
BLACK WEST 4/24/2007 1 1 : 1 5 9
BLACK WEST 4/25/2007 8:30 1 3
BLACK WEST 4/25/2007 8:45 48
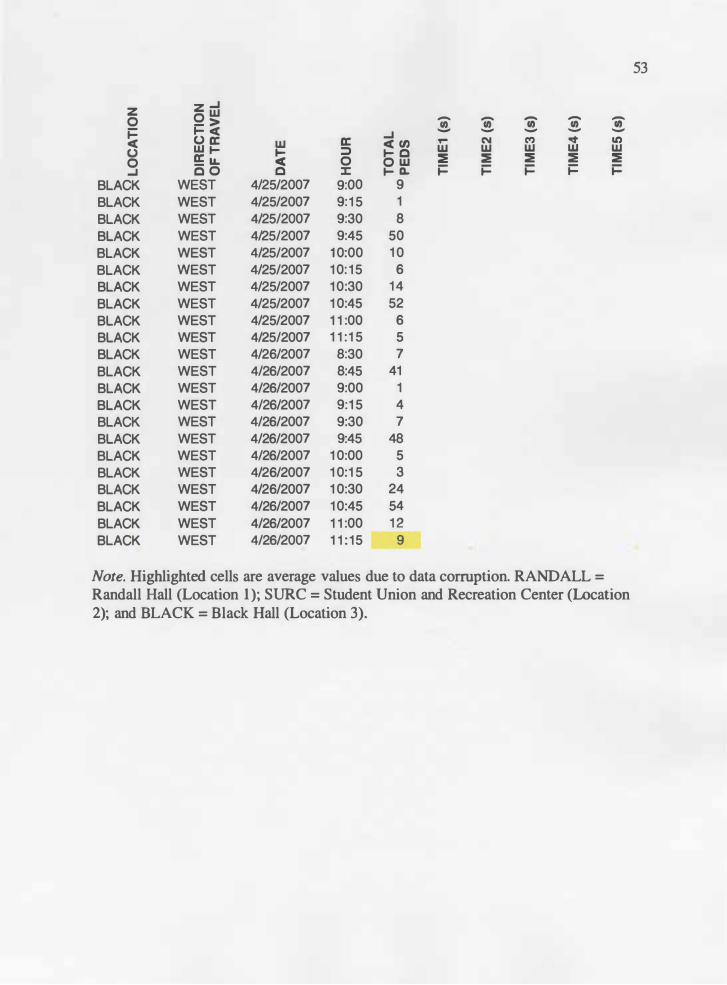
53
z z ...J
0 O W - - - --;; - > (I) (I) (I) (I)
� t- cC ...J - - - - -
cC o a: w a: cC CJ) ,... N ('I) "It' It) 0 W t-
� ::> t- c w w w w w
0 � IL 0 o w ::E ::E ::E ::E ::E ...J c o c :I: t- D.. � � � � �
BLACK WEST 4/25/2007 9:00 9 BLACK WEST 4/25/2007 9: 1 5 1
BLACK WEST 4/25/2007 9:30 8 BLACK WEST 4/25/2007 9:45 50 BLACK WEST 4/25/2007 1 0:00 1 0 BLACK WEST 4/25/2007 1 0: 1 5 6 BLACK WEST 4/25/2007 1 0:30 1 4 BLACK WEST 4/25/2007 1 0:45 52 BLACK WEST 4/25/2007 1 1 :00 6 BLACK WEST 4/25/2007 1 1 : 1 5 5 BLACK WEST 4/26/2007 8:30 7 BLACK WEST 4/26/2007 8:45 41 BLACK WEST 4/26/2007 9:00 1 BLACK WEST 4/26/2007 9:1 5 4 BLACK WEST 4/26/2007 9:30 7 BLACK WEST 4/26/2007 9:45 48 BLACK WEST 4/26/2007 1 0:00 5 BLACK WEST 4/26/2007 1 0:1 5 3 BLACK WEST 4/26/2007 1 0:30 24 BLACK WEST 4/26/2007 1 0:45 54
BLACK WEST 4/26/2007 1 1 :00 1 2 BLACK WEST 4/26/2007 1 1 : 1 5 9
Note. Highlighted cells are average values due to data corruption. RANDALL =
Randall Hall (Location 1 ); SURC = Student Union and Recreation Center (Location 2); and BLACK = Black Hall (Location 3).
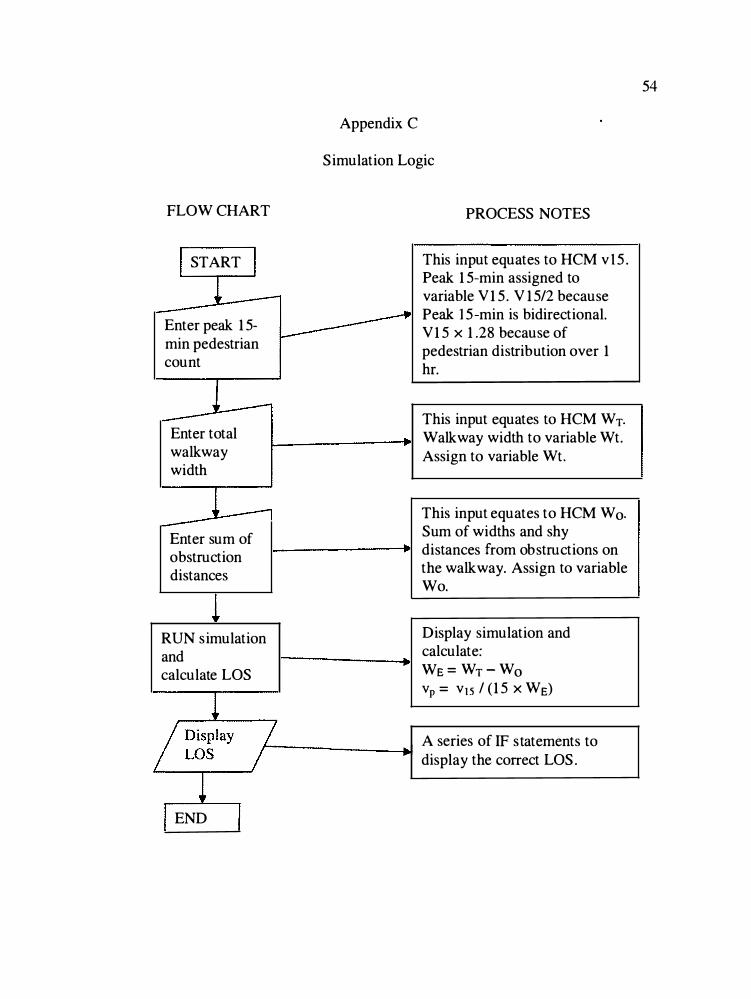
FLOW CHART
START
Enter peak 15-min pedestrian count
Enter total walkway width
Enter sum of obstruction distances
RUN simulation and calculate LOS
Appendix C
Simulation Logic
PROCESS NOTES
This input equates to HCM v l 5 . Peak 15-min assigned to variable V15. V15/2 because Peak 1 5-min is bidirectional. V15 x 1.28 because of pedestrian distribution over 1 hr.
This input equates to HCM WT. Walkway width to variable Wt. Assign to variable Wt.
This input equates to HCM W o. Sum of widths and shy distances from obstructions on the walkway. Assign to variable Wo.
Display simulation and calculate: WE = WT - Wo Vp = V15 / (15 x WE)
A series of IF s tatements to r-������--iw display the correct LOS .
END
54

55
Appendix D
Pro Model Parameters for Bidirectional Flow
******************************* ************************************** *** * *
Formatted Listing of Model: * C:\Program Files\ProModel\Models\thesis_rand.MOD *
********************************************************************* *** ??????:
# #Final version of the simulation for two-way pedestrian traffic using HCM calculations and methodologies Time Units: Minutes Distance Units: Ft Initialization Logic: ANIMATE 20.0
PROMPT "Please enter the peak 1 5 minute pedestrian count value", v_ V 1 5
PROMPT "Please enter the total walkway width (ft)", v_ Wt PROMPT "Please enter the sum of widths and shy distances
from obstructions on the walkway (ft)", v _ Wo
Termination Logic: IF v_ Wo >= v_ Wt THEN
DISPLAY "The walkway obstruction value is greater than or equal to the total walkway width. Please re-enter values. "
} ELSE { v_WE =v_Wt - v_Wo v_ VP = v_ V 1 5 I ( 1 5 * v_WE) m_LOS }
************************** ******************************************* *** * Locations * ********************************************************************* ***
Name Cap Units Stats Rules Cost
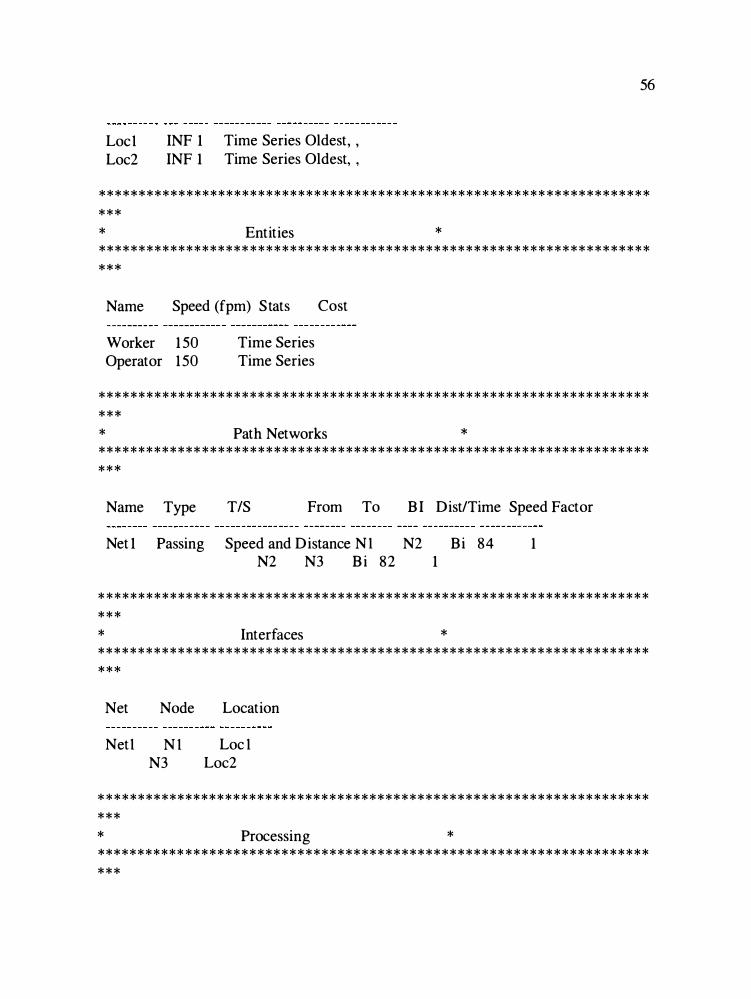
Locl Loc2
INF 1 INF 1
Time Series Oldest, , Time Series Oldest, ,
56
* * * * * * * * * * * * * * * * * * * * * * * * * * * * * * * * * * * * * * * * * * * * * * * * * * * * * * * * * * * * * * * * * * * * * * * * * Entities * * * * * * * * * * * * * * * * * * * * * * * * * * * * * * * * * * * * * * * * * * * * * * * * * * * * * * * * * * * * * * * * * * * * * * * * *
Name Speed (fpm) S tats
Worker 150 Operator 150
Time Series Time Series
Cost
* * * * * * * * * * * * * * * * * * * * * * * * * * * * * * * * * * * * * * * * * * * * * * * * * * * * * * * * * * * * * * * * * * * * * * * * * Path Networks * * * * * * * * * * * * * * * * * * * * * * * * * * * * * * * * * * * * * * * * * * * * * * * * * * * * * * * * * * * * * * * * * * * * * * * * *
Name Type TIS From To BI Dist/Time Speed Factor
Netl Passing Speed and Distance Nl N2 Bi 84 1 N2 N3 Bi 82 1
* * * * * * * * * * * * * * * * * * * * * * * * * * * * * * * * * * * * * * * * * * * * * * * * * * * * * * * * * * * * * * * * * * * * * * * * * Interfaces * * * * * * * * * * * * * * * * * * * * * * * * * * * * * * * * * * * * * * * * * * * * * * * * * * * * * * * * * * * * * * * * * * * * * * * * *
Net Node
Netl N l N3
Location
Lo c l Loc2
* * * * * * * * * * * * * * * * * * * * * * * * * * * * * * * * * * * * * * * * * * * * * * * * * * * * * * * * * * * * * * * * * * * * * * * * * Processing * * * * * * * * * * * * * * * * * * * * * * * * * * * * * * * * * * * * * * * * * * * * * * * * * * * * * * * * * * * * * * * * * * * * * * * * *
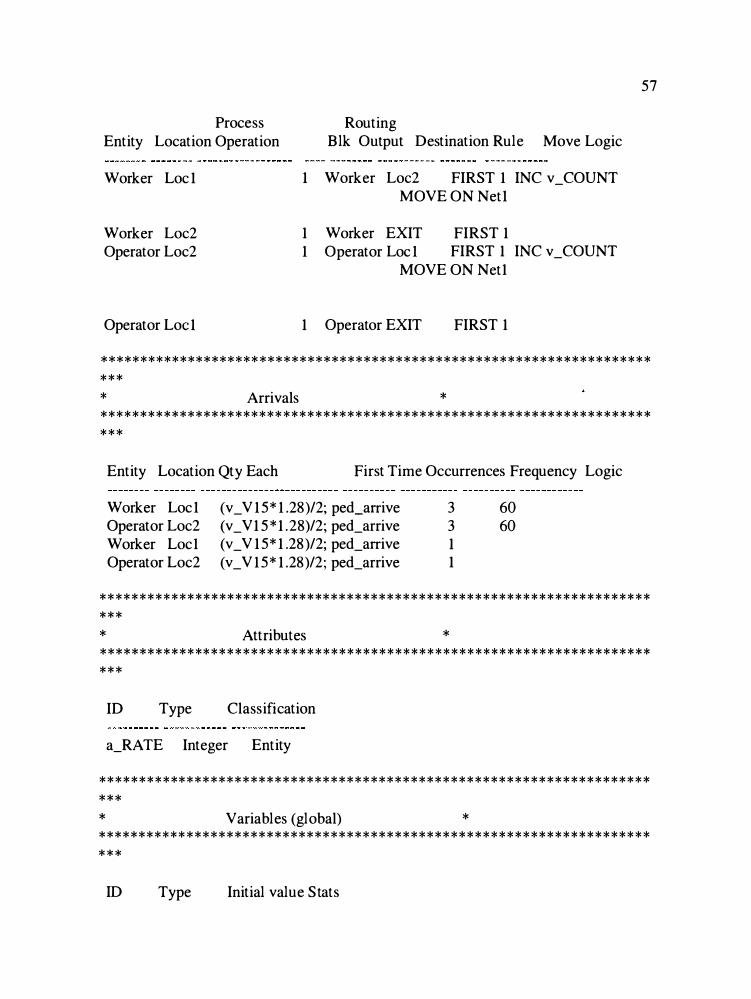
Process Entity Location Operation
Worker Loc l
Worker Loc2 Operator Loc2
Operator Loe 1
Routing Blk Output Destination Rule Move Logic
1 Worker Loc2 FIRST 1 INC v_COUNT MOVE ON Netl
1 Worker EXIT FIRST 1 1 Operator Loc l FIRST 1 INC v_COUNT
MOVE ON Netl
1 Operator EXIT FIRST 1
57
******************** ************************************************* *** * Arrivals * *********************** ********************************************** ***
Entity Location Qty Each First Time Occurrences Frequency Logic
Worker Locl Operator Loc2 Worker Locl Operator Loc2
(v_ V15*1.28)/2; ped_arrive (v_ V15 *1.28)/2; ped_arrive (v_ V15*1.28)/2; ped_arrive (v_ V15*1.28)/2; ped_arrive
3 3 1 1
60 60
********************************************************************* *** * Attributes * ********************************************************************* ***
ID Type Classification
a_RA TE Integer Entity
********************************************************************* *** * Variables (global) * *********** ********************************************************** * * *
ID Type Initial value S tats
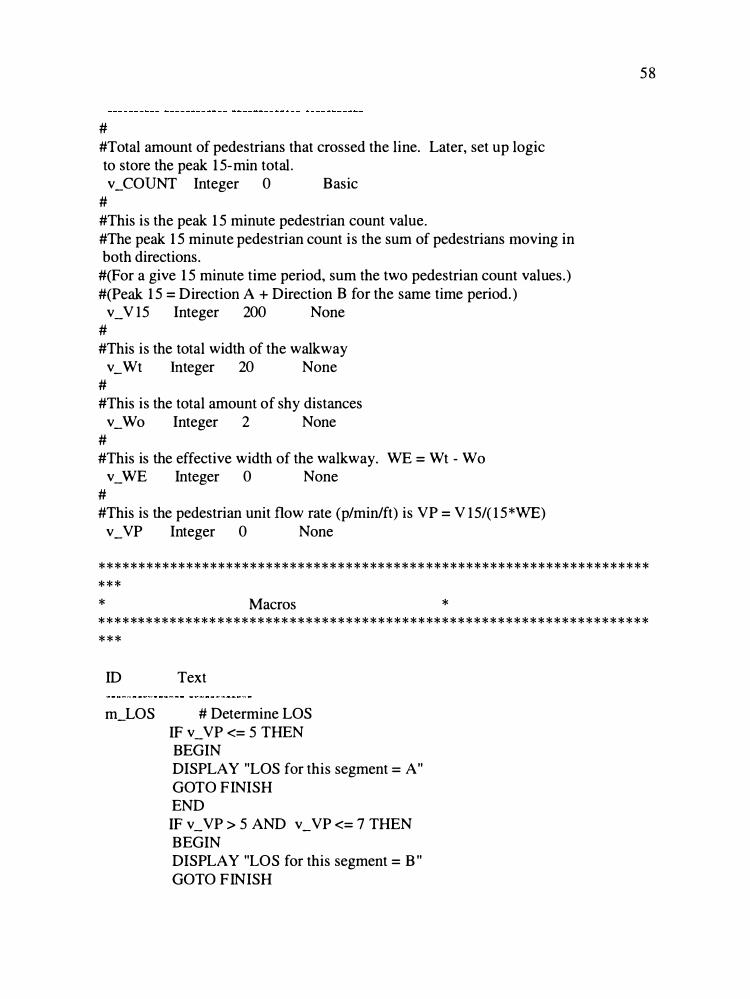
# #Tota l amount of pedestrians that crossed the line. Later, set up logic to store the peak 15-min tota l. v _CO UN T Integer 0 Basic
# #This is the peak 15 minute pedestrian count va lue. #The peak 15 minute pedestrian count is the sum of pedestrians moving in both directions. #(For a give 15 minute time period , sum the two pedestrian count va lues.) #(Pe ak 15 = Direction A + Direction B f or the same time period.) v _ V l5 Integer 200 None
# #This is the tota l width of the wa lkway v _Wt Integer 20 None
# #This is the tota l amount of shy distances v _ Wo Integer 2 None
# #This is the e ffective width of the wa lkway. W E = Wt - Wo v _W E Integer 0 None
# #This is the pedestrian unit flow rate (p/min/ft) is VP = V l5/ ( l5 *WE) v _VP Integer 0 None
5 8
***************************************** **************************** *** * Macros * *************** ********* ********************************************* ***
ID Text
m _LO S # Determine LO S IF v _ VP <= 5 T HE N B E GIN DISP L A Y "LO S f or this segment = A " GO TO F IN ISH E N D
IF v _VP > 5 A N D v _VP <= 7 T HE N B E GIN DISP L A Y "LO S for this segment = B " GO TO F IN ISH
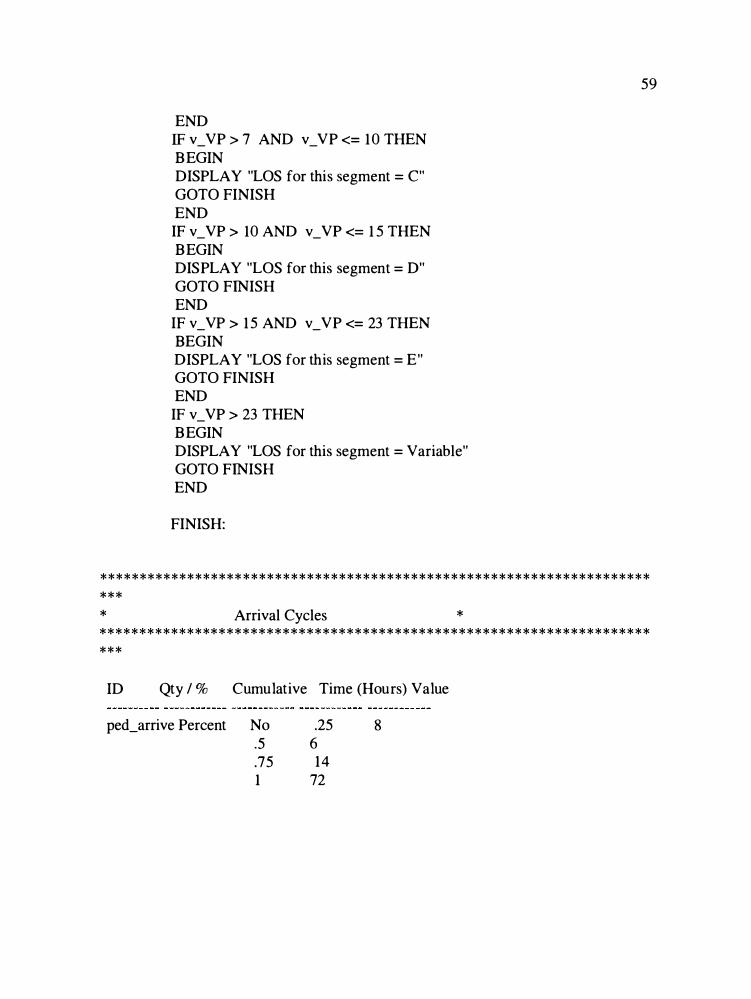
END IF v_ VP > 7 AND v_ VP <= 10 THEN BEGIN DISPLAY "LOS for this segment = C" GOTO FINISH END IF v_ VP > 10 AND v_ VP <= 15 THEN BEGIN DISPLAY "LOS for this segment = D" GOTO FINISH END
IF v_ VP > 15 AND v_ VP <= 23 THEN BEGIN DISPLAY "LOS for this segment = E" GOTO FINISH END
IF v_ VP > 23 THEN BEGIN DISPLAY "LOS for this segment = Variable" GOTO FINISH END
FINISH:
59
* * * * * * * * * * * * * * * * * * * * * * * * * * * * * * * * * * * * * * * * * * * * * * * * * * * * * * * * * * * * * * * * * * * * * * * * * Arrival Cycles * * * * * * * * * * * * * * * * * * * * * * * * * * * * * * * * * * * * * * * * * * * * * * * * * * * * * * * * * * * * * * * * * * * * * * * * *
ID Qty I % Cumulative Time (Hours) Value
ped_arrive Percent No .5 .75 1
.25 6 14
72
8
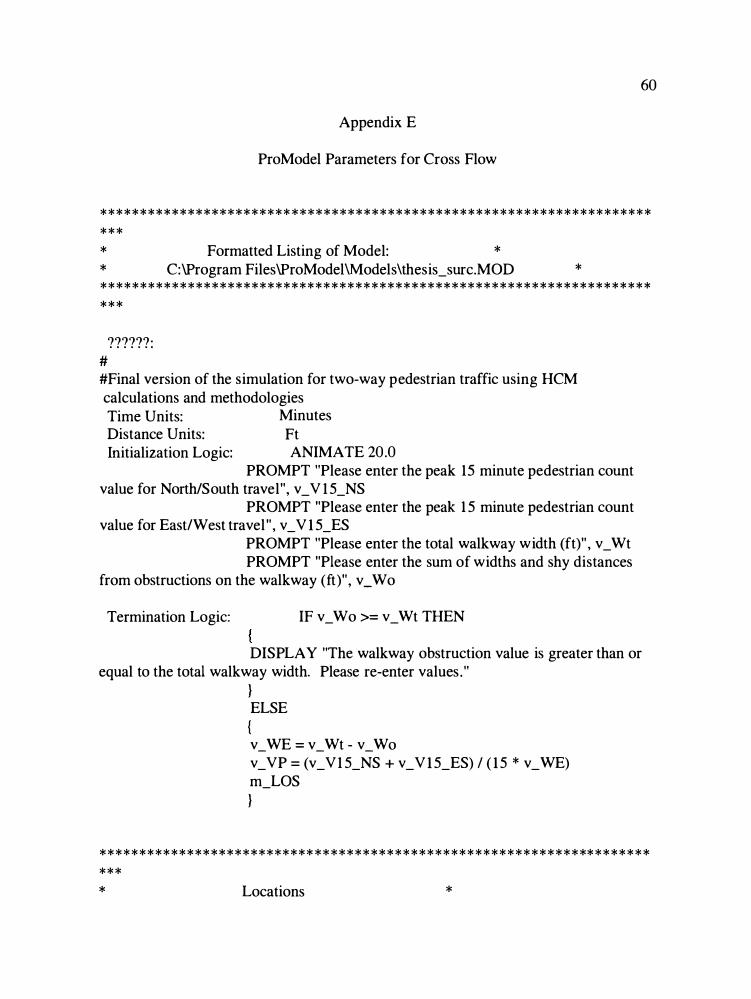
60
Appendix E
ProModel Parameters for Cross Flow
************************ ********************************************* *** * *
Formatted Listing of Model: * C:\Program Files\ProModel\Models\thesis_surc.MOD *
********************************************************************* ***
??????: # #Final version of the simulation for two-way pedestrian traffic using HCM calculations and methodologies Time Units: Minutes Distance Units: Ft Initialization Logic: ANIMATE 20.0
PROMPT "Please enter the peak 15 minute pedestrian count value for North/South travel", v_ V l 5_NS
PROMPT "Please enter the peak 1 5 minute pedestrian count value for East/West travel", v _ V 1 5 _ES
PROMPT "Please enter the total walkway width (ft)" , v_ Wt PROMPT "Please enter the sum of widths and shy distances
from obstructions on the walkway (ft)", v_ Wo
Termination Logic: IF v_ Wo >= v_ Wt THEN
DISPLAY "The walkway obstruction value is greater than or equal to the total walkway width. Please re-enter values."
} ELSE
{ v_WE = v_Wt - v_Wo v_ VP = (v_ Vl 5_NS + v_ V1 5_ES) I ( 1 5 * v_ WE) m_LOS
}
*************************** ****************************************** *** * Locations *
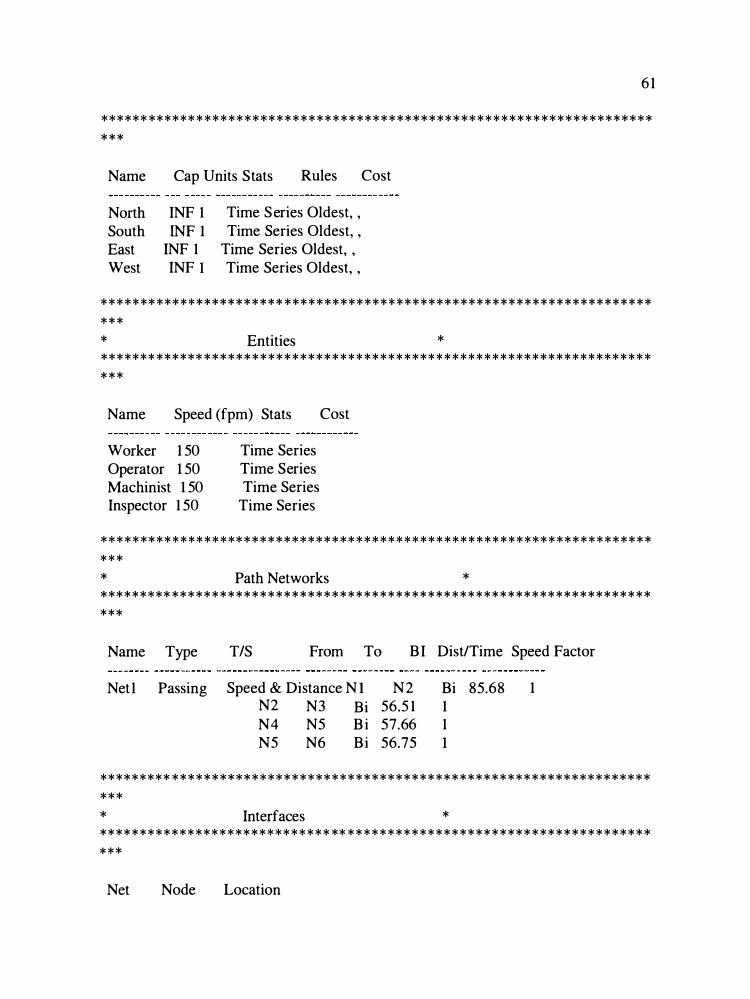
61
* * * * * * * * * * * * * * * * * * * * * * * * * * * * * * * * * * * * * * * * * * * * * * * * * * * * * * * * * * * * * * * * * * * * * * * *
Name
North South East West
Cap Units Stats Rules
INF 1 INF 1
INF 1 INF 1
Time Series Oldest, , Time Series Oldest, ,
Time Series Oldest, , Time Series Oldest, ,
Cost
* * * * * * * * * * * * * * * * * * * * * * * * * * * * * * * * * * * * * * * * * * * * * * * * * * * * * * * * * * * * * * * * * * * * * * * * * Entities * * * * * * * * * * * * * * * * * * * * * * * * * * * * * * * * * * * * * * * * * * * * * * * * * * * * * * * * * * * * * * * * * * * * * * * * *
Name Speed (fpm) Stats
Worker 1 50 Operator 1 50 Machinist 1 50 Inspector 1 50
Time Series Time Series Time Series
Time Series
Cost
* * * * * * * * * * * * * * * * * * * * * * * * * * * * * * * * * * * * * * * * * * * * * * * * * * * * * * * * * * * * * * * * * * * * * * * * * Path Networks * * * * * * * * * * * * * * * * * * * * * * * * * * * * * * * * * * * * * * * * * * * * * * * * * * * * * * * * * * * * * * * * * * * * * * * * *
Name Type
Netl Passing
TIS From To BI Dist/Time Speed Factor
Speed & Distance N l N2 N3 Bi N4 N5 B i N5 N6 Bi
N2 56.5 1 57.66 56.75
Bi 85.68 1 1 1
1
* * * * * * * * * * * * * * * * * * * * * * * * * * * * * * * * * * * * * * * * * * * * * * * * * * * * * * * * * * * * * * * * * * * * * * * * * Interfaces * * * * * * * * * * * * * * * * * * * * * * * * * * * * * * ** * * * * * * * * * * * * * * * * * * * * * * * * * * * * * * * * * * * * * * * * *
Net Node Location
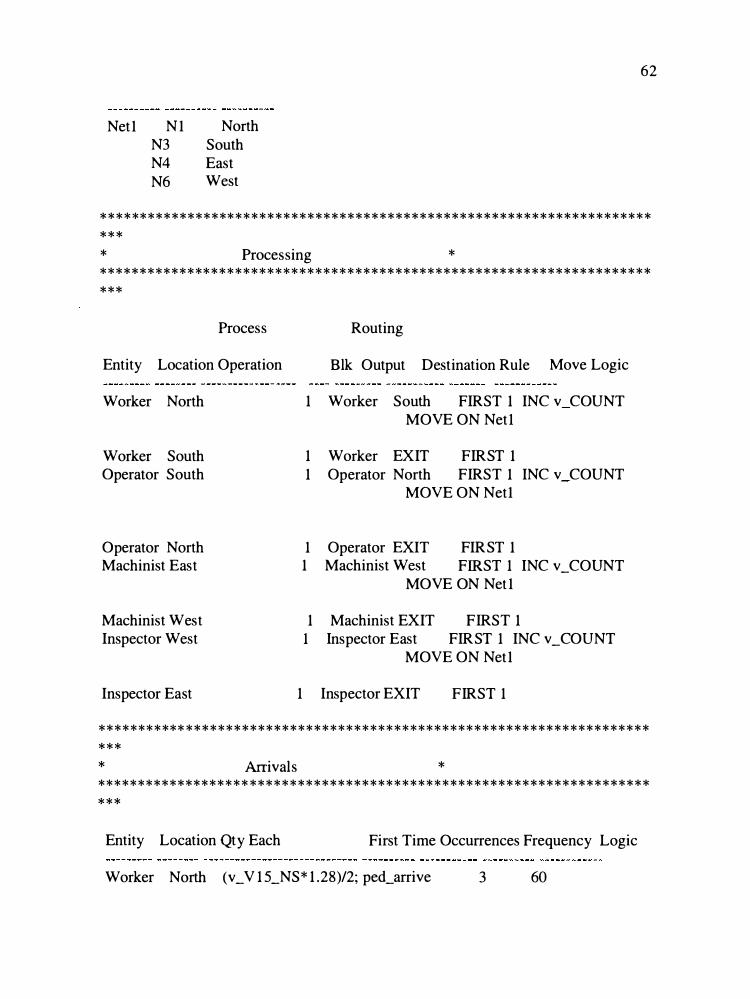
Net l N l North N3 South N 4 Ea st N 6 We st
62
********************************************************************* *** * Proce ssing * ********************************************************************* ***
Proce ss
Entity Location Operation
Worker North
Worker South Operator South
Operator North Machini st Ea st
Machini st We st In spector We st
In spector Ea st
Routing
Blk Output De stination Rule Move Logic
1 Worker Sou th F IRS T 1 IN C v C OUN T M OVE ON Net l
1 Worker E XIT F IRS T 1 1 Operator North F IRS T 1 IN C v C OUN T
M OVE ON Net l
1 Operator E XIT F IRS T 1 1 Machini st We st F IRS T 1 IN C v _C OUN T
M OVE ON Net l
1 Machini st E XIT F IRS T 1 1 In spector Ea st F IRS T 1 IN C v _C OUN T
M OVE ON Net l
1 In spector E XIT F IRS T 1
*********** ********************************************************** *** * Arrival s * ******************* ************************************************** ***
Entity Location Qty Each Fir st Time Occurrence s Frequency Logic
Worker Nor th (v _ V 15 _NS * 1.28)/2 ; ped _arrive 3 60
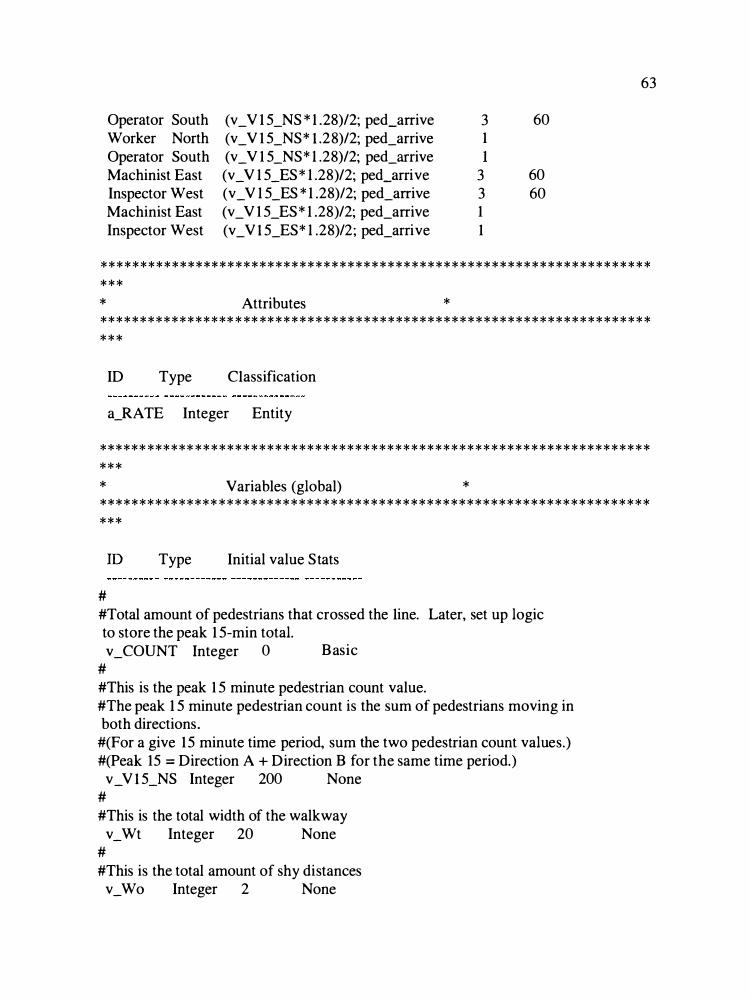
Operator South Worker North Operator South Machinist East Inspector West Machinist East Inspector West
(v_ V 1 5_NS * l .28)/2; ped_arrive (v_ V 1 5_NS* l .28)/2; ped_arrive (v_ V 1 5_NS* l .28)/2; ped_arrive (v_ V l 5_ES* l .28)/2; ped_arrive (v_ V l 5_ES * l .28)/2; ped_arrive (v_ V 1 5_ES* l .28)/2; ped_arrive (v_ Vl5_ES* l .28)/2; ped_arrive
3 1 I
3 3 1 1
60
60 60
63
********************************************************************* *** * Attributes * ***************** * ** ************************************************* ***
ID Type Classification
a_RATE Integer Entity
****** ****** ********************************************************* *** * Variables (global) * *************** ****************************************************** ***
ID Type Initial value Stats
# #Total amount of pedestrians that crossed the line. Later, set up logic to store the peak 1 5-min total. v_COUNT Integer 0 Basic
# #This is the peak 1 5 minute pedestrian count value. #The peak 1 5 minute pedestrian count is the sum of pedestrians moving in both directions.
#(For a give 15 minute time period, sum the two pedestrian count values.) #(Peak 15 = Direction A + Direction B for the same time period.)
v_ V l5_NS Integer 200 None # #This is the total width of the walkway
v _Wt Integer 20 None # #This is the total amount of shy distances
v_ Wo Integer 2 None
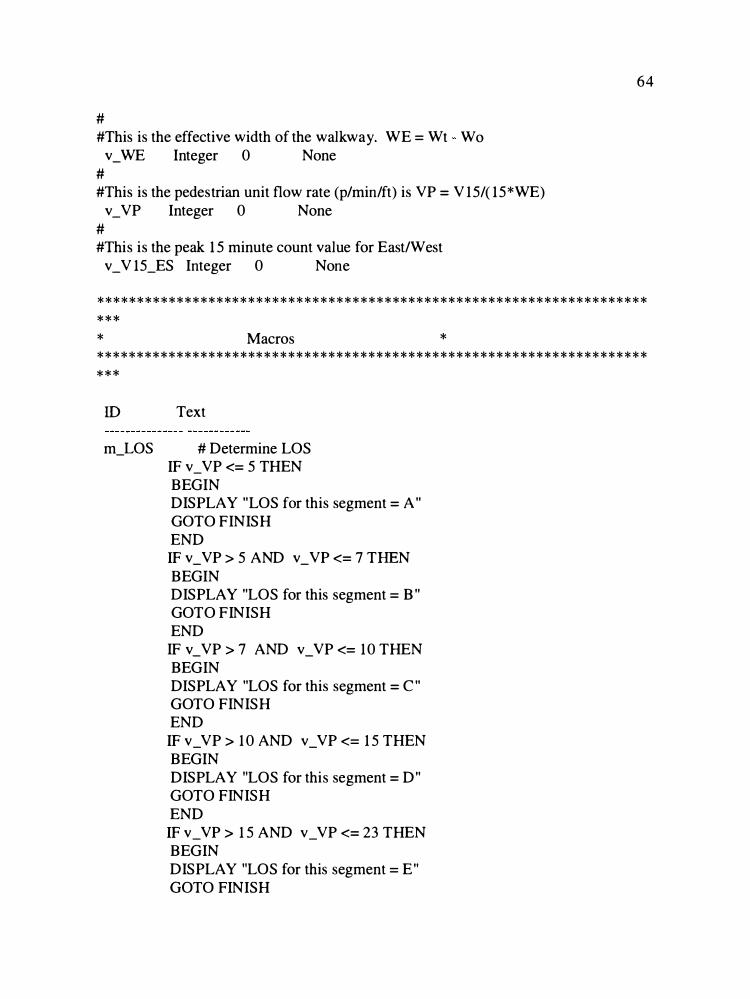
# #Thi s i s the e ffective width of the wa lkway . W E = Wt Wo v _W E Integer 0 None
# #Thi s i s the pede strian unit flow rate (p/mi n/ft) i s VP = V l5/ (15 *W E) v _ VP Integer 0 None
# #Thi s i s the peak 15 minute count va lue for Ea st/ We st v _ V15 _ES Integer 0 No ne
64
********************************************************************* *** * Macro s * ********************************************************************* ***
ID Text
m _LOS # Determine LOS IF v _ VP <= 5 T HE N B E GIN DIS P L AY "LOS f or thi s segment = A" GO TO F IN IS H E N D
IF v _VP > 5 AN D v _VP <= 7 T HEN B E GIN DIS P L AY "LOS for thi s segment = B " GO TO F IN IS H E N D
IF v _ VP > 7 AN D v _ VP <= 10 T HE N B E GIN DIS P L AY "LOS for thi s segment = C " GO TO F IN IS H E N D
IF v _ VP > 10 AN D v _ VP <= 15 T HE N B E GIN DIS P L AY "LOS for thi s segment = D" GO TO F IN IS H E N D
IF v _ VP > 15 AN D v _ VP <= 23 T HE N B E GIN DIS P L AY "LOS for thi s segment = E " GO TO F IN IS H
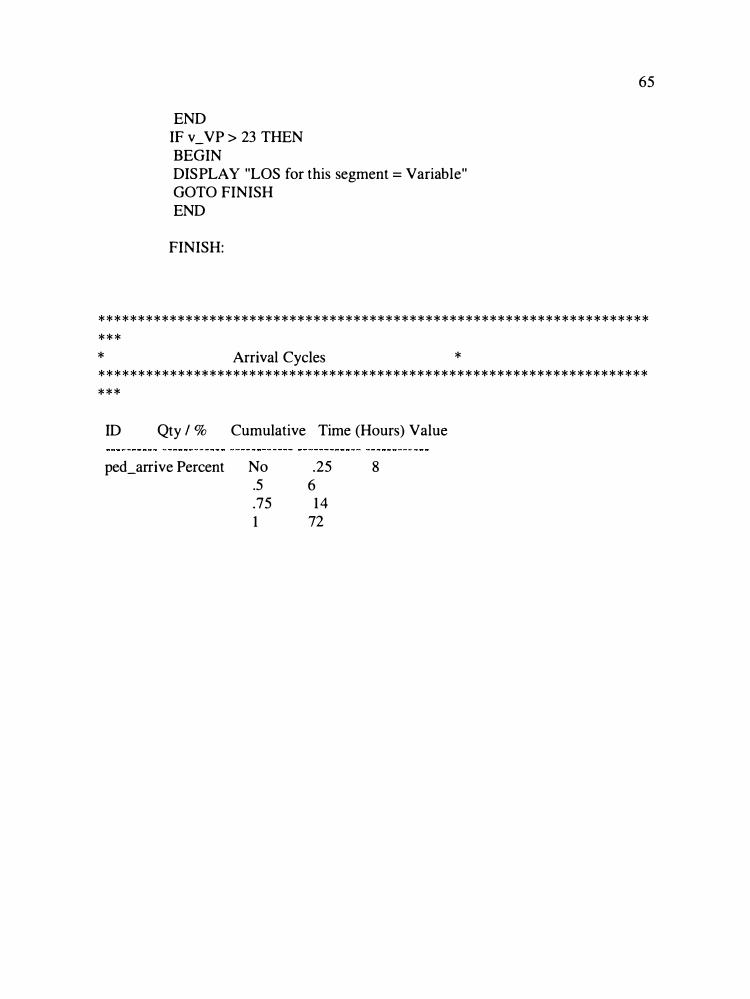
END IF v_ VP > 23 THEN BEGIN DISPLAY "LOS for this segment = Variable" GOTO FINISH END
FINISH:
65
* * * * * * * * * * * * * * * * * * * * * * * * * * * * * * * * * * * * * * * * * * * * * * * * * * * * * * * * * * * * * * * * * * * * * * * * * Arrival Cycles * * * * * * * * * * * * * * * * * * * * * * * * * * * * * * * * * * * * * * * * * * * * * * * * * * * * * * * * * * * * * * * * * * * * * * * * *
ID Qty / %
ped_arrive Percent
Cumulative Time (Hours) Value
No .5 .75 1
.25 6 14
72
8

+ 4- +
I : . ± +
+
II · +
� !9� ... �� J � I - t - .+ ... '+ + + + + t +
t
T f
,.-
+ +
+ + + +
---•
+ + + + + + + + + + + +
+ .... + + + + + + + + ( + + + + + +
+ + + + + + + + + + + + + + + +
20 FI' +- + + + + + + +
+ ( + + + + + + + + + + + + +
+ + + + + + + + + + + + +_ + + + + + + +
� + + + + + + + + + + + + + + + + + +
+ + + + + + + + + + + + + + + + + +
' + + + + • n.wnm + + +
+ C!] NOllWAWNO ..,.c& + + +
Figure F 1. ProModel simulation model screen shot of Location 1 (Randall Hall).
� · + + +
+ +
�r /J �
+ + + + + +
+ + + + + +
+ + + + + +
+ + + + + +
+ + + + + +
+ + + + + + +
+ + + .... + + +
+ + + + + + +
+ + + + + +
� .., 0 s:: 0 Q. ('l) -Cl'.l ... .
3 i:: -� ... .
0 = s:: 0 Q. ('l) -Cl'.l 0
� Cl'.l ::r 0 ..... <:I'
> 'i:::I 'i:::I g Q. �· "T1
O'I O'I
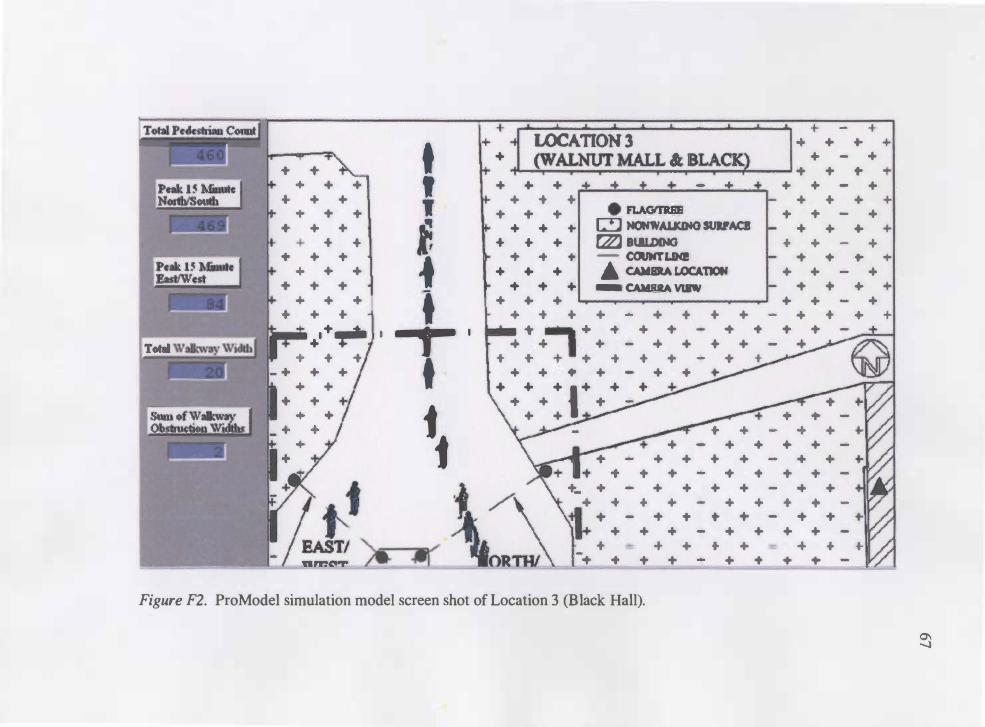
+ + + +
+ + + +
.. .. + +
+ + + +
+ + + + ...
•• +
�
+ + + +
+ + +
t ' I �
� f t
-r · t
ff
+ I t I 6 I I A
+ j LOCATION 3 + ��MAL� &:0B�CK) + + + + + +
+ + + .... .....
__.. ....
+
+ + + r-•-
+ + + l2J HONWALXINO SUlrACI .. ... + rZJ ll.ILDINO
+ + + - COUNTLINI! + + + • CAMBIA LOCATION
+ + + - CAMBIA VlBYi
+
·1 · + + -
+ + + + - +
+ + + + + + +
+ + + + + + +
+ + + + + + +
+ + + + + + +
+ + + + + + + + + +
+ + + + + + + + + ... -. + + + + - + + + +
+ + L I + - + + + + - + + + + + + + + - + t
+ + ... + + • • +
I+ . ..
+ + + -+ + +
+ + +
+ + + + + + + +
+ + + + + + + + + + + +
·j /'
===�= ORTW
+ + + + + + + + + + - + + + + :ti + - + + + + - + + + )I+ + + + - + + + + -
+ .. + + + + + • -+ + + + + + +
Figure F2. ProModel simulation model screen shot of Location 3 (Black Hall).