development and evaluation of a closed-loop control system
TRANSCRIPT

AgriEngineering
Article
Development and Evaluation of a Closed-LoopControl System for Automation of a MechanicalWild Blueberry Harvester’s Picking Reel
Travis J. Esau 1,*, Craig B. MacEachern 1, Qamar U. Zaman 1 and Aitazaz A. Farooque 2
1 Department of Engineering, Dalhousie University Faculty of Agriculture,Truro, NS B2N 5E3, Canada; [email protected] (C.B.M.); [email protected] (Q.U.Z.)
2 School of Sustainable Design Engineering, University of Prince Edward Island,Charlottetown, PE C1A 4P3, Canada; [email protected]
* Correspondence: [email protected]
Received: 26 May 2020; Accepted: 8 June 2020; Published: 11 June 2020�����������������
Abstract: Mechanical harvesting of wild blueberries remains the most cost-effective means forharvesting the crop. Harvesting of wild blueberries is heavily reliant on operator skill and fullautomation of the harvester will rely on precise and accurate determination of the picking reel’s height.This study looked at developing a control system which would provide feedback on harvester pickingreel height on up to five harvester heads. Additionally, the control system looked at implementingthree quality of life improvements for operators, operating multiple heads until the point whenfull automation is achieved. These three functions were a tandem movement function, a baselinefunction, and a set-to-one function. Each of these functions were evaluated for their precision andaccuracy and returned absolute mean discrepancies of 3.10, 2.20, and 2.50 mm respectively. Bothelectric and hydraulic actuators were evaluated for their effectiveness in this system however, theelectric actuator was simply too slow to be deemed viable for the commercial harvesters. To achievethe full 203.2 mm stroke required by the harvester head, the electric actuator required 13.96 s whilethe hydraulic actuator required only 2.30 s under the same load.
Keywords: control system; agriculture; hydraulics precision machinery; wild blueberry; harvester
1. Introduction
Wild blueberries (Vaccinium angustifolium) are a perennial, small fruit crop which are typicallymanaged on a biennial cycle in order to maximize yields and apply pesticides which otherwise woulddamage the crop [1–7]. This two-year cycle sees vigorous vegetative growth in the first year followedby flower and fruit production in the second year. Following harvest of the crop, fields are pruned andthe cycle repeats itself. Wild blueberries are native to northeastern North America and represent one ofNova Scotia’s most important agricultural products, with an export value of $76.3 million in 2017 [8].That said, with rising labor costs, low fruit prices, and per hectare expenses nearing $4000 for normaloperation, there is a significant demand within the industry to find ways of cutting costs [9,10].
Mechanical wild blueberry harvesters were first developed in 1956 by modifying an existingcranberry picker for the wild blueberry crop. This original harvester utilized six raking combs rotatingopposite the direction of travel and was prone to high fruit losses and soil digging [11]. In subsequentyears, the design was improved upon to include many of the features common to the modern design.These include the advent of the hollow picking reel, variable speed picking heads, picking head rotationconcurrent with the direction of travel, and hydraulic control of the picking head height [12–14].Currently, there is only one large scale producer of wild blueberry harvesters, that being Doug BraggEnterprises (DBE) in Collingwood, Nova Scotia. The DBE harvester is a side mounted tractor implement
AgriEngineering 2020, 2, 322–335; doi:10.3390/agriengineering2020022 www.mdpi.com/journal/agriengineering
AgriEngineering 2020, 2 323
which, harvests, removes debris and stores wild blueberries in either large bins (1.22 × 1.22 × 0.3 m) orsmall boxes (0.4 × 0.51 × 0.15 m) depending on the configuration of the handling system. DBE hasbeen the driving force behind many of the efficiency improvements done to the harvester including,the implementation of the hydraulic control system for precise harvester head height control. A singlehydraulic actuator with a 203.2 mm stroke moves the picking point up or down a total of 101.6 mm.Maintaining the picking point at the correct level is essential to maximizing harvester picking efficiencyand doing so requires near constant manipulation by the operator [15]. For a single or double headedmachine this is possible, but as the company intends to add more heads to their machines in future, theneed to design a control system for these larger machines is critical. Additionally, the company aims totransition towards an automated head for their harvesters.
Automated crop harvesting has seen some success in greenhouses, row crops, and tree crops [16–24],however the unique environment of wild blueberry fields create a number of further challenges. The firstchallenge is the drastic variations in slope within wild blueberry fields. Zaman et al. [25] foundthat across four fields the slope varied from 0.8 to 31.0 degrees. This drastic variation in slope, bothwithin fields and between fields, requires a large degree of adaptability for an autonomous harvester.Secondly, the location of the fruit on the blueberry plant also varies significantly. Farooque et al. [15]found that fruit zones across four fields varied from 74.0 mm to 346.0 mm off the ground. Couplingthese two factors together demonstrates the required variability in harvester head height positionduring harvest. In order to automate this process, the first step is to develop a system which preciselyand accurately provides feedback for head height positioning. Additionally, as the industry aims tomove toward multi-headed machines, this factor must be incorporated into the design of the newcontrol system. Finally, the developed control system should provide quality of life improvements forharvester operators, operating multiple heads, until the point where full automation can be achieved.
Similar control and feedback systems have been employed previously in agricultural machinery.Examples include feedback and control of chopping parameters on combine harvesters [26],semi-automated combine harvesters [27], real time soil property feedback in tillage operations [28],soil moisture sensing and actuation of irrigation valves [29], product flow monitoring on sprayers [30],pressure and flow dynamics on sprayers [31], automation of crop residue spreaders on combineharvesters [32] and motion analysis for control of variable rate spreaders [33]. While there are hundredsof other examples, what each of these systems have in common is that they use and provide feedbackfrom a sensor and allow either the manual or automatic operation of an actuator. Currently, wildblueberry harvesters provide very little in the way of feedback beyond picker reel speed. This projectaims to improve upon that by adding precise picker head height while meeting a number of otherindustry demands.
The industry’s outline for this project was to develop a control system which could precisely andaccurately control multiple harvester heads within a tolerance of 20 mm of one another. This 20 mmdiscrepancy was used as a successful minimum standard in all tests. Current controller designs do notallow for the operation of multiple heads on a single control box. Furthermore, DBE was looking fora number of quality-of-life improvements including the tandem operation, baseline and set-to-onefunctions as well as numeric positional feedback for the operator. Each of these ameliorations wereincluded in the design of the novel control box with detail on their success available throughoutthe document.
2. Materials and Methods
2.1. Development of Novel Control System
The basis for the novel control system was an Arduino mega controller (A000067, Arduino, Turin,Italy) operated in a closed loop, drawing feedback from a linear potentiometer as shown in Figure 1.The Arduino’s control algorithm produced a counting integer (set value) that was scaled to match thefeedback from the potentiometer. This set value was controlled by a three-position momentary rocker

AgriEngineering 2020, 2 324
switch which scaled values up or down within the range of the actuator (minimum of 0 mm, maximumof 203.2 mm). In this way, if the feedback from the potentiometer did not match the set value, theactuator would be told to move up or down to compensate for the difference. When the value wasdeemed to be the same, no signal is sent and the actuator does not move. To account for any analognoise which might be interpreted as a difference by the system, a programed tolerance variable wasincorporated and fine-tuned to match the constraints of the harvester. In all, the system was designedto operate up to five harvester heads at a time by incorporating a rocker switch for each head.
AgriEngineering 2020, 2 324
Figure 1. The Arduino’s control algorithm produced a counting integer (set value) that was scaled to match the feedback from the potentiometer. This set value was controlled by a three-position momentary rocker switch which scaled values up or down within the range of the actuator (minimum of 0 mm, maximum of 203.2 mm). In this way, if the feedback from the potentiometer did not match the set value, the actuator would be told to move up or down to compensate for the difference. When the value was deemed to be the same, no signal is sent and the actuator does not move. To account for any analog noise which might be interpreted as a difference by the system, a programed tolerance variable was incorporated and fine-tuned to match the constraints of the harvester. In all, the system was designed to operate up to five harvester heads at a time by incorporating a rocker switch for each head.
Figure 1. Block diagram of developed control system showing user input to microcontroller and feedback from each potentiometer for reel height positioning on DBE wild blueberry harvester.
The original design for the control system utilized two single-pole double-throw mechanical relays (SLA-05VDC-SL-C, Ningbo Songle Relay Co., LTD, Yuyao, China) to control the actuator. The normally closed connection was used to maintain the actuator in in static state while the two normally open connections were used to operate the actuator, one for each direction of travel. This first prototype of the control system had some complications however, as it was prone to signal interference which caused the relays to switch unpredictably. Furthermore, the nature of mechanical relays is that they wear out with heavy use and due to the high number of inputs required in this system, they do not make the best choice. As a replacement, two H-bridge motor drivers (RB-Pol-381, Pololu, Las Vegas, NV, USA) were used in their place. These H-bridges utilize solid state MOSFET transistors, which are faster and more reliant than mechanical relays. By replacing the mechanical relays with H-bridges the experienced signal interference was eliminated. The full wiring of the control box can be observed in Figure 2.
Figure 1. Block diagram of developed control system showing user input to microcontroller andfeedback from each potentiometer for reel height positioning on DBE wild blueberry harvester.
The original design for the control system utilized two single-pole double-throw mechanical relays(SLA-05VDC-SL-C, Ningbo Songle Relay Co., LTD, Yuyao, China) to control the actuator. The normallyclosed connection was used to maintain the actuator in in static state while the two normally openconnections were used to operate the actuator, one for each direction of travel. This first prototypeof the control system had some complications however, as it was prone to signal interference whichcaused the relays to switch unpredictably. Furthermore, the nature of mechanical relays is that theywear out with heavy use and due to the high number of inputs required in this system, they do notmake the best choice. As a replacement, two H-bridge motor drivers (RB-Pol-381, Pololu, Las Vegas,NV, USA) were used in their place. These H-bridges utilize solid state MOSFET transistors, which arefaster and more reliant than mechanical relays. By replacing the mechanical relays with H-bridges theexperienced signal interference was eliminated. The full wiring of the control box can be observed inFigure 2.
In addition to the basic functionality of the control system, three further functions were added tothe control box. The first was the tandem function which, locks multiple harvester heads together at aset distance and allows them all to be moved at the same time using a single switch while maintainingthe set distance. The second was the baseline function which, allows the user to define a pre-setposition and through the press of a single button, returns a single or all heads to the baseline position.The final function was the set-to-one function which allows the user to move a single or all heads to the

AgriEngineering 2020, 2 325
same position as the first head through the press of a single button. The control system also providedindividual or tandem control for up to five harvester heads. Finally, the system included a ‘calibrate’function which extended the actuator to its maximum and then its minimum and set the displayedminimum and maximum at these extension values. All of the positioning feedback was relayed to theoperator via a 20 × 4 I2C-LCD (QK51, Quimat, Shenzhen, China). The developed control box can beobserved in Figure 3.
AgriEngineering 2020, 2 325
Figure 2. Wiring of developed control box for precise actuator positioning on a DBE wild blueberry harvester.
In addition to the basic functionality of the control system, three further functions were added to the control box. The first was the tandem function which, locks multiple harvester heads together at a set distance and allows them all to be moved at the same time using a single switch while maintaining the set distance. The second was the baseline function which, allows the user to define a pre-set position and through the press of a single button, returns a single or all heads to the baseline position. The final function was the set-to-one function which allows the user to move a single or all heads to the same position as the first head through the press of a single button. The control system also provided individual or tandem control for up to five harvester heads. Finally, the system included a ‘calibrate’ function which extended the actuator to its maximum and then its minimum and set the displayed minimum and maximum at these extension values. All of the positioning feedback was relayed to the operator via a 20 × 4 I2C-LCD (QK51, Quimat, Shenzhen, China). The developed control box can be observed in Figure 3.
Figure 3. Front of control system showing each of the control functions and display.
2.2. Design Considerations
Two separate designs were considered for how best to receive positional feedback from the linear actuator. The first was to utilize an electric linear actuator [34] with a built in potentiometer.
Figure 2. Wiring of developed control box for precise actuator positioning on a DBE wild blueberryharvester.
AgriEngineering 2020, 2 325
Figure 2. Wiring of developed control box for precise actuator positioning on a DBE wild blueberry harvester.
In addition to the basic functionality of the control system, three further functions were added to the control box. The first was the tandem function which, locks multiple harvester heads together at a set distance and allows them all to be moved at the same time using a single switch while maintaining the set distance. The second was the baseline function which, allows the user to define a pre-set position and through the press of a single button, returns a single or all heads to the baseline position. The final function was the set-to-one function which allows the user to move a single or all heads to the same position as the first head through the press of a single button. The control system also provided individual or tandem control for up to five harvester heads. Finally, the system included a ‘calibrate’ function which extended the actuator to its maximum and then its minimum and set the displayed minimum and maximum at these extension values. All of the positioning feedback was relayed to the operator via a 20 × 4 I2C-LCD (QK51, Quimat, Shenzhen, China). The developed control box can be observed in Figure 3.
Figure 3. Front of control system showing each of the control functions and display.
2.2. Design Considerations
Two separate designs were considered for how best to receive positional feedback from the linear actuator. The first was to utilize an electric linear actuator [34] with a built in potentiometer.
Figure 3. Front of control system showing each of the control functions and display.
2.2. Design Considerations
Two separate designs were considered for how best to receive positional feedback from the linearactuator. The first was to utilize an electric linear actuator [34] with a built in potentiometer. The secondoption was to use the existing hydraulic actuator but incorporate an external linear potentiometerto provide positional feedback. While both designs accomplished the task of providing precise andaccurate positional feedback, ultimately, the hydraulic actuator and external linear potentiometerwere chosen due to their quicker actuation speeds, ease of installation, lower power requirements,and overall lower cost.

AgriEngineering 2020, 2 326
2.3. Harvester Modifications
In order to accommodate the developed control system, the harvester required only a singlemodification. This modification was the addition of an electric linear potentiometer in line with theexisting hydraulic actuator as can be seen in Figure 4.
AgriEngineering 2020, 2 326
The second option was to use the existing hydraulic actuator but incorporate an external linear potentiometer to provide positional feedback. While both designs accomplished the task of providing precise and accurate positional feedback, ultimately, the hydraulic actuator and external linear potentiometer were chosen due to their quicker actuation speeds, ease of installation, lower power requirements, and overall lower cost.
2.3. Harvester Modifications
In order to accommodate the developed control system, the harvester required only a single modification. This modification was the addition of an electric linear potentiometer in line with the existing hydraulic actuator as can be seen in Figure 4.
Figure 4. DBE harvester head showing the placement of the linear potentiometer in line with the hydraulic actuator.
The current design of the harvester allows for the potentiometer to be welded to the same fastening points as the actuator, ensuring that as little error as possible was introduced into the system. While other points on the harvester head where the potentiometer would see less wear and tear were considered, ultimately it was determined that they would not provide feedback as precise as the selected location.
For comparisons between the electric and hydraulic actuators, the two actuators can easily be swapped in and out via two hitch pins denoted as the top and bottom mounts in Figure 5; Figure 6.
Figure 4. DBE harvester head showing the placement of the linear potentiometer in line with thehydraulic actuator.
The current design of the harvester allows for the potentiometer to be welded to the samefastening points as the actuator, ensuring that as little error as possible was introduced into the system.While other points on the harvester head where the potentiometer would see less wear and tear wereconsidered, ultimately it was determined that they would not provide feedback as precise as theselected location.
For comparisons between the electric and hydraulic actuators, the two actuators can easily beswapped in and out via two hitch pins denoted as the top and bottom mounts in Figures 5 and 6.
AgriEngineering 2020, 2 327
Figure 5. DBE harvester head showing components of the hydraulic actuator setup.
Figure 6. DBE harvester head showing components of the electric actuator setup.
2.4. Lab Evaluation of Electric and Hydraulic Actuators
In order to assess the viability of both the electric and hydraulic actuators, a laboratory scale test was used to determine their actuation speeds both under and without load. First, the actuation speed was determined for both actuators when they were disconnected from the harvester head (no load). Being that the full stroke of both actuators is 203.2 mm, the speed is simple to calculate by timing a full stroke. Timing was performed manually and speeds were taken as the average of 16 samples for both the upward and downward stroke directions. Manual timing can introduce some degree of error; however, the speed determination did not require a high degree of accuracy to make a definite conclusion due to the significant difference in operational speeds between the two actuators. The actuators were then attached to the harvester heads (under load) as seen in Figures 5 and 6 and the same analysis was carried out to determine their actuation speeds under load and in both directions.
2.5. Field Evaluation Setup
For tests involving comparison between multiple actuators, a hydraulic linear actuator under the load of the harvester head was compared with an electric linear actuator under no load. This was done in order to assess the potential for a linear potentiometer to precisely and accurately provide positional feedback for a hydraulic actuator, similar to what is already incorporated with the electric actuator. The electric actuator was not placed under load as optimal system performance should see negligible differences regardless of load. All data collection was performed in triplicate and were blocked across two fields. The two fields used in this study were Dalhousie’s Wild Blueberry Research Centre’s Western field (45.441248, −63.451062) and the East Mines’ Northern field (45.427082, −63.481812) both in Debert, Nova Scotia. All data was analyzed using Fisher’s least significant difference (LSD) multiple means comparison.
Figure 5. DBE harvester head showing components of the hydraulic actuator setup.

AgriEngineering 2020, 2 327
AgriEngineering 2020, 2 327
Figure 5. DBE harvester head showing components of the hydraulic actuator setup.
Figure 6. DBE harvester head showing components of the electric actuator setup.
2.4. Lab Evaluation of Electric and Hydraulic Actuators
In order to assess the viability of both the electric and hydraulic actuators, a laboratory scale test was used to determine their actuation speeds both under and without load. First, the actuation speed was determined for both actuators when they were disconnected from the harvester head (no load). Being that the full stroke of both actuators is 203.2 mm, the speed is simple to calculate by timing a full stroke. Timing was performed manually and speeds were taken as the average of 16 samples for both the upward and downward stroke directions. Manual timing can introduce some degree of error; however, the speed determination did not require a high degree of accuracy to make a definite conclusion due to the significant difference in operational speeds between the two actuators. The actuators were then attached to the harvester heads (under load) as seen in Figures 5 and 6 and the same analysis was carried out to determine their actuation speeds under load and in both directions.
2.5. Field Evaluation Setup
For tests involving comparison between multiple actuators, a hydraulic linear actuator under the load of the harvester head was compared with an electric linear actuator under no load. This was done in order to assess the potential for a linear potentiometer to precisely and accurately provide positional feedback for a hydraulic actuator, similar to what is already incorporated with the electric actuator. The electric actuator was not placed under load as optimal system performance should see negligible differences regardless of load. All data collection was performed in triplicate and were blocked across two fields. The two fields used in this study were Dalhousie’s Wild Blueberry Research Centre’s Western field (45.441248, −63.451062) and the East Mines’ Northern field (45.427082, −63.481812) both in Debert, Nova Scotia. All data was analyzed using Fisher’s least significant difference (LSD) multiple means comparison.
Figure 6. DBE harvester head showing components of the electric actuator setup.
2.4. Lab Evaluation of Electric and Hydraulic Actuators
In order to assess the viability of both the electric and hydraulic actuators, a laboratory scaletest was used to determine their actuation speeds both under and without load. First, the actuationspeed was determined for both actuators when they were disconnected from the harvester head(no load). Being that the full stroke of both actuators is 203.2 mm, the speed is simple to calculateby timing a full stroke. Timing was performed manually and speeds were taken as the average of16 samples for both the upward and downward stroke directions. Manual timing can introduce somedegree of error; however, the speed determination did not require a high degree of accuracy to make adefinite conclusion due to the significant difference in operational speeds between the two actuators.The actuators were then attached to the harvester heads (under load) as seen in Figures 5 and 6 and thesame analysis was carried out to determine their actuation speeds under load and in both directions.
2.5. Field Evaluation Setup
For tests involving comparison between multiple actuators, a hydraulic linear actuator under theload of the harvester head was compared with an electric linear actuator under no load. This was donein order to assess the potential for a linear potentiometer to precisely and accurately provide positionalfeedback for a hydraulic actuator, similar to what is already incorporated with the electric actuator.The electric actuator was not placed under load as optimal system performance should see negligibledifferences regardless of load. All data collection was performed in triplicate and were blocked acrosstwo fields. The two fields used in this study were Dalhousie’s Wild Blueberry Research Centre’sWestern field (45.441248, −63.451062) and the East Mines’ Northern field (45.427082, −63.481812) bothin Debert, Nova Scotia. All data was analyzed using Fisher’s least significant difference (LSD) multiplemeans comparison.
2.6. Tandem Function Evaluation
The tandem function was evaluated by offsetting the actuators a given distance in a random orderand then adjusting them to a second, predetermined, and randomly selected position. In each of thecases, one of the actuators was positioned at the minimum stroke distance of 0 mm and the other wasoffset. A summary of the initial offset positions can be observed in Table 1.
Once the offset was locked in by the control system, the actuators were then moved to a second,predetermined position in a random order. The second positions were based off the reading from thelinear potentiometer and were 0, 25.4, 50.8, 76.2, 101.6, 127.0, 152.4, 177.8, and 203.2 mm of extension.It should be noted that not all combinations were possible for each test due to the values of theinitial offset. Additionally, following each adjustment the actuators were returned to their initialoffset position in order to account for any compounding error which might occur. All movements

AgriEngineering 2020, 2 328
were performed while the harvester was in motion and actively harvesting in order to account forthe vibrations of the harvesting process. Once the actuators were moved to their second position,measurements of their second position were recorded manually, using a ruler and compared versus theinitial offset to see how well the system maintained the offset. All tests were performed in triplicate.
Table 1. Initial offset conditions for tandem function evaluation with one actuator set to an initial strokeof 0 mm.
Extended Actuator Extension (mm)
Electric 50.8Electric 25.4None 0Hydraulic 25.4Hydraulic 50.8
A second similar test was performed where one of the actuators was set to the maximum extension(203.2 mm) and the other was retracted a predetermined distance. A summary of this initial conditioncan be observed in Table 2.
Table 2. Initial offset conditions for tandem function evaluation with one actuator set to an initial strokeof 203.2 mm.
Retracted Actuator Offset (mm)
Electric −50.8Electric −25.4None 0Hydraulic −25.4Hydraulic −50.8
This second evaluation of the tandem function was performed in order to observe any differencesbetween upward and downward strokes of the actuators and how that might affect the tandem operation.
2.7. Baseline Function Evaluation
The baseline function was evaluated by setting the hydraulic actuator to one of three predeterminedand randomly selected initial baseline positions as determined by the potentiometer’s output. Theseinitial positions were 50.8, 101.6, and 15.24 mm of extension. Once the baselines were set, the hydraulicactuator was moved to one of nine predetermined and randomly selected points. These points were0, 25.4, 50.8, 76.2, 101.6, 127.0, 152.4, 177.8, and 203.2 mm of extension. Once at the test point, thereturn to baseline function was engaged and a measurement was taken manually, using a ruler, todetermine how precisely the actuator returned to its initial position. All movements of the actuatorwere performed while the harvester was moving and actively harvesting to account for any vibrationsfrom the harvesting process. All tests were performed in triplicate.
2.8. Set-to-One Function Evaluation
The set-to-one function was evaluated by setting the electric actuator to one of three predeterminedand randomly selected initial positions. These positions were 50.8, 101.6, and 152.4 mm of extension.The hydraulic actuator was then randomly positioned into one of nine predetermined and randomlyselected points. These points were 0, 25.4, 50.8, 76.2, 101.6, 127.0, 152.4, 177.8, and 203.2 mm ofextension. Once positioned, the set-to-one function was engaged and a ruler was used to take manualmeasurements of the hydraulic actuator’s extension to observe how well it matched the position of theelectric actuator. All movements of the actuator were performed while the harvester was moving and

AgriEngineering 2020, 2 329
actively harvesting to account for any vibrations from the harvesting process. All tests were performedin triplicate.
2.9. Real-Time Fruit Zone Mapping
The final function which was added to the control system was the logging of real time fruit zoneinformation. This was done by recording the extension of the actuator every second and relatingthat to the height of the picker teeth from the ground. While similar work has been done before inisolation [35], this system removes the requirement for additional hardware to the fastened to theharvester. Additionally, it does not measure the plant height; rather, it indirectly measures the fruitzone, which as mentioned, can fluctuate from 74.0 mm to 346.0 mm off the ground [15]. This newmethod of fruit zone determination is reliant on the operator’s ability to maintain the picking teethwithin the fruit zone. As it is not a direct measurement and only an estimation, it was not analyzedin this study. With that said, it could provide valuable feedback to growers who choose to utilizethis functionality.
3. Results and Discussion
3.1. Selection of Electric or Hydraulic Actuator
In making the determination on whether or not to use the electric linear actuator with built inpotentiometer or to utilize the existing hydraulic actuator with an external, linear potentiometer, thedecision came down to a number of factors. The first difference was in terms of the actuation speeds ofthe two actuators. The operational speeds of the two actuators in both the up and down direction, aswell as under and without load, can be observed in Figure 7.
AgriEngineering 2020, 2 329
actuator were performed while the harvester was moving and actively harvesting to account for any vibrations from the harvesting process. All tests were performed in triplicate.
2.8. Set-to-One Function Evaluation
The set-to-one function was evaluated by setting the electric actuator to one of three predetermined and randomly selected initial positions. These positions were 50.8, 101.6, and 152.4 mm of extension. The hydraulic actuator was then randomly positioned into one of nine predetermined and randomly selected points. These points were 0, 25.4, 50.8, 76.2, 101.6, 127.0, 152.4, 177.8, and 203.2 mm of extension. Once positioned, the set-to-one function was engaged and a ruler was used to take manual measurements of the hydraulic actuator’s extension to observe how well it matched the position of the electric actuator. All movements of the actuator were performed while the harvester was moving and actively harvesting to account for any vibrations from the harvesting process. All tests were performed in triplicate.
2.9. Real-Time Fruit Zone Mapping
The final function which was added to the control system was the logging of real time fruit zone information. This was done by recording the extension of the actuator every second and relating that to the height of the picker teeth from the ground. While similar work has been done before in isolation [35], this system removes the requirement for additional hardware to the fastened to the harvester. Additionally, it does not measure the plant height; rather, it indirectly measures the fruit zone, which as mentioned, can fluctuate from 74.0 mm to 346.0 mm off the ground [15]. This new method of fruit zone determination is reliant on the operator’s ability to maintain the picking teeth within the fruit zone. As it is not a direct measurement and only an estimation, it was not analyzed in this study. With that said, it could provide valuable feedback to growers who choose to utilize this functionality.
3. Results and Discussion
3.1. Selection of Electric or Hydraulic Actuator
In making the determination on whether or not to use the electric linear actuator with built in potentiometer or to utilize the existing hydraulic actuator with an external, linear potentiometer, the decision came down to a number of factors. The first difference was in terms of the actuation speeds of the two actuators. The operational speeds of the two actuators in both the up and down direction, as well as under and without load, can be observed in Figure 7.
13.24 14.77
96.74 93.96
15.85 14.75
80.0772.05
0
20
40
60
80
100
120
Electric - Load Electric - No Load Hydraulic - Load Hydraulic - NoLoad
Spee
d (m
m s-1
)
Up Down
Figure 7. Operational speeds for the electric and hydraulic actuators, moving up and down, both underand without load with numbers presented within the plot showing the mean speeds.
In looking at Figure 7, it quickly becomes apparent that the operational speed of the hydraulicactuator is significantly faster than that of the electric actuator. Considering that the full stroke lengthof each of the actuators is 203.2 mm, this results in an average under load, full stroke time of 13.96 sfor the electric actuator and 2.30 s for the hydraulic actuator. As the harvesting process requires nearconstant movement of the harvester head, actuation speed is of critical importance in order to quickly

AgriEngineering 2020, 2 330
adjust the picking point and maintain it within the fruit zone. The slow operational speed of theelectric actuator would result in potentially significant loss of yields and damage to the harvester dueto the inability to rapidly reposition it. The second significant difference is in terms of cost. Whilethe electric actuator costs $412.49 (Progressive Automations, 2020) the hydraulic actuator costs only$130 (Doug Bragg Enterprises, 2020). Furthermore, these costs do not factor in the additional wiringharness required for the electric actuator or the potential requirement of an alternator upgrade as moreheads are added to the machine. The final difference comes in their operational amperages, where theelectric actuator operates at 20 A and the solenoids of the hydraulic actuator require only 1.83 A. Dueto the high demand placed on these systems and the push toward multi headed machines, this canrepresent a significant difference in energy consumption. The final aspect which was considered isease of installation. The current design of the DBE harvester utilizes a number of hydraulic actuatorsand plumbing another one into the system is quite straight forward. By utilizing an electric actuator,additional wiring harnesses would need to be added and the current draw may leave some machineryin need of an alternator upgrade to run the system. For these reasons, the electric actuator was excludedfrom subsequent testing and the hydraulic actuator with an external potentiometer was used.
3.2. Tandem Function Performance
Analysis of the tandem function looked at how well multiple actuators could be operated bothunder and without load as well as how well they maintained pre-set differences in extension. Finalmean discrepancies from each of the five tested initial offsets, starting from 0 mm, can be observed inTable 3.
Table 3. LSD comparison of final discrepancy between the electric and hydraulic actuator starting fromthe minimum stroke (0 mm), while blocking for field.
Initial Offset Final Mean Discrepancy (mm)
Electric + 50.8 mm 0.833aElectric + 25.4 mm 0.083aBoth at 0 mm −0.556aHydraulic + 25.4 mm −2.229bHydraulic + 50.8 mm −0.143a
Means which share the same letter are not significantly different from one another.
In looking at the data from Table 3, it can be observed that initial offsets of electric +50.8 mm,electric +25.4 mm, both at 0 and hydraulic +50.8 mm were not significantly different from one another.The initial offset of hydraulic +25.4 mm did result in a significant difference however, the mean remainscomparatively small and is not cause for concern for this system. It was determined that blockingwas not significant, demonstrating that the individual fields did not affect the data. All data wasnormally distributed.
In performing a one sided, one sample t-test on absolute discrepancy with a hypothesized mean of6.35 mm the results yield a p-value of 0.000 at the 90% confidence level for a mean absolute discrepancyof 3.10 mm. What this demonstrates is that the mean error of the system is better than 6.35 mm. Asthe goal of the system was to maintain absolute discrepancy within 20.0 mm, this result confirms thesuccess of the tandem function when operating in the upward direction.
The tandem movement function was also evaluated for movement in the downward direction toensure that the discrepancy remained low regardless of actuator direction. Results from this secondevaluation can be observed in Table 4.
In looking at the data presented in Table 4, it can be observed that initial offsets of electric−50.8 mm, electric −25.4 mm, both at 0 mm, and hydraulic −50.8 mm were not significantly differentfrom one another. Similarly, initial offsets of electric −25.4 mm, both at 0, and hydraulic −25.4 mm werenot significantly different from one another. While, initial offsets of electric −50.8 mm and hydraulic−50.8 mm were significantly different from hydraulic −25.4 mm. Despite the significant differences,
AgriEngineering 2020, 2 331
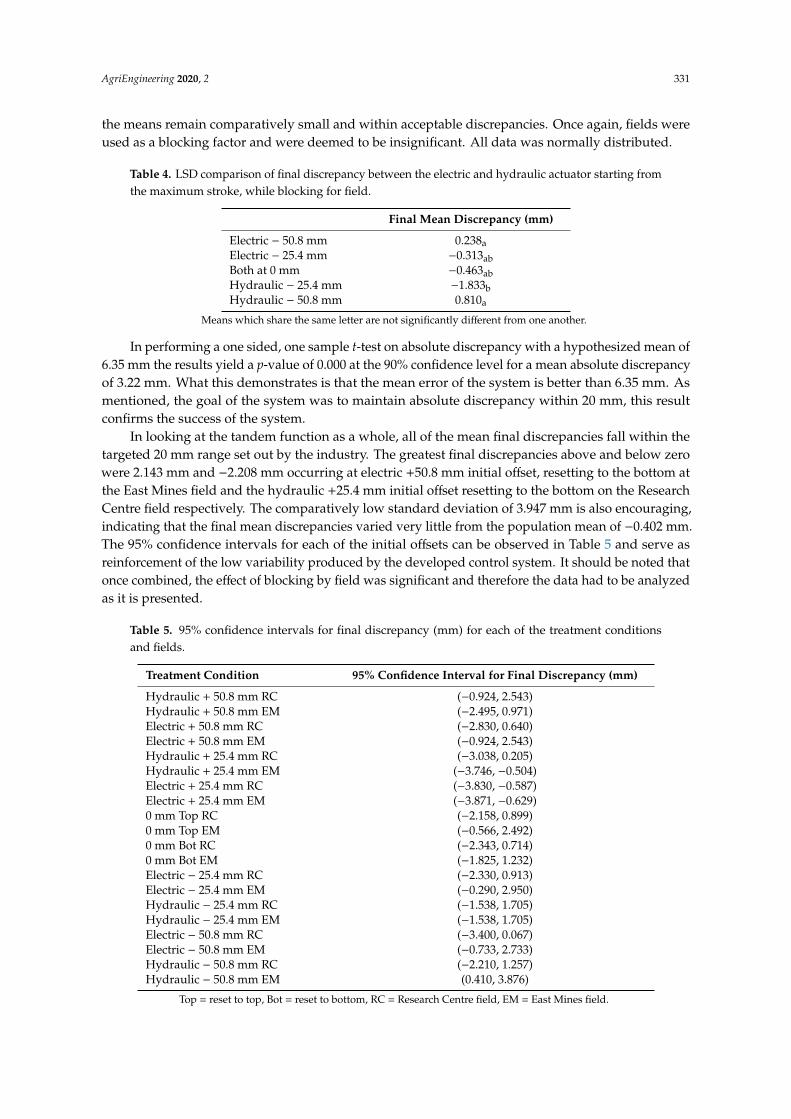
the means remain comparatively small and within acceptable discrepancies. Once again, fields wereused as a blocking factor and were deemed to be insignificant. All data was normally distributed.
Table 4. LSD comparison of final discrepancy between the electric and hydraulic actuator starting fromthe maximum stroke, while blocking for field.
Final Mean Discrepancy (mm)
Electric − 50.8 mm 0.238aElectric − 25.4 mm −0.313abBoth at 0 mm −0.463abHydraulic − 25.4 mm −1.833bHydraulic − 50.8 mm 0.810a
Means which share the same letter are not significantly different from one another.
In performing a one sided, one sample t-test on absolute discrepancy with a hypothesized mean of6.35 mm the results yield a p-value of 0.000 at the 90% confidence level for a mean absolute discrepancyof 3.22 mm. What this demonstrates is that the mean error of the system is better than 6.35 mm. Asmentioned, the goal of the system was to maintain absolute discrepancy within 20 mm, this resultconfirms the success of the system.
In looking at the tandem function as a whole, all of the mean final discrepancies fall within thetargeted 20 mm range set out by the industry. The greatest final discrepancies above and below zerowere 2.143 mm and −2.208 mm occurring at electric +50.8 mm initial offset, resetting to the bottom atthe East Mines field and the hydraulic +25.4 mm initial offset resetting to the bottom on the ResearchCentre field respectively. The comparatively low standard deviation of 3.947 mm is also encouraging,indicating that the final mean discrepancies varied very little from the population mean of −0.402 mm.The 95% confidence intervals for each of the initial offsets can be observed in Table 5 and serve asreinforcement of the low variability produced by the developed control system. It should be noted thatonce combined, the effect of blocking by field was significant and therefore the data had to be analyzedas it is presented.
Table 5. 95% confidence intervals for final discrepancy (mm) for each of the treatment conditionsand fields.
Treatment Condition 95% Confidence Interval for Final Discrepancy (mm)
Hydraulic + 50.8 mm RC (−0.924, 2.543)Hydraulic + 50.8 mm EM (−2.495, 0.971)Electric + 50.8 mm RC (−2.830, 0.640)Electric + 50.8 mm EM (−0.924, 2.543)Hydraulic + 25.4 mm RC (−3.038, 0.205)Hydraulic + 25.4 mm EM (−3.746, −0.504)Electric + 25.4 mm RC (−3.830, −0.587)Electric + 25.4 mm EM (−3.871, −0.629)0 mm Top RC (−2.158, 0.899)0 mm Top EM (−0.566, 2.492)0 mm Bot RC (−2.343, 0.714)0 mm Bot EM (−1.825, 1.232)Electric − 25.4 mm RC (−2.330, 0.913)Electric − 25.4 mm EM (−0.290, 2.950)Hydraulic − 25.4 mm RC (−1.538, 1.705)Hydraulic − 25.4 mm EM (−1.538, 1.705)Electric − 50.8 mm RC (−3.400, 0.067)Electric − 50.8 mm EM (−0.733, 2.733)Hydraulic − 50.8 mm RC (−2.210, 1.257)Hydraulic − 50.8 mm EM (0.410, 3.876)
Top = reset to top, Bot = reset to bottom, RC = Research Centre field, EM = East Mines field.

AgriEngineering 2020, 2 332
3.3. Baseline Function Performance
Analysis of the baseline function looked at how well the developed control system could repositionthe loaded hydraulic actuator to match a pre-set value programed on the control box. Table 6 showsthe final mean discrepancies following engagement of the baseline function.
Table 6. LSD comparison of mean final discrepancies between set baseline value and the final hydraulicactuator position.
Set Baseline (mm) Final Mean Discrepancy (mm)
152.4 RC 2.222a101.6 RC 1.111ab50.8 RC 0.926ab
152.4 EM 0.740abc101.6 EM −0.519bc50.8 EM −1.037c
Means which share the same letter are not significantly different from one another; RC = Research Centre field,EM = East Mines field.
Blocking was significant in this analysis and therefore, data had to be analyzed by field. Thissignificance could be attributable to any number of factors including hydraulic fluid temperature,increase or decrease in hydraulic flow due to the blueberry bin loader, field topography or slightvariations in travel speed. In looking at the results in Table 6 it can observed that all absolute meandiscrepancies were within 2.50 mm, resulting in an eight-fold improvement on the industry targeted20 mm accuracy. Despite the significant differences observed amongst the final mean discrepancies,the values remain quite close to zero and well within the targeted range. Therefore, these values werenot deemed to be an issue. A standard deviation of 3.654 mm for final discrepancy further supportsthe claim that the data does not greatly deviate from the desired zero value. All of this suggests thatthe baseline function performs as intended, with minimal discrepancy in both directions of travel.
3.4. Set-to-One Function Performance
Analysis of the set-to-one function looked at how well the developed control system couldreposition the loaded hydraulic actuator to match the position of the unloaded electric actuator. Table 7shows the mean final discrepancies between the two actuators following use of the set-to-one function.
Table 7. Mean final discrepancies between set position of the electric actuator and final position of thehydraulic actuator.
Final Mean Discrepancy (mm)
152.4 RC −1.296ab101.6 RC −2.407bc50.8 RC −3.333c152.4 EM −1.444ab101.6 EM 0.037a50.8 EM −0.444a
Means which share the same letter are not significantly different from one another. RC = Research Centre field,EM = East Mines field.
Blocking was significant in this analysis and therefore, data had to be analyzed by field. Thissignificance could be attributable to any number of factors including, hydraulic fluid temperature,increase or decrease in hydraulic flow due to the blueberry bin loader, field topography or slightvariations in travel speed. In looking at Table 7, it can be observed that all of the data was within anabsolute discrepancy of 3.50 mm and once again well within the industry goal of 20 mm. Despitethe significant differences observed amongst the final mean discrepancies, the values remain quite

AgriEngineering 2020, 2 333
close to zero and well within the targeted range and therefore are not deemed to be an issue. Thecomparatively small standard deviation of 3.459 mm further supports the claim that the indicatedsignificant differences will not have a major effect on the systems overall success. All of this suggeststhat the set-to-one function performs as intended, with minimal discrepancy in both directions of travel.
4. Conclusions
In all, the developed control system performed well, with a highest absolute discrepancy across alltests of 3.20 mm. As the industry was targeting a maximum absolute discrepancy of 20 mm across allfunctions, the results are more than satisfactory. Though some significant differences were apparent inthe data, they remain comparatively small compared to the target and are likely the result of the largesample size and low variation. The next steps in full automation of the harvester will be to develop aground, object, and fruit sensing system which can be interfaced with this control system. If that isachieved, the two systems can work concurrently to reposition the harvester head without the need formanual input. In addition, there is a need to assess the viability of using automated guidance systemsfor harvesting wild blueberries. There exists some concern that, due to the relatively small workingwidth of the wild blueberry harvester and the fact that it is a side mounted implement, it may not besuitable for automated guidance without a significant reduction in precision and accuracy. In order toachieve full automation this area, further research will be required.
Author Contributions: Conceptualization, T.J.E. and Q.U.Z.; Methodology, T.J.E.; Validation, C.B.M. and A.A.F.;Formal analysis, C.B.M. and T.J.E.; Investigation, T.J.E. and C.B.M.; Resources, T.J.E. and Q.U.Z.; Data curation,T.J.E. and C.B.M.; Writing—original draft preparation, C.B.M. and T.J.E.; Writing—review and editing, T.J.E.,C.B.M., Q.U.Z., and A.A.F.; Visualization, T.J.E. and C.B.M.; Supervision, T.J.E., Q.U.Z., and A.A.F.; Projectadministration, T.J.E.; Funding acquisition, T.J.E. and Q.U.Z. All authors have read and agreed to the publishedversion of the manuscript.
Acknowledgments: The authors would like to thank Doug Bragg Enterprises Ltd. and NSERC for financialsupport to complete this project. The authors would like to thank Stephen Bragg (vice president, Doug BraggEnterprises Ltd.) for technical guidance in relation to the mechanical harvester throughout the duration of theproject. The authors would like to thank Joe Slack (Slack Farms) and Doug Wyllie (farm manager, Bragg LumberCompany) for provision of commercial fields for data collection. The authors would also like to give specialthanks to the precision agriculture and mechanized system research team especially Connor Mullins, Jack Lynds,Derrick Ouma, and Justin Thorne for their help with all components of the project.
Conflicts of Interest: The authors declare no conflict of interest.
References
1. Black, W.N. The effect of frequency of rotational burning on blueberry production. Can. J. Plant Sci. 1963, 43,161–165. [CrossRef]
2. Eaton, L.J. Long-term effects of herbicide and fertilizers on lowbush blueberry growth and production. Can.J. Plant Sci. 1994, 74, 341–345. [CrossRef]
3. Eaton, L.J.; Nams, V.O. Second cropping of wild blueberries—Effects of management practices. Can. J. PlantSci. 2006, 86, 1189–1195. [CrossRef]
4. Jensen, K.I.N.; Kimball, E.R. Tolerance and residues of hexazinone in lowbush blueberries. Can. J. Plant Sci.1985, 65, 223–227. [CrossRef]
5. Kender, W.J.; Eggert, F.P.; Whitton, L. Growth and yield of lowbush blueberries as influenced by variouspruning methods. In Proc. Amer. Soc. Hort. Sci; American Society for Horticultural Science: College Park,MD, USA, 1964; pp. 269–273.
6. McCully, K.V.; Sampson, M.G.; Watson, A.K. Weed Survey of Nova Scotia Lowbush Blueberry (Vacciniumangustifolium) Fields. Weed Sci. 1991, 39, 180–185. [CrossRef]
7. Trevett, M.F. Nutrition and Growth of the Lowbush Blueberry; Maine Agricultural Experiment Station: Orono,ME, USA, 1962.
8. Nova Scotia Department of Agriculture. 2018. Buisness Plan 2018-2019. Available online: https://novascotia.ca/government/accountability/2018-2019/2018-2019-business-plan-Department-of-Agriculture.pdf (accessedon 27 January 2020).

AgriEngineering 2020, 2 334
9. Esau, T.J.; Zaman, Q.U.; MacEachern, C.; Yiridoe, E.K.; Farooque, A.A. Economic and Management Tool forAssessing Wild Blueberry Production Costs and Financial Feasibility. Appl. Eng. Agric. 2019, 35, 687–696.[CrossRef]
10. Yarborough, David. 2018. Wild Blueberry Crop Statistics. Fact Sheet. Available online: https://extension.umaine.edu/blueberries/factsheets/statistics-2/statistics/ (accessed on 27 January 2020).
11. Dale, A.; Hanson, E.J.; Yarborough, D.E.; McNicol, R.J.; Stang, E.J.; Brennan, R.; Morris, J.R.; Hergert, G.B.Mechanical Harvesting of Berry Crops. Horticultural Reviews 2010, 16, 255–382. [CrossRef]
12. Gray, G.L. Development of a Hollow Reel Raking Mechanism for Harvesting Lowbush Blueberries; 1970.Ph.D. Thesis, University of Maine, Orono, ME, USA, 1970.
13. Malay, W.J. Spatial Variability and Yield Monitor Evaluation for Carrots and Wild Blueberries; Nova ScotiaAgricultural College: Truro, NS, Canada, 2000.
14. Soule, H.M., Jr.; Oemler, J.A. Developing a Lowbush Blueberry Harvester. Trans. ASAE 1969, 12, 127–129.[CrossRef]
15. Farooque, A.A.; Zaman, Q.U.; Groulx, D.; Schumann, A.W. Effect of Ground Speed and Header Revolutionson the Picking Efficiency Ofa Commercial Wild Blueberry Harvester. Appl. Eng. Agric. 2014, 30, 535–546.
16. Antonelli, A.; Gabrio, M.; Auriti, L.; Zobel, P.B.; Raparelli, T. Development of a New Harvesting Module forSaffron Flower Detachment. Rom. Rev. Precis. Mech. Opt. Mechatron. 2011, 39, 163–168.
17. Chatzimichali, A.P.; Georgilas, I.; Tourassis, V. Design of an advanced prototype robot for white asparagusharvesting. In Proceedings of the 2009 IEEE/ASME International Conference on Advanced IntelligentMechatronics, Singapore, 14–17 July 2009; pp. 887–892.
18. Davidson, J.R.; Silwal, A.; Hohimer, C.J.; Karkee, M.; Mo, C.; Zhang, Q. Proof-of-concept of a robotic appleharvester. In Proceedings of the 2016 IEEE/RSJ International Conference on Intelligent Robots and Systems(IROS), Daejeon, Korea, 9–14 October 2016; pp. 634–639.
19. Lehnert, C.; English, A.; McCool, C.S.; Tow, A.W.; Pérez, T. Autonomous Sweet Pepper Harvesting forProtected Cropping Systems. IEEE Robot. Autom. Lett. 2017, 2, 872–879. [CrossRef]
20. Li, B.; Ling, Y.; Zhang, H.; Zheng, S. The Design and Realization of Cherry Tomato Harvesting Robot Basedon IOT. Int. J. Online Eng. (iJOE) 2016, 12, 23. [CrossRef]
21. Liu, J.; Li, Z.; Li, P.; Mao, H. Design of a laser stem-cutting device for harvesting robot. In Proceedings of the2008 IEEE International Conference on Automation and Logistics, Qingdao, China, 1–3 September 2008;pp. 2370–2374.
22. Nagasaka, Y.; Tamaki, K.; Nishiwaki, K.; Saito, M.; Kikuchi, Y.; Kobayashi, K. Autonomous rice field operationproject in NARO. In Proceedings of the 2011 IEEE International Conference on Mechatronics and Automation,Beijing, China, 7–10 August 2011; pp. 870–874.
23. Lili, W.; Bo, Z.; Jinwei, F.; Xiaoan, H.; Shu, W.; Yashuo, L.; Qiangbing, Z.; Chongfeng, W.; Zhou, Q.Development of a tomato harvesting robot used in greenhouse. Int. J. Agric. Boil. Eng. 2017, 10, 140–149.[CrossRef]
24. Zhang, Z.; Noguchi, N.; Ishii, K.; Yang, F.; Zhang, C. Development of a Robot Combine Harvester for Wheatand Paddy Harvesting. IFAC Proc. Vol. 2013, 46, 45–48. [CrossRef]
25. Zaman, Q.U.; Schumann, A.W.; Percival, D.C. An Automated Cost-effective System for Real-time SlopeMapping in Commercial Wild Blueberry Fields. HortTechnology 2010, 20, 431–437. [CrossRef]
26. Mahieu, T.; Missotten, B.M.; Lenaerts, B.; Tallir, F.; Van Overschelde, P.; Somers, T.N. Agricultural HarvesterIncluding Feedback Control of Chopping Parameters. U.S. Patent 10,130,039, 20 November 2018.
27. Bischoff, L. Harvester with Control System Considering Operator Feedback. U.S. Patent 6,726,559, 27 April2004.
28. Bassett, J. Agricultural Apparatus for Sensing and Providing Feedback of Soil Property Changes in RealTime. U.S. Patent 9,113,589, 25 August 2015.
29. Mafuta, M.; Zennaro, M.; Bagula, A.B.; Ault, G.; Gombachika, H.; Chadza, T. Successful Deployment ofa Wireless Sensor Network for Precision Agriculture in Malawi. Int. J. Distrib. Sens. Networks 2013, 9,150703–150713. [CrossRef]
30. Wu, X.; Feng, Z.; Ao, J. Spraying System Having a Liquid Flow and Rotating Speed Feedback. U.S. Patent10,266,265, 23 April 2019.

AgriEngineering 2020, 2 335
31. Sharda, A.; Fulton, J.P.; McDonald, T.P.; Zech, W.C.; Darr, M.J.; Brodbeck, C.J. Real-Time Pressure and FlowDynamics Due to Boom Section and Individual Nozzle Control on Agricultural Sprayers. Trans. ASABE2010, 53, 1363–1371. [CrossRef]
32. Schroeder, J.D.; Nelson, T.L.; Panoushek, D.W. Apparatus and Method for Automatically Controlling theSettings of An Adjustable Crop Residue Spreader of An Agricultural Combine. U.S. Patent 8,010,262,30 August 2011.
33. Yinyan, S.; Hu, Z.; Wang, X.; Odhiambo, M.O.; Weimin, D. Motion analysis and system response of fertilizerfeed apparatus for paddy Variable-Rate fertilizer spreader. Comput. Electron. Agric. 2018, 153, 239–247.[CrossRef]
34. Progressive Automations. 2020. Heavy Duty Linear Actuator (Optional Feedback). Available online: https://www.progressiveautomations.ca/products/heavy-duty-linear-actuator?variant=30320369664087 (accessedon 3 February 2020).
35. Chang, Y.K.; Zaman, Q.U.; Rehman, T.U.; Farooque, A.A.; Esau, T.; Jameel, M.W. A real-time ultrasonicsystem to measure wild blueberry plant height during harvesting. Biosyst. Eng. 2017, 157, 35–44. [CrossRef]
© 2020 by the authors. Licensee MDPI, Basel, Switzerland. This article is an open accessarticle distributed under the terms and conditions of the Creative Commons Attribution(CC BY) license (http://creativecommons.org/licenses/by/4.0/).