development and assessment of generic airports for fleet...
TRANSCRIPT
Development and Assessment of Generic
Airports for Fleet-Level Noise Modeling
Author: José E. Bernardo Graduate Researcher, Aerospace Systems Design Laboratory (ASDL)
PhD Candidate from the School of Aerospace Engineering, Georgia Institute of Technology
Advisor: Dr. Michelle Kirby Senior Research Engineer and ASDL Civil Aviation Division Chief
Advisor: Dr. Dimitri Mavris Boeing Professor of Advanced Aerospace Systems Analysis and ASDL Director
Paper submitted to the Partnership for AiR Transportation Noise and Emissions Reduction (PARTNER): 9th
Annual Joseph A. Hartman Student Paper Competition
Date: December 31st, 2012
0
Aerospace Systems Design Laboratory
School of Aerospace Engineering, Georgia Institute of Technology
Table of Contents
Development and Assessment of Generic Airports for Fleet-Level Noise Modeling ....................................................i Abstract: ................................................................................................................................................................ 0
I. Introduction ........................................................................................................................................................... 1 II. Background ...................................................................................................................................................... 1 III. Approach .......................................................................................................................................................... 2
A. Generic Runways.............................................................................................................................................. 3
Test 1: Baseline Verification ................................................................................................................................. 4
Test 2: Robustness to Aircraft Variability ............................................................................................................. 5
Test 3: Robustness to Forecast Variability ............................................................................................................ 5
B. Generic Infrastructures ..................................................................................................................................... 5
Test 4: Baseline Comparison ................................................................................................................................. 6
Test 5: Robustness Assessment ............................................................................................................................. 6
Calibration ............................................................................................................................................................. 7
C. Test 6: Generic Airports Validation ................................................................................................................ 7
IV. Implementation ................................................................................................................................................. 7 A. Generic Runways.............................................................................................................................................. 8
Grouping ................................................................................................................................................................ 8
Test 1: Baseline Verification ................................................................................................................................. 9
Test 2: Robustness to Aircraft Variability ............................................................................................................. 9
Test 3: Robustness to Forecast Variability .......................................................................................................... 10
B. Generic Infrastructures ................................................................................................................................... 11
Grouping .............................................................................................................................................................. 11
Test 4: Baseline Comparison ............................................................................................................................... 11
Test 5: Robustness Assessment ........................................................................................................................... 12
Calibration ........................................................................................................................................................... 12
C. Test 6: Generic Airports Validation ............................................................................................................... 14
V. Conclusions and Future Work ........................................................................................................................ 14 Acknowledgements ..................................................................................................................................................... 16 Student Biography ....................................................................................................................................................... 16 References ................................................................................................................................................................... 16
Abstract: This research develops and executes a methodology for creating generic airports for fleet-level
noise modeling in support of a generic framework for rapid fleet-level environmental analysis to reduce model
complexity and runtime. Generic airports are comprised of generic runways, consisting of operational
characteristics, and generic infrastructures, consisting of geometric characteristics. Groupings and validations
were performed on both components and the final set of generic airports. The results show that airports can be
grouped by their operational and geometric characteristics separately, and that these groupings can be leveraged
to infer fleet-level airport noise trends of the generic class onto specific airports.
José E. Bernardo
9th
Annual Joseph A. Hartman Student Paper Competition
1
Aerospace Systems Design Laboratory
School of Aerospace Engineering, Georgia Institute of Technology
I. Introduction
A variety of different entities have recently projected dramatic increases in future demand for air transportation
[1]. This increase in operations is a significant opportunity to continue the growth of the aviation industry and the
role it plays in national and international transportation. Increased aviation, however, will also lead to exacerbated
environmental effects, such as increased airport community noise. The range of potential adverse effects is varied,
and can constitute a threat to public health and welfare as well as other social and economic systems [2] - [4].
Currently initiatives such as the Next Generation Air Transportation System (NextGen) are supported by
technology and design programs that address the effects of increased aviation on noise, like the Continuous Lower
Energy, Emissions and Noise (CLEEN) program, the Environmentally Responsible Aircraft (ERA) program, and the
Subsonic Fix Wing (SFW) program [5] - [8]. Since the development costs of technologies are high, the strategic
decision regarding which technologies to pursue in the long-term is critical. While addressing these issues is a
challenge at the aircraft level, even further challenges are introduced at the fleet-level, particularly with respect to
noise. The fleet-level effect of technology infusions must be considered, since the “environmental… impact of new
aircraft is a function of both the aircraft performance and the airline’s use of new and existing aircraft.” [9], [10]
Evaluating the fleet-level effects, interactions and tradeoffs of potential technology packages in detail, including the
competing effects of technologies on the various environmental metrics is an expensive modeling process and would
be infeasible to examine all possible options due to time constraints. Yet critical decisions must be made, so
currently research is focused on developing methods to reduce the computational complexity of fleet-level emissions
computations and particularly noise. One example is the push for a generic framework for evaluating future
technologies and operational scenarios, including generic vehicles to represent the current and future fleets [11].
II. Background
Unlike other environmental emissions metrics, airport noise is a spatial issue, and therefore the airport-level is
critical in arriving at fleet-level estimates with respect to noise. High-fidelity models such as the Aviation
Environmental Design Tool (AEDT), designed to perform detailed aircraft-level to fleet-level analyses of noise, fuel
burn, and emissions, complete it by creating airport-level contours for each airport included in any given study,
naturally increasing the runtime required [12]. In support of a generic framework, the level of fidelity provided by
unique airports is not particularly appropriate at this level of the decision-making process. With the large number of

José E. Bernardo
9th
Annual Joseph A. Hartman Student Paper Competition
2
Aerospace Systems Design Laboratory
School of Aerospace Engineering, Georgia Institute of Technology
potential airports of interest with unique operational, infrastructure, and atmospheric characteristics, there is a need
to reduce the computational load via categorization. Such groupings have been employed at the vehicle-level in the
past, such as those utilized to create generic vehicles and the aircraft ‘families’ developed by Isley [11], [13]. Much
like generic aircraft are advantageous in their ability to rapidly aggregate fuel-burn and emissions with sufficient
accuracy, a representative set of airports would be equally valuable with respect to fleet-level noise. In tandem with
generic aircraft, generic airports would significantly improve the ability to perform fleet-level trades to evaluate
technology options with respect to noise.
Several airport groupings currently exist, which aim to describe a large number of airports with a relative few,
through technical similarities. These groupings are very problem specific, and have been developed to improve the
efficiency of airport capacity impact assessments, and to study the feasibility of noise trading schemes [14], [15].
While the technical methods for grouping are compatible for generating airport groups suitable for fleet-level noise
modeling, there are a number of unique issues with the current problem that require a new approach. For example,
Bock’s research with airport capacity impact assessment considers many variables that are irrelevant or too detailed,
such as separation regulations or runway coordination regulations, which have no impact on a cumulative daily
noise analysis [15]. With Ottl and Bock [14], there is no concern for the geometry of the airports, which can have a
significant effect on noise contour area [9]. Bock’s research does consider runway layouts, but the infrastructure
variables that determine a noise contour shape are different than those relevant for airport capacity modeling [15].
While these grouping techniques provide a sufficient methodological background on which to build, there is still a
lack of noise-specific groupings for the purposes of reducing fleet-level noise prediction runtime and total runs.
III. Approach
In order to create a set of generic airports for rapid fleet-level noise prediction, a systematic approach must be
followed to ensure the results are repeatable. The first step consists of selecting a subset of airports to serve as the
grouping sample, since it would be infeasible to consider all airports. One such subset is the MAGENTA 95, which
are the airports that account for approximately 90% of the population affected by significant airport noise [16], [17].
Since this sub-categorization is entirely based on the magnitude of contribution to fleet-level noise of the entire
system, it is appropriate to use in developing generic airports for the purposes of calculating fleet-level noise
estimates.

José E. Bernardo
9th
Annual Joseph A. Hartman Student Paper Competition
3
Aerospace Systems Design Laboratory
School of Aerospace Engineering, Georgia Institute of Technology
Secondly, the variables relevant to grouping must be identified. For a long-term fleet-level analysis, the two
main variable types of interest for this research are operational and infrastructure variables. The model selected to
facilitate the analysis is the Airport Noise Grid Integration Method (ANGIM), which allows for variations in
operational and infrastructure variable types [9]. If airports can be analyzed with respect to their operational and
geometric characteristics, then it is expected that patterns will emerge, allowing for categorizations. In order to
facilitate the groupings, the operational and geometric characteristics must be decoupled. For example, while Los
Angeles International Airport (LAX) and Pittsburgh International Airport (PIT) both have four runways, LAX is a
major international port with many more operations and diverse aircraft types than PIT. Therefore, the operational
characteristics such as operations volume, fleet mix, and distribution of operations across that fleet will be used to
generate groups that result in generic runway types. Meanwhile, the geometric characteristics, such as the number
of runways and runway orientation, will be used to create generic infrastructure types. Combining the two will yield
generic airports, numbering ideally between ¼ - ⅓ of the 95 sample airports, providing a sufficient reduction in
airports while still articulating the basic differences operationally and geometrically between airports. The
assumptions include that all runways operate in cross-flow, uniform utilization between all runways, with evenly
mixed operation types, sea-level elevation, straight ground tracks, fixed runway length of 2 nautical miles, and
minimal runway offset error.
In order to perform effective groupings, a useful set of data must be collected for all 95 of the MAGENTA
airports. A baseline schedule of operations, as provided in the Global Regional Environmental Aviation Tradeoff
(GREAT) tool, provides the operations by origin and destination pair, the aircraft operating the route, the distance of
the route, and the total number of times per year the operations occur, and is therefore appropriate for generating
generic runways [18]. The operational data in GREAT uses, as a baseline, the 2006 Fleet and Operations Module
(FOM) [19]. While the operational data is largely based in operations counts by aircraft type, the geometric variables
are of a different constitution. The geometric variables are relatively undefined, and are not particularly tabulated in
any one place. Therefore, the raw geometric data has to be identified, gathered, and organized manually. The
relevant geometric data includes the runway layout for each airport and a representative contour for each airport.
A. Generic Runways
While other variables such as the trip distance distribution of the flights at an airport, or the time of day of the
flights are important to the overall noise response, the most significant contributors are assumed to be the total
José E. Bernardo
9th
Annual Joseph A. Hartman Student Paper Competition
4
Aerospace Systems Design Laboratory
School of Aerospace Engineering, Georgia Institute of Technology
number of operations, and the types of aircraft that fly in a given schedule along with the distribution of operations
across those aircraft. While grouping could be performed on the operational volume and aircraft distribution
together, it is useful to further de-couple these characteristics. For example, while two airports may have similar
aircraft distributions by percentage, the number of operations could differ by an order of magnitude, which would
negatively impact the ability to provide a representative set of operational characteristics. Therefore, the 95 airports
must first be grouped by the total number of operations, which can then be followed by a more targeted grouping by
aircraft distribution.
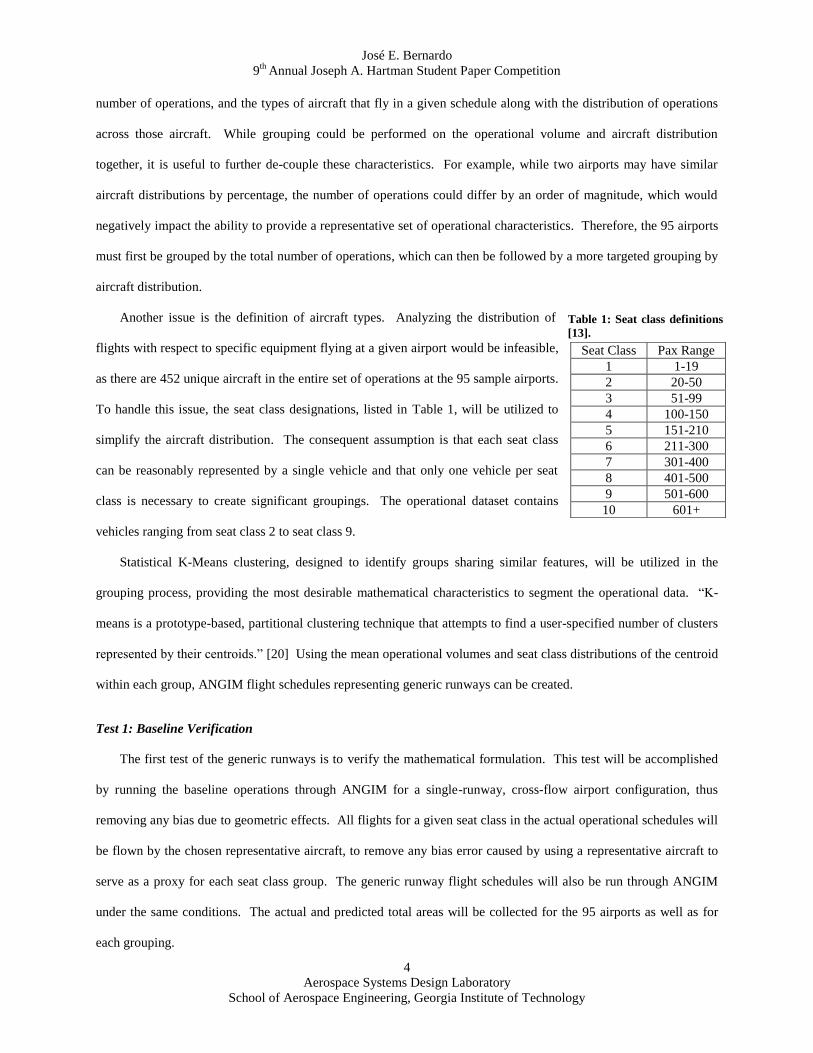
Another issue is the definition of aircraft types. Analyzing the distribution of
flights with respect to specific equipment flying at a given airport would be infeasible,
as there are 452 unique aircraft in the entire set of operations at the 95 sample airports.
To handle this issue, the seat class designations, listed in Table 1, will be utilized to
simplify the aircraft distribution. The consequent assumption is that each seat class
can be reasonably represented by a single vehicle and that only one vehicle per seat
class is necessary to create significant groupings. The operational dataset contains
vehicles ranging from seat class 2 to seat class 9.
Statistical K-Means clustering, designed to identify groups sharing similar features, will be utilized in the
grouping process, providing the most desirable mathematical characteristics to segment the operational data. “K-
means is a prototype-based, partitional clustering technique that attempts to find a user-specified number of clusters
represented by their centroids.” [20] Using the mean operational volumes and seat class distributions of the centroid
within each group, ANGIM flight schedules representing generic runways can be created.
Test 1: Baseline Verification
The first test of the generic runways is to verify the mathematical formulation. This test will be accomplished
by running the baseline operations through ANGIM for a single-runway, cross-flow airport configuration, thus
removing any bias due to geometric effects. All flights for a given seat class in the actual operational schedules will
be flown by the chosen representative aircraft, to remove any bias error caused by using a representative aircraft to
serve as a proxy for each seat class group. The generic runway flight schedules will also be run through ANGIM
under the same conditions. The actual and predicted total areas will be collected for the 95 airports as well as for
each grouping.
Seat Class Pax Range
1 1-19
2 20-50
3 51-99
4 100-150
5 151-210
6 211-300
7 301-400
8 401-500
9 501-600
10 601+
Table 1: Seat class definitions
[13].
José E. Bernardo
9th
Annual Joseph A. Hartman Student Paper Competition
5
Aerospace Systems Design Laboratory
School of Aerospace Engineering, Georgia Institute of Technology
Test 2: Robustness to Aircraft Variability
The second test consists of comparing the generic runway predictions to the actual operational schedules at the
MAGENTA 95 airports, with operations flown by the 452 unique aircraft specified in the schedule. This test
introduces the variability of the aircraft fleet. It is important to maintain consistency in the face of aircraft
variability to ensure that introduction of new aircraft or retirement of current aircraft does not diminish the
mathematical theory on which the generic runways are based. While this may introduce significant bias error due to
the ability of the representative aircraft to characterize the specific aircraft in the schedule by seat class, the generic
runways can be calibrated by perturbing operational volume.
Test 3: Robustness to Forecast Variability
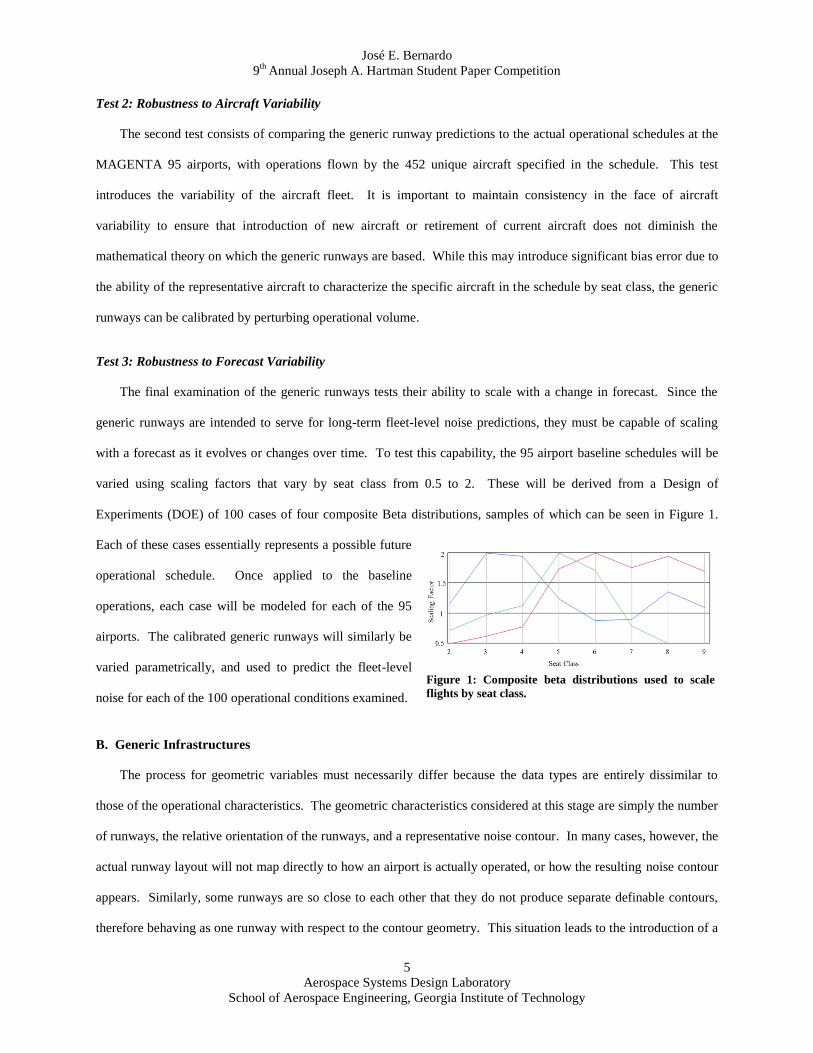
The final examination of the generic runways tests their ability to scale with a change in forecast. Since the
generic runways are intended to serve for long-term fleet-level noise predictions, they must be capable of scaling
with a forecast as it evolves or changes over time. To test this capability, the 95 airport baseline schedules will be
varied using scaling factors that vary by seat class from 0.5 to 2. These will be derived from a Design of
Experiments (DOE) of 100 cases of four composite Beta distributions, samples of which can be seen in Figure 1.
Each of these cases essentially represents a possible future
operational schedule. Once applied to the baseline
operations, each case will be modeled for each of the 95
airports. The calibrated generic runways will similarly be
varied parametrically, and used to predict the fleet-level
noise for each of the 100 operational conditions examined.
B. Generic Infrastructures
The process for geometric variables must necessarily differ because the data types are entirely dissimilar to
those of the operational characteristics. The geometric characteristics considered at this stage are simply the number
of runways, the relative orientation of the runways, and a representative noise contour. In many cases, however, the
actual runway layout will not map directly to how an airport is actually operated, or how the resulting noise contour
appears. Similarly, some runways are so close to each other that they do not produce separate definable contours,
therefore behaving as one runway with respect to the contour geometry. This situation leads to the introduction of a
Figure 1: Composite beta distributions used to scale
flights by seat class.

José E. Bernardo
9th
Annual Joseph A. Hartman Student Paper Competition
6
Aerospace Systems Design Laboratory
School of Aerospace Engineering, Georgia Institute of Technology
third geometry defined as the effective runways. Effective runways refer to the runway layout modified by the
appearance of the resulting contour, basically re-structuring the original layout to represent, in a reduced form, a
layout that would produce such a contour. A common example is two parallel runways such as those shown in
Figure 2 [21], [22]. The contour shape essentially advises how the actual configuration can be simplified into more
basic parts. By reducing the uniqueness in this fashion, the variety of airport geometries can be reduced to a few
simple sets that can be observed and classified. The goal of generic infrastructures is to capture the interplay of the
multi-runway airport configurations and their effect on
the overall trends of such a contour. Therefore, it is not
entirely imperative that each airport geometry is
faithfully represented by a generic infrastructure, but
rather that the emergent trends in the general class of
airport contour geometries are captured.
Test 4: Baseline Comparison
The first generic infrastructure evaluation will consist of comparing the generic infrastructure area predictions
to the total 65 dB DNL contour areas of the actual unique infrastructures for the MAGENTA 95, as run through
ANGIM. To ensure there is no bias due to operations, a fixed flight schedule will be applied to all generic and
actual airports. Other assumptions include that all runway lengths will be assumed to be 2 nautical miles, to
conform to the ANGIM assumptions. As with the generic runway test, all configurations will be run in cross-flow,
removing any geometric bias caused by the difference between approach and departure operations. Similar to the
generic runway validations, the generic infrastructure groups will also be tracked independently and analyzed for
deficiencies and opportunities for calibration.
Test 5: Robustness Assessment
While operations can vary greatly over time, the infrastructures of airports change with much less frequency
and variability. Capacity-related expansions, in fact, are limited to additions of parallel runways [23]. Instead, the
robustness of the generic infrastructures refers to the ability for the generated set to represent, on average, the
diversity that potentially exists in the current and future set of airport infrastructures. Furthermore, the robustness
assessment must serve as a confirmation that no other significant geometries are contained within the observed
Figure 2: Using layout and contour map to derive effective
runways [21], [22].
José E. Bernardo
9th
Annual Joseph A. Hartman Student Paper Competition
7
Aerospace Systems Design Laboratory
School of Aerospace Engineering, Georgia Institute of Technology
generic infrastructures, thus providing another form of calibration. The experiments will involve using a Latin
Hypercube (LH) DOE to vary the relevant geometric parameters. The number of runways and therefore the specific
geometric variables will differ between the different generic classes, and thus the variables and their ranges will be
unique to each generic class and consequent experiment. All flights will operate in cross-flow on all runways,
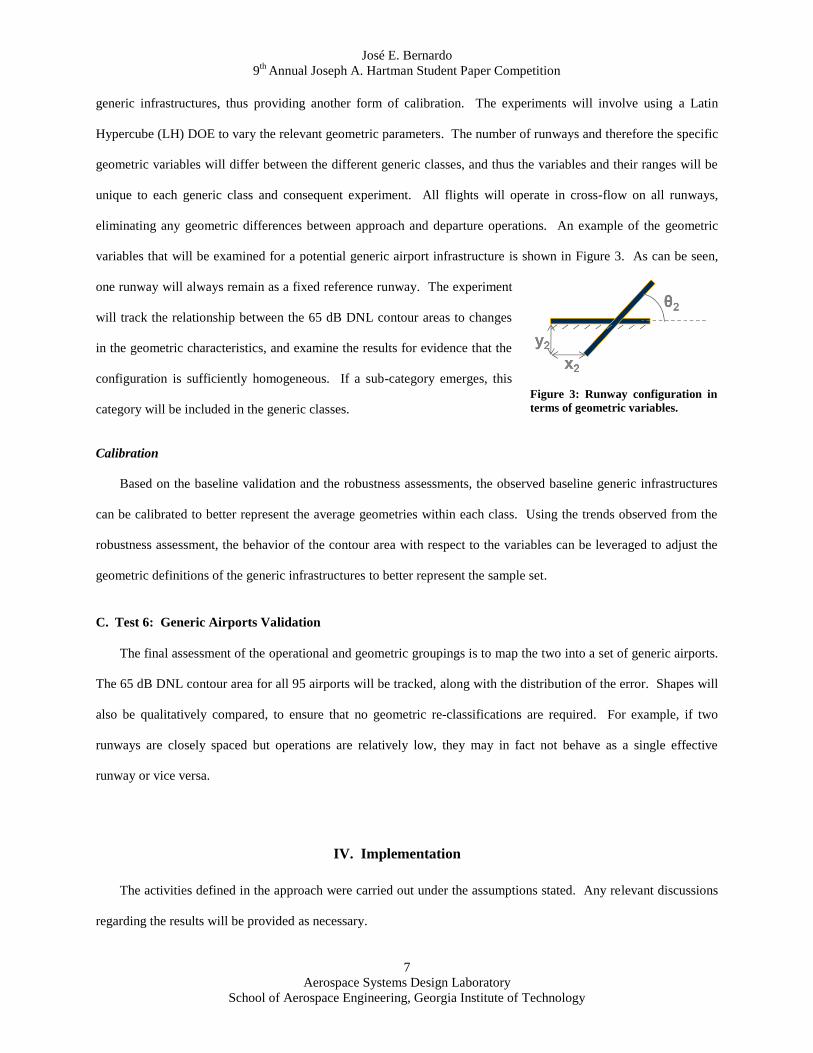
eliminating any geometric differences between approach and departure operations. An example of the geometric
variables that will be examined for a potential generic airport infrastructure is shown in Figure 3. As can be seen,
one runway will always remain as a fixed reference runway. The experiment
will track the relationship between the 65 dB DNL contour areas to changes
in the geometric characteristics, and examine the results for evidence that the
configuration is sufficiently homogeneous. If a sub-category emerges, this
category will be included in the generic classes.
Calibration
Based on the baseline validation and the robustness assessments, the observed baseline generic infrastructures
can be calibrated to better represent the average geometries within each class. Using the trends observed from the
robustness assessment, the behavior of the contour area with respect to the variables can be leveraged to adjust the
geometric definitions of the generic infrastructures to better represent the sample set.
C. Test 6: Generic Airports Validation
The final assessment of the operational and geometric groupings is to map the two into a set of generic airports.
The 65 dB DNL contour area for all 95 airports will be tracked, along with the distribution of the error. Shapes will
also be qualitatively compared, to ensure that no geometric re-classifications are required. For example, if two
runways are closely spaced but operations are relatively low, they may in fact not behave as a single effective
runway or vice versa.
IV. Implementation
The activities defined in the approach were carried out under the assumptions stated. Any relevant discussions
regarding the results will be provided as necessary.
Figure 3: Runway configuration in
terms of geometric variables.
José E. Bernardo
9th
Annual Joseph A. Hartman Student Paper Competition
8
Aerospace Systems Design Laboratory
School of Aerospace Engineering, Georgia Institute of Technology
A. Generic Runways
Grouping
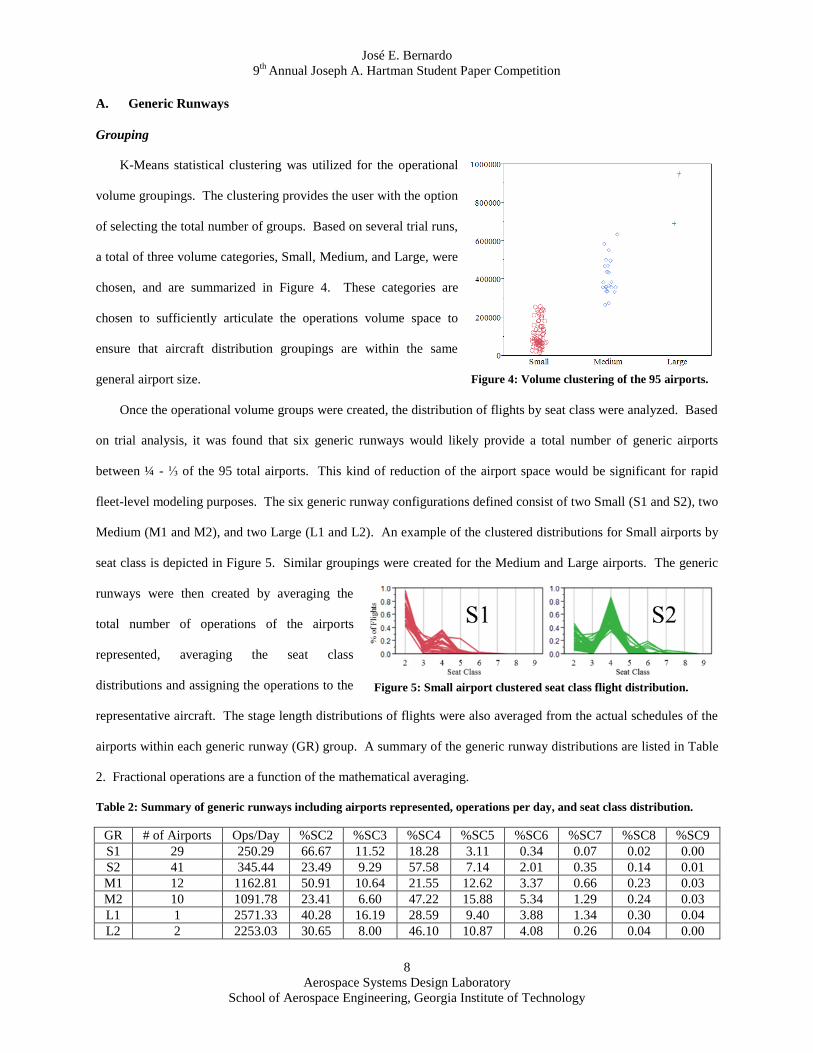
K-Means statistical clustering was utilized for the operational
volume groupings. The clustering provides the user with the option
of selecting the total number of groups. Based on several trial runs,
a total of three volume categories, Small, Medium, and Large, were
chosen, and are summarized in Figure 4. These categories are
chosen to sufficiently articulate the operations volume space to
ensure that aircraft distribution groupings are within the same
general airport size.
Once the operational volume groups were created, the distribution of flights by seat class were analyzed. Based
on trial analysis, it was found that six generic runways would likely provide a total number of generic airports
between ¼ - ⅓ of the 95 total airports. This kind of reduction of the airport space would be significant for rapid
fleet-level modeling purposes. The six generic runway configurations defined consist of two Small (S1 and S2), two
Medium (M1 and M2), and two Large (L1 and L2). An example of the clustered distributions for Small airports by
seat class is depicted in Figure 5. Similar groupings were created for the Medium and Large airports. The generic
runways were then created by averaging the
total number of operations of the airports
represented, averaging the seat class
distributions and assigning the operations to the
representative aircraft. The stage length distributions of flights were also averaged from the actual schedules of the
airports within each generic runway (GR) group. A summary of the generic runway distributions are listed in Table
2. Fractional operations are a function of the mathematical averaging.
Table 2: Summary of generic runways including airports represented, operations per day, and seat class distribution.
GR # of Airports Ops/Day %SC2 %SC3 %SC4 %SC5 %SC6 %SC7 %SC8 %SC9
S1 29 250.29 66.67 11.52 18.28 3.11 0.34 0.07 0.02 0.00
S2 41 345.44 23.49 9.29 57.58 7.14 2.01 0.35 0.14 0.01
M1 12 1162.81 50.91 10.64 21.55 12.62 3.37 0.66 0.23 0.03
M2 10 1091.78 23.41 6.60 47.22 15.88 5.34 1.29 0.24 0.03
L1 1 2571.33 40.28 16.19 28.59 9.40 3.88 1.34 0.30 0.04
L2 2 2253.03 30.65 8.00 46.10 10.87 4.08 0.26 0.04 0.00
Figure 4: Volume clustering of the 95 airports.
Figure 5: Small airport clustered seat class flight distribution.
José E. Bernardo
9th
Annual Joseph A. Hartman Student Paper Competition
9
Aerospace Systems Design Laboratory
School of Aerospace Engineering, Georgia Institute of Technology
While some generic runways have relatively sparse membership, it is important to recall that these generic
runways must be able to account for changes to the operational landscape, as well as potentially account for airports
outside the baseline sample set utilized to create the groups.
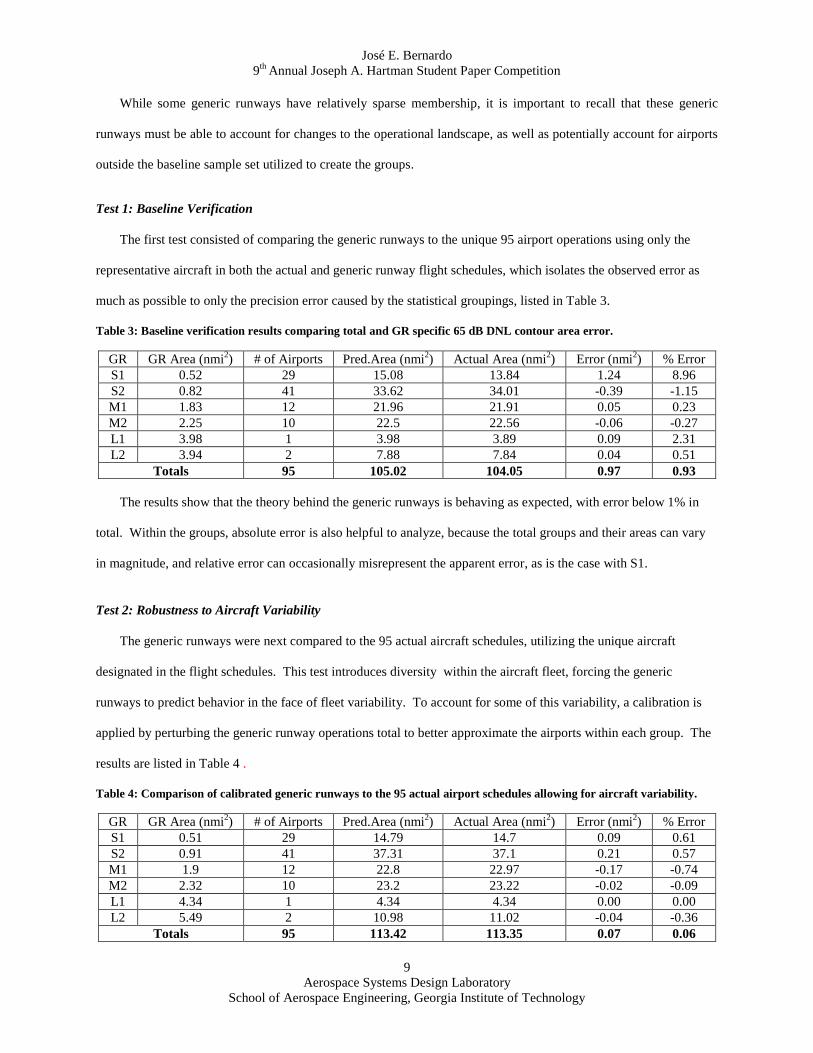
Test 1: Baseline Verification
The first test consisted of comparing the generic runways to the unique 95 airport operations using only the
representative aircraft in both the actual and generic runway flight schedules, which isolates the observed error as
much as possible to only the precision error caused by the statistical groupings, listed in Table 3.
Table 3: Baseline verification results comparing total and GR specific 65 dB DNL contour area error.
GR GR Area (nmi2) # of Airports Pred.Area (nmi
2)
Actual Area (nmi
2) Error (nmi
2) % Error
S1 0.52 29 15.08 13.84 1.24 8.96
S2 0.82 41 33.62 34.01 -0.39 -1.15
M1 1.83 12 21.96 21.91 0.05 0.23
M2 2.25 10 22.5 22.56 -0.06 -0.27
L1 3.98 1 3.98 3.89 0.09 2.31
L2 3.94 2 7.88 7.84 0.04 0.51
Totals 95 105.02 104.05 0.97 0.93
The results show that the theory behind the generic runways is behaving as expected, with error below 1% in
total. Within the groups, absolute error is also helpful to analyze, because the total groups and their areas can vary
in magnitude, and relative error can occasionally misrepresent the apparent error, as is the case with S1.
Test 2: Robustness to Aircraft Variability
The generic runways were next compared to the 95 actual aircraft schedules, utilizing the unique aircraft
designated in the flight schedules. This test introduces diversity within the aircraft fleet, forcing the generic
runways to predict behavior in the face of fleet variability. To account for some of this variability, a calibration is
applied by perturbing the generic runway operations total to better approximate the airports within each group. The
results are listed in Table 4 .
Table 4: Comparison of calibrated generic runways to the 95 actual airport schedules allowing for aircraft variability.
GR GR Area (nmi2) # of Airports Pred.Area (nmi
2)
Actual Area (nmi
2) Error (nmi
2) % Error
S1 0.51 29 14.79 14.7 0.09 0.61
S2 0.91 41 37.31 37.1 0.21 0.57
M1 1.9 12 22.8 22.97 -0.17 -0.74
M2 2.32 10 23.2 23.22 -0.02 -0.09
L1 4.34 1 4.34 4.34 0.00 0.00
L2 5.49 2 10.98 11.02 -0.04 -0.36
Totals 95 113.42 113.35 0.07 0.06

José E. Bernardo
9th
Annual Joseph A. Hartman Student Paper Competition
10
Aerospace Systems Design Laboratory
School of Aerospace Engineering, Georgia Institute of Technology
Test 3: Robustness to Forecast Variability
The final evaluation of generic runways is to test their ability to scale with the operational landscape in a large
number of potential situations. For this purpose, the actual 95 airport operations were varied using composite beta
distributions, applied through a scaling factor on the total number of flights by seat class. Each case essentially
represents a different potential change to the operational landscape. The generic runways are then scaled
parametrically by seat class using the same scaling factors, and the ability of generic runways to retain their
accuracy can thus be examined. The success of the test is measured by the clustering of the error about zero.
Furthermore, the correlation of change in total operations and operations by seat class must be relatively low, as any
error trend with respect to changing seat class operations
would be troublesome for predicting future flight operational
scenarios. The results are shown in Figure 6, with density
ellipses use to aid in the visualization of the correlation. As
can be seen in the results, the distribution of the error is
clustered about zero, and there is insignificant correlation with
respect to changes in total operations, and operations by seat
class for all except seat class 2. It was found, in this case, that
the representative aircraft selected was much louder than most
aircraft in that seat class, and therefore the error with respect
to changes in seat class 2 operations cause a correlation with
predictive error. Nonetheless, the correlation is relatively
minor, and it is expected that replacing the representative
aircraft with a more appropriate vehicle in the future would
erase the correlation. Removing cases in which seat class 2
operations are at the extreme confirms this likelihood as it
results in more reasonable correlation for total error as can
be seen in Table 5. Therefore, the generic runways can be
considered to be robust to a varying flight schedule,
demonstrating the ability to retain accuracy under such circumstances.
% Change in
Volume
Error
Correlation
Error Correlation
(extreme SC2
cases removed)
Total Operations 0.46 0.26
SC3 0.30 0.09
SC4 -0.14 -0.17
SC5 -0.17 -0.14
SC6 0.04 0.18
SC7 -0.07 0.18
SC8 -0.17 -0.00
SC9 -0.12 -0.30
Figure 6: Relative error versus relative change in total
operations and change in operations by seat class.
Table 5: Correlations with respect to predictive error by
total operations and by seat class.
José E. Bernardo
9th
Annual Joseph A. Hartman Student Paper Competition
11
Aerospace Systems Design Laboratory
School of Aerospace Engineering, Georgia Institute of Technology
B. Generic Infrastructures
Grouping
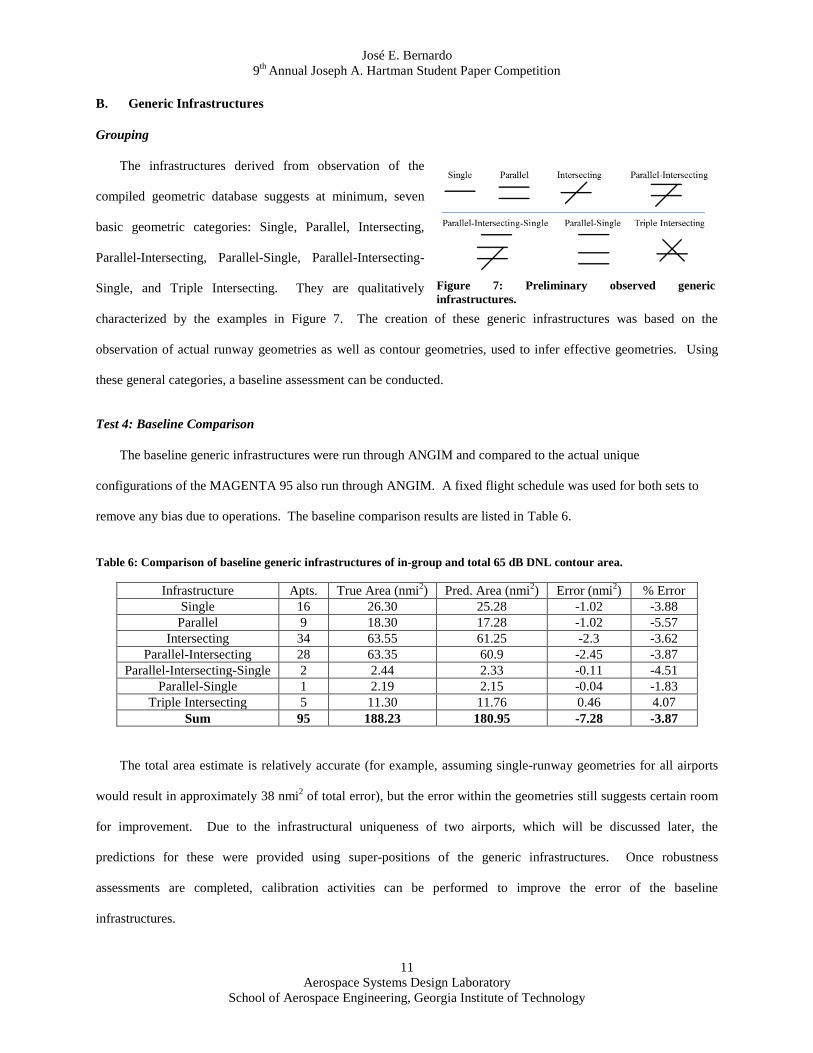
The infrastructures derived from observation of the
compiled geometric database suggests at minimum, seven
basic geometric categories: Single, Parallel, Intersecting,
Parallel-Intersecting, Parallel-Single, Parallel-Intersecting-
Single, and Triple Intersecting. They are qualitatively
characterized by the examples in Figure 7. The creation of these generic infrastructures was based on the
observation of actual runway geometries as well as contour geometries, used to infer effective geometries. Using
these general categories, a baseline assessment can be conducted.
Test 4: Baseline Comparison
The baseline generic infrastructures were run through ANGIM and compared to the actual unique
configurations of the MAGENTA 95 also run through ANGIM. A fixed flight schedule was used for both sets to
remove any bias due to operations. The baseline comparison results are listed in Table 6.
Table 6: Comparison of baseline generic infrastructures of in-group and total 65 dB DNL contour area.
Infrastructure Apts. True Area (nmi2) Pred. Area (nmi
2) Error (nmi
2) % Error
Single 16 26.30 25.28 -1.02 -3.88
Parallel 9 18.30 17.28 -1.02 -5.57
Intersecting 34 63.55 61.25 -2.3 -3.62
Parallel-Intersecting 28 63.35 60.9 -2.45 -3.87
Parallel-Intersecting-Single 2 2.44 2.33 -0.11 -4.51
Parallel-Single 1 2.19 2.15 -0.04 -1.83
Triple Intersecting 5 11.30 11.76 0.46 4.07
Sum 95 188.23 180.95 -7.28 -3.87
The total area estimate is relatively accurate (for example, assuming single-runway geometries for all airports
would result in approximately 38 nmi2 of total error), but the error within the geometries still suggests certain room
for improvement. Due to the infrastructural uniqueness of two airports, which will be discussed later, the
predictions for these were provided using super-positions of the generic infrastructures. Once robustness
assessments are completed, calibration activities can be performed to improve the error of the baseline
infrastructures.
Figure 7: Preliminary observed generic
infrastructures.

José E. Bernardo
9th
Annual Joseph A. Hartman Student Paper Competition
12
Aerospace Systems Design Laboratory
School of Aerospace Engineering, Georgia Institute of Technology
Test 5: Robustness Assessment
The robustness assessments of the generic infrastructures were performed on the fundamental geometries,
except for the Single runway infrastructure. The Single runway airport infrastructure is trivial, since no variation is
possible, and is really an extreme case of the Parallel configuration. The other geometries can be created by
superimposing the fundamental geometries without further runway intersections, and are therefore also trivial cases.
The variables examined for each fundamental geometry were the cartesian position of the left runway-end and the
rotation about that end if applicable. The ranges used for the DOE are listed in Table 7.
Table 7: Geometric variable ranges for infrastructure robustness assessments.
GI X2 (nmi) Y2 (nmi) θ2 (deg) X3 (nmi) Y3 (nmi) θ3 (deg)
Parallel -1.25 – 1.25 0 – 1.6 N/A N/A N/A N/A
Intersecting 0.3 – 5.3 -1.5 – 1.5 0 – 180 N/A N/A N/A
Parallel-Intersecting -1.25 – 1.25 0 – 1.6 0.3 – 5.3 -1.5 – 1.5 0 – 180 -1.25 – 1.25
Triple Intersecting -1.5 – 1 -1.5 – 1.5 15 – 75 1 – 3.5 -1.5 – 1.5 105 – 165
These were varied, using fixed operations and the resulting contours were calculated through ANGIM. The results
were evaluated to identify any relevant sub-categories and to uncover trends between the variables. A subset of the
analysis can be seen in Figure 8, where the
Parallel, Intersecting, and Parallel-
Intersecting geometry results were used to
observe the effect of the geometric variables
on the airport 65 dB DNL contour area.
Based on the lack of segmentation as a
function of the geometric variables in Figure
8, no other significant geometries were
identified. The trends identified, however,
will be very valuable to tune the baseline
configurations.
Calibration
Having completed the baseline analysis, and examined the effect of the various geometric varibles, the
information from both can be utilized to perform calibration. The baseline analysis, visualized in Figure 9, can be
used to determine the required direction of calibration, while the robustness assesments can be used to provide the
Figure 8: Trends on 65 dB DNL contour area with respect to geometric
variables for various generic infrastructures.
José E. Bernardo
9th
Annual Joseph A. Hartman Student Paper Competition
13
Aerospace Systems Design Laboratory
School of Aerospace Engineering, Georgia Institute of Technology
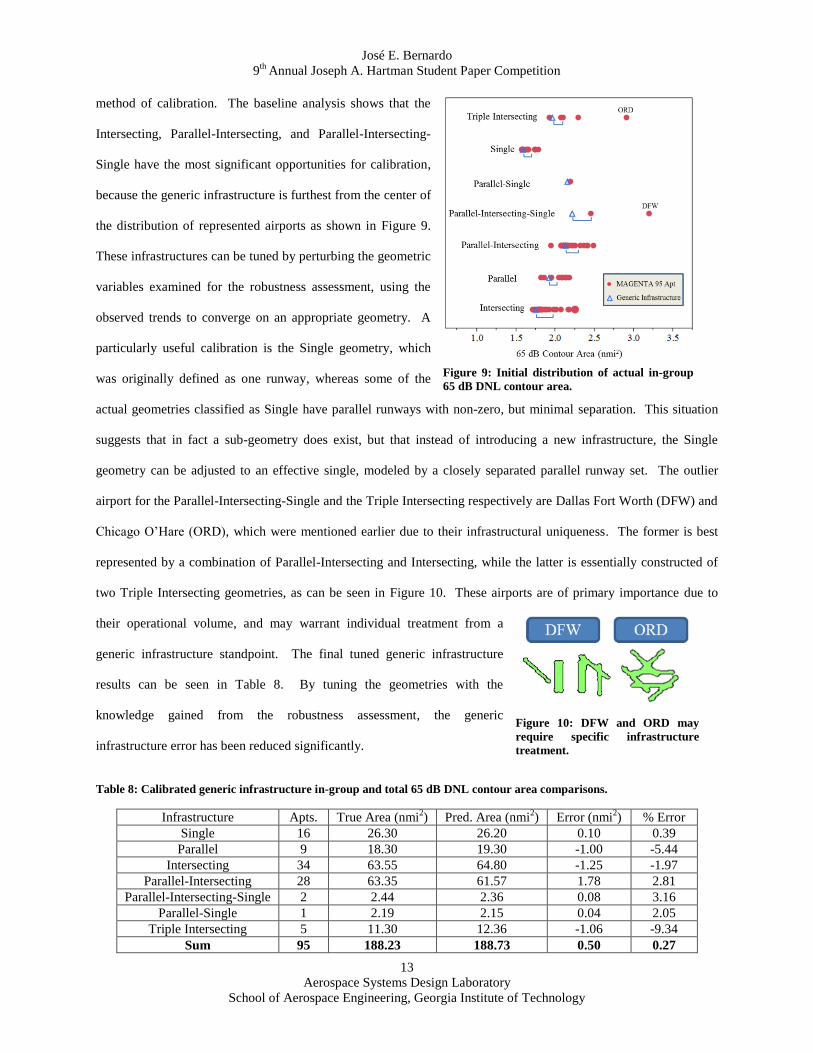
method of calibration. The baseline analysis shows that the
Intersecting, Parallel-Intersecting, and Parallel-Intersecting-
Single have the most significant opportunities for calibration,
because the generic infrastructure is furthest from the center of
the distribution of represented airports as shown in Figure 9.
These infrastructures can be tuned by perturbing the geometric
variables examined for the robustness assessment, using the
observed trends to converge on an appropriate geometry. A
particularly useful calibration is the Single geometry, which
was originally defined as one runway, whereas some of the
actual geometries classified as Single have parallel runways with non-zero, but minimal separation. This situation
suggests that in fact a sub-geometry does exist, but that instead of introducing a new infrastructure, the Single
geometry can be adjusted to an effective single, modeled by a closely separated parallel runway set. The outlier
airport for the Parallel-Intersecting-Single and the Triple Intersecting respectively are Dallas Fort Worth (DFW) and
Chicago O’Hare (ORD), which were mentioned earlier due to their infrastructural uniqueness. The former is best
represented by a combination of Parallel-Intersecting and Intersecting, while the latter is essentially constructed of
two Triple Intersecting geometries, as can be seen in Figure 10. These airports are of primary importance due to
their operational volume, and may warrant individual treatment from a
generic infrastructure standpoint. The final tuned generic infrastructure
results can be seen in Table 8. By tuning the geometries with the
knowledge gained from the robustness assessment, the generic
infrastructure error has been reduced significantly.
Table 8: Calibrated generic infrastructure in-group and total 65 dB DNL contour area comparisons.
Infrastructure Apts. True Area (nmi2) Pred. Area (nmi
2) Error (nmi
2) % Error
Single 16 26.30 26.20 0.10 0.39
Parallel 9 18.30 19.30 -1.00 -5.44
Intersecting 34 63.55 64.80 -1.25 -1.97
Parallel-Intersecting 28 63.35 61.57 1.78 2.81
Parallel-Intersecting-Single 2 2.44 2.36 0.08 3.16
Parallel-Single 1 2.19 2.15 0.04 2.05
Triple Intersecting 5 11.30 12.36 -1.06 -9.34
Sum 95 188.23 188.73 0.50 0.27
Figure 9: Initial distribution of actual in-group
65 dB DNL contour area.
Figure 10: DFW and ORD may
require specific infrastructure
treatment.

José E. Bernardo
9th
Annual Joseph A. Hartman Student Paper Competition
14
Aerospace Systems Design Laboratory
School of Aerospace Engineering, Georgia Institute of Technology
C. Test 6: Generic Airports Validation
Finally, the generic runways and generic infrastructures can be combined to yield the total set of generic
airports. The combination led to a total of 21 generic airports, less than a quarter of the original sample set. If
specific infrastructures are used for DFW and ORD, the total number remains unchanged, since they are also fairly
unique from an operational perspective. The final evaluation thus consists of validating the ability for the generic
airports to predict the in-group and total fleet-level 65 dB DNL contour area of the 95 MAGENTA airports using the
actual operations, unique aircraft, and actual infrastructure geometries. This test also allows for examination of the
enabling assumption of decoupling operational and geometric characteristics along the lines of magnitude and shape.
The summary of the total fleet-level estimate results are listed in Table 9 and the distribution of the absolute errors
for all generic airport groups can be seen in Figure 11. As
can be seen, the total area is well predicted, and the error is
evenly distributed about zero. While the in-group error is
also acceptable, there may be further opportunities for calibration. It is
important to recall that calibration must be done at the generic runway or
generic infrastructure level, however, as the relatively low amount of
variability within these types will provide significantly increased
computation speed. On the other hand, if calibration is done at the generic
airport level, the simplicity in combining a handful of types will be
somewhat compromised. While this would still result in a significant
savings, it would not fully exploit the potential gains.
V. Conclusions and Future Work
The research presented above demonstrates the approach and implementation required to create a set of generic
airports in support of a generic framework for environmental aviation analysis. These generic airports can be used
to infer noise-specific trends about airports, by simply analyzing the generic version, saving runtime in early fleet-
level airport noise analyses. Generic airports were constructed by decoupling the operational and geometric
characteristics into generic runways and generic infrastructures respectively. Generic runways were created using
operational data to group airports by total operations, and seat class distribution of flights. Generic runways were
Pred.Area
(nmi2)
Actual Area
(nmi2)
Error
(nmi2)
% Error
144.86 149.47 -4.68 -3.13
Figure 11: Absolute error
distribution for generic airport
groupings.
Table 9: Summary of prediction error for generic airports.
José E. Bernardo
9th
Annual Joseph A. Hartman Student Paper Competition
15
Aerospace Systems Design Laboratory
School of Aerospace Engineering, Georgia Institute of Technology
then verified to ensure that the mathematical model behaved as expected, and were validated with respect to fleet
diversity and variation in operational scenarios. The generic runways demonstrated that they can predict the fleet-
level 65 dB DNL contour area of the 95 sample airports, as well as preserving trends and accuracy in the face of a
changing operational landscape. Generic infrastructures, on the other hand, were created by gathering geometric
data, such as actual runway layout, and resulting contour geometries to create reduced ‘effective’ geometries. These
effective geomtries were then qualitatively categorized to yield seven generic infrastructures. Baseline generic
infrastructures were used to examine the direction required for calibration, while a configuration robustness
assessment was utilized to define the mode of calibration. Calibration was then performed and the evaluation was
executed to demonstrate the ability of generic infrastructures to predict the fleet-level 65 dB DNL contour of the 95
sample airports successfully. Twenty-one generic airports were then constructed by joining the two components,
and similarly shown to provide accurate in-group and total predictions of the 65 dB DNL contours for the 95 sample
airports. Regardless of whether or not a detailed or rapid-simplified model is being utilized, quartering the
preparation, runtime, and analysis requirements is a significant improvement that enables more fleet-level analysis,
leading to more informed decisions. By examining the generic classes presented here, a significant amount of
insight can be gained on the unique airports, before there is any need to perform a detailed specific analysis,
allowing computational and time resources to be allocated with greater confidence and efficiency.
While a successful preliminary set of generic airports was presented here, there are still opportunities for further
research in this area. For example, the variables utilized for grouping were relatively limited in number, and the
cost-benefit of including more detailed variables could be examined with respect to the total number of final generic
airports (resulting in a loss of computational efficiency) versus the increased precision and robustness of the final
set. With respect to generic infrastructures, more quantitative methods could be employed to provide a less
subjective approach to the categorization of airport geometries. An objective categorization of the grouping
variables may yield a more robust and internally consistent result. Finally, while a currently available set of aircraft
noise models was used, an improved set can now be obtained with the most recent release of AEDT, and these noise
responses should be utilized to provide a more concrete assessment of the groupings presented here. The current
grids also led to the definition of a representative vehicle for seat class 2 that was overpredicted the seat class 2
operations as they were scaled away from thebaseline. A future assessment must replace the seat class 2
representative vehicle with a more appropriate selection.

José E. Bernardo
9th
Annual Joseph A. Hartman Student Paper Competition
16
Aerospace Systems Design Laboratory
School of Aerospace Engineering, Georgia Institute of Technology
Acknowledgements
The author would like to thank Dr. Michelle Kirby and Dr. Dimitri Mavris for their guidance and support
conducting this research at the Aerospace Systems Design Laboratory. The author would also like to thank the FAA
for their sponsorship of this research under the FAA Award Number 09-C-NE-GIT, Amendment No. 001, and
especially Joe DiPardo, the FAA program manager. The author would also like to extend thanks to Dr. Holger
Pfaender, Dr. Hernando Jimenez, Christopher Perullo, Matthew LeVine, Benjamin Havrilesko, and Andrew
Peterson for their support in conducting this research.
Student Biography
Mr. Bernardo received his Bachelor of Science in Mechanical Engineering from the University of Pittsburgh in
the spring of 2008. He then went on to join the Aerospace Systems Design Laboratory at the Georgia Institute of
Technology. He received his Masters of Aerospace Engineering from there in December 2009. He is now a Ph.D.
candidate at Georgia Tech and recently received the FAA DOT Student of Year Award for 2012. Mr. Bernardo’s
research focuses on developing a rapid fleet-level noise prediction methodology, including new metrics for
describing airport contours, and generic classifications of airports with respect to noise. His goal is to create and
demonstrate a methodology to better investigate fleet-level noise early in the technology selection process, allowing
decision makers to better select and invest between options for further development.
References
[1] Carbon Mitigation Initiative, “Carbon Mitigation Initiative: Annual Report 2009”, Princeton University, New Jersey, 2010,
p.72.
[2] Passchier-Vermeer, W., and Passchier, W. F., “Noise Exposure and Public Health,” Environmental Health Perspective;
Vol.108, Supplement 1, 2000, pp. 123-131.
[3] Mestre, V., “Effects of Aircraft Noise: Research Update on Selected Topics: A Synthesis of Airport Practice,” ACRP
Synthesis 9, Transportation Research Board, Washington, D.C., 2008.
[4] Manci, K. M., Gladwin, D. N., Villella, R., Cavendish, M., “Effects of Aircraft Noise and Sonic Booms on Domestic
Animals and Wildlife: A Literature Synthesis,” National Ecology Research Center, U.S. Department of the Interior Fish and
Wildlife Service, Jun. 1988, URL: http://www.dtic.mil/cgi-
bin/GetTRDoc?AD=ADA201966&Location=U2&doc=GetTRDoc.pdf.
José E. Bernardo
9th
Annual Joseph A. Hartman Student Paper Competition
17
Aerospace Systems Design Laboratory
School of Aerospace Engineering, Georgia Institute of Technology
[5] Takemoto, P., “Fact Sheet – Next Generation Air Transportation System”, Federal Aviation Administration Press Release,
Washington, DC, May. 2010, URL: http://www.faa.gov/news/fact_sheets/news_story.cfm?newsId=10261.
[6] G Skalecky, J., “CLEEN Planned Solicitation,” FAA Office of Environment and Energy, CLEEN Market Research
Conference, Washington, DC, May. 2008, URL:
http://www.faa.gov/news/conferences_events/2008_market_research_conference/materials/media/CLEENPlannedSolicitatio
n.pdf .
[7] Aeronautics Science and Technology Subcommittee, “Biennial Update: National Aeronautics Research and Development
Plan,” Committee on Technology: National Science and Technology Council, Feb. 2010, URL:
http://www.whitehouse.gov/sites/default/files/microsites/ostp/aero-rdplan-2010.pdf.
[8] Del Rosario, R., Wahls, R., Follen, G., Madavan, N., “Subsonic Fixed Wing Project,” Fundamental Aeronautics Program
2011 Technical Conference, Cleveland, OH, Mar. 2011, URL:
http://www.aeronautics.nasa.gov/pdf/subsonic_fixedwing.pdf.
[9] Bernardo, J. E., Kirby, M., Mavris, D. N., “Development of a Generic Fleet-Level Noise Methodology,” AIAA, 50th AIAA
Aerospace Sciences Meeting and Exhibit Including the New Horizons Forum and Aerospace Exposition, AIAA- 2012-339,
Nashville, TN, Jan. 9-12, 2012.
[10] Tetzloff, I. J., Crossley, W. A., “An Allocation Approach to Investigate New Aircraft Concepts and Technologies on Fleet-
Level Metrics,” 9th AIAA Aviation Technology, Integration, and Operations Conference (ATIO), AIAA 2009-6979, Hilton
Head, South Carolina, 2009.
[11] Becker, K., “A Methodology to Enable Rapid Evaluation of Aviation Environmental Impacts and Aircraft Technologies,”
Ph.D. Dissertation, School of Aerospace Engineering, Georgia Institute of Technology, Atlanta, GA, 2011.
[12] Federal Aviation Administration, “Aviation Environmental Design Tool (AEDT)”, FAA, URL:
http://www.faa.gov/about/office_org/headquarters_offices/apl/research/models/aedt/.
[13] Isley, S., Kirby, M., “A Comparison of Aircraft Retirement and Fuel Efficiency Policy Instruments: A Modified Fleet and
Operations Module Approach,” 7th Annual Joseph A. Hartman Student Paper Competition, Sept. 2010.
[14] Ottl, G., and Bock, P., “An Approach to Airport Categorization – Category Definition and Quantification for Air Traffic
Related Simulation Purposes,” Journal of Aerospace Operations 1, pp. 155-170, IOS Press, 2012.
[15] Bock, P., Schinwald, C., “Airport Capacity Impact of New Aircraft Concepts: How to Manage Airport Diversity and
Individuality,” CEAS Aeronautics Journal 2: 3-10, 2011.
[16] Kish, C., “An Estimate of the Global Impact of Commercial Aviation Noise,” Master’s Thesis, Massachusetts Institute of
Technology, Jun., 2008.
[17] FAA, “Environmental Tool Suite Frequently Asked Questions,” URL:
http://www.faa.gov/about/office_org/headquarters_offices/apl/research/models/toolsfaq/, Jul., 2012.
[18] Bernardo, J., Kirby, M., Pfaender, H., Mavris, D., “CO2 Emission Metrics for Commercial Aircraft Certification: A National
Airspace System Perspective: A PATNER Project 30 Findings Report,” Partnership for AiR Transportation Noise and
Emissions Reduction, An FAA/NASA/Transport Canada-sponsored Center of Excellence, Report No. PARTNER-COE-
2012-002, Mar. 2012.
[19] Kirby, M., Becker, K., Isley, S., Burdette, G., Mavris, D., “Development of an Interactive Capability to Trade Off New
Technologies and Future Aircraft to Reduce Aviation Environmental Impacts,” ICAS 2010-4.10.2-645, 2010.
[20] Pang-Ning Tan, Michael Steinbach, and Vipin Kumar, Introduction to Data Mining. 1st edn (Boston: Pearson Addison
Wesley, 2006), pp. xxi, p. 769.
[21] Boeing, “Airport Noise and Emissions Regulations: Tucson International Airport,”
http://www.boeing.com/commercial/noise/tucson.html , accessed Dec. 18, 2012.

José E. Bernardo
9th
Annual Joseph A. Hartman Student Paper Competition
18
Aerospace Systems Design Laboratory
School of Aerospace Engineering, Georgia Institute of Technology
[22] AirNav, “KTUS: Tucson International Airport, Tucson, Arizona, USA,” http://www.airnav.com/airport/KTUS, accessed
Dec. 18, 2012.
[23] Federal Aviation Administration, “Airport Design,” Advisory Circular, AC 150/5300-13, U.S. Department of
Transportation, Sep. 29, 1989.