development and application of sqfd model …iaeme.com/masteradmin/uploadfolder/sqfd-model.pdf ·...
TRANSCRIPT

International Journal of Industrial Engineering Research and Development (IJIERD), ISSN 0976 –
6979(Print), ISSN 0976 – 6987(Online) Volume 2, Issue 1, May - October (2011), © IAEME
15
DEVELOPMENT AND APPLICATION OF SQFD MODEL FOR AN
INNOVATIVE EMBEDDED SOFTWARE PRODUCT – A CASE
STUDY
Dillibabu,R.
Department of Industrial Engineering, Anna University, India, Chennai.
Telephone No: +914422357680
Krishnaiah,K.
Department of Industrial Engineering, Anna University, India, Chennai.
Telephone No: +914422357673
Baskaran,R.
Department of Industrial Engineering, Anna University, India, Chennai.
Telephone No: +914422357683
ABSTRACT
This paper discusses the development and application of Software Quality Function Deployment
(SQFD) Model for a new embedded software product. A detailed Literature study has been
carried out on the applications of QFD model for software development. An integrated SQFD
model with House of Quality (HOQ), Subsystem/Module Deployment Matrix and Technology
Deployment Matrix is developed. The proposed SQFD model has been implemented for
developing a new embedded software product. From the HOQ matrix reveals that the ‘image
capture button’ and ‘imaging’ has been identified as the most important technical requirement for
this product. The “Procedure Recording” Subsystem has been identified as the most critical
subsystem that affects the design. The most suitable technology that meets the design is the
‘Prism+, pSOS’. Accordingly, recommendations are made to the company. The study
demonstrates that the SQFD technique is suitably applied using SQFD Model in an embedded
software product, and it is appropriate for the design and development of new software products.
KEYWORDS: Software Quality Function Deployment, House of Quality, Embedded Software,
Technology deployment matrix, Subsystem Deployment Matrix and New Product Deployment.
1.0 INTRODUCTION
Software quality has traditionally been defined in terms of fitness for use based on Juran’s
definition of quality. A software product is deemed fit for use if it performs to some level of
International Journal of Industrial Engineering Research
and Development (IJIERD), ISSN 0976 – 6979(Print)
ISSN 0976 – 6987(Online) Volume 2
Issue 1, May – October (2011), pp. 15-45
© IAEME, http://www.iaeme.com/ijierd.html
IJIERD
© I A E M E

International Journal of Industrial Engineering Research and Development (IJIERD), ISSN 0976 –
6979(Print), ISSN 0976 – 6987(Online) Volume 2, Issue 1, May - October (2011), © IAEME
16
satisfaction, in terms of functionality and continuous operation (William and Raja 1995) and
(Yoji 1997). An important element of software quality is the reduction of management risk. Late
delivery, cost overruns, inadequate product performance, and a short product life are management
risks that must be controlled along with fitness for use to obtain software quality. These
management risks relate to the process of developing software and not the software product itself.
Quality Function Deployment (QFD) is a useful quality analysis and improvement tool with
many advantages. The following are the advantages of QFD
(i) Fewer and earlier design changes
(ii) Reduced Product Development cycle time
(iii) Fewer startup problems
(iv) Easier documentation
(v) Fewer field problems
(vi) Warranty claim reduction
(vii) Development of cross-functional team work
(viii) Improved design reliability
(ix) Customer Satisfaction
QFD is also employed for designing IT-related products (software industry). When using QFD, it
is important to understand the needs of the customers, and then we can design or modify the
product to meet their needs (Ronald 1996). The manufacturing QFD (Taeho and Kim 1998) was
developed in Japan in the mid 60’s by Yoji Akao and Shigreu Mizuno. QFD is a method to
transfer customer needs into product and process requirements. The idea is to develop a product
by focusing the effort and limited resources of a project team on what delivers the best value to
the most important stakeholders. Adaptation of the classic QFD applicable to manufacturing
industries to software products is termed as SQFD.
The unique characteristics of software development necessitate the modification of conventional
QFD for use in deploying software design. The first characteristic is that software development is
not a repetitive production process that must be designed for each product. QFD has been
originally conceived as a way of deploying customer requirements throughout the production
process of a product, from design to manufacturing. Software elements are developed to a set of
design specifications. In QFD this would equate to a part of product deployment.
The second major difference between manufacturing and software development is that the
customer requirements are not directly met by specific technical specifications. Unlike
manufactured goods, software or information systems are typically intended to provide support
infrastructure or to act as an enabling mechanism for an organizational process. In QFD, customer
requirements are translated into technical specifications for a particular product. In the case of
software or information systems development, customer needs are met by providing certain
system functions. These system functions may require the development of one or more software
systems. For example; the customer needing “accurate inventory information” would be require
the construction of inventory tracking software, purchasing and receiving software, and cost
management software. These individual program elements would require finally an integration
structure to meet the stated customer requirements. SQFD model with GQM (Goal Question
Metric) is also studied and is shown in Fig 1.
2.0 LITERATURE
Several Researchers have developed or applied QFD models for engineering/manufacturing
products (Georg et al. 1995; Glenn 1993; Tan, Xie and Chia 1998; Taeho and Kim 1998; Yoji
1997; Yoji and Mazur 2003). SQFD model is based on assessment of impact of technical
attributes on satisfaction of customer requirements (Liu et al. 2006). Software requirements

International Journal of Industrial Engineering Research and Development (IJIERD), ISSN 0976 –
6979(Print), ISSN 0976 – 6987(Online) Volume 2, Issue 1, May - October (2011), © IAEME
17
validation uses SQFD tools (Joao, Pedro and Ana 2005). SQFD is used also to evaluate software
quality (Pedro, Marcos, Jose and Luis 2005). But only a very few researchers have contributed to
Software Quality Function Depolyment (Georg and Schockert 2003; Georg, Schockert and
Werner 1995), (Ohmori 1993), existing SQFD models reveals some of the drawbacks which are
presented in Fig 2. From the literature review it is found that very few researchers have developed
and applied SQFD models to practical cases. Also the existing models have several drawbacks as
listed in Fig 2. In this study it is proposed to develop SQFD model for a new embedded software
product and implement it in a leading software company.
3.0 DEVELOPMENT OF THE PROPOSED SQFD MODEL
Great Success has been derived from the use of SQFD by a number of companies. The previous
models have been implemented either for a new product development or as an intensifier or
enabler of the key process of the customer organization. Most of the existing SQFD models have
the components of competitor and technical analysis and as such these cannot be applied to
embedded products. The previous SQFD model had the weakness of not employing the “house of
quality” form and hence the developers cannot explicitly examine the relationships between
technical requirements or the “hows” listed along the x-axis of the matrix (William and Raja
1995). The effects due to product or process characteristics remain unknown, and therefore
cannot be improved. Therefore, the following three matrices are proposed to be included in the
Proposed SQFD Model.
(i) Software House of Quality (S-HOQ) Matrix
(ii) Subsystem or Module Deployment Matrix
(iii) Technology Deployment Matrix
3.1 Software House of Quality (S-HOQ) Matrix
The utility of QFD is that it requires a company to clearly articulate the means by which it will
achieve customer requirements. It relates customer or market needs to be high-level internal
technical design requirements using a planning matrix called the house of quality. The basic
structure of the house of quality is shown in fig 4. Listed on the left side of the matrix is what the
customer needs or requires. Listed along the top of the matrix are the design attributes or
technical requirements of the product; these are how the product can meet customer requirements
shown in additional sections on the top, right, and bottom sides are correlations among the
requirements, comparisons to competitors, technical assessments, and target values.
The procedure suggested by Ronald (Ronald 1996) and (Yoji 1997) has been followed in
developing the S-HOQ matrix (Fig 6). The details of the S-HOQ matrix are presented below.
(i) Whats and Customer Importance: The voice of the customer or the customer requirements are
gathered through brainstorming (Fig 8, step 1) comprising the representatives of the client
company who produces the product. These requirements are grouped into related categories
using affinity diagram and presented as whats in the S-HOQ (He, Staples, Ross and Court 1996).
Using Analytic Hierarchy Process (Taeho and Kim 1998) and Paired Comparisons, ratings for
the whats are identified in a scale 1 to 10 by brainstorming (Fig 8, step 1). One implies low
importance or priority and 10 imply high importance or priority.
(ii) Hows: The hows (technical requirements) are obtained by conducting a brainstorming.
Although the process is often more technical at this point, the team shall still include
representatives of all functions in the organization. The Hows are recorded in the voice of the
engineer. Hows usually represent the product features, design requirements, product
characteristics, product criteria, substitutes of quality characteristics and technical requirements.
The hows represent the means by which a company responds to the user wants and needs. These

International Journal of Industrial Engineering Research and Development (IJIERD), ISSN 0976 –
6979(Print), ISSN 0976 – 6987(Online) Volume 2, Issue 1, May - October (2011), © IAEME
18
technical requirements are listed along the top of the software House of Quality. Each technical
requirement may affect one or more of the customer voices.
(iii) Target Values: The potential Hows are quantified by fixing target values by conducting
another brainstorming. If any technical requirement is not quantifiable then at least a qualitative
statement to measure that technical requirement has to be given. These target values are recorded
in the voice of the engineer table itself.
(iv) Relationship Matrix and Validation of Relations: The relationship matrix (John 1999; Tan et
al. 1998; Ohmori 1993) is the most important part of the HOQ. As most of the data are collected
through brainstorming, there is a need to validate the important outcomes of the brainstorming
using any quantitative technique. One way is to design a questionnaire and obtain responses from
the developers and validate using statistical testing of hypothesis.
The relationships between customer requirements and technical requirements are established
through brainstorming together with the customer representatives. These relationships are related
between every what and every how. All relationships are categorized as either strong, medium or
weak. Different symbols are used to signify different relationship strengths (circle with dot in the
center signifies a strong relationship, blank circle signifies a medium relationship and triangle
signifies a weak relationship). The allocation and categorization of the relationships are carried
out through careful consideration and double-checked a number of times.
(v) Correlation “Roof” Matrix: This matrix assists the software engineers to specify the various
engineering features that have to be improved collaterally. The roof contains the most critical
information which is used to balance the trade-offs when addressing the customer benefits. These
relations are obtained through brainstorming with the members of the QFD team. Different
symbols are used to indicate the strength of the relationships. The correlations are categorized as
strong positive relationship, positive relationship, negative relationship and strong negative
relationship. A blank cell represents no relationships. The positive symbols show which Hows
support each other and the negative symbols show which Hows are in conflict.
(vi) Organizational Difficulty: The organization difficulties are assessed by conducting a
brainstorming and are represented in a scale of 1 to 10. One imples low difficulty in satisfying the
particular technical requirement and 10 implies high difficulty in satisfying the particular
technical requirement.
(vii) Weightage Factor: The weightage scheme is selected by conducting a brainstorming session.
In this meeting usually only the members (developers) of the QFD team are present. This
selection was based on the gap between the relations categorized as strong, medium and low.
These weightage factors are then recorded in the data template.
(viii) Absolute Importance: A cell (i,J) in the relationship matrix of HOQ represents a strong,
medium or weak relationship between ith customer requirement (CR) and j
th Technical
requirement (TR). The absolute and relative importance of TRs is computed using the Customer
Importance of CRs and the relationship ratings (Taeho and Kim 1998).
For each TR, the absolute importance rating is computed as
m
AIj = ∑ CIi * Rij ……………………(1)
i=1

International Journal of Industrial Engineering Research and Development (IJIERD), ISSN 0976 –
6979(Print), ISSN 0976 – 6987(Online) Volume 2, Issue 1, May - October (2011), © IAEME
19
where
AIj is Absolute Importance of TRj, j = 1,...,n
CIi is Customer Importance i.e., importance rating of CRi,
i = 1,...,m
Rij is Relationship rating representing the strength of the relationship between CRi and
TRj.
(ix) Relative Importance: The absolute importance rating can then be transformed into the
Relative Importance rating, RIj, as
AIj
RIj = ………………………………… (2)
n
∑ AIk
k=1
The larger the RIj, the more important is TRj. Thus, without consideration of any other
constraints such as cost and time, TRs should be incorporated into the product of interest in the
order of their relative importance rating to achieve more customer satisfaction. The qualitative
relationship viz strong, medium and weak are generally assigned a value of 9, 3 and 1
respectively for obtaining the ratings (Ronald 1996) and (Yoji 1997). However these values can
be arrived at by conducting a brainstorming session for specific cases in practice. After
computing the absolute and relative importance of the Technical requirements they are
normalized to a scale of 1 to 10. 1 implies low importance and 10 implies high importance or
priority.
3.2 Subsystem or Module Deployment Matrix
The Subsystem or module deployment matrix is prepared in a manner very similar to the S-HOQ
matrix which is shown in Fig 6 (Mekki and Sherif 1997; Ronald 1996; Yoji 1997). Each critical
subsystem or module requires the incorporation of all the technical requirements into the product
and is designed by conducting brainstorming with the engineers. The technical requirements
defined in the S-HOQ matrix become whats that are listed down on the left side of the subsystem
or module deployment matrix along with priorities (based on the normalization of S-HOQ matrix
relative importance ratings) and target values.
Relationship Matrix: Relationships are established between technical requirements and the critical
subsystem or module. These relationships are then categorized as strong, medium, or weak and
are validated using a questionnaire (brainstorming) and hypothesis testing.
Importance Rating of Subsystem: Importance rating of each subsystem or module are calculated
using equation (1) with slight modification. In Subsystem or Module deployment matrix, a cell (i,
j) in the relationship matrix represent a strong, medium, or weak relationship respectively
between ith Technical requirement (TR) and j
th Subsystem (SS). The importance rating of
Subsystem is computed using the normalized importance of TRs and the relationship ratings
(Taeho and Kim 1998). For each SS, the importance rating is computed as

International Journal of Industrial Engineering Research and Development (IJIERD), ISSN 0976 –
6979(Print), ISSN 0976 – 6987(Online) Volume 2, Issue 1, May - October (2011), © IAEME
20
m
IRj = ∑ NIi * Rij …………………. (3)
I=1
where
IRj is Importance Rating of SSj, j = 1,...,n
NIi is Normalized Importance of TRi, i = 1,...,m
Rij is Relationship rating representing the strength of the relationship between TRi and
SSj
3.3 Technology Deployment Matrix
The technical requirements defined in the S-HOQ Matrix shall become the whats listed on the left
side of the Technology deployment matrix along with priorities and target values. This matrix is
developed similar to that of subsystem/module matrix (Fig 6). The only change here is that the
subsystem/module is replaced by the term technologies is shown in Fig 7.
4.0 PROPOSED SQFD MODEL
The proposed SQFD Model is shown in Fig 8. It is an integrated model of S-HOQ
Subsystem/Module Deployment Matrix and the Technology Deployment Matrix. This model is
validated through a case study.
5.0 IMPLEMENTATION OF THE SQFD MODEL
The proposed model has been implemented in one of the leading software companies in India.
The company is a world leader for medical products and has a large global market share in the
Endoscope tools. The endoscope uses a combination of fiber optics and electronics for
performing its function. All the endoscope used today is reusable and need 8-10 hours of
sterilization and disinfection process before they can be reused.
Some of the functions affecting the performance of the products due to the existing software are
presented below:
(i) Printing
(ii) Motor start and Stop Motion Command
(iii) Jet wash on/off status and flow rate setting
(iv) Joystick of speed command

International Journal of Industrial Engineering Research and Development (IJIERD), ISSN 0976 –
6979(Print), ISSN 0976 – 6987(Online) Volume 2, Issue 1, May - October (2011), © IAEME
21
(v) Brightness and contrast adjustment
(vi) Image capture button and imaging
(vii) Recording of Image frame and camera video functions
(viii) GUI navigation commands and SUD connector functions
(ix) Alert Message and Power supply adjustment
(x) Record Camera video data to the DVD
(xi) Database for patients, physicians and procedures
(xii) Directions for use.
Some of the problems in the present endoscope procedure are listed below:
(i) Reusable scope calls for strict sterilization and disinfection process.
(ii) High capital cost for the probes and the allied peripherals and sterilization
equipment.
(iii) High frictional force felt by the patient, necessitating patients to be sedated,
increasing the complexity of the procedure as well as patient recovery time.
(iv) Less number of cases possible by the physician due to long sterilization and
dis-infection process.
(v) Risk of secondary infection due to improper sterilization.
In-spite of sterilization the risk of secondary infection has been reported. This risk
has resulted in reluctance among the patients to undergo colonoscopy procedures. This status is in
existence for the last 25 years, despite progress in the colonoscopy form a simple bare eye viewed
system to a sophisticated CCD camera based system with digital imaging functions. But the
system of reuse has never changed. The client is capitalizing the opportunity of an infection free
safe procedure as their unique selling proposition of their product. Coppelius Console System is
the base unit to which the single use probe is attached and the endoscopy procedure is carried out.
The case company is going to develop embedded software for the endoscope probe. SQFD model
has employed to overcome the problems stated above and improve customer satisfaction. The
steps in its implementation are listed and discussed below.
5.1 Pre-Planning
Pre-planning includes setting the project goals, determining the time schedule, cost planning and
forming the SQFD team. Apart from these activities, the planning phase of a SQFD
implementation includes defining the project’s content (product definition), identification of the
customer groups and their importance for the development ahead as well as selecting customer
representatives. This phase is called as Pre-Planning and consists of normal meetings and
brainstorming sessions of the persons in charge of the project.

International Journal of Industrial Engineering Research and Development (IJIERD), ISSN 0976 –
6979(Print), ISSN 0976 – 6987(Online) Volume 2, Issue 1, May - October (2011), © IAEME
22
5.2 Building the Software House of Quality (S-HOQ)
The entire SQFD process has been carried out by a QFD team with members from all
departments (development, quality management, marketing, sales, service, etc.), and the client
company representatives. Usually formal market research process is applied using focus groups
and in-depth qualitative interview techniques to assess the customer requirements. For the
embedded software development the end user requirements have been obtained from the client
organization, which in turn got them from the actual user of the hardware equipment in which the
embedded software is an integral part.
(i) Whats and Customer Importance: Customer requirements are structured using affinity and tree
diagrams are shown as whats of the software-HOQ (Fig 7). The Whats are ranked in order of
importance using the Analytic Hierarchy Process (Yoji Akao and Mazur 2003) and pair-wise
comparison (Georg, Schockert and Werner 1995). The priority of customer importance displayed
in the HOQ next to each customer voice has been obtained from the QFD team in a scale of 1 to
10. This gives the customer importance or priority rating for the whats of the software-HOQ. One
implies low importance of priority and ten implies high importance of priority.
(ii) Hows : The technical requirements obtained similar to that of customer requirements are
shown as hows of the Software-HOQ carried out similar to the identification of customer
requirements, using a Voice of the Engineer (Fig 8), and is shown in Fig 9. The difference is that
the members of the QFD team consist of the developers during the brainstorming session.
(iii) Target Values: The target values are obtained by converting technical requirements into
measurable quality elements. For the product in case these have been arrived at during the
internal QFD meeting.
(iv) Relationship Matrix and Validation of Relations: The relationships between customer
requirements and technical requirements have been established through brainstorming involving
the customer representatives also. The allocation and categorization of the relationships are
carried out through careful consideration and are double-checked a number of times.
Referring to Fig 9, there is a strong relationship between the customer requirement ‘store image’
and the technical requirement ‘recording of image frame’. Similarly there exist a medium
relationship between the customer requirement ‘responsive tip control’ and the ‘technical
requirement ‘speed oscillation’, and a weak relationship between customer requirement
‘electronic documentation’ and the technical requirement ‘GUI navigation command’. The
customer importance and organization difficulty ratings were obtained through brainstorming are
validated using a questionnaire and hypothesis testing. A Questionnaire (Fig 12-21) has been
developed in MS Excel and sent through E-mail to get response from the developers.
(v) Correlation “Roof” Matrix: The correlation “roof” matrix has been constructed next. This
matrix assists the software engineers to specify the various engineering features that have to be
improved collaterally. The roof contains the most critical information which is used to balance
the trade-offs when addressing customer benefits. These relationships are obtained through
brainstorming with the members of the QFD team. The correlation matrix is constructed using the
relationship keys such as:
An inclined hash symbol for strong negative correlation, a multiplication symbol for negative
correlation, a blank circle for positive correlation and circle with dot in the center for strong
positive correlation. In Figure 9, blank cell represents no relation and others shown are only
positive correlations.

International Journal of Industrial Engineering Research and Development (IJIERD), ISSN 0976 –
6979(Print), ISSN 0976 – 6987(Online) Volume 2, Issue 1, May - October (2011), © IAEME
23
(vi) Organizational Difficulty: These measures provide the software development organization
with a quantitative assessment of their ability to support embedded software development
processes. Such an analysis provides the development organization with:
• Quantitative indicators of changes in organizational priorities;
• Indicators of the effectiveness of software development processes.
The latter point supports continuous improvement efforts on the part of the organizational
software development function. The organization difficulty is represented on a scale of 1 to 10.
One implies low difficulty in satisfying the particular technical requirement and ten implies high
difficulty in satisfying the particular technical requirement. Referring to Figure 9, the company
has a low difficulty of one in satisfying the technical requirement ‘database for patients and
physicians’ and a high difficulty of six in satisfying the technical requirement ‘general
requirement for standards’.
(vii) Weightage Factor: A weightage factor is also attached to each relationship. The weightage
scheme is selected by conducting a brainstorming with the members of the QFD team which
include the developers. The weightage scheme of 9-3-1 is used (Ronald 1996) and (Yoji 1997).
“9” for a strong relationship, “3” for a medium relationship and “1” for a weak relationship.
(viii) Absolute Importance: The absolute importance AIj for each technical requirement is
calculated using the equation (1). In Fig 9, a sample value for one absolute importance is shown.
In the first column the technical requirement “Printing” has a strong relationship with the
customer requirement ‘printing of images by printer’, weak relationship with ‘must be versatile’
and strong relationship with ‘printing images during and after procedures’.. Thus the column
weight for the first column is computed as (9X9) + (7X1) + (9X9) = 169.
(ix) Relative Importance: The Relative Importance (RIj) for each technical requirement is
calculated using the equation (2). In Fig 5, it is represented graphically as histogram. The
column weights are used to identify the technical requirements for quality improvement.
Normalization of Importance: The relative importances of the technical requirements are
normalized on 1 to 10 scale. One implies low importance and 10 implies high importance. The
normalized rating will be used as the priority ratings in the subsequent phases of Subsystem or
module deployment matrix and Technology deployment matrix. The column weights in the
matrix indicate which technical requirement has to be addressed first to improve quality. Then in
Fig 9, the technical requirement “image capture button & imaging” carrying a highest weightage
of 220 needs to be taken up first.
5.3 Subsystem or Module Deployment Matrix
The technical requirements defined in the Software-HOQ matrix shall become the whats for the
Subsystem or Module deployment matrix (Fig 10). The target values are also same as that of
HOQ matrix. The priority ratings are obtained by normalizing the relative importance ratings of
the HOQ. Some of the technical requirements with low priority ratings are not found in the
Module deployment matrix. The critical Subsystems/Modules (Fig 10) required incorporating all
the technical requirements into the product are obtained through brainstorming. Other aspects of
the matrix viz relationships and their validation, wightages and importance ratings are arrived at
similar to that of HOQ. These matrix priorities the critical subsystems based on relative
importance ratings for quality improvement strategy.
5.4 Technology Deployment Matrix

International Journal of Industrial Engineering Research and Development (IJIERD), ISSN 0976 –
6979(Print), ISSN 0976 – 6987(Online) Volume 2, Issue 1, May - October (2011), © IAEME
24
This matrix is also constructed similar to that of subsystem/module deployment matrix by
replacing the subsystem or module block by the Technology block (Fig 11). This contains
alternative technologies suitable to attain the technical requirements. This matrix facilitates the
selection of the technology based on the absolute/relative importance ratings. From Fig 11 it is
seen that the technology “Prism+, pSOS” is most suitable one for the embedded system software.
5.5 Validation of SQFD Model
A survey has been conducted to assess the impact of SQFD before and after its implementation.
Before implementing SQFD, company has been practicing the traditional quality improvement
practices. A questionnaire (Fig 22) has been designed and sets to developers and quality
professionals in the software companies before and after the implementation of SQFD. The
questionnaire contains a set of question on design goals, success factors (Georg et al. 1998) and
results achieved (http://sern.ucalgary.ca/course/seng/613/F97/grp2/report.htm).
The factors are assigned a five point Likert scale: 1-Results not achieved at all, 2-Results not
achieved slightly, 3-Can’t say, 4-Result achieved slightly and 5-Result achieved very well. The
data from the respondents are analysed and shown in Figure 3. The figures in the table are the
mean values of the responses obtained. From Figure 3 it is seen that the implementation of SQFD
produced better results in three areas. A paired ‘t’ test indicates that the overall impact of
implementation of SQFD is significant.
6.0 FINDINGS AND DISCUSSIONS
The development and implementation of SQFD model for a new embedded system software
product has been demonstrated through a case study. This approach can easily be generalized for
many other software development products. It can be concluded that this method is feasible for
defining, measuring, and improving the quality of software. QFD is a powerful tool in TQM and
has, until recently, only been used in manufacturing and other engineering related industries.
Currently all the quality tools including QFD are being applied to software development
processes also.
The following observations are made from the case study:
(i) From Fig 9, it is found that the most important technical requirement that affects customers’
quality is ‘image capture button & imaging’ and the second most important technical requirement
is ‘recording of image frame’. Sine these two have highest absolute importance rating of 220 and
178 respectively.
(ii) Similarly the most critical subsystem that affects design is ‘Procedure Recording subsystem’
and the second most critical subsystem is ‘User Interface subsystem’ (Fig 10).
(iii) The most suitable technology that affects design is ‘Prism+, pSOS’ and the second most
suitable technology is ‘Code Warrior’ (Fig 11).
(iv) The least important technical requirements are ‘Bolus wash variable on the doctors’ monitors
and the ‘Alarm Tones’ (Fig 9).
(v) The least critical subsystem is the ‘User Help Subsystem’ and the next least critical subsystem
is ‘Graphics subsystem’ (Fig 10).
(vi) The least suitable technology is the ‘SECSIMPro’ and the next least suitable technology is
‘Rational suite’ (Fig 11).
Based on these findings it is recommended that the company should direct its efforts and
resources to improve the quality of performance of the Images Capture button and the Imaging
and Recording of Image Frames.
Care should be taken in developing the ‘Procedure Recording’ and the ‘User Interface’
subsystems, as these are the most critical subsystems and a minor bug or defect may result in a

International Journal of Industrial Engineering Research and Development (IJIERD), ISSN 0976 –
6979(Print), ISSN 0976 – 6987(Online) Volume 2, Issue 1, May - October (2011), © IAEME
25
major quality loss. It is also clear that the developers can use the technologies such as ‘Prism+,
pSOS’ and ‘Code Warrior’ for developing this particular embedded software product. It is
suggested that the company fan afford to compromise on the technical requirements such as the
‘Bolus wash variable on the doctors’ monitor’ and the ‘Alarm Tones’ which have least
importance.
Further study is required to determine is this progression does indeed support the development of
software to support business processes. Specific issues include;
(i) Refinements to the deployment scheme use for SQFD
(ii) The development of meaningful quantitative measures to evaluate the priority of
requirements
(iii) The development of quantitative measures to support trade-offs between
implementation deployments
(iv) Formal feedback mechanism to evaluate the level of improvement attained in
meeting the support requirements of business processes.
(v) Formal feedback mechanism to evaluate the benefits obtained by the organization
after implementing the proposed SQFD model.
REFERENCES
1. Ammar H.H., Nikzadeh T. and Dugan J.B. (1997), ‘Petrinets: A methodology for risk assessment
of function specification of software systems using colored’, Proceedings fourth international
software metrics, pp. 108-117.
2. Georg Herzwurm, Gabriele Ahlemeier, Sixten Schockert and Werner Mellis (1998), ‘Success
Factors of QFD Projects’, Proceedings of the World Innovation and Strategy Conference, Sydney,
Australia, pp. 27-41.
3. Georg Herzwurm and Sixten Schockert. (2003), ‘The leading edge in QFD for software and
electronic business’, International Journal of Quality and Reliability Management, Vol. 20, No. 1,
pp. 36-55.
4. Georg Herzwurm, Sixten Schockert and M.Werner. 1995. Higher Customer Satisfactin with
Prioritizing and Focused Software Quality Function Deployment. Transaction of the 7th
Symposium on QFD, QFD Institute, Novi, MI.
5. Glenn, H.M. 1983. Quality Function Deployment for a Medical Device. Sixth Annual IEEE
Computer based Medical Systems Symposium.
6. He Z., Staples G., Ross M. and Court I. (1996), ‘Japanese quality tools in software process
improvement’, The TQM Magazine, vol.8, No.4, pp. 40-44.
7. Joao, R., A. Perdro, and R. Ana. 2005. Software Requirements Negotiation using the software
quality function deployment. Springer-Verlag, Vol 3706, pp.308-324.
8. John, M.N.2001. Competitive Manufacturing Management. Tata Mcgraw Hil.
9. John, K. 1999, Using Quality Function Deployment in Software Requirements Specification.
Andersen Consulting and IDI.
10. Liu, F., K.Noguchi, A. Dhugana, and P.Inuganti. 2006. A quantitative approach for setting
technical targets based on Impact Analysis in Software Quality Function Deployment (SQFD),
Software Quaity Journal, Vol 14, No 2, June 2006, pp.113-134 (22).
11. Mekki I. Elboushi and Joseph S. Sherif (1997), ‘Object-Oriented Software design utilizing quality
function deployment’, Journal of Systems Software, Vol.38, pp. 133-143.
12. Ohmori Akira (1993), ‘Software quality deployment approach: framework design, methodology
and example’, Software Quality Journal. No. 3, pp. 209-240.
13. Pai, W.C.(2002). Quality-enhancing software function deployment model. Information Systems
Management, pp.20-4.
14. Pedro, A., R.S.B.Macros, A.P.Jose, C.Luis. (2005). Analyzing Groupware Design by means of
usability results. 9th
International Conference on Computer Supported Cooperative Work in
Design (CSCWD 2005). Coventry, England, IEEE, Computer Society Press, May 2005.

International Journal of Industrial Engineering Research and Development (IJIERD), ISSN 0976 –
6979(Print), ISSN 0976 – 6987(Online) Volume 2, Issue 1, May - October (2011), © IAEME
26
15. Ronald G. Day (1996), ‘Quality Function Deployment: Linking a company with its customers’,
Tata Mcgraw Hill.
16. Tan K.C., Xie M. and Chia E. (1998), ‘Quality function deployment and its use in designing
information technology systems’, International Journal of Quality and Reliability Management,
Vol. 15 No. 6, pp. 634-645.
17. Taeho Park and Kwang-Jac Kim (1998), ‘Determination of an optimal set of design requirements
using house of quality’, Journal of Operations Management, Vol.16, pp. 569-581.
18. William D. Barnett and Raja M.K. (1995), ‘Application of QFD to the software development
process’, International Journal of Quality and Reliability Management, Vol. 12, No. 6, pp. 24-42.
19. Yoji Akao (1997), ‘Quality function deployment: Integrating customer requirement into product
design’, Productivity Press, pp. 329-339.
20. Yoji Akao and Glenn H. Mazur (2003), ‘The leading edge in QFD: Past, Present and Future’,
International Journal of Quality and Reliability Management, Vol. 20 No.
FIG 1: SQFD AND GQM (Pai 2002)
S.No SQFD PROCESS SQFD WITH GQM
1. Customer requirements are solicited and
recorded
Record customer
requirements in report form.
2. Requirements are converted to a measurable
technical specification
Identify goals of the project
for user, developer and
manager perspective
3. Requirements are mapped to product
specifications (with customer feedbacks) to
create a correlation matrix
Ask questions derived from
goals and measure against
requirements reports
4 Requirements are prioritized by customer Modify and reconfirm the
improper requirements, then
complete matrix.
5. Priorities are determined by multiplying
customer priorities with matrix
Priorities are determined by
multiplying customer
priorities with matrix.

International Journal of Industrial Engineering Research and Development (IJIERD), ISSN 0976 –
6979(Print), ISSN 0976 – 6987(Online) Volume 2, Issue 1, May - October (2011), © IAEME
27
FIG 2: Drawbacks about the existing SQFD Models
S.No The Model Drawbacks
1 The Erikkson and McFadden’s
SQFD Model (William and
Raja 1995)
• Does not employ the House of Quality
(HOQ)
• Developers are not able to explicitly examine
the relationships between implementation
deployments or the hows listed along the x-
axis of the matrix
• There is no statement of how the customer
needs will be met
2. Zultner’s SQFD Model
(William and Raja 1995)
• Does not use the conventional HOQ for its
QFD matrices
• Does not draw the connection between
customer segments and the organizational
processes
3. Shindo’s SQFD Model (Georg
and Schokert 2003)
• Decomposes the customer requirements
directly into functions and data and then into
modules. Does not have any formal
mechanism for determining the importance
of the function.
4. Ohmori’s matrix-of-matrices
SQFD Model (Georg and
Schockert 2003)
• A total of 14 matrices are to be implemented
which is very tedious and complex
5. The Herzwurm & Schockert’s
PriFo SQFD Model (Georg
and Schockert 2003)
• Covers only the first phase i.e product
planning in the classic QFD and designing
part is not dealt with.

International Journal of Industrial Engineering Research and Development (IJIERD), ISSN 0976 –
6979(Print), ISSN 0976 – 6987(Online) Volume 2, Issue 1, May - October (2011), © IAEME
28
Fig 3: Impact of Implementation of SQFD
S.
no
Success Factors, Design Goals or Results
Achieved
Before
Implementation
After
Implementation
1. The technical specification appropriate
products
3.85 3.9
2. Development several product
components in parallel
3.625 3.5
3. Reusability to other similar projects 3.825 4.15
4. Systematic structured proceeding 3.5 4.25
5. Constantness up to the delivery into
production
3.6 3.575
6. Objective product decisions 3.475 3.5
7. Comprehensibleness 3.825 4.3
8. Authentication for product decisions 3.3 3.475
9. Adaptability at customer expectation
changes
3.525 3.725
10. Collection of the real customer
requirements
3.8 4.275
11. Prioritization of the customer
requirements
3.3 4.125
12. Adherence to planned development times 3.8 4.3
13. Foresighted acting 3.5 3.625
14. Function to co-operation 3.225 4.125
15. Tuning of the department goals and
decisions
3.55 3.6
16. Communication satisfactory with technical
personnel
3.925 4.125
17. Communication satisfactory with users
3.725 4.325
18. User requirements met 3.675 3.7
19. Communication satisfactory with
management
3.95 3.65
20. Documentation consistent and complete 3.85 3.525

International Journal of Industrial Engineering Research and Development (IJIERD), ISSN 0976 –
6979(Print), ISSN 0976 – 6987(Online) Volume 2, Issue 1, May - October (2011), © IAEME
29
Fig 4: Structure of House of Quality
Fig 5: Proposed Software House of Quality (S-HOQ) Matrix
Correlation Matrix
Cu
sto
me
r
Imp
ort
an
ce
Relationships between
Customer Needs and Design
Attributes
Importance Weighting
Target Values (How Much)
Technical Evaluation
Importance
Customer Needs
(What)
Design or Technical
Attributes (Hows)
Customer
Perceptions
Competitive
Assessment
Correlation Matrix
Cu
sto
me
r
Imp
ort
an
ce
Relationship Matrix
Target Value
Organizational Difficulty
Absolute Importance
Customer
Requirements
(Whats)
Relative Importance
Technical Requirements
(Hows)

International Journal of Industrial Engineering Research and Development (IJIERD), ISSN 0976 –
6979(Print), ISSN 0976 – 6987(Online) Volume 2, Issue 1, May - October (2011), © IAEME
30
FIG 6: Proposed Subsystem or Module Deployment Matrix
FIG 7: Proposed Technology Deployment Matrix
Relationship Matrix
Importance Rating
Technical
Requirements
(Whats)
Subsystems or Modules
Pri
ori
ty R
ati
ng
Ta
rge
t V
alu
es
Relationship Matrix
Importance Rating
Technical
Requirements
(Whats)
Technologies
Pri
ori
ty R
ati
ng
Ta
rge
t V
alu
es

International Journal of Industrial Engineering Research and Development (IJIERD), ISSN 0976 –
6979(Print), ISSN 0976 – 6987(Online) Volume 2, Issue 1, May - October (2011), © IAEME
31
FIG 8: Proposed SQFD Model
Validate
Validate , Weightage
Brainstorming-3
Correlation matrix
Brainstorming -6 Brainstorming -5
Brainstorming -2
Affinity
Diagramming
Brainstorming-1
Voice of Customer
Customer
Requirements
Customer importance
Voice of Engineer
table
Technical
Requirements with
target value and
organizational
difficulty
Relationship matrix
Absolute and
relative importance
calculation
Correlation matrix
Cu
sto
me
r
Imp
ort
an
ce
Relationship Matrix
Target Value
Organizational Difficulty
Absolute Importance
Customer
Requirements
(Whats)
Relative Importance
Technical Requirements
HOUSE OF
QUALITY
MATRIX
Brainstorming-10 Brainstorming-8
Normalization rating
Brainstorming-11 Brainstorming -9
Subsystem or
module table
Relationship matrix
Technical
requirement table
after deleting least
important ones
Technology table
Relationship matrix
TECHNOLOGY DEPLOYMENT
MATRIX
Pri
ori
ty R
ati
ng
Relationship Matrix
Importance Rating
Technical
Requirements
Technologies
Ta
rge
t V
alu
es
SUBSYSTEM OR MODULE
DEPLOYMENT MATRIX
Pri
ori
ty R
ati
ng
Relationship Matrix
Importance Rating
Technical
Requirements
Subsystem or Module
Ta
rge
t V
alu
es
Brainstorming-4
Validate

International Journal of Industrial Engineering Research and Development (IJIERD), ISSN 0976 –
6979(Print), ISSN 0976 – 6987(Online) Volume 2, Issue 1, May - October (2011), © IAEME
32
FIG 9: HOQ for embedded Software

International Journal of Industrial Engineering Research and Development (IJIERD), ISSN 0976 –
6979(Print), ISSN 0976 – 6987(Online) Volume 2, Issue 1, May - October (2011), © IAEME
33
FIG 10: Subsystem or Module Deployment Matrix

International Journal of Industrial Engineering Research and Development (IJIERD), ISSN 0976 –
6979(Print), ISSN 0976 – 6987(Online) Volume 2, Issue 1, May - October (2011), © IAEME
34
FIG 11: Technology Deployment Matrix

International Journal of Industrial Engineering Research and Development (IJIERD), ISSN 0976 –
6979(Print), ISSN 0976 – 6987(Online) Volume 2, Issue 1, May - October (2011), © IAEME
35
A B C D E F G
1
2 General Details
3 Name
4 Designation
5 Years of Experience
6 E-Mail
7
8 Instructions
9
10
11
12
13
14
15
16
17
18
19
20
21
22
23
24
25
26
27
28
29
30
31
32
33
34
35
36
37
38
39
1. The actual outcome of the brainstorming is given in the work sheet "actual relation".
2. Give your response in the worksheet "agreement", whether you are agreeing with the
actual relations
3. Also give your choice of the realtions in the third worksheet "choice"
FIG 12: S-HOQ Questionnaire - General

International Journal of Industrial Engineering Research and Development (IJIERD), ISSN 0976 –
6979(Print), ISSN 0976 – 6987(Online) Volume 2, Issue 1, May - October (2011), © IAEME
36

International Journal of Industrial Engineering Research and Development (IJIERD), ISSN 0976 –
6979(Print), ISSN 0976 – 6987(Online) Volume 2, Issue 1, May - October (2011), © IAEME
37
Figure 13: S-HOQ Questionnaire – Actual Relations
Figure 14: S-HOQ Questionnaire- Agreement

International Journal of Industrial Engineering Research and Development (IJIERD), ISSN 0976 –
6979(Print), ISSN 0976 – 6987(Online) Volume 2, Issue 1, May - October (2011), © IAEME
38
Figure 15 : S-HOQ Questionnaire- Choice

International Journal of Industrial Engineering Research and Development (IJIERD), ISSN 0976 –
6979(Print), ISSN 0976 – 6987(Online) Volume 2, Issue 1, May - October (2011), © IAEME
39
Figure 16 Subsystem or Module Deployment Questionnaire- Actual Relations

International Journal of Industrial Engineering Research and Development (IJIERD), ISSN 0976 –
6979(Print), ISSN 0976 – 6987(Online) Volume 2, Issue 1, May - October (2011), © IAEME
40
Figure 17: Subsystem or Module Deployment Questionnaire- Agreement

International Journal of Industrial Engineering Research and Development (IJIERD), ISSN 0976 –
6979(Print), ISSN 0976 – 6987(Online) Volume 2, Issue 1, May - October (2011), © IAEME
41
Figure 20: Subsystem or Module Deployment Questionnaire - Choice

International Journal of Industrial Engineering Research and Development (IJIERD), ISSN 0976 –
6979(Print), ISSN 0976 – 6987(Online) Volume 2, Issue 1, May - October (2011), © IAEME
42
Figure 19: Technology Deployment Questionnaire- Actual Relations

International Journal of Industrial Engineering Research and Development (IJIERD), ISSN 0976 –
6979(Print), ISSN 0976 – 6987(Online) Volume 2, Issue 1, May - October (2011), © IAEME
43
Figure 20: Technology Deployment Questionnaire- Agreement
International Journal of Industrial Engineering Research and Development (IJIERD), ISSN 0976 –
6979(Print), ISSN 0976 – 6987(Online) Volume 2, Issue 1, May - October (2011), © IAEME
44
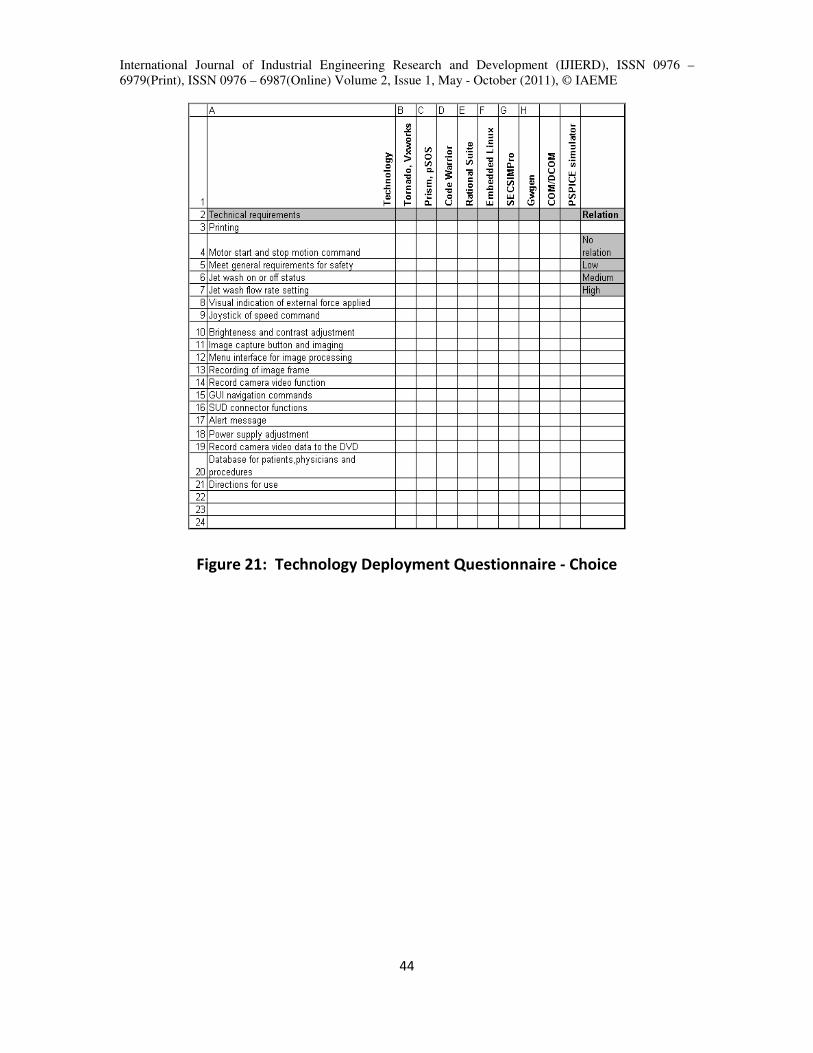
Figure 21: Technology Deployment Questionnaire - Choice

International Journal of Industrial Engineering Research and Development (IJIERD), ISSN 0976 –
6979(Print), ISSN 0976 – 6987(Online) Volume 2, Issue 1, May - October (2011), © IAEME
45
Figure 22 : Success Factors Questionnaire