development and application of social indicators to ... · poverty index community percent of...
TRANSCRIPT

November 1, 2011
Development and Application of Social Indicators to Coastal
Communities of the Northeastern and Southeastern US
Michael Jepson & Lisa Colburn NOAA Fisheries

2
Early efforts at measuring vulnerability
• 1996 Magnuson-Stevens added National Standard 8 – Fishing Communities
• Gulf of Mexico Fishery Management Council Habitat Amendment (2004)
• Profiled Fishing Communities
• Included Vulnerability Scale (Cutter, 2000)

3
Fishing Community Vulnerability Index
Scale Component Scale Score Criteria
Shift share component
National growth component 1 National growth component is increasing like
county
0 National growth component are the same like
county
−1 National growth component is decreasing like
county
Industrial mix 1 Industrial mix contributes positive
employment growth
−1 Industrial mix contributes negative
employment growth
Competitive share 1 Competitive share indicates positive
employment growth
−1 Competitive share indicates negative
employment growth
Poverty component 1 Poverty below county level
0 Poverty same as county level
−1 Poverty above county level
Average wage/salary
component
1 Average wage/salary above county level
0 Average wage/salary same as county level
−1 Average wage/salary below county level

4
Mapping Vulnerability

5
Cutter’s Social Vulnerability Scale
Scale consists of 42 different variables: poverty, income, minorities, household structure, etc.
Used principal component analysis with eleven different
factors Explained about 76% of the variance Has been revised and tested with respect to scalability
and robustness.

6
Cutter’s Social Vulnerability Scale

7
• Grant awarded to the Gulf and South Atlantic Fisheries Foundation, Tampa Florida
• NOAA S-K Grant # NA08NMF4270412 - Development of Social Indicators for Fishing Communities of the Southeast: Measures of Dependence, Vulnerability, Resilience, and Gentrification
• Principal Investigators - Steve Jacob (York College), Ben Blount (SocioEcological Informatics) and Priscilla Weeks (HARC)
Saltonstall-Kennedy Proposal

8
Comparative Research
• To develop a set of quantitative indices that would assist in the measurement of social impacts at the community level for fishing communities of the Gulf and South Atlantic. • Uses a single factor analysis
• Conduct an in-depth study of dependence, resilience, vulnerability, and sustainability within selected communities.
• Using both quantitative and qualitative measures this research found agreement between the two.

9
Poverty Index
Community
Percentage population in poverty
2007
Percentage population
50% under line
2007
Percentage over 65 in poverty
2000
Percentage under 18 in
poverty 2000
Cost of living
index 2008 USA
Avg = 100
Poverty Index Score Ranking
Port Lavaca 20.1 8.6 14.7 25 75.6 0.903 3
Sea Drift 25.1 13.5 11.7 33.1 73.8 0.993 2
Port O'Connor 6.8 4.6 11.1 19.7 82.1 -0.331 7
Palacios 24.2 9.9 14.3 28.9 75.4 1.309 1
Seabrook 5.5 3 5.1 6.1 88.8 -1.048 8
San Leon 19.7 11.9 2.3 33.5 86.8 -0.133 6
Galveston 22.3 10.5 14.2 32.1 89.4 0.325 5
Bacliff 21.7 8.9 16.3 30.6 84.8 0.681 4
Little River 7.5 3.7 1.7 15.3 91.2 -1.502 10
Mount Pleasant 5 2.7 6.6 5.3 95.6 -1.197 9
PC components
Factor Loading 0.908 0.808 0.704 0.809 -0.839
Theta Reliability
0.874
Eigan Value
3.332
Percentage Explained Variation Single Factor Solution High Ranking = More Vulnerable
66.662 Low Ranking = More Resilient

10
Adaptation of Previous Research
• Collaboration between regions with NS8 funds Northeast and Southeast Regions of NOAA
Fisheries • Utilizes Estimated 2010 Census Data 2005-2009 ACS Estimates • Create several independent indices, some of
which include fisheries and other external data
• Create indices at the Place level

11

12
Data Mining
Began assembling a variable list using Cutter 2007, Jacob et al. 2010, and recommendations from initial workshop.
Utilized existing NE database for additional variables Created master list of variables and sources for data

13
Series of Indicators
Began with original set of 13 indices developed by Jacob et al. 2010 Includes Commercial and Recreational Reliance Substituted variables when single factor did not occur Final 10 Indices with noteworthy results in both regions.

14
Labor Force Structure Index
Community
Percent of Class of
Worker Self Employed
Percent Labor force
Percent females
employed
Percent people
receiving Social
Security
Labor Force Structure
Index Ranking Stockton, MD 0 100 100 0 3.494 1 Tavistock, NJ 9.1 100 100 18.2 2.848 2 Fairmount, MD 5.1 89.2 83.4 11 2.303 3 Northampton, NY 0 78.3 86.7 7.3 2.257 4 Jamestown, SC 0 83.3 85.7 19 2.090 5 Allenwood, NJ 14.4 84.9 81 5.5 2.047 6 Pantego, NC 0.9 86.6 85.3 23.8 2.041 7 Juno Ridge, FL 8.1 88.2 74.2 8.4 2.012 8 Plainsboro Center, NJ 2.7 83.8 71.9 6.2 1.977 9 Occoquan, VA 4.8 83.3 77.7 10.5 1.976 10 Lazy Lake, FL 0 84.2 100 41.7 1.955 11 Largo, MD 2.2 80.9 77.4 12.4 1.899 12 Harrisville, RI 5 83.3 87.8 26.6 1.855 13 Hoboken, NJ 3 81 73.1 10.9 1.800 14 Gilgo-Oak Beach-Captree, NY 3.3 83.3 74.1 14.9 1.793 15
Factor Loading -0.358 0.95 0.906 -0.873
Theta Reliability 0.821
Single Factor Solution
Eigan Value 2.613
High Ranking = More Resilient
Low Ranking = More Vulnerable
Percentage Explained Variation 65.332


16

17

18
Housing Characteristics Index
Community
Median gross rent
Median mortgage, monthly payment
Median number of
rooms
Percent Mobile Homes
Housing Sturcture Index Ranking
Ocean Breeze Park, FL 560 723 3 90.7 -3.6473 1
Suncoast Estates, FL 761 752 4 91 -3.1060 2
Zephyrhills South, FL 603 768 4 77.9 -3.0530 3
Indian Lake, TX 610 748 5 81.4 -2.8869 4
Brookridge, FL 664 760 5 88.4 -2.8606 5
Zephyrhills West, FL 698 715 4 78.8 -2.8529 6
Zephyrhills North, FL 633 950 4 72.6 -2.7554 7
Briny Breezes, FL 808 1453 3 79.4 -2.7059 8
High Point, FL 781 751 5 78.3 -2.5896 9
Peletier, NC 655 830 5 66.3 -2.5300 10
Wabasso, FL 534 1591 4 63.6 -2.5219 11
Fanning Springs, FL 471 770 4 54.8 -2.5132 12
Williston Highlands, FL 570 830 5 73.3 -2.4897 13
Buras-Triumph, LA 656 580 5 61 -2.4725 14
Amelia, LA 545 661 5 58.9 -2.4627 15
Factor Loading 0.818 0.882 0.734 -0.651
Theta Reliability 0.785
Single Factor Solution
Eigan Value 2.410 High Ranking = More Vulnerable
Percentage Explained Variation 60.262 Low Ranking = More Resilient

19

20

21

22
Personal Disruption Index
Community Percentage of
Males Separated
Percentage of Females
Separated Percent Unemployed Percent in Poverty Personal
Disruptions Index Ranking
Charleston Park, FL 0.00 37.7 33.3 94.30 11.280 1
Homestead Base, FL 41.90 5.3 17.5 79.10 10.304 2
Lozano, TX 42.10 0 0 100.00 8.433 3
Powellsville, NC 14.50 21.7 6.6 36.30 5.650 4
Ocracoke, NC 10.10 29 0.4 35.40 5.245 5
Roper, NC 17.40 7.8 10.4 40.20 4.811 6
Stockton, MD 0.00 26.5 23.4 0.00 4.758 7
D'Iberville, MS 12.90 17.4 13.1 15.30 4.757 8
Oak Grove, AL 9.70 26.2 4.4 21.30 4.708 9
Boulevard Gardens, FL 0.00 28.9 7 34.90 4.587 10
Elberta, AL 17.90 15.8 6.9 16.80 4.571 11
Chickasaw, AL 13.40 20 3.8 26.10 4.524 12
Latimer, MS 16.30 15.4 4.1 24.20 4.272 13
Prichard, AL 9.70 14.7 7.9 35.40 4.171 14
Franklin Park, FL 0.00 13.4 14.3 51.30 4.058 15
Factor Loading 0.645 0.729 0.598 0.743
Theta Reliability 0.613 Single Factor Solution
Eigan Value 1.857 High Ranking = More Vulnerable
Low Ranking = Less Vulnerable
Percentage Explained Variation 46.422

23

24

25

26
Poverty Index
Community
Percent of families below
poverty level
Percentage population in poverty
Percent people under 18 in
poverty
Percentage 65 and over in poverty
Poverty Index Ranking Del Mar Heights, TX 100 100 100 100 9.703 1 Charleston Park, FL 83.3 94.3 96.2 100 8.892 2 Yznaga, TX 100 100 100 . 7.522 3 North San Pedro, TX 65.5 62.7 86.1 51.9 5.947 4 Lozano, TX 100 100 . . 5.938 5 Santa Rosa, TX 56.8 67.5 76 55.8 5.717 6 Santa Maria, TX 54.7 61.9 70.7 59.7 5.463 7 Homestead Base, FL 67.1 79.1 73.3 . 5.260 8 Cameron Park, TX 55 56.4 63.5 62.6 5.234 9 Franklin Park, FL 47.8 51.3 90.8 57.1 5.202 10 Olmito, TX 51.2 62.1 83.2 42.2 5.164 11 El Camino Angosto, TX 45.1 70.8 71.9 44.2 5.078 12 Fremd Village-Padgett Island, FL 48.9 53.3 51 55.2 4.523 13 Dade North, FL 49 52.5 67.3 40.9 4.459 14 Rancho Banquete, TX 50.9 70.3 74.2 . 4.454 15
Factor Loading 0.948 0.97 0.89 0.693
Theta Reliability 0.903
Single Factor Solution
Eigan Value 3.113
High Ranking = More Vulnerable
Low Ranking = More Resilient
Percentage Explained Variation 77.832

27

28

29

30
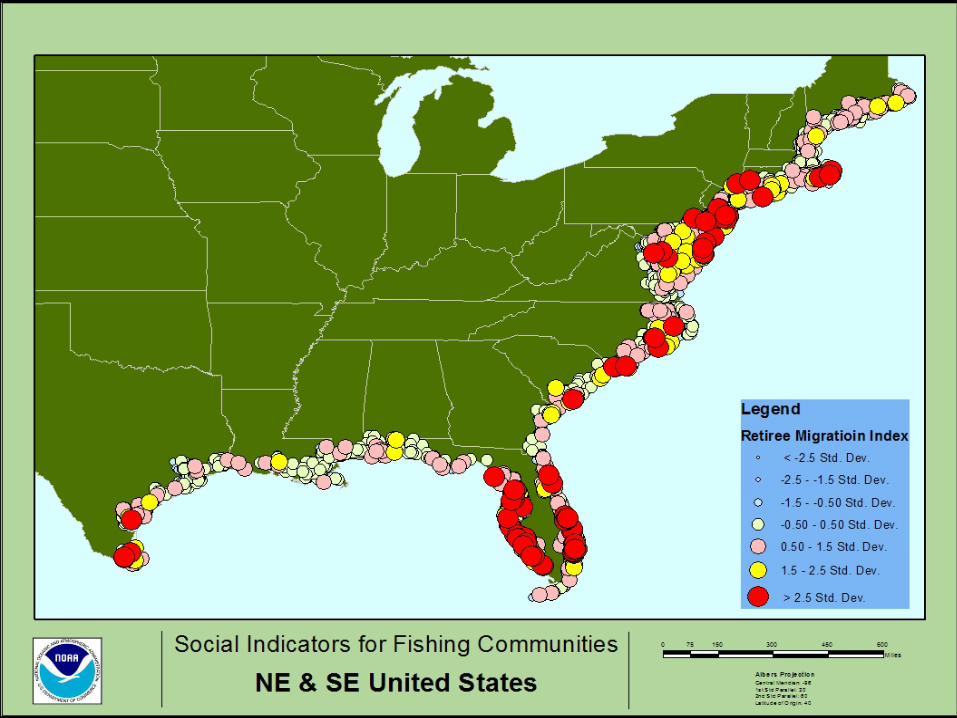
Retiree Migration Index
Community
Percent of Households
with persons 65 and over
Percent people
receiving Social
Security
Percent people
receiving Retirement
Income
Percent in Labor Force
Retiree Migration
Index Ranking Timber Pines, FL 92.50 92.9 66.1 5.2 5.35774 1 Port Tobacco Village, MD 66.70 66.7 100.0 0 5.14364 2 Plantation Island, FL 100.00 100 38.3 0 5.10763 3 Punta Rassa, FL 96.50 93.4 44.5 6.6 4.87808 4 Pine Valley, NJ 100.00 100 25.0 0 4.76787 5 Holiday City South, NJ 87.00 89.9 60.5 18.1 4.71394 6 Holiday Heights, NJ 89.50 89.7 55.9 15.8 4.70450 7 Concordia, NJ 91.70 92.3 51.6 19.2 4.62556 8 Eagle Harbor, MD 77.80 77.8 77.8 20 4.61944 9 Crestwood Village, NJ 88.30 89.2 52.9 15.7 4.59069 10 West Hampton Dunes, NY 80.80 80.8 57.7 6.8 4.55523 11 Leisure Village East, NJ 85.60 86.4 56.8 17 4.53258 12 Cedar Glen Lakes, NJ 84.10 84.1 56.7 13.2 4.53177 13 Pine Ridge At Crestwood, NJ 87.00 88.6 49.4 15.9 4.45244 14 Leisure Knoll, NJ 81.60 89.1 58.2 21.2 4.43755 15
Factor Loading 0.948 0.952 0.764 -0.866
Theta Reliability 0.906
Single Factor Solution
Eigan Value 3.137
High Ranking = More Vulnerable
Low Ranking = More Resilient
Percentage Explained Variation 78.429
31

32

33

34
Urban Sprawl Index
Community Population
Density Cost of Living
Nearest City w Population
50,000 Median
Home Value
Urban Sprawl Index Ranking
Mamaroneck, NY 141502 160 3 597000 6.961 1 Irvington, NJ 171684.7 118 2.6 238400 6.750 2 Manhattan, NY 71005.5 181 0 800400 5.026 3 Brooklyn, NY 35841.4 165 0 547200 2.967 4 Sheepshead Bay, NY 35841.4 165 0 547200 2.967 5 Chappaqua, NY 21490.3 159 9.9 951100 2.891 6 Bronxville, NY 6779.8 168 1.8 1000001 2.663 7 Plandome Heights, NY 5639.2 170 2.6 1000001 2.650 8 Munsey Park, NY 5058.8 169 1.7 1000001 2.625 9 Great Neck Estates, NY 3682.7 172 3.8 1000001 2.593 10 Guttenberg, NJ 53548.8 126 2.2 352400 2.591 11 Kensington, NY 4586.8 169 3.2 1000001 2.581 12 Russell Gardens, NY 6421.8 163 3.1 1000001 2.551 13 New York, NY 27433.8 162 0 501000 2.503 14 Manhasset, NY 7116.6 162 1.7 946700 2.492 15
Factor Loading 0.432 0.895 -0.676 0.768
Theta Reliability 0.676
Single Factor Solution
Eigan Value 2.034
High Ranking = More Vulnerable
Low Ranking = More Resilient
Percentage Explained Variation 50.846

35

36

37

38
Natural Resource Migration
Community
Percent of Rentals Vacant
Percent of All Housing
Vacant
Number of Boatramps
per 1,000 pop
Percent of Watercoverage
Natural Resource Migration
Index Ranking Pawleys Island, SC 86.0 91.7 50.0 50.0 13.0613 1 Captiva, FL 100.0 92.5 21.6 21.6 10.1095 2 West Hampton Dunes, NY 77.8 93.9 16.9 16.9 6.7368 3 Barnegat Light, NJ 61.2 79.1 18.8 18.8 6.1448 4 Topsail Beach, NC 79.2 84.6 12.8 12.8 5.8600 5 Edisto Beach, SC 91.0 80.1 7.2 7.2 5.4043 6 Everglades, FL 56.8 65.4 13.5 13.5 5.2652 7 Horseshoe Beach, FL 50.0 85.7 13.5 13.5 5.2176 8 Ocean Isle Beach, NC 86.8 83.6 7.0 7.0 5.1172 9 Cedar Key, FL 36.7 53.7 13.6 13.6 5.0584 10 Grand Isle, LA 24.5 72 16.3 16.3 4.8614 11 Dauphin Island, AL 61.8 66.9 0.0 0.0 4.8410 12 Holden Beach, NC 91.1 80.5 4.4 4.4 4.7486 13 Crescent Beach, FL 73.9 69.7 8.8 8.8 4.6867 14 Hoopers Island, MD 100 71.3 3.4 3.4 4.6473 15
Factor Loading 0.782 0.831 0.61 0.447
Theta Reliability 0.620
Single Factor Solution
Eigan Value 1.874
High Ranking = More Vulnerable
Low Ranking = Less Vulnerable
Percentage Explained Variation 46.848

39

40

41

42
Coastal Hazards Index
Community Huuricane risk
Average Tornado Risk
Average Wind Risk
Average Disaster Risk
Index Ranking Town 'n' Country, FL 490.00 609 0 6.900 1
Feather Sound, FL 492.00 600 0 3.534 2
Bolivia, NC 44.00 929 131 3.497 3
South Highpoint, FL 489.00 547 1 3.301 4
Safety Harbor, FL 491.00 543 1 3.239 5
Pinellas Park, FL 491.00 533 1 3.226 6
St. Petersburg, FL 489.00 532 0 3.176 7
Citrus Park, FL 491.00 512 0 3.173 8
Gulfport, FL 486.00 514 1 3.086 9
Egypt Lake-Leto, FL 489.00 502 0 3.076 10
South Pasadena, FL 485.00 496 1 3.034 11
Westchase, FL 465.00 506 0 2.992 12
Tierra Verde, FL 501.00 477 0 2.989 13
Kenneth, FL 489.00 482 1 2.950 14
Clearwater, FL 491.00 481 1 2.937 15
Factor Loading 0.879 0.781 -0.622
Theta Reliability 0.578 Single Factor Solution
Eigan Value 1.770 High Ranking = More Vulnerable
Low Ranking = More Resilient
Percentage Explained Variation 58.999

43

44

45

46
Social Fishing Reliance Index
Community
Dealers per 1,000
population Percent
Watercoverage
Number of Boatramps per 1,000
Populaiton
Social Fishing Index Ranking
Pawleys Island, SC 0.00 50.0 50.00 14.762 1 St. Marks, FL 19.23 0.4 24.00 11.864 2 Cedar Key, FL 23.39 13.6 13.60 11.621 3 Everglades, FL 17.94 13.5 13.50 9.125 4 Grand Isle, LA 13.37 16.3 16.30 8.653 5 Captiva, FL 0.00 21.6 21.60 8.368 6 Chokoloskee, FL 11.83 17.80 8.148 7 Cameron, LA 24.53 9.3 4.30 7.972 8 Horseshoe Beach, FL 13.51 13.5 13.50 7.448 9 Barnegat Light, NJ 8.55 18.8 18.80 7.386 10 Yorktown, VA 0.00 1.7 26.50 7.236 11 Ocracoke, NC 5.85 0.1 17.50 6.274 12 Wachapreague, VA 8.89 0.0 13.30 5.915 13 Bayport, FL 0.00 10.8 20.80 5.893 14 McClellanville, SC 19.61 5.0 0.00 5.240 15
Factor Loading 0.769 0.435 0.77
Theta Reliability 0.408
Single Factor Solution
Eigan Value 1.373
High Ranking = More Reliant
Low Ranking = Less Relient
Percentage Explained Variation 45.770

47

48

49

50
Population Composition Vulnerability Index
Community
Percent White non-
Hispanic population
2+ persons HH, other family HH,
female HHldr, no husband
Population age 0-5
Percent Speak English less than very
well (Lang other than English)
Population Composition Vulnerability
Index Ranking North San Pedro, TX 6.5 56 21.5 52.9 6.054 1 Del Mar Heights, TX 0 0 26.7 100 5.926 2 Homestead Base, FL 5.5 67.1 20 21.4 5.262 3 Charleston Park, FL 61.9 100 22 0 5.214 4 Yznaga, TX 0 0 23.3 79.9 4.889 5 Green Valley Farms, TX 0 13.4 24.1 59.2 4.780 6 Villa Pancho, TX 0 0 22.4 77.5 4.722 7 Stacey Street, FL 19.1 14 25.4 59.5 4.642 8 Olmito, TX 8.2 46.3 14.7 42 4.608 9 La Paloma, TX 0 17.1 20.3 58.2 4.566 10 Pine Manor, FL 25.1 28.6 19 51.5 4.318 11 Reid Hope King, TX 0 8 21.6 52.4 4.077 12 El Camino Angosto, TX 0 0 24 55.3 4.052 13 Cameron Park, TX 0.2 14.9 17.1 51.9 3.953 14 Laguna Heights, TX 7.5 29.7 12.4 47.6 3.904 15
Factor Loading -0.896 0.715 0.666 0.738
Theta Reliability 0.754
Single Factor Solution Eigan Value 2.302
High Ranking = More Vulnerable
Percentage Explained Variation 57.557
Low Ranking = Less Vulnerable

51

52

53

54
Southeast Commercial Fishing Engagement Index
CommunityValue of Landings
Number of Commercial
Permits
Number of Vessels
Designated Commercial by
Homeport
Number of Vessels
Designated Commercial
by Owner Address
Commercial Engagement
Index RankingKey West, FL 16,185,756 179 211 152 12.08906 1New Orleans, LA 2,256,977 286 241 53 10.82325 2Panama City, FL 8,489,736 244 108 108 9.39623 3Miami, FL 5,453,954 134 170 104 8.47674 4Brownsville, FL 30,667,377 104 113 95 8.42731 5Port Isabel, TX 18,661,027 87 83 111 7.10784 6Bayou La Batre, AL 32,373,854 138 80 35 6.86396 7Marathon, FL 9,758,531 81 102 82 5.97201 8Palacios, TX 31,646,020 60 54 59 5.63842 9Port Arthur, TX 39,742,480 38 41 52 5.41339 10Biloxi, MS 16,970,532 99 84 35 5.18418 11Houston, TX 516,364 129 97 48 5.09818 12Fort Pierce, FL 2,943,779 68 85 66 4.50116 13Jupiter, FL 141,636 71 90 66 4.44800 14Tarpon Springs, FL 3,531,520 103 54 54 4.18959 15
Factor Loading 0.669 0.937 0.937 0.951
Theta Reliability 0.904 Single Factor Solution
Eigan Value 3.106 High Ranking = More EngagedLow Ranking = Less Engaged
Percentage Explained Variation 77.657

55

56
Southeast Commercial Fishing Reliance Index
Community Pounds of Landings
Pounds of Landings per1,000 persons Value of Landings
Value of Landings Per1,000
population Commercial
Reliance Index Ranking Empire, LA 332695639 607108.83 29089591 53083.20 27.466 1 Cameron, LA 167109618 241139.42 8375930 12086.48 9.988 2 Abbeville, LA 252683394 21316.30 33725785 2845.10 8.959 3 Moss Point, MS 189142093 13202.71 18568552 1296.14 5.956 4 Grand Isle, LA 10840293 16107.42 17207738 25568.70 5.628 5 Boothville-Venice, LA 3099720 3974.00 17928137 22984.79 4.930 6 Bayou La Batre, AL 16137402 5706.29 32373854 11447.61 4.696 7 Palacios, TX 13446896 2660.64 31646020 6261.58 3.749 8 Port Arthur, TX 14848297 266.88 39742480 714.33 3.571 9 Dulac, LA 9584634 8269.74 13907784 11999.81 3.163 10 Wanchese, NC 15730345 10376.22 15283736 10081.62 3.157 11 Brownsville, TX 12916830 75.72 30667377 179.78 2.701 12 Port Isabel, TX 7491295 1424.20 18661027 3547.72 2.125 13 Chokoloskee, FL ** ** ** ** 2.014 14 McClellanville, SC 1449078 4735.55 3238310 10582.71 1.839 15
Factor Loading 0.884 0.882 0.683 0.884
Theta Reliability 0.856
Single Factor Solution High Ranking = More Reliance Eigan Value 2.809 Low Ranking = Less Reliance **Confidential Percentage Explained Variation 70.232

57

58
Southeast Recreational Fishing Engagement Index
Community
Recreational Fishing
Infrastructure
Number of Vessels
Designated Recreational
by Owner Address
Number of Vessels
Designated Recreatoinal by
Homeport
Number of Charter
Permits by Homeport
Recreational Reliance
Index RankingKey West, FL 17 93 116 368 15.34569 1Destin, FL 13 120 120 234 14.28614 2Orange Beach, AL 12 51 110 223 10.52191 3Panama City, FL 10 63 63 159 8.18516 4Marathon, FL 21 39 40 112 6.35675 5Islamorada, FL 9 34 63 132 6.35616 6Port Aransas, TX 8 29 51 96 5.04167 7Pensacola, FL 20 32 32 63 4.89044 8Panama City Beach, FL 16 31 31 77 4.72116 9Miami, FL 11 16 35 107 4.27216 10Naples, FL 13 37 37 13 3.96532 11St. Petersburg, FL 17 25 25 54 3.94093 12Freeport, TX 5 16 45 78 3.71201 13Jacksonville, FL 34 13 8 22 3.58105 14Biloxi, MS 5 20 40 62 3.45818 15
Factor Loading 0.513 0.913 0.928 0.903
Theta Reliability 0.921 Single Factor Solution
Eigan Value 3.256 High Ranking = More ReliantLow Ranking = Less Reliant
Percentage Explained Variation 81.409

59

60
Northeast Commercial Fishing Reliance Index
Community
% Agriculture, fishing, &
hunting
Dealers with Landings per 1,000
Commercial Fishing
Permits per 1,000
Value of Landings per
1,000
Pounds of Landings per
1,000
Commercial Fishing
Reliance Index Ranking
BARNEGAT LIGHT/LONG BEACH, OCEAN, NJ* 14.3 8.547 1273.5 44,073,371 11,875,027 13.142 1
CAPE MAY, CAPE MAY, NJ* 1.1 1.072 514.3 20,541,814 18,720,498 11.689 2
VINALHAVEN, KNOX, ME* 26.9 1.127 93.6 22,203,113 9,637,880 8.152 3
MONTAUK, SUFFOLK, NY* 3.3 2.144 419.6 5,770,736 3,843,002 4.843 4
HARPSWELL, CUMBERLAND, ME* 4.2 1.715 77.8 3,387,072 1,405,917 1.873 5
GLOUCESTER, ESSEX, MA* 1.4 .826 94.9 1,859,918 2,750,555 1.754 6
NARRAGANSETT, WASHINGTON, RI* 1.4 .543 93.9 1,921,666 2,012,524 1.426 7
NEW BEDFORD, BRISTOL, MA* .9 .339 41.4 3,327,873 1,369,074 1.046 8
POINT PLEASANT, OCEAN, NJ* .0 .000 31.0 1,164,097 1,328,703 0.528 9
FAIRHAVEN, BRISTOL, MA* 1.7 .248 14.1 966,510 245,033 0.232 10
PORTLAND, CUMBERLAND, ME* .4 .317 10.9 298,577 595,125 0.194 11
ATLANTIC CITY, ATLANTIC, NJ* .9 .000 6.5 441,286 628,493 0.123 12
STONINGTON, NEW LONDON, CT* .4 .054 8.5 931,197 314,833 0.091 13
SEAFORD, YORK, VA* .0 .069 7.0 1,094,040 138,306 0.032 14
NEWPORT NEWS, NEWPORT NEWS CITY, VA* .4 .026 1.5 234,066 38,888 -0.139 15
Factor loading 0.686 0.791 0.625 0.884 0.889
Theta Reliability 0.84
Single Factor Solution
Eigan Value 3.058
High Ranking = More Reliant
Percentage Explained Variance 61.168 Low Ranking = Less Reliant

61

62
Northeast Recreational Fishing Reliance Index
FULLNAME
No. Boat Ramps
per/1,000 Recreational
Permits Marinas in
County Recreational
Fishing Reliance Ranking
MONTAUK, SUFFOLK, NY* 9 422 126 21.885 1
CAPE MAY, CAPE MAY, NJ* 4 280 27 12.977 2
NARRAGANSETT, WASHINGTON, RI* 1 245 26 10.435 3
GLOUCESTER, ESSEX, MA* 0 206 49 8.736 4
POINT PLEASANT, OCEAN, NJ* 0 119 87 5.600 5
ATLANTIC CITY, ATLANTIC, NJ* 0 44 19 1.590 6
PORTLAND, CUMBERLAND, ME* 0 21 23 0.641 7
BARNEGAT LIGHT/LONG BEACH, OCEAN, NJ* 0 0 87 0.585 8
STONINGTON, NEW LONDON, CT* 1 0 33 0.099 9
STONINGTON, HANCOCK, ME* 1 0 15 0.065 10
HARPSWELL, CUMBERLAND, ME* 1 0 23 0.052 11
NEW BEDFORD, BRISTOL, MA* 0 6 14 -0.070 12
VINALHAVEN, KNOX, ME* 0 0 9 -0.405 13
SEAFORD, YORK, VA* 0 0 2 -0.457 14
NEWPORT NEWS, NEWPORT NEWS CITY, VA* 0 0 3 -0.465 15
Factor loading 0.681 0.743 0.449
Theta Reliability 0.179
Single Factor Solution
Eigan Value 1.219
High Ranking = More Vulnerable
Percentage Explained Variance 40.618 Low Ranking = More Resilient

63
64
Final Products
Data and final report should be available by
Fall 2011 Research should be replicable and hopefully
will be the beginning of a long term database updated annually.

65
Questions?