developing software for using bayesian regression …...developing software for using bayesian...
TRANSCRIPT

1
Developing Software for Using Bayesian Regression to Evaluate Heterogeneity of Treatment Effects in Data from Randomized Controlled Trials
Ravi Varadhan, PhD, PhD1, Thomas A Louis1; Chenguang Wang, MA, PhD1; Nicholas Henderson, PhD1; Carlos O Weiss, MD2
1John Hopkins University, Baltimore, Maryland 2Michigan State University, Grand Rapids, Michigan
Original Project Title: Filling Two Major Gaps in the Analysis of Heterogeneity of Treatment Effects for Patient-Centered Outcomes ResearchPCORI ID: ME‐1303‐5896 HSRProj ID: 20143586
_______________________________ To cite this document, please use: Varadhan R, Louis T, Wang C., et al. 2018. Developing Software for Using Bayesian Regression to Evaluate Heterogeneity of Treatment Effects in Data from Randomized Controlled Trials. Washington, DC: Patient‐Centered Outcomes Research Institute (PCORI). https://doi.org/10.25302/7.2018.ME.13035896

2
Table of Contents
ABSTRACT ................................................................................................................................ 3
BACKGROUND ......................................................................................................................... 5
Why Bayes for HTE Analysis? ...................................................................................................... 8
Participation of Stakeholders in the Design and Conduct of Research and Dissemination of
Findings ..................................................................................................................................... 10
METHODS .............................................................................................................................. 13
Treatment Effect Scale: Notations and Definitions ................................................................... 16
RESULTS ................................................................................................................................ 18
Model Specification ................................................................................................................... 18
Diagnostics and Model Criticism ............................................................................................... 18
Reporting and Interpreting Results ........................................................................................... 18
A Case Study for Aim 2 .............................................................................................................. 25
DISCUSSION ........................................................................................................................... 29
Study Results in Context ............................................................................................................ 29
Uptake of Study Results ............................................................................................................ 29
Study Limitations ...................................................................................................................... 29
Adherence to Methodology Standards .................................................................................... 29
Future Directions ...................................................................................................................... 29
CONCLUSION ......................................................................................................................... 32
REFERENCES .......................................................................................................................... 33
APPENDIX ............................................................................................................................. 35
3
Abstract Background and Motivation Individuals vary in their response to treatment: Some derive substantial overall benefit; some derive little benefit, while others are harmed. Understanding this heterogeneity of treatment effect (HTE) is critical for evaluating how well a treatment can be expected to work for an individual patient or a group of patients. HTE can be defined as the variation in treatment effect that is attributable to patient characteristics (e.g., demographics, health behavior, genetics, pathophysiology). While the importance of understanding HTE is undeniable, reliable identification of HTE is challenging. Subgroup analysis, a common approach to evaluating HTE, is unreliable due to the high likelihood of falsely detecting HTE (type 1 error) or failing to detect true HTE (type 2 error). Prior planning, careful analysis, and responsible reporting are critical when examining HTE so that the consumers of the resulting research reports are not misled and can benefit from this information. Therefore, cutting‐edge methodological practices for assessing HTE are essential for patient‐centered outcomes research (PCOR). In 2013, the PCORI Methodology Committee identified the development of methods for reliable detection of HTE as a top priority. In particular, the Methodology Committee identified 2 major gaps in the analysis of HTE in PCOR: “Develop methods guidance on the use of Bayesian methods in HTE analyses and appropriate outcome scale for HTE analysis (e.g., risk difference, risk ratio, log of odds‐ratio).” Objectives
1. To facilitate Bayesian analysis of HTE in PCOR a. To develop recommendations on how to model HTE using Bayesian regression
models, including which model to use, how to choose priors for interaction terms, and assessing model adequacy
b. To develop a user‐friendly, open‐source, validated software suite for the application of Bayesian methods for HTE analysis
2. To develop recommendations pertaining to the choice of treatment effect scale for the assessment of HTE in PCOR
Methods We implemented Bayesian hierarchical models and graphical user interface (GUI)–based software for HTE analysis. With feedback from an expert panel, we also addressed how to assess HTE under different treatment effect scales. Results There are 4 main products from this work:
1. A methodology paper describing the Bayesian framework and models for subgroup analysis. Using a case study, the paper provides explicit guidance on critical issues including specification of prior distribution, selection of a regression model, and model criticism.1
2. A software for Bayesian HTE analysis called beanz. This facilitates Bayesian HTE analysis for researchers not skilled in advanced Bayesian software such as WinBUGS or

4
STAN. The software is freely available for download. 3. A detailed users’ manual on how to use beanz2 4. A manuscript addressing the key issues pertaining to the choice of treatment effect
scale in the analysis of HTE3 Conclusions We have developed methods, guidance, and software for Bayesian HTE analysis. We will also be publishing a paper addressing the key issues pertaining to the choice of treatment effect scale in the analysis of HTE. Our work should facilitate the uptake of advanced Bayesian techniques for HTE analysis by PCOR researchers. Limitations Proposed methods apply to studies in which potential HTE variables have been prespecified. These methods should not be used in a post hoc manner. The beanz software is applicable only to examining HTE in a parallel group (2‐arm) randomized clinical trial with a binary, continuous, or time‐to‐event primary endpoint.

5
Background For a glossary of technical terms that appear in this report, see Table 1. Individuals vary in their response to treatment: Some derive substantial overall benefit; some derive little benefit, while others are harmed. HTE is a cross‐cutting issue that affects patients with a variety of different diseases or conditions. Assessment of HTE is essential in PCOR, which aims to help patients and stakeholders make informed personalized health care decisions.
HTE can be defined as the variation in treatment effect that is attributable to patient characteristics (e.g., demographics, health behavior, genetics, pathophysiology). Understanding HTE is critical for decisions that are based on knowing how well a treatment is likely to work for an individual, or group of similar individuals, and it is relevant to stakeholders, including patients, clinicians, payers, and guideline developers. Because it directs the scientific team to inform a decision for a specific person, PCOR inherently is interested in HTE. In fact, it can be said that a defining characteristic of PCOR is an interest in HTE. The presence of HTE provides the motivation to individualize a recommendation for treatment. Without it, a patient could simply use an average treatment effect to inform his or her decision. While the importance of understanding HTE is undeniable, reliable identification of HTE is far from commonplace.
HTE analyses have inherent limitations. The most common approaches to evaluating HTE, especially subgroup analysis of 1 variable at a time, are unreliable due to the high likelihood of falsely detecting HTE (type 1 error) or failing to detect true HTE (type 2 error). Therefore, results of many published HTE analyses are, rightfully, treated with skepticism. HTE questions tend to be families of questions, making them prone to type 1 error, which is often a problem created by performing many analyses. On the other hand, subgroups used for HTE questions are by definition subsets of a sample, which makes them more prone to type 2 error than a hypothesis test on the overall efficacy of the treatment. Another limitation is that subgroup analyses are susceptible to confounding—i.e., the difference in treatment effects between subgroups may actually be due to imbalance in the distribution of other covariates.4
Commonly used methods to account for these issues, such as multiplicity correction for type 1 error, address a component of the problem, but are inadequate. Don Berry, a leading statistician, opined, “Neither Type I error adjustments, nor ignoring the problem of multiplicities, is consistent with the scientific method. Researchers and statisticians should take a reasoned approach that recognizes the possibility that observed differences may be the result of random variability as well as the possibility that they are real.”5
A report of the PCORI Methodology Committee published in 2013 identified development of methods for reliable detection of HTE as top priorities (REF). In particular, the Methodology Committee identified 2 major gaps in the analysis of HTE in PCOR: “Develop methods

6
guidance on the use of Bayesian methods in HTE analyses and appropriate outcome scale for HTE analysis.”

7
Table 1. A Glossary of Technical Terms Used in This Report
Terms Description
Average treatment effect The average response of a group of people to a treatment compared to without the treatment
Individual treatment effect The response of an individual to a treatment compared to response without the treatment
Treatment effect scale The scale in which treatment effect is measured. For example, this could be a ratio of average response under treatment to the average response without treatment, or it could be the difference in average response under treatment to the average response without treatment.
Heterogeneity of treatment effect (HTE)
The nonrandom variation in treatment response that can be attributed to differences in patient characteristics
Subgroup analysis The most popular way of examining HTE, in which the entire study sample is divided into mutually exclusive groups and the treatment effect is estimated in each group—for example, the treatment effect in men and in women
Interactions A measure of how the treatment effect varies according to different values of a covariate. For example, an age–treatment interaction is a measure of how the treatment effect changes as age varies. Interactions are commonly assessed by including a treatment covariate product term in a regression model.
Quantitative HTE A variation in treatment effect, of the same direction, according to levels of a covariate. For example, men and women both have a beneficial effect from the treatment, but the magnitude of benefit is significantly different.
Qualitative HTE A variation in treatment effect, of the opposite direction, according to levels of covariate. For example, men have a beneficial effect from the treatment, but women have a harmful effect. Detection of qualitative HTE requires greater sample sizes than that of quantitative HTE.
Type 1 error An error that occurs when a statistical test rejects a null hypothesis of interest when the null hypothesis is, in fact, true. Also known as false positive. In the context of HTE, a type 1 error is an error in declaring that the treatment effect is heterogeneous, when it is not. Type 1 error can increase when many subgroups or interactions are examined.
Type 2 error An error that occurs when a statistical test does not reject a null hypothesis of interest when the null hypothesis is, in fact, false. Also known as false negative. In the context of HTE, a type 2 error is an error in declaring that the treatment effect is not heterogeneous, when it is. Typically, studies lack adequate power to examine HTE; hence, type 2 error tends to be large.
Bayesian inference versus frequentist inference
Frequentist inference is a statistical framework that evaluates the population parameters by imagining repeated samples from an appropriate model. The population parameters are assumed to be fixed, but unknown. Bayesian inference is a framework that utilizes prior beliefs or information and updates those beliefs based on the observed data to derive probabilistic statements about unknown population parameters, using an appropriate model for the data generating process. Here the

8
Why Bayes for HTE Analysis? Why is a Bayesian approach particularly suited to studying HTE in PCOR? In many aspects, the Bayesian approach is more aligned with PCOR objectives than the frequentist approach for evaluating HTE. PCOR is interested in inference about the treatment effect for individuals or narrowly defined subgroups, taking into account individual characteristics. The presupposition is that HTE exists. The very phrase “heterogeneous treatment effects” acknowledges that there is likely to be a distribution of treatment effects, making the Bayesian framework a natural way to characterize the distribution. Thus, emphasis is not on detection of HTE by determining if the result of a statistical procedure is significant or not significant. Rather, emphasis is placed on estimating the magnitude of HTE and describing its features, thereby facilitating clinical interpretation and informing individualized treatment and management decisions. Because the sample sizes in subgroups defined by patient characteristics tend to be small, the estimated subgroup effects using only the data for each subgroup are often too variable and result in unacceptably high false positives and false negatives. Achieving more precision in estimation requires a statistical model that shares information across subgroups and exploits prior information. While models could be developed within either framework (frequentist or Bayesian), the Bayesian approach is ideally suited for formally including prior information.
Typically, model‐based Bayesian estimates that are used for subgroup analysis have lower uncertainty than estimates from separate analyses of the subgroups. For example, a separate analysis of one subgroup among many may produce an extreme estimate of treatment effect modification that may be considered startling, until appropriately evaluated in the context of sampling variability and multiplicity adjustment. However, by sharing information across subgroups and effect modifications in a manner stipulated by the model, the Bayesian
population parameters are random and unknown. Both frequentist and Bayesian frameworks require a data generating model, but the Bayesian framework also requires a prior distribution for population parameters. In the frequentist framework, the parameters are fixed but the data are random, whereas in the Bayesian framework, the data are fixed and the parameters are random.
Prior distribution A probability distribution that reflects the researcher’s belief about a population parameter of interest before observing the data
Posterior distribution A probability distribution that reflects the researcher’s belief about a population parameter of interest after observing the data

9
approach stabilizes the direct estimate by pulling it back (shrinking it) toward the overall treatment effect.6 Shrinkage calms the interest in the effect and also serves as a front‐line multiplicity adjustment. Of course, a model‐based estimate relies on assumptions and care is needed, but the advantage of a relatively precise model‐based estimate with a small mean square error relative to the direct estimate should be given serious consideration.
While precision of estimation is perhaps the main reason for evaluating HTE with a Bayesian approach, in general, the Bayesian framework has other advantages in making statistical inferences. One advantage is that a Bayesian approach can facilitate interpretation because it supports probability statements about the subgroup effects or other quantities of interest conditional on the observed data, while the frequentist approach permits only statements about the likelihood of the observed data under hypothesized values for the effects. It can be argued that statements of the latter are less amenable to clinical interpretation. For instance, the frequentist approach produces a P value, the probability of seeing the observed difference between treatment A and B, or a more extreme difference, even if in truth there was no difference. In contrast, the Bayesian approach provides a simple and intuitive summary such as “the probability that the treatment A is better than treatment B is 0.8.” Such a summary of HTE can be more readily understood by patients and other stakeholders than the type of inference provided by a frequentist approach.
Furthermore, in a frequentist analysis, inference often relies on approximating the distribution of an estimate based on large‐sample theory, which can be inaccurate if the sample size is small, such as in a subgroup. In contrast with modern Monte Carlo methods, a Bayesian analysis does not require large sample approximations.7
Finally, the Bayesian approach can address complex questions of clinical interest. For example, benefit–risk tradeoffs involving both efficacy and safety, or the uncertainty of such complicated measures as number needed to treat, are handled by the Bayesian approach in the same principled way as it handles more rudimentary quantities (e.g., subgroup‐specific treatment effect). Due to advances in computational speed and simulation methods, probability statements about virtually any quantity of clinical interest are possible with the Bayesian approach. The Bayesian approach is especially appropriate for PCOR and its focus on HTE because, unlike a frequentist approach, it provides a principled framework for combining evidence from the study at hand with external information, and/or subjective beliefs, to answer decision‐driven questions from the varied perspectives of different stakeholders. In fact, Bayesian approaches can be naturally extended into a full decision‐theoretical framework through the use of loss functions. Although our guidance does not address decision making since it is beyond the scope of this report, joint posterior distributions obtained from the Bayesian analyses described in this report are appropriate inputs for decision making.8 Development of methods for treatment‐related decision making at the individual patient level is a logical next step for PCOR.

10
A number of informative and well‐written guidance documents on general Bayesian analysis are available. Examples include BaSiS,9 BAYESWATCH,7 Food and Drug Administration Guidance for Industry and FDA Staff,10 and ROBUST.11 However, none of these guidance documents explicitly address HTE. Therefore, our aim is to address the more‐ specific question of how to evaluate HTE using Bayesian models. Our guidance is intended to highlight the main principles behind the analysis, reporting, and interpretation of the Bayesian HTE approach to PCOR. The main audience for this guidance is investigators who are considering a proposal to PCORI to study HTE within a single study (i.e., our guidance is not tailored to evidence synthesis). The recommendations are intended to guide investigators as they plan studies to examine HTE, especially the analytic planning stage of study planning, in order to provide optimal information to guide patient‐centered care.
The results of this project address fundamental, cross‐cutting methodological issues and thus will enhance PCOR for a large range of specific clinical questions. At the heart of PCOR is a patient‐centered perspective, which means that an individual’s characteristics are used to inform and tailor clinical decisions. No methodological topic is, arguably, more relevant to patient‐centered perspective than the assessment of HTE, the topic of our research. The goal of HTE analyses is to evaluate which patient characteristics are the primary determinants of response to treatments. As described further in this report, as a product of this project, the investigators will make available valid statistical methods for HTE analysis, guidance on their appropriate use, and user‐friendly software tools. Availability of advanced HTE analytic techniques, along with a user‐friendly software system and recommendations for using them, should encourage researchers to include patients with differing demographic characteristics, health behavior patterns, pathophysiology, genetic makeup, and other important characteristics in PCOR studies. Armed with our tools and techniques, along with the guidance paper, researchers will be able to study patient‐level characteristics that are related to the effectiveness of interventions.
Participation of Stakeholders in the Design and Conduct of Research and Dissemination of Findings This is a statistical methodology development project. Hence, we formed a panel of leading experts in statistical methodology and clinical/biostatistical research to advise us on the project. Our panel comprised 15 statisticians and methodologists. Table 2 lists their names and affiliations. We provided an honorarium of $1000 to each. We held 3 teleconferences, as well as email exchanges with the experts. The first teleconference was held at the beginning of the project so we could receive input on whether the aims and scope of the project were feasible and would contribute to advancing the agenda of PCOR or whether they needed to be revised. The experts unanimously felt that the project was interesting and important. They were enthusiastic about being involved in this project, especially at the prospect of popularizing Bayesian methodology and making it available to a broader audience. We held discussions to clarify the scope of the project. The consensus was that while the methods should be broad enough to apply to all studies, it was beyond the scope of this project to develop methods to take into account the idiosyncratic features of different types of designs. For example, while the Bayesian HTE analytic methods developed in this project can be

11
applied to pragmatic trials, additional modifications might be required to capture the variations in treatments present in pragmatic trials if such variations are sufficiently important. One source of such extra variation in pragmatic trials is that the usual care group, which is often the comparator group, might have different versions of patient management that may need to be captured.
We next worked on Aim 1a, a draft guidance document outlining the principles of Bayesian HTE analysis for PCOR, and then sent the document to the experts for their critical feedback. We received extensive comments and critiques, which helped us enormously to improve clarity and to identify critical aspects of Bayesian HTE analysis. The main comments were the following: (1) Clearly articulate the appropriateness of Bayesian approach to HTE; e.g., why would hierarchical models in which the treatment effect in one subgroup depends upon that in the other subgroups be appropriate? (2) Provide a detailed case study to illustrate the application of Bayesian HTE. We incorporated these and many other recommendations stemming from the experts’ feedback in our manuscript that was published in the journal Health Services Outcomes Research Methodology.1 We held the second teleconference to receive feedback on the initial (alpha) version of the software. The panel was generally very enthusiastic about the design of and the potential for the software. Dr. Steve Goodman said:
“from a statistician perspective, I think this has an amazing potential for teaching. The ease with which you can go between displays and models, is going to be incredibly useful for those who either can’t run the models or statisticians/customers who don’t understand Bayes. I think you should think about it from that perspective too—in terms of audience. For PCORI to have developed a software to teach people is going to be
Table 2. Advisory Panel Members and Their Affiliations
Stakeholder Name Affiliation
Prof. David Banks Duke University
Dr. Scott Berry Berry Consultants, Inc.
Prof. Brad Carlin University of Minnesota
Prof. Ralph B. D’Agostino Boston University
Prof. Steve Goodman StanfordUniversity
Prof. Paul Gustafson The University of British Columbia
Prof. Frank Harrell Vanderbilt University
Prof. Jack Lee MDAnderson Cancer Center
Prof. Rod Little University of Michigan
Prof. David Matchar Duke University
Prof. Sharon‐Lise Normand HarvardMedical School
Dr. David Ohlssen Novartis Pharmaceuticals
Dr. Gene Pennello Food and Drug Administration
Prof. Gary Rosner Johns HopkinsMedicine
Prof. Tyler VanderWeele Harvard School of Public Health

12
incredibly useful. As an educational tool at a minimum, this is a great tool.” Others in the panel felt that the software was a good tool for researchers. Dr. Gene Pennello said, “I think the software has considerable merit in getting researchers to be more comfortable with Bayesian subgroup analysis. I’m excited about this effort.” Dr. Brad Carlin wrote, “I’m not sure I agree with many on the panel who suggested teaching is a primary use for this tool. There are other more general Bayesian packages out there for teaching, so I still think the primary purpose of the software should be in helping users of HTE datasets draw the right conclusions. Yes, of course, the software should have an excellent tutorial and easy‐to‐read users’ manual, but I agree with the team’s current focus on helping researchers get their work done, rather than on teaching per se; teaching IMHO is an important but secondary use for the package.”
Taking these comments into consideration, we have developed a software called beanz, which has both command line interface using R GUI and a web server–based version running on R Shiny ([computer program]. RStudio Inc; 2013) platform. Advanced modelers can use the R command interface, whereas those not familiar with R can use the web server version. We have also written a detailed case study demonstration of the software,1 and a comprehensive users’ manual for the software.2
We held the third teleconference to discuss the white paper for Aim 2: to develop recommendations pertaining to the choice of treatment effect scale for the assessment of HTE in PCOR, including transformation of outcome scale and detection of qualitative interactions. We provided the experts with excerpts from the key papers pertaining to this issue.12‐16 We also identified a list of 5 questions to focus the discussion, and asked the experts to come up with additional issues. The experts agreed that the 5 questions we identified were central to the issue and fairly comprehensive in their scope:
1. For PCOR, which effect scale is most relevant (e.g., multiplicative, additive, others)? 2. Does the distinction between effect modification and mechanistic interaction
matter in PCOR context? If so, which type of HTE is most relevant in PCOR?
3. Should we try to find a transformation that minimizes HTE, at least when
conducting data analysis?
4. Should we test for qualitative HTE? 5. What overall strategic approach do you recommend?
The experts provided excellent discussion during the teleconference and also separate written comments in response to these 5 questions, which formed the core of our white paper. This will be further discussed in the Results section.
13
Methods Our project had 3 aims. We will describe the methods for each aim separately. Aim 1a: To develop recommendations on how to model HTE using Bayesian regression models, including which model to use, how to choose priors for interaction terms, and assessing model adequacy
Here we provide a concise summary of the methodologic elements. For further specific details, refer to our recently published manuscript.1
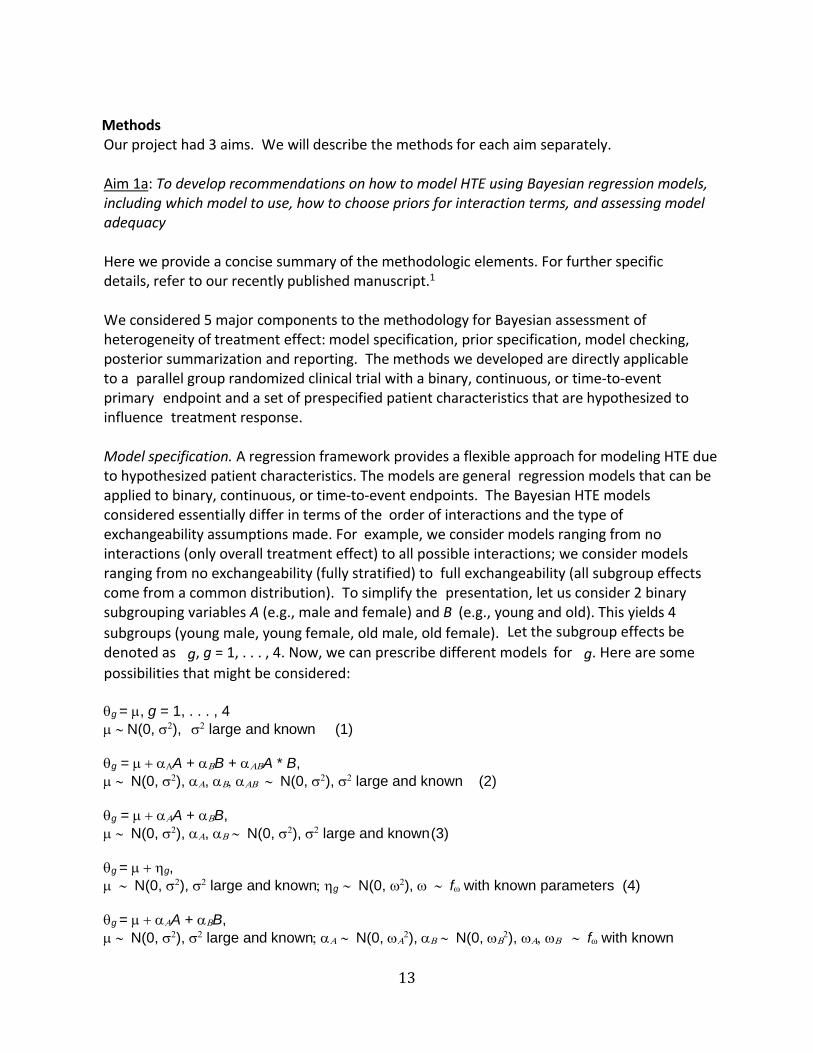
We considered 5 major components to the methodology for Bayesian assessment of heterogeneity of treatment effect: model specification, prior specification, model checking, posterior summarization and reporting. The methods we developed are directly applicable to a parallel group randomized clinical trial with a binary, continuous, or time‐to‐event primary endpoint and a set of prespecified patient characteristics that are hypothesized to influence treatment response. Model specification. A regression framework provides a flexible approach for modeling HTE due to hypothesized patient characteristics. The models are general regression models that can be applied to binary, continuous, or time‐to‐event endpoints. The Bayesian HTE models considered essentially differ in terms of the order of interactions and the type of exchangeability assumptions made. For example, we consider models ranging from no interactions (only overall treatment effect) to all possible interactions; we consider models ranging from no exchangeability (fully stratified) to full exchangeability (all subgroup effects come from a common distribution). To simplify the presentation, let us consider 2 binary subgrouping variables A (e.g., male and female) and B (e.g., young and old). This yields 4
subgroups (young male, young female, old male, old female). Let the subgroup effects be
denoted as �g, g = 1, . . . , 4. Now, we can prescribe different models for �g. Here are some
possibilities that might be considered: g = , g = 1, . . . , 4 N(0, ), large and known (1) g = A + B + A * B, N(0, ), , N(0, ), large and known (2) g = A + B, N(0, ), , N(0, ), large and known (3) g = g, N(0, ), large and knowng N(0, ), fwith known parameters (4) g = A + B, N(0, ), large and known N(0,
), N(0, ), fwith known
14
parameters (5) g = A + B + A * B, N(0, ), large and known N(0,
), N(0, ), N(0,
), fwith known parameters (6)
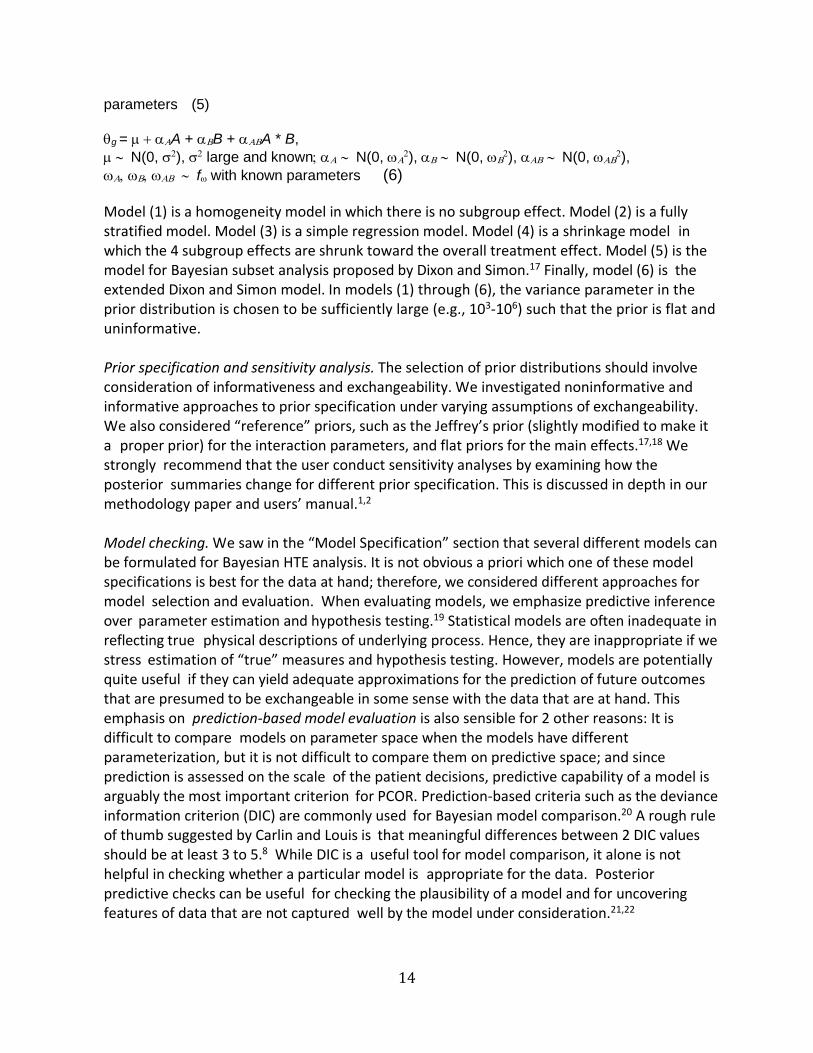
Model (1) is a homogeneity model in which there is no subgroup effect. Model (2) is a fully stratified model. Model (3) is a simple regression model. Model (4) is a shrinkage model in which the 4 subgroup effects are shrunk toward the overall treatment effect. Model (5) is the model for Bayesian subset analysis proposed by Dixon and Simon.17 Finally, model (6) is the extended Dixon and Simon model. In models (1) through (6), the variance parameter in the prior distribution is chosen to be sufficiently large (e.g., 103‐106) such that the prior is flat and uninformative. Prior specification and sensitivity analysis. The selection of prior distributions should involve consideration of informativeness and exchangeability. We investigated noninformative and informative approaches to prior specification under varying assumptions of exchangeability.
We also considered “reference” priors, such as the Jeffrey’s prior (slightly modified to make it a proper prior) for the interaction parameters, and flat priors for the main effects.17,18 We strongly recommend that the user conduct sensitivity analyses by examining how the posterior summaries change for different prior specification. This is discussed in depth in our methodology paper and users’ manual.1,2 Model checking. We saw in the “Model Specification” section that several different models can be formulated for Bayesian HTE analysis. It is not obvious a priori which one of these model specifications is best for the data at hand; therefore, we considered different approaches for model selection and evaluation. When evaluating models, we emphasize predictive inference over parameter estimation and hypothesis testing.19 Statistical models are often inadequate in reflecting true physical descriptions of underlying process. Hence, they are inappropriate if we stress estimation of “true” measures and hypothesis testing. However, models are potentially quite useful if they can yield adequate approximations for the prediction of future outcomes that are presumed to be exchangeable in some sense with the data that are at hand. This emphasis on prediction‐based model evaluation is also sensible for 2 other reasons: It is difficult to compare models on parameter space when the models have different parameterization, but it is not difficult to compare them on predictive space; and since prediction is assessed on the scale of the patient decisions, predictive capability of a model is arguably the most important criterion for PCOR. Prediction‐based criteria such as the deviance information criterion (DIC) are commonly used for Bayesian model comparison.20 A rough rule of thumb suggested by Carlin and Louis is that meaningful differences between 2 DIC values should be at least 3 to 5.8 While DIC is a useful tool for model comparison, it alone is not helpful in checking whether a particular model is appropriate for the data. Posterior predictive checks can be useful for checking the plausibility of a model and for uncovering features of data that are not captured well by the model under consideration.21,22
15
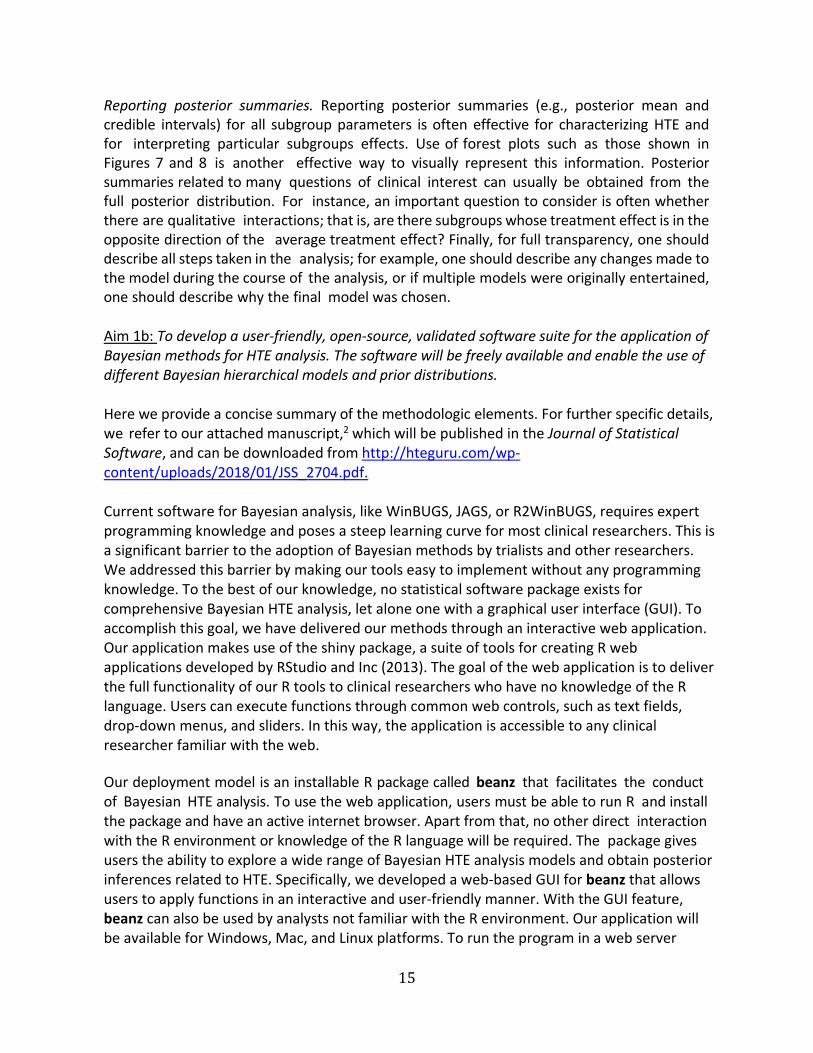
Reporting posterior summaries. Reporting posterior summaries (e.g., posterior mean and credible intervals) for all subgroup parameters is often effective for characterizing HTE and for interpreting particular subgroups effects. Use of forest plots such as those shown in Figures 7 and 8 is another effective way to visually represent this information. Posterior summaries related to many questions of clinical interest can usually be obtained from the full posterior distribution. For instance, an important question to consider is often whether there are qualitative interactions; that is, are there subgroups whose treatment effect is in the opposite direction of the average treatment effect? Finally, for full transparency, one should describe all steps taken in the analysis; for example, one should describe any changes made to the model during the course of the analysis, or if multiple models were originally entertained, one should describe why the final model was chosen.
Aim 1b: To develop a user‐friendly, open‐source, validated software suite for the application of Bayesian methods for HTE analysis. The software will be freely available and enable the use of different Bayesian hierarchical models and prior distributions. Here we provide a concise summary of the methodologic elements. For further specific details, we refer to our attached manuscript,2 which will be published in the Journal of Statistical Software, and can be downloaded from http://hteguru.com/wp‐content/uploads/2018/01/JSS_2704.pdf. Current software for Bayesian analysis, like WinBUGS, JAGS, or R2WinBUGS, requires expert programming knowledge and poses a steep learning curve for most clinical researchers. This is a significant barrier to the adoption of Bayesian methods by trialists and other researchers. We addressed this barrier by making our tools easy to implement without any programming knowledge. To the best of our knowledge, no statistical software package exists for comprehensive Bayesian HTE analysis, let alone one with a graphical user interface (GUI). To accomplish this goal, we have delivered our methods through an interactive web application. Our application makes use of the shiny package, a suite of tools for creating R web applications developed by RStudio and Inc (2013). The goal of the web application is to deliver the full functionality of our R tools to clinical researchers who have no knowledge of the R language. Users can execute functions through common web controls, such as text fields, drop‐down menus, and sliders. In this way, the application is accessible to any clinical researcher familiar with the web.
Our deployment model is an installable R package called beanz that facilitates the conduct of Bayesian HTE analysis. To use the web application, users must be able to run R and install the package and have an active internet browser. Apart from that, no other direct interaction with the R environment or knowledge of the R language will be required. The package gives users the ability to explore a wide range of Bayesian HTE analysis models and obtain posterior inferences related to HTE. Specifically, we developed a web‐based GUI for beanz that allows users to apply functions in an interactive and user‐friendly manner. With the GUI feature, beanz can also be used by analysts not familiar with the R environment. Our application will be available for Windows, Mac, and Linux platforms. To run the program in a web server
16
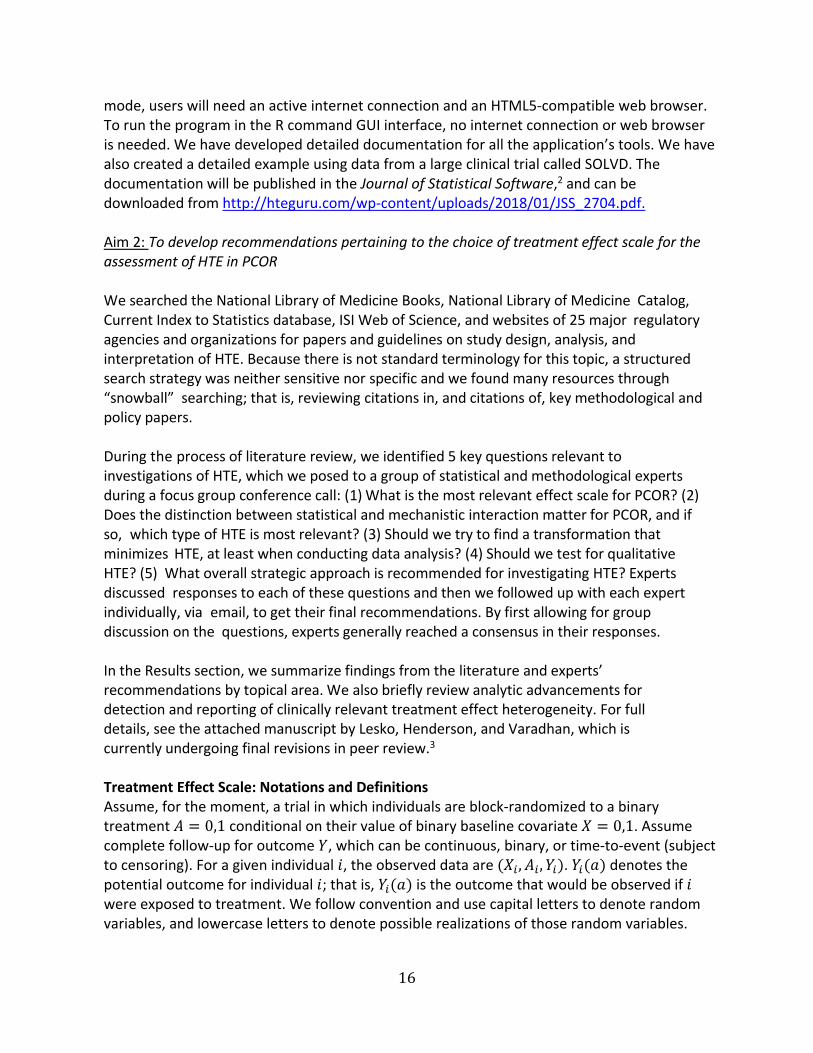
mode, users will need an active internet connection and an HTML5‐compatible web browser. To run the program in the R command GUI interface, no internet connection or web browser is needed. We have developed detailed documentation for all the application’s tools. We have also created a detailed example using data from a large clinical trial called SOLVD. The documentation will be published in the Journal of Statistical Software,2 and can be downloaded from http://hteguru.com/wp‐content/uploads/2018/01/JSS_2704.pdf.
Aim 2: To develop recommendations pertaining to the choice of treatment effect scale for the assessment of HTE in PCOR We searched the National Library of Medicine Books, National Library of Medicine Catalog, Current Index to Statistics database, ISI Web of Science, and websites of 25 major regulatory agencies and organizations for papers and guidelines on study design, analysis, and interpretation of HTE. Because there is not standard terminology for this topic, a structured search strategy was neither sensitive nor specific and we found many resources through “snowball” searching; that is, reviewing citations in, and citations of, key methodological and policy papers. During the process of literature review, we identified 5 key questions relevant to investigations of HTE, which we posed to a group of statistical and methodological experts during a focus group conference call: (1) What is the most relevant effect scale for PCOR? (2) Does the distinction between statistical and mechanistic interaction matter for PCOR, and if so, which type of HTE is most relevant? (3) Should we try to find a transformation that minimizes HTE, at least when conducting data analysis? (4) Should we test for qualitative HTE? (5) What overall strategic approach is recommended for investigating HTE? Experts discussed responses to each of these questions and then we followed up with each expert individually, via email, to get their final recommendations. By first allowing for group discussion on the questions, experts generally reached a consensus in their responses. In the Results section, we summarize findings from the literature and experts’ recommendations by topical area. We also briefly review analytic advancements for detection and reporting of clinically relevant treatment effect heterogeneity. For full details, see the attached manuscript by Lesko, Henderson, and Varadhan, which is currently undergoing final revisions in peer review.3
Treatment Effect Scale: Notations and Definitions Assume, for the moment, a trial in which individuals are block‐randomized to a binary treatment 0,1 conditional on their value of binary baseline covariate 0,1. Assume complete follow‐up for outcome , which can be continuous, binary, or time‐to‐event (subject to censoring). For a given individual , the observed data are , , . denotes the potential outcome for individual ; that is, is the outcome that would be observed if were exposed to treatment. We follow convention and use capital letters to denote random variables, and lowercase letters to denote possible realizations of those random variables.

17
The treatment effect is a comparison of some function of (typically the expected value) if is set
to 1 versus 0; e.g., 1 0 . Assuming no unmeasured confounding and that
the observed outcomes for individuals with are equivalent to their potential outcomes if they had been given (i.e., there are not alternative versions of the treatment that could have been given that would have influenced the outcome) (3, 4), | . Both of these assumptions are met by design in a randomized trial and can sometimes be plausible in observational studies (5, 6). The treatment effect can be represented as
| 1 | 0 . The field of PCOR is often loosely interpreted as aiming to predict which treatment will work in which patients. However, it is not possible to predict individual treatment effects 10 because we can never observe both potential outcomes in the same person (7). The best
we can do is to report expected treatment effect for patients similar to the individual faced with a treatment decision; that is, we can report stratum‐specific treatment effects for strata across which HTE is present. HTE is present when θ varies across subgroups defined by . The recommended approach to assessing HTE is to model the statistical interaction between and . This involves fitting the regression model:
| , , . (1)
In model (1), the coefficient , represents the statistical interaction between the treatment
and covariate . The treatment effects in the 2 subgroups 0 and 1 are, respectively, and , . The statistical interaction between and is quantitative if but both effects are in the same direction (ie, both suggest harm or benefit), and is qualitative if but effects have opposite signs. Statistical interaction is semiqualitative if and 1 treatment effect suggests clinically meaningful harm or benefit while the other effect is null. Testing corresponds to rejecting the null hypothesis : , 0. We address issues of whether statistical tests are appropriate for detecting HTE in a subsequent section. The link function . determines the scale on which HTE is measured and tested. For example, if . is the identity link, , is the difference of risk differences, and a test of
: , 0 is a test of departure from perfect additivity of effects. In the presence of varying baseline risk of , there will be HTE on at least 1 scale. This is a mathematical inevitability (10), although the clinical relevance of the heterogeneity might be negligible. To illustrate this point, assume that | 1, 0 0.04, | 0, 0 0.10, | 1,1 0.08, and | 0, 1 0.20. The relative risk for both strata of is 2.0, indicating absence of multiplicative HTE, but among the individuals with 0 the risk difference is 0.06 while among individuals with 1 the risk difference is 0.12—that is, there is additive HTE. This simple example shows that while the relative benefit is the same, people in the X = 1 group have higher baseline risk and hence they derive a greater benefit from the treatment. Thus, in situations in which the baseline risk varies substantially, at a minimum, the HTE should be reported on a risk difference scale.

18
Results Aim 1a: To develop recommendations on how to model HTE using Bayesian regression models, including which model to use, how to choose priors for interaction terms, and assessing model adequacy
The major results of this aim are presented in detail in our methodology paper1 (attached) and are not repeated in this report. The paper describes the Bayesian framework and models for subgroup analysis. Using an extensive case study, the paper provides explicit guidance on critical issues including specification of prior distribution, selection of a regression model, and model criticism. We summarize key factors to consider when using Bayesian methods to analyze heterogeneity of treatment effect. Model Specification The models described in the methodology paper1 and implemented by beanz2 offer a wide array of useful options for Bayesian subgroup analysis. Parameters for the prior distributions can be chosen using common default values such as those used in the beanz software, through incorporating external information, or through knowledge about the scale of the outcome. In all cases, one should ensure that interpretations of the model parameters are well understood and that the choice of priors is defensible. Diagnostics and Model Criticism If multiple models are considered, DIC20 can be used to compare model performance. Small differences (less than 5) in DIC are often not considered meaningful. Sensitivity analyses should be conducted by investigating changes in key posterior quantities over a range of different priors. Looking at posterior inferences in other plausible alternative models can also serve as a way to examine the sensitivity of the results. Posterior predictive simulations as depicted in Figure 5 of our methodology paper1 are a useful tool for checking if replicated data sets from the fitted model seem plausible in light of the observed data. Notable differences between posterior predictive simulations and the observed data suggest that one should consider modifying the model. Currently, beanz does not include this feature, but we plan to add this to the next release of the software.
Reporting and Interpreting Results Reporting posterior summaries for all subgroup parameters is often effective for characterizing HTE and for interpreting particular subgroups effects. Forest plots such as those shown in Figures 1 and 4 of the methodology paper1 are an effective way to visually represent this information. Posterior summaries related to many questions of clinical interest can usually be obtained from the full posterior distribution. For instance, an important question to consider is often whether there are qualitative interactions—that is, are there subgroups whose treatment effect is in the opposite direction of the average treatment effect? Finally, for full transparency, one should describe all steps taken in the analysis, such as, for example, transformation of variables, the model chosen for analysis, prior distributions, and sensitivity analysis for different priors and/or different models. One should
19
also describe any changes made to the model during the course of the analysis, or if multiple models were originally entertained, one should describe how the final model was chosen.
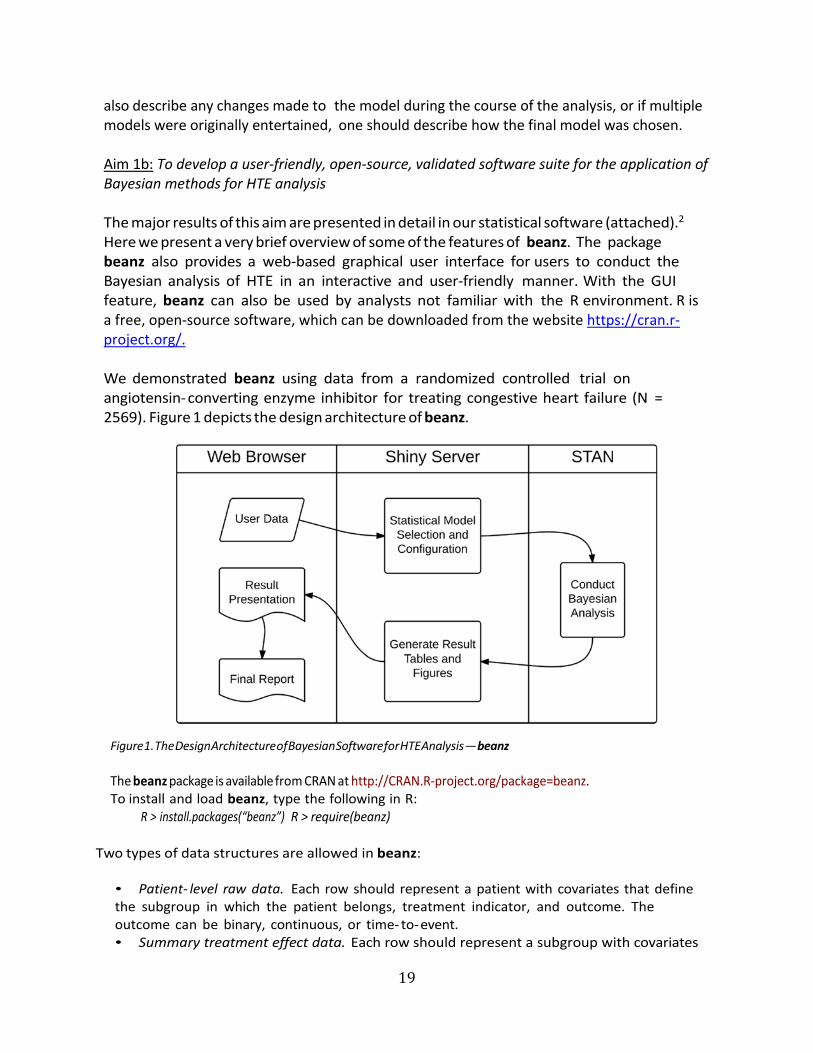
Aim 1b: To develop a user‐friendly, open‐source, validated software suite for the application of Bayesian methods for HTE analysis The major results of this aim are presented in detail in our statistical software (attached).2 Here we present a very brief overview of some of the features of beanz. The package beanz also provides a web‐based graphical user interface for users to conduct the Bayesian analysis of HTE in an interactive and user‐friendly manner. With the GUI feature, beanz can also be used by analysts not familiar with the R environment. R is a free, open‐source software, which can be downloaded from the website https://cran.r‐project.org/. We demonstrated beanz using data from a randomized controlled trial on angiotensin‐converting enzyme inhibitor for treating congestive heart failure (N = 2569). Figure 1 depicts the design architecture of beanz.
Figure 1. The Design Architecture of Bayesian Software for HTE Analysis — beanz
The beanz package is available from CRAN at http://CRAN.R‐project.org/package=beanz. To install and load beanz, type the following in R:
R > install.packages(“beanz”) R > require(beanz)
Two types of data structures are allowed in beanz:
• Patient‐ level raw data. Each row should represent a patient with covariates that define the subgroup in which the patient belongs, treatment indicator, and outcome. The outcome can be binary, continuous, or time‐ to‐event. • Summary treatment effect data. Each row should represent a subgroup with covariates

20
that define the subgroup, estimated treatment effect in the subgroup, and variance for the estimation.
We demonstrate beanz using patient‐level data solvd.sub (contained in beanz) from a randomized controlled trial on angiotensin‐converting enzyme inhibitor for treating congestive heart failure (N = 2569). The package beanz provides function bzGetSubgrpRaw for estimating subgroup effect for each subgroup:
R > subgrp.effect <- bzGetSubgrpRaw(solvd.sub, var.resp = "y", + var.trt = "trt", + var.cov = c("lvef", "sodium", "any.vasodilator.use"), + var.censor = "censor", resptype = "survival");
R > print(subgrp.effect);
Subgroup lvef sodium any.vasodilator.use Estimate Variance N 1 1 0 0 0 -0.37783038 0.01212786 5622 2 0 0 1 -0.34655336 0.01004499 6953 3 0 1 0 -0.79235451 0.03939983 2374 4 0 1 1 -0.39334304 0.02969421 2505 5 1 0 0 0.06776454 0.04629163 2236 6 1 0 1 -0.23655764 0.02400353 3417 7 1 1 0 0.15435495 0.10365396 1048 8 1 1 1 0.05947290 0.07761840 123
For Bayesian inference, the function bzCallStan calls rstan (STAN 2015) to draw MCMC samples for Bayesian models. We consider the Simple regression model in the following example:
R > var.cov <- c("lvef", "sodium", "any.vasodilator.use"); R > var.estvar <- c("Estimate," "Variance"); R > rst.sr <- bzCallStan(mdls = "sr," dat.sub = subgrp.effect, + var.estvar = var.estvar, var.cov = var.cov, + lst.par.pri = list(vtau = 1000, vgamma = 1000, vrange = c(0,0)), + chains = 1, iter = 4000, warmup = 2000, thin = 2, seed = 1000);
The function bzSummary creates a data frame with the summary of the posterior
subgroup treatment effects:
R > tbl.sub <- bzSummary(rst.sr, digits = 2, cut = 0); R > print(tbl.sub[,-1]);
Mean SD 2.5% 25% Median 75% 97.5% Prob < 0
Subgroup 1 "-0.4" "0.1" "-0.59" "-0.47" "-0.4" "-0.34" "-0.23" "1" Subgroup 2 "-0.38" "0.08" "-0.55" "-0.44" "-0.38" "-0.32" "-0.22" "1"

21
Subgroup 3 "-0.49" "0.13" "-0.72" "-0.58" "-0.49" "-0.4" "-0.24" "1" Subgroup 4 "-0.47" "0.13" "-0.72" "-0.55" "-0.46" "-0.38" "-0.23" "1" Subgroup 5 "-0.06" "0.13" "-0.32" "-0.15" "-0.06" "0.02" "0.17" "0.69" Subgroup 6 "-0.04" "0.11" "-0.27" "-0.12" "-0.04" "0.04" "0.18" "0.64" Subgroup 7 "-0.15" "0.15" "-0.44" "-0.26" "-0.15" "-0.04" "0.15" "0.84" Subgroup 8 "-0.13" "0.15" "-0.43" "-0.23" "-0.12" "-0.03" "0.15" "0.81"
The package beanz also provides functions bzPlot and bzForest to present the posterior
densities and forest plots (Figure 2):
R > bzPlot(rst.sr); R > bzForest(rst.sr);
Figure 2. Posterior Distribution of Treatment Effect in the Subgroups (Left Panel), and Forest Plots of Posterior
Treatment Effects (Right Panel)
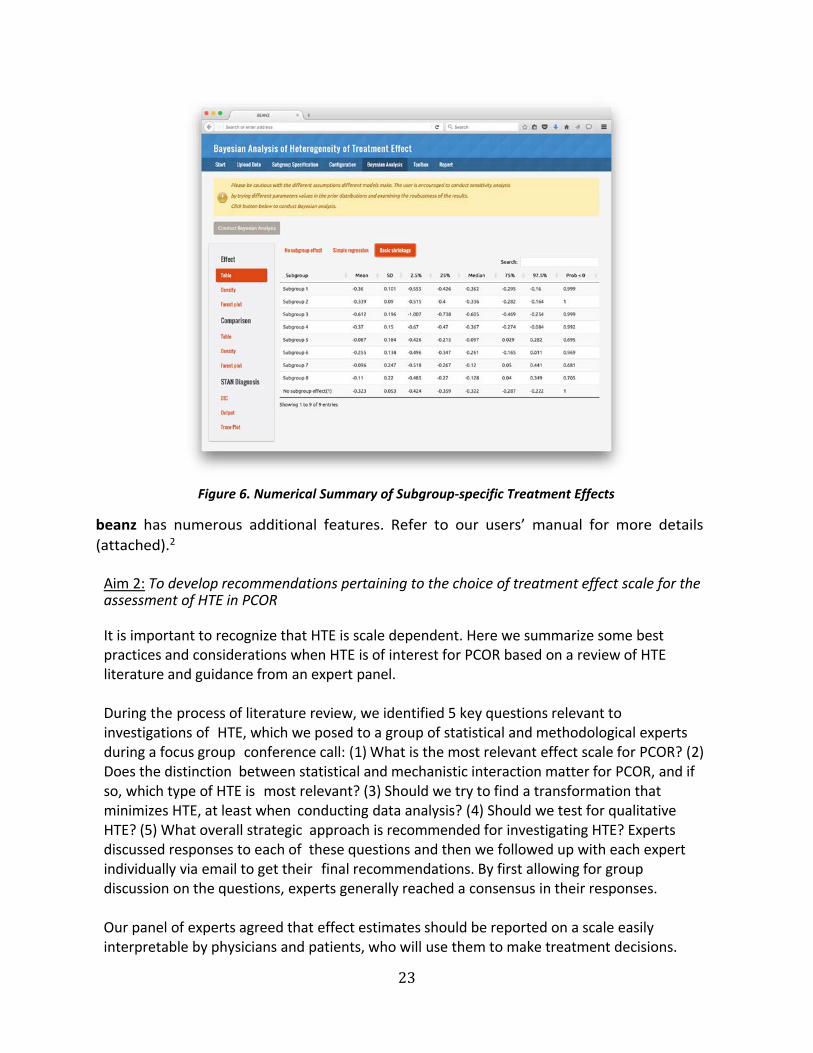
The GUI of beanz can be called by function bzShiny. An online demonstration of the GUI can be found at https://olssol.shinyapps.io/beanz/. Figures 3 through 6 are screenshots of the GUI showing how to upload data, define subgroups, specify model, and receive a numerical summary of posterior distribution of subgroup treatment effects.

22
Figure 3. Uploading Data
Figure 4. Subgroup Specification
Figure 5. Specifying Model Parameters
23
beanz has numerous additional features. Refer to our users’ manual for more details
(attached).2
Aim 2: To develop recommendations pertaining to the choice of treatment effect scale for the assessment of HTE in PCOR It is important to recognize that HTE is scale dependent. Here we summarize some best practices and considerations when HTE is of interest for PCOR based on a review of HTE literature and guidance from an expert panel.
During the process of literature review, we identified 5 key questions relevant to investigations of HTE, which we posed to a group of statistical and methodological experts during a focus group conference call: (1) What is the most relevant effect scale for PCOR? (2) Does the distinction between statistical and mechanistic interaction matter for PCOR, and if so, which type of HTE is most relevant? (3) Should we try to find a transformation that minimizes HTE, at least when conducting data analysis? (4) Should we test for qualitative HTE? (5) What overall strategic approach is recommended for investigating HTE? Experts discussed responses to each of these questions and then we followed up with each expert individually via email to get their final recommendations. By first allowing for group discussion on the questions, experts generally reached a consensus in their responses.
Our panel of experts agreed that effect estimates should be reported on a scale easily interpretable by physicians and patients, who will use them to make treatment decisions.
Figure 6. Numerical Summary of Subgroup‐specific Treatment Effects

24
Physicians and patients most readily understand benefits or harms of a particular treatment when results are presented on the absolute (risk difference) scale, preferably alongside a personalized baseline risk estimate. The relative scale (risk ratios or odds ratios) tends to overstate benefits or harms. In general, the experts asserted that the analytic model should not dictate how results are reported. They suggested using the most parsimonious, optimally predictive analytical model to predict patient‐specific (subgroup‐specific) outcomes under each treatment and then reporting contrasts of outcomes on the additive scale. Due to the scale dependence of HTE, some experts suggested that both multiplicative and additive interactions should be reported.
The expert panel members reminded us that the theoretical distinction between statistical and causal interaction probably does not matter much to the patient. What is likely most relevant for PCOR is personalized predictions (derived from analyses that account for heterogeneity, but evaluated at the particular covariate profile of an individual patient). If HTE exists across characteristics that are malleable (e.g., stop drinking coffee, don’t eat grapefruit, lose weight), then communicating those varying predictions can help a patient weigh the costs and benefits of making additional life changes when initiating a treatment.
Confirmatory testing for HTE and exploratory analyses looking for HTE should be clearly delineated. Subgroups for confirmatory testing should be specified a priori to avoid spurious conclusions, particularly because the role of uncertainty and bias is often underestimated when researchers a posteriori try to interpret a panel of subgroup effects. Anticipated qualitative interactions, especially, should be specified a priori because their existence is less plausible and more likely to be spurious, if found, than quantitative interactions. Likewise, subgroups for which there is an a priori hypothesis about heterogeneity based on a causal mechanism should be prioritized for investigation, since prespecified subgroup analytic findings are more likely to be valid than post hoc subgroup results. Using a validated risk score (i.e., for risk of the outcome in the absence of treatment) instead of individual covariates may increase power to detect meaningful heterogeneity, and improve interpretation of results. Conducting exploratory analyses of subgroup effects is encouraged, but regulatory decisions or treatment guidelines are unlikely to be based on exploratory analyses in the absence of replication.
There are many reasons to be cautious when testing for HTE in a single study. Qualitative HTE may be present and important even if there is not sufficient power to reject the null hypothesis that stratum‐specific effects are equivalent. In contrast, in large data sets HTE may be statistically significant but not clinically significant. Stratum‐specific effect estimates, and not just the results of statistical tests, should be reported, although it should be recognized that such estimates can be highly unstable due to small sample sizes. Bayesian approaches, as proposed in Aim 1, may be used to obtain stable stratum‐specific estimates. Interpretation of the presence or absence of HTE should be undertaken with caution, and in context of prior evidence.
Box A provides a summary of our findings for Aim 2, based on expert panel

25
recommendations. All of these recommendations should be considered when developing for the study a statistical analysis plan, which may include measurement scale(s); reporting of subgroup‐specific effects; explanation of whether Bayesian approaches to stabilize stratum‐specific estimates will be employed; prior distributions; sensitivity analysis for different priors and/or different models; and, if multiple models were originally entertained, how the final model will be chosen (e.g., using DIC or posterior predictive check).
Now we present a brief case study of how these recommendations may be applied in a real setting. A Case Study for Aim 23 The studies of left ventricular dysfunction (SOLVD) were a series of trials designed to evaluate the effect of the angiotensin‐converting enzyme inhibitor enalapril on the treatment of congestive heart failure. One of these studies was the SOLVD treatment trial.23 Of the 2569 patients enrolled in the study, 1285 individuals were assigned to the enalapril arm while 1284 individuals were assigned to the control arm. The primary endpoint of interest was time to hospitalization or death. In our analysis, we used the following 3 patient characteristics: gender, age, and ejection fraction. From these 3 baseline variables, we created 12 mutually exclusive subgroups according to the following levels: gender (male versus female), age (> 65 versus ≤ 65), and ejection fraction (grouped into tertiles). These subgroups are similar to the prespecified subgroups originally analyzed in the SOLVD treatment trial. To examine whether HTE was present in the SOLVD treatment trials across the 3 baseline
Box A. Summary of Expert Panel Recommendations for Aim 23
1. Assessment of treatment effect heterogeneity is important for patient‐centered outcomes
research. Qualitative treatment effect heterogeneity should always be evaluated in a
prespecified manner for important subgroups (e.g., men versus women).
2. Treatment effect heterogeneity should be evaluated on different scales (e.g., multiplicative and
additive) because it might be present on one scale, but not on another scale.
3. The scale for the analytic model need not be the same as the scale in which results are
communicated to stakeholders. While modeling can be displayed on whichever scale best fits
the data, stakeholders generally prefer to see the results communicated in terms of absolute
magnitude of benefit or harm; i.e., risk differences or difference in time‐to‐event.
4. Statistically significant interactions are meaningful only when the magnitude of interaction is
similar to the magnitude of the overall treatment effect. This is especially important in the
context of large databases.
5. Bayesian hierarchical modeling is one available analytic strategy with many attractive
properties for patient‐centered outcomes research.

26
patient characteristics of age, gender, and ejection fraction, we first performed a test of treatment–covariate interaction with the 12 multivariate subgroups via an unstructured interaction test. An unstructured test of interaction tests whether there is at least 1 patient subgroup with a differential treatment effect in which the subgroups are defined using all combinations of the baseline patient variables.1 It should be noted that such interaction testing is used as a “gate‐keeping” device in a frequentist framework. When the interaction test is not significant, no further exploration of subgroups is required, since the “allocated alpha” has already been spent. But the Bayesian approach does not follow this gate‐keeping paradigm. In the Bayesian approach the focus is on estimation of subgroup effects, in prespecified subgroups, rather than testing for the significance of interaction. In other words, researchers will estimate subgroup‐specific treatment effects, under assumptions on how the subgroups are related to each other. We obtain posterior distributions of treatment effects in all the subgroups, which allows us to make inferences about relative treatment efficacy in the different subgroups (e.g., what is the probability that women derive greater benefit than men?). Using the outcomes in the SOLVD treatment trial, an unstructured test for interaction on the log‐hazard ratio scale yielded a P value of 0.018, suggesting that HTE is present in this trial, at least on the log‐hazard ratio scale. In addition, we performed a Gail‐Simon test24 to investigate the presence of qualitative interactions, which resulted in a P value of 0.85. Thus, this test does not provide any evidence for the existence of qualitative HTE. While these 2 interaction tests imply quantitative heterogeneity was present in the SOLVD treatment trial, we can used a Bayesian hierarchical model to investigate how meaningful any such heterogeneity is in this trial, because the Bayesian approach to subgroup analysis emphasizes estimation of HTE rather than testing for the presence of variability in treatment effect across subgroups—hence, examining Bayesian subgroup effect estimates (often referred to as shrinkage estimates) provides a direct way of assessing the extent and clinical significance of HTE in the trial.

27
Figure 7. Ratio of mortality hazard between the 2 treatments for the 12 subgroups defined by ejection fractions, age, and gender. The solid vertical line represents the overall estimate of the hazard ratio between 2 treatments, and the dashed vertical line is placed at 1 (i.e., no treatment effect). Figure 7 illustrates the Bayesian shrinkage estimates of the hazard ratio for each of the 12 subgroups defined by age, gender, and ejection fraction. While we tested for HTE on the log‐hazard ratio scale because it is more suitable for regression modeling, we present the subgroup‐specific treatment effect estimates on the hazard ratio scale due to its advantages in interpretability. Figure 7 also shows fully stratified frequentist estimates of the hazard ratio. We obtained the fully stratified estimates by computing a separate hazard ratio estimate within each group without combining these estimates in a unified model as we did in computing the Bayesian shrinkage estimates. As Figure 7 demonstrates, the fully stratified estimates are highly variable while the shrinkage estimates are much less variable due to the fact that these estimates tend to be pulled or “shrunken” toward the overall hazard ratio. Moreover, another feature of the Bayesian estimates that leads to more stable estimation is that the amount of shrinkage is greater for subgroups that have small numbers of patients while subgroups with large numbers of patients are not shrunken to the same degree. The

28
Bayesian estimates depicted in Figure 7 make apparent that meaningful variation in treatment effect is present. The standard deviation of the shrinkage estimate i 0.084, meaning that the hazard ratio in a typical subgroup is roughly .084 different from the overall hazard ratio of 0.74. Moreover, the pattern of the Bayesian shrinkage suggests that treatment effect varies according to baseline ejection fraction levels and gender. In particular, the male subgroups tend to derive greater benefit than the female subgroups in terms of hazard ratio, and the groups with high baseline ejection fractions also tend to derive less benefit than those with either medium or low ejection fractions. From a patient‐centered perspective, an interpretable measure of treatment effect is the difference in the probability of remaining event‐free for at least 2 years. Estimates of this survival probability may be easily incorporated in a Bayesian subgroup analysis using one of the methods described in our methodology paper.1 To use any of the Bayesian subgroup methods described in the paper, one needs only to compute an estimate of the treatment effect of interest for each subgroup and a standard error for each estimate. For the 12 subgroups from the SOLVD treatment trial, we estimated the difference in 2‐year survival probabilities using the subgroup‐specific Kaplan‐Meier estimates. The overall estimate of the difference in 2‐year survival probability was 0.098 with an associated confidence interval of 0.036, 0.160. Figure 8 displays the subgroup‐specific Bayesian shrinkage estimates and the fully stratified estimates. As on the hazard ratio scale, men tend to derive greater treatment benefit than women on this risk difference scale. The estimated difference in survival probability was 0.01 (−0.12, 0.15) for the female group and 0.12 (0.05, 0.19) for the male group in the trial.

29
Figure 8. Differences in 2‐year survival probabilities between the 2 treatments for the 12 subgroups defined by ejection fractions, age, and gender. The solid vertical line represents the overall estimate of the difference in survival probability between 2 treatments, and the dashed vertical line is placed at zero (i.e., no treatment effect). In summary, our example demonstrates some of the main strengths of the Bayesian HTE analysis when compared with the traditional frequentist approach: (1) more stable subgroup‐specific estimates of treatment effects; and (2) estimation of patient‐centered measures of treatment efficacy in subgroups; for example, difference in survival probability between the 2 treatments in a given subgroup (c.f. hazard ratio of 2 treatments). Discussion Context of Methodological Gap(s) HTE is the variation in treatment effect that is attributable to patient characteristics. Understanding HTE is critical for decisions that are based on knowing how well a treatment is likely to work for an individual, or a group of similar individuals, and it is relevant to stakeholders including patients, clinicians, payers, and guideline developers. Reliable identification of HTE is far from trivial. Subgroup analysis, which is the most common approach to evaluating HTE, is unreliable due to the high likelihood of falsely detecting HTE

30
(type 1 error) or failing to detect true HTE (type 2 error). Prior planning, careful analysis, and responsible reporting are critical when examining HTE so the consumers of the resulting research are not misled and can benefit from this information. Therefore, cutting‐edge methodological practices for assessing HTE are essential for PCOR. A report of the PCORI Methodology Committee identified development of methods for reliable detection of HTE as a top priority. In particular, the Methodology Committee identified 2 major gaps in the analysis of HTE in PCOR: “Develop methods guidance on the use of Bayesian methods in HTE analyses and appropriate outcome scale for HTE analysis (e.g., risk difference, risk ratio, log of odds‐ ratio).” Our project was funded by PCORI to address these gaps in HTE analyses. A Bayesian approach offers both an effective and practical framework for evaluating differences in treatment effectiveness due to heterogeneity in patient characteristics. Bayesian methods have particular advantages in the analysis of HTE because they provide a flexible framework for synthesizing evidence of all types, such as prior information or information across subgroups. Bayesian methods do not suffer from the limitations of conventional subgroup analysis (e.g., type 1 and type 2 errors). Despite these merits, several factors have limited wider adoption of Bayesian methods, including lack of accessible software and concerns about the choice and impact of priors.1 We have addressed these challenges by developing specific models that can be used to examine HTE and by addressing the important issues involved in their implementation, such as prior specification, model checking, and sensitivity analyses. We have also demonstrated these ideas using a case study and a software tool called beanz, which can be used as a web server version with a user‐friendly GUI or as a stand‐alone R package. Our case study had a large sample size (N = 2569). Smaller studies are most likely underpowered to detect HTE. Hence, the absence of HTE in a smaller study should be interpreted with caution. In a smaller study, it is also likely that there could be an extreme subgroup finding due to volatility inherent in small subgroups, which should be interpreted with caution. The Bayesian approach mitigates both of these issues. Hence, it is particularly more advantageous in a smaller study than in a large study.
In summary, our PCORI project has accomplished the goal of facilitating the use of Bayesian methods for HTE analysis by lowering the barriers to their implementation in a two‐fold manner: ( 1 ) by providing a freely available, user‐friendly software with detailed documentation, and (2) by producing a rigorous guidance document with a detailed case study using a real clinical trial data. Our guidance paper and the beanz software have great potential to improve the examination of HTE in future PCORI‐funded studies. The HTE findings obtained using our methodology are more likely to be robust and reliable than those obtained using conventional subgroup analysis. Furthermore, we have also developed guidance, based on advice from an expert panel, on how to address the challenge of various treatment effects scales when assessing HTE.

31
Study Results in Context Our study is unique. We are not aware of any efforts in the past to develop Bayesian HTE methods along with guidance, case study demonstration, and user‐friendly software. Hence, the products of our research have substantial potential to advance PCOR methodology.
Uptake of Study Results The methods and software we have developed are state‐of‐the‐art for subgroup analysis. Since we have developed products spanning the entire spectrum of translation, from methods development to guidance to case study demonstration to user‐friendly software with complete documentation, there should be few, if any, barriers to implementing our methods when appropriate. Furthermore, we have already published a manuscript on guidance for conducting HTE analysis using Bayesian methods, and the second manuscript on the software is in press in a leading software journal and will likely be published soon. The third manuscript, on Aim 2, has been provisionally accepted and is undergoing final round of revisions. Thus, our methods are being disseminated in the research literature and will likely be used by PCOR researchers. We recommend that the users of our software have some statistical training to enable proper use of it. Therefore, the intended users of our software are statisticians, epidemiologists, and clinical researchers with some statistical training.
Study Limitations Proposed methods apply to studies in which potential HTE variables have been prespecified. The methods should not be used in a post hoc manner. The beanz software is applicable only to examining HTE in a parallel group (2‐arm) randomized clinical trial with a binary, continuous, or time‐to‐event primary endpoint. Our methods cannot be applied to observational studies without accounting for confounding due to treatment selection. Although this is not a limitation per se, it necessitates additional considerations to extend these methods to a broader range of PCOR study designs. Another potential limitation is that our methods mainly focus on patient‐level factors of HTE. They do not address provider‐level or variations in treatment itself as occurs in pragmatic trials. Adherence to Methodology Standards In our context, primary analytic considerations are the definition of subgroups, treatment effect scale, the model for sharing information across subgroups, and prior parameters. We preselected our subgroups to be consistent with the subgroups analyzed in the original SOLVD (1991) paper.23 We studied 2 main types of treatment effects: relative risk and risk difference. These choices were dictated by the methodological aims of the project. We selected the model choice and prior distributions to simplify the demonstration of methodology. The demonstration in Aim 1b for the beanz software and the case study for Aim 2 were aimed mainly at demonstrating the methodology and software. Hence, methodological standards such as pre‐specification of an analysis plan are not directly relevant here.
Future Directions There are 3 main areas into which our methods can be fruitfully extended:
1. The Bayesian HTE methods for observational studies(e.g., electronic health records).
32
2. Bayesian HTE methods for pragmatic trials and/or device and procedure trials in which variations in provider‐level characteristics and other treatment‐related factors are major sources of HTE. Here additional sources of HTE—, provider—may need to be included as another level of the hierarchy in the Bayesian models.
3. Bayesian HTE methods for individualized treatment effect estimation. We have made great progress in this area because of the project detailed in this report. We have nearly completed a powerful and flexible methodology for answering a wide array of questions in individualized treatment decision making.
Conclusions The Bayesian approach offers both an effective and practical framework for evaluating differences in treatment effectiveness due to heterogeneity in patient characteristics. Bayesian methods have particular advantages in the analysis of HTE as they provide a flexible framework for synthesizing all types of evidence, such as prior information or information across subgroups. Despite these merits, several factors have limited wider adoption of Bayesian methods, including lack of accessible software and concerns about the choice and impact of priors. We have addressed these challenges by developing specific models that can be used to examine HTE and by addressing the important issues involved in their implementation, such as prior specification, model checking, and sensitivity analyses, in our guidance. We have also demonstrated these ideas using a case study and a software tool called beanz, which can be used as a web server version with a user‐friendly GUI or as a stand‐alone R package. In summary, our PCORI project has accomplished the goal of facilitating the use of Bayesian methods for HTE analysis by lowering the barriers to their implementation in a two‐fold manner: by providing a freely available user‐friendly software with detailed documentation, and by producing a rigorous guidance document with a detailed case study using real clinical trial data.

33
References
1. Henderson N, Louis TA, Wang C, Varadhan R. Bayesian analysis of heterogeneous treatment effects for patient‐centered outcomes research. Health Serv Outcomes Res Methodol. 2016;(16):216‐233.
2. Wang C, Louis TA, Henderson N, Weiss CO, Varadhan R. beanz: an R package for Bayesian analysis of heterogeneous treatment effect with graphical user interface. J Stat Softw. I n press.
3. Lesko CR, Henderson NC, Varadhan R. Considerations when assessing heterogeneity of treatment effect in patient‐centered outcomes research. In final revision of peer review.
4. Varadhan R, Wang SJ. Standardization for subgroup analysis in randomized controlled trials. J. Biopharm Stat. 2014;(24): 154‐167.
5. Berry DA. Subgroup analyses. Biometrics. 1990;(46):1227‐1230.
6. Efron B. Large‐Scale Inference: Empirical Bayes Methods for Estimation, Testing, and Prediction. Vol 1. Institute of Mathematical Statistics Monographs. Cambridge University Press; 2010.
7. Spiegelhalter DJ, Myles JP, Jones DR and Abrams KR. Bayesian methods in health technology assessment: a review. Health Technol Assess. 2000;(4): 1‐130.
8. Carlin BP, Louis TA. Bayesian Methods for Data Analysis. Boca Raton, FL: Chapman & Hall/CRC; 2008.
9. Goodman S, Gatsonis C. BaSiS: Bayesian standards in science. www.stat.cmu.edu/bayesworkshop/2001/BaSis.html. Published September 13, 2001. Accessed March 11, 2013.
10. Food and Drug Administration. Guidance for Industry and FDA Staff: Guidance for the Use of Bayesian Statistics in Medical Device Clinical Trials. Rockville, MD: US Department of Health and Human Services; February 5, 2010.
11. Sung L, Hayden J, Greenberg ML, Koren G, Feldman BM, Tomlinson GA. Seven items were identified for inclusion when reporting a Bayesian analysis of a clinical study. J Clin Epidemiol. 2005;(58):261‐268.
12. European Medicines Agency. Guideline on the investigation of subgroups in 13 confirmatory clinical trials. Available at: http://www.ema.europa.eu/docs/en_GB/document_library/Scientific_guideline/2014/02/WC500160523.pdf. Published 2014.
13. Vandenbroucke JP, von Elm E, Altman DG, et al. Strengthening the Reporting of Observational Studies in Epidemiology (STROBE): explanation and elaboration. PLoS Med. 2007;4(10):e297.
14. Knol MJ, VanderWeele TJ. Recommendations for presenting analyses of effect modification and interaction. Int J Epidemiol. 2012;(41):514‐520.

34
15. Berrington de González A, Cox DR. Interpretation of interaction: a review. Ann Appl Stats. 2007;(1):371‐385.
16. VanderWeele TJ. Sample size and power calculations for additive interactions. Epidemiol Methods. 2012;(1). doi:10.1515/2161‐962X.1010
17. Dixon D, Simon R. Bayesian subset analysis. Biometrics. 1991;(47):871‐881.
18. Jones HE, Ohlssen DI, Neuenschwander B, Racine A, Branson M. Bayesian models for subgroup analysis in clinical trials. Clin Trials. 2011;(8):129‐143.
19. Geisser S. Predictive Inference: An Introduction. New York, NY: Chapman & Hall; 1993.
20. Spiegelhalter DJ, Best NG, Carlin BP, Van Der Linde A. Bayesian measures of model complexity and fit. J R Stat Soc Series B Stat Method. 2002;(64):583‐639.
21. Rubin, D.B. Bayesianly justifiable and relevant frequency calculations for the applied statistician. Ann Stat. 1984;(12):1151‐1172.
22. Gelman A. A Bayesian formulation of exploratory data analysis and goodness‐of‐fit testing. Int Stat Rev. 2003;71(2):369‐382.
23. The SOLVD Investigators. Effect of enalapril on survival in patients with reduced left ventricular ejection fraction and congestive heart failure. N Engl J Med. 1991;325(5):293‐302.
24. Gail M, Simon R. Testing for qualitative interactions between treatment effects and patient subsets. Biometrics. 1985; (2):361‐72.

35
Appendix: Abstracts of articles based on this PCORI‐funded research
beanz: An R Package for Bayesian Analysis of Heterogeneous Treatment Effect With Graphical User Interface Chenguang Wang,1 Thomas A. Louis,1 Nicholas Henderson,1 Carlos O. Weiss,2 Ravi Varadhan1
1Johns Hopkins University, Baltimore, Maryland 2Mercy Health Physician Partners, Grand Rapids, Michigan Citation: Wang, C. Louis TA, Henderson NC., Weiss CO, Varadhan R Louis, T.A., beanz: An R Package for Bayesian Analysis of Heterogeneous Treatment Effects with a Graphical User Interface. J STAT SOFTW (2018) 85: 7. DOI: 10.18637/jss.v085.i07.
In patient‐centered outcomes research, it is essential to assess the heterogeneity of treatment effect (HTE) when making health care decisions for an individual patient or a group of patients. Nevertheless, it remains challenging to evaluate HTE based on information collected from clinical studies that are often designed and conducted to evaluate the efficacy of a treatment for the overall population. The Bayesian framework offers a principled and flexible approach to estimate and compare treatment effects across subgroups of patients defined by their characteristics. In this paper, we describe the package beanz, which facilitates the conduct of Bayesian analysis of HTE by allowing users to explore a wide range of Bayesian HTE analysis models and produce posterior inferences about HTE. The package beanz also provides a web‐based graphical user interface (GUI) for users to conduct the Bayesian analysis of HTE in an interactive and user‐friendly manner. With the GUI feature, beanz can also be used by analysts not familiar with the R environment. We demonstrate beanz using data from a randomized controlled trial on angiotensin‐converting enzyme inhibitor for treating congestive heart failure (N = 2569).
36
Bayesian Analysis of Heterogeneous Treatment Effects for Patient‐centered Outcomes Research Nicholas C. Henderson,1 Thomas A. Louis,2 Chenguang Wang,1 Ravi Varadhan1 1 Sidney Kimmel Comprehensive Cancer Center, Johns Hopkins University, Baltimore, Maryland 2 Department of Biostatistics, Johns Hopkins Bloomberg School of Public Health, Baltimore, Maryland Citation: Henderson, N.C., Louis, T.A., Wang, C. et al. Bayesian analysis of heterogeneous treatment effects for patient‐centered outcomes research. Health Serv Outcomes Res Method (2016) 16: 213. DOI: 10.1007/s10742‐016‐0159‐3
Evaluation of heterogeneity of treatment effect (HTE) is an essential aspect of personalized medicine and patient‐centered outcomes research. Our goal in this article is to promote the use of Bayesian methods for subgroup analysis and to lower the barriers to their implementation by describing the ways in which the companion software beanz can facilitate these types of analyses. To advance this goal, we describe several key Bayesian models for investigating HTE and outline the ways in which they are well‐suited to address many of the commonly cited challenges in the study of HTE. Topics highlighted include shrinkage estimation, model choice, sensitivity analysis, and posterior predictive checking. We present a case study in which we demonstrate the use of the methods discussed.
37
Considerations When Assessing Heterogeneity of Treatment Effect in Patient‐centered Outcomes Research Catherine R. Lesko,a Nicholas C. Henderson,b Ravi Varadhanb a Department of Epidemiology, Johns Hopkins Bloomberg School of Public Health, Baltimore, Maryland, [email protected] b Division of Biostatistics and Bioinformatics, Sidney Kimmel Comprehensive Cancer Center, Johns Hopkins University, Baltimore, Maryland, [email protected] Citation: Lesko L, Henderson N, Varadhan. Considerations when assessing heterogeneity of treatment effect in patient‐centered outcomes research. J Clin Epidemiol. 2018 Apr 11. pii: S0895‐4356(17)30109‐9. DOI: 10.1016/j.jclinepi.2018.04.005.
When baseline risk of an outcome varies within a population, the effect of a treatment on that outcome will vary on at least 1 scale (e.g., additive, multiplicative). This treatment effect heterogeneity is of interest in patient‐centered outcomes research. Based on a literature review and solicited expert opinion, we assert the following: (1) Treatment effect heterogeneity on the additive scale is most interpretable to health care providers and patients using effect estimates to guide treatment decision making; heterogeneity reported on the multiplicative scale may be misleading regarding the magnitude or direction of a substantively important interaction. (2) The additive scale may give clues about sufficient‐cause interaction, although such interaction is typically not relevant to patients’ treatment choices. (3) Statistical modeling need not be conducted on the same scale as results are communicated. (4) Statistical testing is one tool for investigations, provided important subgroups are identified a priori, but test results should be interpreted cautiously given nonequivalence of statistical and clinical significance. (5) Qualitative interactions should be evaluated in a prespecified manner for important subgroups. Principled analytic plans that take into account the purpose of investigation of treatment effect heterogeneity are likely to yield more useful results for guiding treatment decisions.

38
Copyright© 2018 John Hopkins University. All Rights Reserved.
Disclaimer:
The [views, statements, opinions] presented in this report are solely the responsibility of the author(s) and do not necessarily represent the views of the Patient‐Centered Outcomes Research Institute® (PCORI®), its Board of Governors or Methodology Committee.
Acknowledgement:
Research reported in this report was [partially] funded through a Patient‐Centered Outcomes Research Institute® (PCORI®) Award (ME‐1303‐5896). Further information available at: https://www.pcori.org/research‐results/2013/developing‐software‐using‐bayesian‐regression‐evaluate‐heterogeneity‐treatment