developing reports for telco analytics manager 4 - oracle · how the qra works with the web channel...
TRANSCRIPT

Developing Reports withTelco Analytics Manager
V4.0 Document ID: TAGN-05-4.0-01
Date Published: 9.10.03

1997−2003 edocs Inc. All rights reserved.
edocs, Inc., One Apple Hill Drive, Suite 301, Natick, MA 01760
The information contained in this document is the confidential and proprietary information of edocs, Inc. and is subject to change without notice.
This material is protected by U.S. and international copyright laws. edocs and eaPost are registered in the U.S. Patent and Trademark Office.
No part of this publication may be reproduced or transmitted in any form or by any means without the prior written permission of edocs, Inc.
eaSuite, eaDirect, eaPay, eaAssist, eaMarket, and eaXchange are trademarks of edocs, Inc.
Sun, Sun Microsystems, Solaris, Sun-Netscape Alliance, iPlanet, Java and JavaScript are trademarks or registered trademarks of Sun Microsystems, Inc. in the United States and other countries. All SPARC trademarks are used under license and are trademarks or registered trademarks of SPARC International, Inc. in the United States and other countries. Products bearing SPARC trademarks are based upon an architecture developed by Sun Microsystems, Inc.
Netscape, Netscape Enterprise Server, Netscape Navigator, Netscape® Application Server and the Netscape N and Ship's Wheel logos are registered trademarks of Netscape Communications Corporation in the United States and other countries.
Microsoft, Windows, WindowsNT, Windows 2000, SQL Server and Microsoft Internet Information Server are registered trademarks of Microsoft Corporation in the United States and other countries.
Oracle, Oracle8, Oracle8i are registered trademarks of Oracle Corporation in the United States and other countries.
Adobe, Acrobat, and the Acrobat logo are trademarks of Adobe Systems Incorporated.
This product includes software developed by the Apache Software Foundation (http://www.apache.org/).
Contains IBM Runtime Environment for AIX(R), Java(TM) 2 Technology Edition Runtime Modules (c) Copyright IBM Corporation 1999, 2000 All Rights Reserved.
This software contains Log4j Copyright (c) 1999 The Apache Software Foundation All Rights Reserved.
This software contains Jakarta-ORO regular expressions processing Copyright (c) 2000 The Apache Software Foundation All Rights Reserved.
This software contains Sun Multi-Schema XML Validator Copyright (c) 2001 Sun Microsystems All Rights Reserved.
All other product names and registered trademarks are the property of their respective holders. Any trademark name appearing in this guide is used for editorial purposes only, and to the benefit of the trademark owner, with no intention of infringing upon the trademark.
Federal Acquisitions: Commercial Software - Government users subject to standard license terms and conditions.
Preface
In This Section
Using this Manual ................................................................... iv Finding the Information You Need .......................................... viii If You Need Help ................................................................... x

iv Developing Reports
Using this Manual Welcome to Developing Reports.
This manual covers using the Query, Reporting, and Anaysis Engine (QRA) to easily and quickly build reports based on data stored in the CBU.
Before You Get Started You should be familiar with the following:
! Your application architecture ! The CBU ! Designing or working with databases and data warehouses ! SQL
Who Should Read this Manual This manual is for developers and project managers who are responsible for developing the user interface.
However, there are other topics covered in this manual that may interest other members of the project development team.
! Administrators You will find information about the different components that make up the user interface. You can learn the location of the different files which make up the user interface.
! Developers This manual is for building user interfaces for your solution. You learn how write JSPs that use the Presentation Manager JavaServer Page framework. You also learn how to group and program sets of JSPs. These sets, called channels, allow users to access the same solution by using different devices and protocols.
You also learn how to use the framework to create new workflows, customize menus, and manage personalization information to create interactive and customizable user interfaces.
! Project Architect You can use the information in this manual to learn about channels and how they work. You can lean about the components and the flexibility of you solution when it is based on channels built on a common framework.
Preface v
! Project Manager You will find information about channels and the Presentation Manager JavaServer Page framework important when developing user interfaces. You may also be interest in reading about personalization data, menus and workflows as the their characteristics may influence how you go about developing the user interfaces of your solution.
How this Manual is Organized This manual contains the following chapters:
! Overview of Developing Reports This chapter covers the basics of the Query,Reporting, and Analysis (QRA) Engine.
It contains information about:
! The QRA
! How the QRA works with the Web Channel
! Developing Reports
! Defining Reports This chapter covers creating the report definition file.
It contains information about:
! Creating the file
! Declaring the file
! Creating Data Providers
This chapter covers creating and developing data providers. These components of your report are responsible for extracting the data for reports.
It contains information about:
! Creating the Data Provider in the report definition file
! Writing the SQL to obtain the data
! Specifying the Mapping of returned data
! Creating Data Provider Prompts This chapter covers creating and developing Prompts.
It contains information about:
! Creating Prompts
! Creating Prompt Blocks

vi Developing Reports
! Creating Tabular Data Transformers This chapter covers creating and developing Tabular Data Transformers. These components of your report are responsible for formatting the data obtained from Data Providers in tables.
It contains information about:
! Creating the Data Transformer in the report definition file
! Creating Master Detail tables
! Creating Aggregates
! Specifying Display Formats
! Creating Filters
! Creating Prompt Blocks
! Specifying sorts
! Creating Matrix Data Transformers This chapter covers creating and developing Matrix Data Transformers.
It contains information about:
! Differences between Tabular and Matrix Data Transformers
! Working with dimensions
! Working with measures
! Creating Charts This chapter covers creating charts in your transformers.
It contains information about:
! Creating the chart in the Transformer
! Specifying the Styles
! Specifying the Data Set
! Specifying the Axes
! Working with Reports This chapter covers working with reports.
It contains information about:
! Specifying the layout of elements
! Localizing

Preface vii
! Customizing
! Reloading reports
! Chart Style Reference This appendix is a Chart Style reference. It covers the different styles of the various charts.
It contains information about:
! General Chart Properties
! Specific properties for each type of chart
What Typographical Changes and Symbols Mean This manual uses the following conventions:
TYPEFACE MEANING EXAMPLE
Italics Manuals, topics or other important items
Refer to Developing Connectors.
Small Capitals Software and Component names
Your application uses a database called the CID.
Fixed Width File names, commands, paths, and on screen commands
Go to //home/my file

viii Developing Reports
Finding the Information You Need edocs Telco Solutions comes with comprehensive documentation that covers all aspects of building TAM solutions. You should always read the release bulletin for late-breaking information.
Getting Started
If you are new to edocs Telco Solutions, you should start by reading Introducing Telco Analytics Manager. This manual contains an overview of the various components along with a list of the available features. It introduces various concepts and components you must be familiar with before moving on to more specific documentation. Once you have finished, you can read the manual that covers different aspects of working with the application. At the beginning of each manual, you will find an introductory chapter that covers concepts and tasks.
Designing Your Solution
While reading Introducing Telco Analytics Manager, you can begin to envision how the different components can address your solution's needs.
You can refer to Developing Analytical Applications for information about customizing the database, synchronizing data with Telco Service Manager (TSM), loading data from external invoice files, and other design issues. The CBU Reference Guide also gives you the information about how the information in your solution is managed and stored. You should also read the section on integrating Telco Analytics Manager with Telco Service Manager in Developing Analytical Applications.
Installing Your Analytical Application
You should start by reading the Release Bulletin. For detailed installation and configuring information, refer to Installing Telco Analytics Manager. This manual covers installing Telco Analytics Manager on one or more computers. It also contains the information you need to configure the different components you install.
Building Analytical Solutions
If you are designing and programming analytical applications, you have several different sources of information. If you are programming the user interface of the solution, you should read Building Reports. You can also refer to the QRA API Specification and the QRA Configuration File Reference Documentation for detailed information about the different components you can use to build reports which serve as the user interface. For configuring the various components, refer to Installing Telco Analytics Manager and sections in other documents that specifically deal with the component to be configured.

Preface ix
If you are working on the data warehouse side of TAM and are interested in how the information will be loaded into the data warehouse, you should read Developing Analytical Applications. For more information about the design and structure of the CBU, you should refer to the CBU Reference Guide along with the CBU Reference documentation for your database.
Integrating TAM and TSM
If you are involved in configuring your solution to work with Telco Service Manager, you should read Introducing Telco Analytics Manager for an overview of the components and how they interact. You should then read Developing Analytical Applications for information about synchronizing data between the Telco Analytics Manager and Telco Service Manager. In this manual, you will also find information about loading data in both the CBU and the Telco Service Manager.
Managing Telco Analytics Manager
If you are responsible for managing Telco Analytics Manager, you should read the Installing Telco Analytics Manager for information about configuring various components. Administrating Telco Analytics Manager covers what you need to know about managing your solution at runtime.

x Developing Reports
If You Need Help Technical support is available to customers who have valid maintenance and support contracts with edocs. Technical support engineers can help you install, configure, and maintain your edocs application.
To reach the U.S. Service Center, located in Natick, MA (Monday through Friday 8:00am to 8:00pm EST):
! Telephone: 508.652.8400 ! Toll Free: 877.336.3362 ! E-support: support.edocs.com (This requires a one-time online registration) ! E-mail: [email protected]
When you report a problem, please be prepared to provide us the following information:
! What is your name and role in your organization? ! What is your company�s name? ! What is your phone number and best times to call you? ! What is your e-mail address? ! In which edocs product did a problem occur? ! What is your Operating System version? ! What were you doing when the problem occurred? ! How did the system respond to the error? ! If the system generated a screen message, please send us that screen message. ! If the system wrote information to a log file, please send us that log file.
If the system crashed or hung, please tell us.

xi
Contents
Preface iii
Overview of Developing Reports 15 About the QRA 16 About the QRA and the MyWeb Channel 17 Overview of Developing Reports 19
Defining Reports 21 About Defining Reports 22 Creating the Report Definition File 23 Declaring Your Report 24
Creating Data Providers 27 About Creating Data Providers 28 Example of a Data Provider 29 Creating the DataProvider Element 31
To create the DataProvider Element 31 Specifying the Data Source of the Data Provider 33 Writing the SQL Statement 35
About Writing SQL Statements for Reports 35 Entering the SQL Statement 36 Setting the Prompts in the SQL Statement 37
Specify the Mapping of Returned Columns 40 Specifying the DataProvider Prompt 42
Creating Data Provider Prompts 43 About Creating Data Provider Prompts 44 Specifying System Prompts 45 Specifying Interactive Prompts 47
Input Prompts 47 Choice Prompts 49 Cascaded Prompts 55 Prompt Constraints 56
Creating Data Provider PromptBlocks 58 Prompt Block Rendering 59
Interactive Prompt Blocks 59 Prompt Value Blocks 61

xii Developing Reports
Creating Tabular Data Transformers 63 About Tabular Data Transformers 64 Creating the TabularDataTransformer Element 65
Defining the Number of Rows per Page 66 Defining the Layout 68
Creating the Detail Element 69 Specifying the Columns 69 Specifying Display Formats 70
Creating Master Detail Columns 76 Master Value Block 80 Master Aggregates Block 81
Creating Aggregations 82 About Aggregations 82 Example of Aggregations 83
Specifying Display Formats 85 Value Format 85 Value Style 86 Row Style 86 Value Image 87 Value Report Links 87
Creating Filters 89 To specify a single value filter 90 To specify a multiple value filter 90 Example of a Filter 91 Filter Block 92 Custom Filters 93
Creating PromptBlocks 95 Specifying Sorts 96
Specifying the Default Column Sort 96 Specifying Interactive Sorting 97 Sort Block 99
Exporting Data 100 Exporting as XML 100 Exporting as CSV 102
Creating Matrix Data Transformers 105 About Matrix Data Transformers 106 Differences Between Matrix and Tabular Data Transformers 107 Working with Dimensions 108
Examples of Row Dimensions Areas 108 Column Dimension Area 109
Working with Measures 110 Examples of Measure Areas 110
Examples 111
Creating Charts 115 About Creating Charts 116 Creating the Chart Element 117
To create the chart element 117

Preface xiii
Specifying the Chart Styles 119 Specifying the Chart Data Set 121
Example of a Chart Data Set 121 Specifying the Axes 123 Sample Charts 124
Pie Chart 124 Line 124 Vertical Bar Chart 125 Horizontal Bar Chart 125 Combined Bar and Line Chart 126 2 Dimension Column 127 Vertical Column Bar Chart 128 Stacked Horizontal Bar Chart 128 Chart Navigation Block 129
Working with Reports 131 About Working with Reports 132 Specifying the Layout 133
MonoTransformer Report Templates 133 MultiTransformer Report Templates 139 Printer Friendly 141
Localizing Reports 143 Customizing Reports 145
Customizing the Report View JSP 145 Adding Properties to Report Elements 145
Reloading Reports 147
Chart Style Reference 149 General Properties 150
Generated Image Properties 150 General Chart Properties 150 Axis Properties 152 Dataset Properties 154
Specific Chart Properties 156 line and labelLine Chart Properties 156 bar, column, stackBar, stackColumn Chart Properties 156 pie Chart Properties 157 speedo Chart Properties 158 barArea Chart Properties 158 barLine Chart Properties 159
Index 161


C H A P T E R 1
Overview of Developing Reports
In This Section
About the QRA........................................................................ 16 About the QRA and the MyWeb Channel ............................... 17 Overview of Developing Reports ............................................ 19
16 Developing Reports
About the QRA The Query, Reporting and Analysis Engine (QRA) provide a secure, standard approach to retrieving analysis data from the Communications Billing and Usage (CBU) database.
Data Providers are data source components. Data Providers separate reports from the physical data repository, guaranteeing secure access, and allowing new reports to be designed and used without the need to understand the technical definition of the relevant CBU schema. For Report Processors within the Personalization Manager, Data Providers are effectively the source of analysis data.
Any number of Data Providers can be defined through XML Report Definition schemas. Each Data Provider retrieves specific fields of analysis data from the CBU, constrained by any filters (Prompts) specified within the Data Provider definition, and also by the security restrictions of the user requesting the report. This ensures that regardless of the scope of a particular report, the user cannot gain access to information unless they have the security rights to view it. If the user�s security rights are changed, they are updated through Notifications.
Data Providers can be used to query any RDBMS schema under one of supported RDBMS.
Data Transformers are used to structure the report allowing to filter, sort, drill, show alerter, design chart, design tabular, design matrix, and so on. Data Providers are used as a source of Data Transformers allowing new reports to be designed and used without the need to understand the technical definition of the relevant CBU schema.
The QRA also comes with a set of JSPs which serve as the default HTML renderer. These JSPs handle transforming the extracted and formatted information into HTML. They are designed to handle almost all of you needs with little or no modification.

Overview of Developing Reports 17
About the QRA and the MyWeb Channel
When you install the Analytical Application, you also install several components that enhance the MyWeb Account Management Application.
A report HTML viewer is delivered with this version. It consists of several JSPs and page flows which allow the end user to interact with the report. A chart engine is delivered for the channel web.
The enhancements include:
1 A set of sample reports.
2 An enriched MyWeb.xml for the reports.
3 New channel JSPs
! report_list.jsp to list the reports
! listReports.jsp form_handler to set the report code prefix for each list of reports.
! report_view.jsp to display the report
! report_helper.jsp the report helper jsp which includes all the rendering method to produce the accurate HTML
18 Developing Reports
These channel JSPs make up the HTML renderer. They support several types of reports:
! Simple report ! Master/detail report ! Data+chart report ! Data+Multi chart report ! Master/Summary/Detail report ! Dashboard report ! Tabbed report
The HTML renderer allows the user to:
! Select a report ! Refresh data providers filling prompts ! Filters data treated by data transformers ! Sorts data transformers ! Drill down to another report through hyperlinks ! Navigate through the pages of a data transformers ! View each block of a tabbed report via the tabbed transformer bar ! View each hidden charts of a data transformer via the chart navigation bar ! Get a printer friendly view of the report ! Save the report as personal for future consultation

Overview of Developing Reports 19
Overview of Developing Reports Creating a Report involves:
1 Creating the Report Definition file
This XML file contains all the information your application needs to create a report.
2 Creating Data Providers
In the Report Definition file, you declare a Data Provider. A Data Provider is the component which is responsible for connecting to a database and retrieving information.
3 Creating Prompts
In the declaration of the Data Provider, you create interactive prompts. Interactive prompts allow users to select the information they want to see in their reports.
4 Creating Data Transformers
In the Report Definition file, you declare one or more Data Transformer for each Data Provider. A Data Transformer is responsible for formatting the data for display. Once you obtain information from a specific Data Provider, you usually need to reformat it to fit your reports. You can also create prompts in a data transformer to allow users to select the information they want to see.
! Creating Charts Charts is one of the ways you can format data obtained by Data Providers. Specified as part of your Data Transformer, charts can be a fundamental part of your reports.
! Configuring and Customizing the Reports After completing the development of the report components, you can specify some of the more general aspects of your report.

C H A P T E R 2
Defining Reports
In This Section
About Defining Reports........................................................... 22 Creating the Report Definition File.......................................... 23 Declaring Your Report ............................................................ 24
22 Developing Reports
About Defining Reports The QRA uses XML files to define reports. These files are referred to as Report Definition files and they contain all the information your Telco Analytics Manager needs to access information and build reports.
Report Definition files are located in <home_dir>/channels/WEB-INF/classes/nmycfg/qra.
These files are based on the report.xsd Report Definition Schema.
Defining Reports involves:
! Creating the Report Definition file ! Declaring the Report Definition file in the list of available reports
One way of becoming familiar with the QRA is to try all of the sample reports and open the report definition files to see what is in them. You can then copy and modify the Report Definition file to try out your own reports.
Your XML editor can also use the Report Definition Schema to validate your Report Definition files.
The schema documentation is also on the CD-ROM. To view the documentation, open Documentation.html and go to the Analytical Applications section.
The QRA API documentation can also be viewed from this page.

Defining Reports 23
Creating the Report Definition File You can create a Report Definition file from scratch or you can create a copy of one of the existing report definition files in <home_dir>/WEB-INF/classes/nmycfg/qra.
The file name must be unique and cannot contain any spaces.
You can define one or several reports in the same XML definition file.
After you create your Report Definition file, you:
! Declare the Report ! Create the elements
To create a Report Definition File
1 Go to <home_dir>/WEB-INF/classes/nmycfg/qra.
2 Do one of the following:
! Copy and rename one of the existing Report Definition files.
! Use your XML editor to create a new file based on the the report.xsd Report Definition Schema.

24 Developing Reports
Declaring Your Report The QRA has a properties file which lists the available reports. The reports declared in this file are loaded in memory when your application starts.
The reportelements.properties configuration file lists the reports. This file is located in <home_dir>/channels/WEB-INF/classes/nmycfg/qra.
The syntax of the declaration is:
nmycfg.qra.Report_Name.xml
where:
! nmycfg.qra is the java pathname ! Report_Name.xml is the Report Definition file
An example of a report properties file: # ===========================================================================
nmycfg.qra.GlobalPrompts.xml
nmycfg.qra.ContractDetailedCalls.xml
nmycfg.qra.ContractInvoiceOverview.xml
nmycfg.qra.InvoiceOverview.xml
nmycfg.qra.TotalFeePerCostCenter.xml
nmycfg.qra.MostExpensiveCalls.xml
nmycfg.qra.CallAnalysisDashboard.xml
nmycfg.qra.TotalCostPerTariff.xml
nmycfg.qra.CostCenterAnalysisDashboard.xml
# ==================================================================
You can group reports in directories. You just need to make sure that the name of the report definition file is entered correctly.
For instance, you could have
nmycfg.qra.invoices.<report1_name>.xml
...
nmycfg.qra.costcenter.<report1_name>.xml
...

Defining Reports 25
To declare the Report Definition file
1 Go to <home_dir>/WEB-INF/classes/nmycfg/qra.
2 Open the reportelements.properties configuration file.
3 Enter the name of the Report Definition file. Use the syntax: nmycfg.qra.myreportname.xml

C H A P T E R 3
Creating Data Providers
A Data Provider is the component which obtains data for reports. The data provider is responsible for:
! Accessing the database ! Specifying the query ! Setting the maximum number of rows returned ! Setting the timeout ! Specifying the SQL statement
A report element contains one or more Data Providers.
In This Section
About Creating Data Providers .............................................. 28 Example of a Data Provider.................................................... 29 Creating the DataProvider Element ........................................ 31 Specifying the Data Source of the Data Provider ................... 33 Writing the SQL Statement ..................................................... 35 Specify the Mapping of Returned Columns ............................ 40 Specifying the DataProvider Prompt....................................... 42

28 Developing Reports
About Creating Data Providers Data Providers are key components of the QRA. Data Providers separate reports from the physical data repository, guaranteeing secure access, and allowing new reports to be designed and used without the need to understand the technical definition of the relevant schema. For Report Processors, Data Providers are the source of analysis data.
The Data Provider does the following:
! Accesses the database ! Executes the query ! Makes the data available to the data transformer
Creating Data Providers involves:
! Setting the data source ! Creating the Data Provider in the report definition file ! Specifying the data source ! Setting the maximum number of rows returned ! Setting the query timeout ! Specifying the SQL statement
A report element file contains one or more Data Providers.
For more information about the structure and syntax of the XML, refer to the QRA Configuration File Reference Documentation.

Creating Data Providers 29
Example of a Data Provider The following report definition has an SQL Statement with 2 prompts and where the first SQL prompt is mapped to the prompt USER_LOGIN and the second SQL prompt is mapped to prompt PCCKEY
The root tag of the Data Provider. It specifies:
- Code
- maximum number of rows returned
- timeout
<TabularDataProvider code="TotalFeePerCostCenter" maxRows="1000" timeout="100">
The tag for the data source
<DalQuery instanceName="cbu_database">
The SQL Statement <
30 Developing Reports
The SQL Statement
(continued)
AND ( cc_lnk.CHILD_CC_KEY = child.COST_CENTER_KEY )
AND ( ccc.COST_CENTER_KEY = cc_lnk.CHILD_CC_KEY )
AND ( ccc.CONTRACT_KEY = contract.CONTRACT_KEY )
AND ( contract.CONTRACT_KEY = budr.CONTRACT_KEY )
AND ( budr.START_DATE_KEY = d.DATE_KEY )
GROUP BY
RANK_FROM_PARENT,
COST_CENTER_PATH,
COST_CENTER_NAME
ORDER BY
RANK_FROM_PARENT ASC
]]></DalQuery>
The column mapping of returned data
<Columns>
<Column code="RANK_FROM_PARENT" name="rank" type="java.lang.Long"/>
<Column code="COST_CENTER_PATH" name="Cost Center" type="java.lang.String"/>
<Column code="COST_CENTER_NAME" name="name" type="java.lang.String"/>
<Column code="N_CONTRACTS" name="#Contracts" type="java.lang.Long"/>
<Column code="N_CALLS" name="#Calls" type="java.lang.Long"/>
<Column code="S_FEE" name="Total Fee" type="java.lang.Double"/>
</Columns>
The prompt bindings
(in the order they appear in the SQL)
<PromptBindings>
<PromptBinding prompt="USER_LOGIN"/>
<PromptBinding prompt="PCCKEY"/>
</PromptBindings>
The end tag of the root tag.
</TabularDataProvider>
Creating Data Providers 31
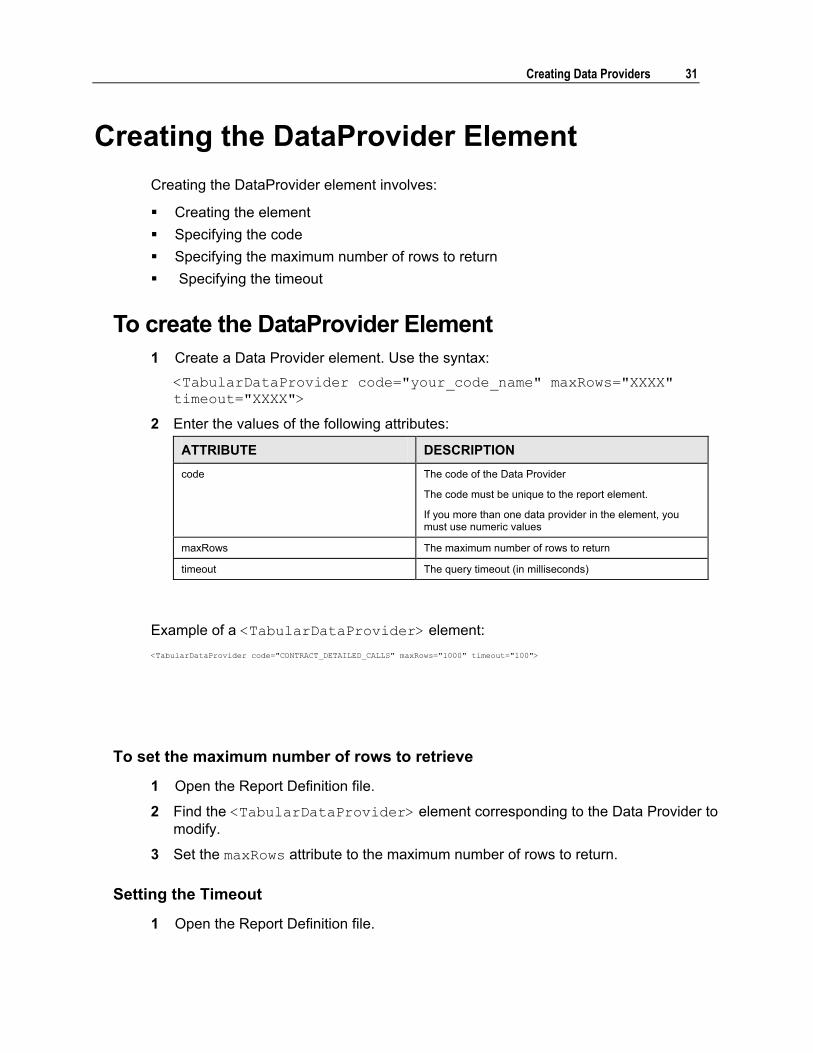
Creating the DataProvider Element Creating the DataProvider element involves:
! Creating the element ! Specifying the code ! Specifying the maximum number of rows to return ! Specifying the timeout
To create the DataProvider Element 1 Create a Data Provider element. Use the syntax:
<TabularDataProvider code="your_code_name" maxRows="XXXX" timeout="XXXX">
2 Enter the values of the following attributes:
ATTRIBUTE DESCRIPTION code The code of the Data Provider
The code must be unique to the report element.
If you more than one data provider in the element, you must use numeric values
maxRows The maximum number of rows to return
timeout The query timeout (in milliseconds)
Example of a <TabularDataProvider> element: <TabularDataProvider code="CONTRACT_DETAILED_CALLS" maxRows="1000" timeout="100">
To set the maximum number of rows to retrieve
1 Open the Report Definition file.
2 Find the <TabularDataProvider> element corresponding to the Data Provider to modify.
3 Set the maxRows attribute to the maximum number of rows to return.
Setting the Timeout
1 Open the Report Definition file.

32 Developing Reports
2 Find the <TabularDataProvider> element corresponding to the Data Provider to modify.
3 Set the timeout attribute to the amount of time to wait for a query.

Creating Data Providers 33
Specifying the Data Source of the Data Provider
You need to specify the data source for the DataProvider.
When you specify the data source, the DataProvider knows where to execute the SQL script it uses to retrieve data.
By default, the following data sources are available:
INSTANCE NAMES JDBC DATA SOURCES route_database cidDatasource
cbu_database cbuDatasource
If you need to access a database which is not among the default data sources, you need to create and configure new datasource with a new instance name.
Specifying the data source involves:
! Creating a new datasource if required ! Setting the Data Provider to use the data source
To set the data source
1 Open the Report Definition file.
2 Find the <TabularDataProvider> element corresponding to the Data Provider to modify.
3 Create a <DalQuery> element
4 Set the instanceName attribute of the <DalQuery> element to data source to use.
Example of a DalQuery element set to use the CBU. <TabularDataProvider code="ContractInvoiceOverview" maxRows="1000" timeout="100">
<DalQuery instanceName="cbu_database">
�
</TabularDataProvider>
To specify a new data source
1 Go to <home_dir>/channels/WEB-INF/classes/nmycfg/dal/instances.
2 Open instances.properties and add the name of your new data source. Use the syntax: new_database=nmycfg.dal.instances.new_instance

34 Developing Reports
Example of the data source declaration in instances.properties: route_database=nmycfg.dal.instances.instance_route
cbu_database=nmycfg.dal.instances.cbu_instance
new_database=nmycfg.dal.instances.new_instance
3 Create a new file called new_instance.properties by duplicating the cbu_instance.properties file.
4 Change the values of the instance_id and source_name.
! Open all the instance definition files and find the highest instance_id value used and increment it by one. Then set instance_id to this value.
! Set the source_name to jdbc/newDatasource.
5 Define the newDatasource data source in your application server
For more information about defining data sources, refer to your product documentation.
6 Set the data source of the DataProvider to newDatasource
Example of the DataProvider set to use the new data source: <TabularDataProvider code="ContractInvoiceOverview" maxRows="1000" timeout="100">
<DalQuery instanceName="new_database">
�
</TabularDataProvider>

Creating Data Providers 35
Writing the SQL Statement
About Writing SQL Statements for Reports You should use your SQL tool to create and test your SQL statement. This way you can take advantage of your tool's editing and testing features. When your SQL statement is ready, you place a copy of it in the report definition file.
You then edit the SQL Statement to program the prompts. A prompt is simply a place in the SQL statement where some kind of input is required to filter the results. The prompts in your SQL are associated with a PromptBinding which points to a DataProvider Prompt you build for user input.
You also need to define the mapping of the columns your SQL Statements return.
Writing SQL Statements involves:
! Copying your SQL statement in your report definition file ! Editing the prompts: ! Enter simple prompts
! Enter multiple value prompts
! Enter prompts for values which are ignored if NULL ! Mapping the columns returned by the SQL ! Specifying the DataProvider Prompt for each prompt
For more information about the structure of the CBU, refer to the CBU Reference Guide and the CBU Reference Documentation corresponding to your database.

36 Developing Reports
Entering the SQL Statement To write a simple query, you should use your SQL designer tool. After you have written and tested your SQL statement, copy it in the report definition file.
The SQL statements are in the <DalQuery> tags enclosed by <![CDATA[ and ]]>.
The format of SQL statements is:
<DalQuery instanceName="instance_name">
<![CDATA[
Your SQL
...
]]>
</DalQuery>
For editing and comprehension, your SQL statement can be several lines.
Example of a simple query: <DalQuery instanceName="cbu_database">
<![CDATA[
SELECT DISTINCT BILL_ACCT_BIZ, BILL_ACCT_NAME
FROM NMY_BILL_ACCT_DIM
ORDER BY BILL_ACCT_NAME ASC
]]>
</DalQuery>
Refer to the CBU section to help you build your SQL Statement.
Creating Data Providers 37
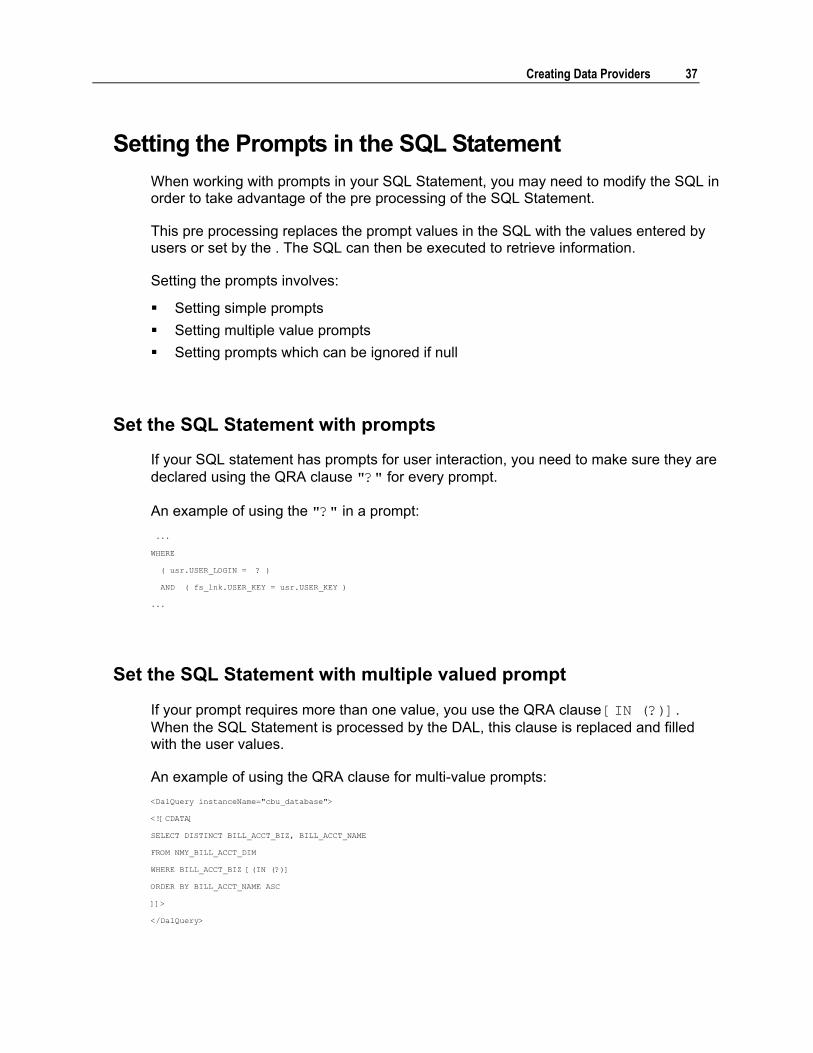
Setting the Prompts in the SQL Statement When working with prompts in your SQL Statement, you may need to modify the SQL in order to take advantage of the pre processing of the SQL Statement.
This pre processing replaces the prompt values in the SQL with the values entered by users or set by the . The SQL can then be executed to retrieve information.
Setting the prompts involves:
! Setting simple prompts ! Setting multiple value prompts ! Setting prompts which can be ignored if null
Set the SQL Statement with prompts
If your SQL statement has prompts for user interaction, you need to make sure they are declared using the QRA clause "?" for every prompt.
An example of using the "?" in a prompt: ...
WHERE
( usr.USER_LOGIN = ? )
AND ( fs_lnk.USER_KEY = usr.USER_KEY )
...
Set the SQL Statement with multiple valued prompt
If your prompt requires more than one value, you use the QRA clause [IN (?)]. When the SQL Statement is processed by the DAL, this clause is replaced and filled with the user values.
An example of using the QRA clause for multi-value prompts: <DalQuery instanceName="cbu_database">
<![CDATA[
SELECT DISTINCT BILL_ACCT_BIZ, BILL_ACCT_NAME
FROM NMY_BILL_ACCT_DIM
WHERE BILL_ACCT_BIZ [(IN (?)]
ORDER BY BILL_ACCT_NAME ASC
]]>
</DalQuery>

38 Developing Reports
If you activate the log and set it to the maximum debug level, the trace of the example is:
Data source <DEBUG_INFO>
<CONNECTION instance="nmycfg.dal.instances.cbu_instance"/>
Query definition before preprocessing
<STATEMENT name="*** DIRECT QUERY ***">
<PREQUERY> SELECT DISTINCT BILL_ACCT_BIZ, BILL_ACCT_NAME
FROM NMY_BILL_ACCT_DIM
WHERE BILL_ACCT_BIZ [(IN (?)]
ORDER BY BILL_ACCT_NAME ASC</PREQUERY>
Bindable parameter values
<PARAMETERS>
<param i="0" bindable="true" value="{'3', '4', }"/>
</PARAMETERS>
Executed query <QUERY>
SELECT DISTINCT BILL_ACCT_BIZ, BILL_ACCT_NAME
FROM NMY_BILL_ACCT_DIM
WHERE BILL_ACCT_BIZ in (:1,:2)
ORDER BY BILL_ACCT_NAME ASC</QUERY>
Closing </STATEMENT>
</DEBUG_INFO>
Set the SQL Statement with Prompts which can be ignored
You can also use QRA clauses ignore optional prompts when the user does not enter any information.
The IGNORE IF NULL clause along with the operator is for prompts where the user has a choice and does not enter any information. For instance, when the user does not enter a value for an Input prompt or does not select a value for a choice prompt.
The syntax of QRA IGNORE IF NULL clauses is:
ColumnName QRAClause
These prompts can be used in SQL where clauses.
The QRA Clauses you can use are:
QRA CLAUSE DESCRIPTION
[=? OR IGNORE IF NULL] To use when the column must be equal to a prompted value which can be null
[!=? OR IGNORE IF NULL] To use when the column must be different from a prompted value which can be null

Creating Data Providers 39
QRA CLAUSE DESCRIPTION [>=? OR IGNORE IF NULL] To use when the column must be greater than or equal to
a prompted value which can be null
[<=? OR IGNORE IF NULL] To use when the column must be less than or equal to a prompted value which can be null
[>? OR IGNORE IF NULL] To use when the column must be greater than to a prompted value which can be null
[<? OR IGNORE IF NULL] To use when the column must be less than a prompted value which can be null
[NOT IN (?) OR IGNORE IF NULL] To use when the column must not be equal to any of several prompted values which can be null
[IN (?) OR IGNORE IF NULL] To use when the column must be equal to one of several prompted values which can be null
[LIKE [? OR IGNOREALL IF NULL]] To use when the column must be like a prompted value which can be null
Note: This clause is IGNOREALL
For example, an IN operator along with the IGNORE IF NULL clause: <DalQuery instanceName="cbu_database">
<![CDATA[
SELECT DISTINCT BILL_ACCT_BIZ, BILL_ACCT_NAME
FROM NMY_BILL_ACCT_DIM
WHERE BILL_ACCT_BIZ [IN (?) OR IGNORE IF NULL]
ORDER BY BILL_ACCT_NAME ASC
]]>
</DalQuery>

40 Developing Reports
Specify the Mapping of Returned Columns
In the Data Provider, you must declare the type of each column of SELECT statements in your SQL Statement.
The syntax for declaring the mapping of returned columns to their type is:
<Column code="RETURNED_COLUMN" type="java_type"/>
where:
! RETURNED_COLUMN is the code name of the column
! java_type is the corresponding column type
The available java types are:
TYPE DESCRIPTION
java.lang.Boolean Use this type to map any Boolean SQL column type
java.lang.Double Use this type to map any Double or Float SQL column type
java.lang.Long Use this type to map any Integer or Long SQL column type
java.lang.String Use this type to map any VARCHAR, TEXT or similar SQL column type
java.sql.Date Use this type to map any Date SQL column type
java.sql.Time Use this type to map any Time SQL column type
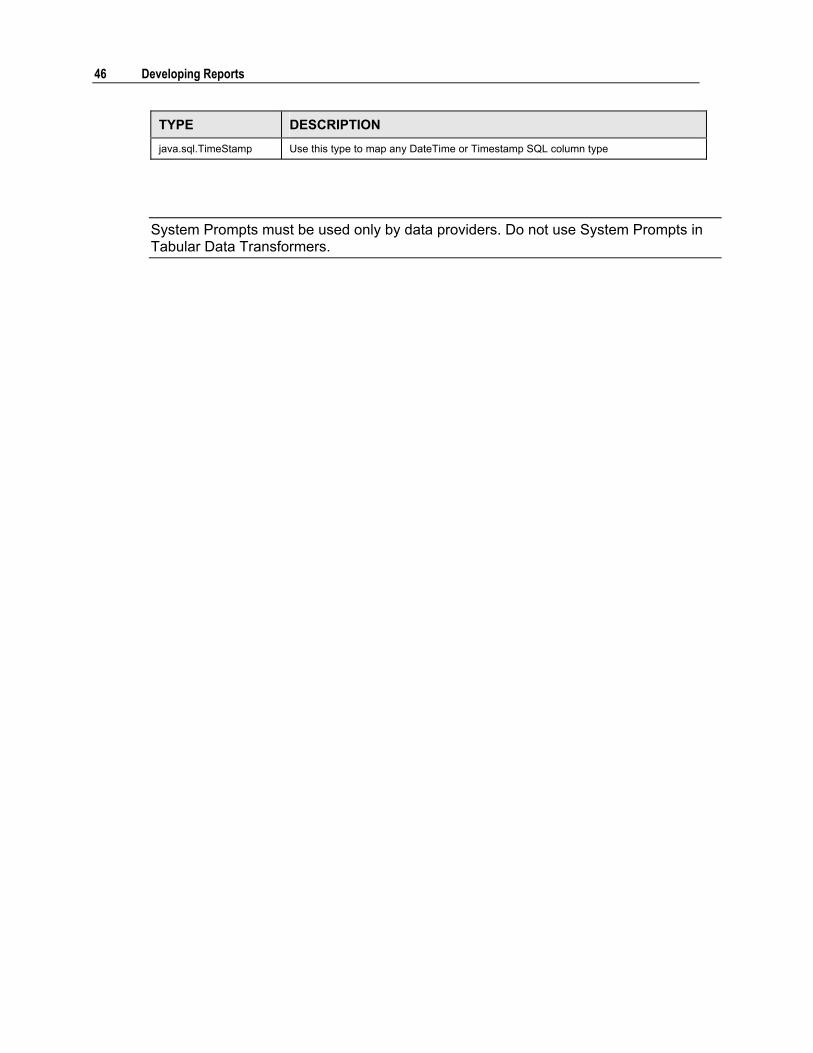
java.sql.TimeStamp Use this type to map any DateTime or Timestamp SQL column type
An example of declaring the column mapping:
The Data Provider root tag
<TabularDataProvider code="CONTRACT_DETAILED_CALLS" maxRows="1000" timeout="100">
Creating Data Providers 41
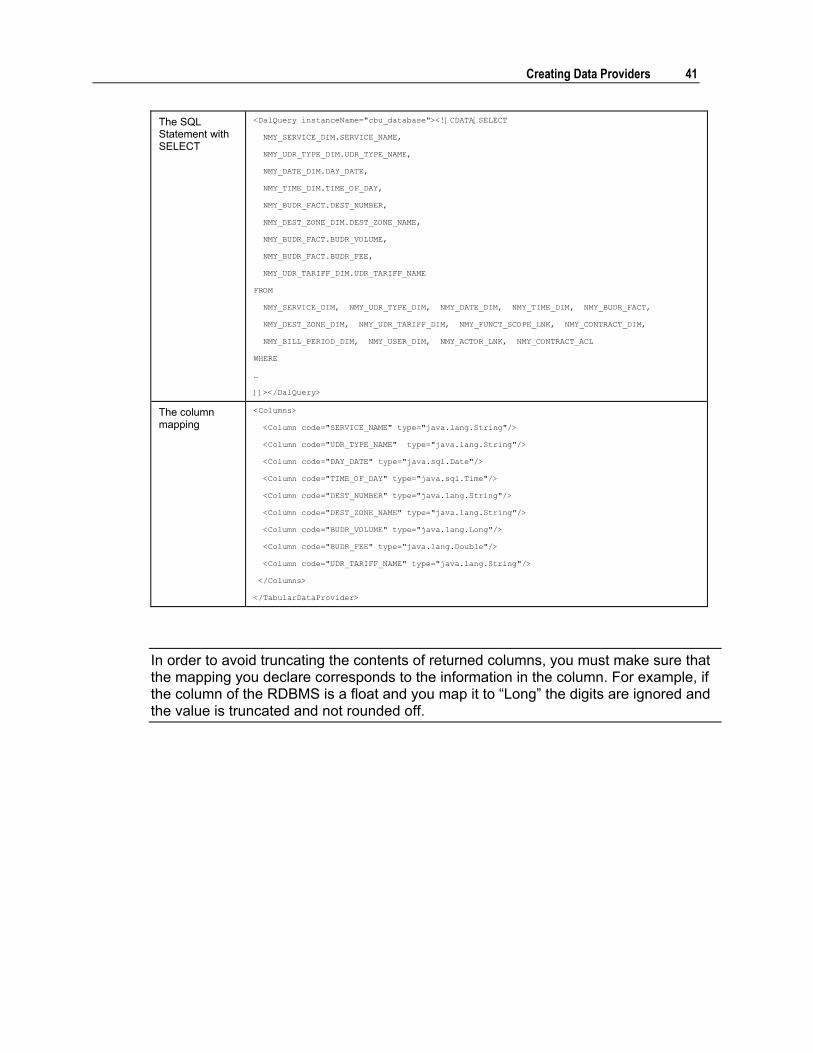
The SQL Statement with SELECT
<DalQuery instanceName="cbu_database"><![CDATA[SELECT
NMY_SERVICE_DIM.SERVICE_NAME,
NMY_UDR_TYPE_DIM.UDR_TYPE_NAME,
NMY_DATE_DIM.DAY_DATE,
NMY_TIME_DIM.TIME_OF_DAY,
NMY_BUDR_FACT.DEST_NUMBER,
NMY_DEST_ZONE_DIM.DEST_ZONE_NAME,
NMY_BUDR_FACT.BUDR_VOLUME,
NMY_BUDR_FACT.BUDR_FEE,
NMY_UDR_TARIFF_DIM.UDR_TARIFF_NAME
FROM
NMY_SERVICE_DIM, NMY_UDR_TYPE_DIM, NMY_DATE_DIM, NMY_TIME_DIM, NMY_BUDR_FACT,
NMY_DEST_ZONE_DIM, NMY_UDR_TARIFF_DIM, NMY_FUNCT_SCOPE_LNK, NMY_CONTRACT_DIM,
NMY_BILL_PERIOD_DIM, NMY_USER_DIM, NMY_ACTOR_LNK, NMY_CONTRACT_ACL
WHERE
�
]]></DalQuery>
The column mapping
<Columns>
<Column code="SERVICE_NAME" type="java.lang.String"/>
<Column code="UDR_TYPE_NAME" type="java.lang.String"/>
<Column code="DAY_DATE" type="java.sql.Date"/>
<Column code="TIME_OF_DAY" type="java.sql.Time"/>
<Column code="DEST_NUMBER" type="java.lang.String"/>
<Column code="DEST_ZONE_NAME" type="java.lang.String"/>
<Column code="BUDR_VOLUME" type="java.lang.Long"/>
<Column code="BUDR_FEE" type="java.lang.Double"/>
<Column code="UDR_TARIFF_NAME" type="java.lang.String"/>
</Columns>
</TabularDataProvider>
In order to avoid truncating the contents of returned columns, you must make sure that the mapping you declare corresponds to the information in the column. For example, if the column of the RDBMS is a float and you map it to �Long� the digits are ignored and the value is truncated and not rounded off.

42 Developing Reports
Specifying the DataProvider Prompt For each prompt, you must declare a PromptBinding in the same order they appear in the SQL Statement. These bindings refer to a specified Data Provider Prompt.
The syntax is:
<PromptBinding prompt="PROMPT_CODE"/>
where:
! PROMPT_CODE is the code of the Data Provider Prompt.
An example of a prompt and its binding. The simple usr.USER_LOGIN "?" prompt is: ...
WHERE
( usr.USER_LOGIN = ? )
AND ( fs_lnk.USER_KEY = usr.USER_KEY )
...
The PromptBinding declaration for usr.USER_LOGIN and the prompt USER_LOGIN is : <PromptBindings>
<PromptBinding prompt="USER_LOGIN"/>
...
</PromptBindings>

C H A P T E R 4
Creating Data Provider Prompts
In This Section
About Creating Data Provider Prompts .................................. 44 Specifying System Prompts.................................................... 45 Specifying Interactive Prompts ............................................... 47 Creating Data Provider PromptBlocks .................................... 58 Prompt Block Rendering......................................................... 59

44 Developing Reports
About Creating Data Provider Prompts
The Data Provider Prompt gives your users the power to interact with the system and select the data they want see.
A prompt basically sets the value in the SQL statement in the Data Provider. There are several ways of setting such information. The different types of prompts include:
! System Prompts The values of these prompts are set by the system or determined by the Telco Service Manager workflow.
! Interactive Prompts The values of these prompts are determined by direct user interaction, like selecting named from a list or selecting check boxes.
The format of a prompt is:
<Prompt code="CODE_NAME" name="name" type="type">
...
</Prompt>
where
! CODE_NAME the unique code name of the prompt
! name the name of the prompt
! type the type of prompt from the list of java data types.
Each prompt in your Data Provider SQL Statement must have an associated prompt. This means that your report definition file can contain one or more Data Provider Prompt.
When the Telco Service Manager starts, it loads all of the reports declared in the reportelements.properties file. Because all of the reports are loaded in memory, the code of each prompt must be unique.
Because they are all loaded at startup, you can create a report definition file which contains a set of global prompts which can be used by all of the reports. By default, these global Data Provider Prompts are in GlobalPrompts.xml.

Creating Data Provider Prompts 45
Specifying System Prompts You use System Prompts to set values automatically in your your data provider without any user interaction. You can also specify if the prompt value should be displayed or not.
System prompts can be divided into two different categories:
! Internal prompts This prompt has a value set by the report_helper.jsp. This JSP sets the value taking into accout the conetext of the application. For instance, the value can be determined by :
! USER_LOGIN
! ADMINISTERED_ORGANIZATION
! ADMINISTERED_LEVEL
! Implicit prompts
This prompt has a value set by the calling page.
To specify the System Prompt, use the syntax:
<Prompt code="CODE_NAME" name="name" type="type" isHidden="true/false">
<SystemPrompt/>
</Prompt>
where
! CODE_NAME the unique code name of the prompt
! name the name of the prompt
! type the type of prompt from the list of java data types.
! isHidden determines if the value is shown to the end user
The available java types are:
TYPE DESCRIPTION
java.lang.Boolean Use this type to map any Boolean SQL column type
java.lang.Double Use this type to map any Double or Float SQL column type
java.lang.Long Use this type to map any Integer or Long SQL column type
java.lang.String Use this type to map any VARCHAR, TEXT or similar SQL column type
java.sql.Date Use this type to map any Date SQL column type
java.sql.Time Use this type to map any Time SQL column type
46 Developing Reports
TYPE DESCRIPTION java.sql.TimeStamp Use this type to map any DateTime or Timestamp SQL column type
System Prompts must be used only by data providers. Do not use System Prompts in Tabular Data Transformers.

Creating Data Provider Prompts 47
Specifying Interactive Prompts Interactive prompts are prompts which obtain their values through user interaction.
They can be divided into two different categories:
! Input prompts This prompt gets its value directly from user input. Input prompts are text fields.
! Choice prompts This prompt has a determined set of values that the user is asked to choose. Choice prompts include list boxes, radio buttons, check boxes, and drop down lists.
These prompts may have default values. These default values can be set in the Data Provider Prompt itself or by using the context in which you call the report.
Input Prompts You use an input prompt to get a particular value directly from the user.
This prompt is displayed as a text box and has no default value.
You can:
! Set a static default value ! Set a dynamic default value ! Specify the width of the text box
This example shows the declaration of a prompt which sets the value for a date and where the input text box is set to a width of 15 characters.
The start tag of the prompt element
<Prompt code="FROM" type="java.sql.Date">
The default value element
The default value is set to 2002-01-01
<DefaultValue>
<Value>2002-01-01</Value>
</DefaultValue>
The input textbox with a specified width of 15 characters
<InputPrompt>
<PromptFormat>
<TextBox width="15"/>
</PromptFormat>
</InputPrompt>
End tag of the root element
</Prompt>

48 Developing Reports
With Static Default Value
If the <Value> element of the <DefaultValue> element is empty (<Value/>), the default value is an empty string. If you do not declare a default value using the <DefaultValue> element, the default value of the prompt is NULL.
With a Dynamic Default Value
If you enter an <Expression> or <Script> element under the <DefaultValue> element, the default value is calculated when the report is loaded.
The following example shows you how to declare a dynamic default value.
The example assumes that the CurrentDate definition exists.
The start tag of the prompt element
<Prompt code="FROM" type="java.sql.Date">
The dynamic default value element
<DefaultValue>
<Expression><![CDATA[$D{CurrentDate}]]></Expression>
</DefaultValue>
The input textbox with a specified width of 15 characters
<InputPrompt>
<PromptFormat>
<TextBox width="15"/>
</PromptFormat>
</InputPrompt>
End tag of the root element
</Prompt>
Specifying the Width
Specify the width of the text box by using the width attribute of the <TextBox> element.
Creating Data Provider Prompts 49
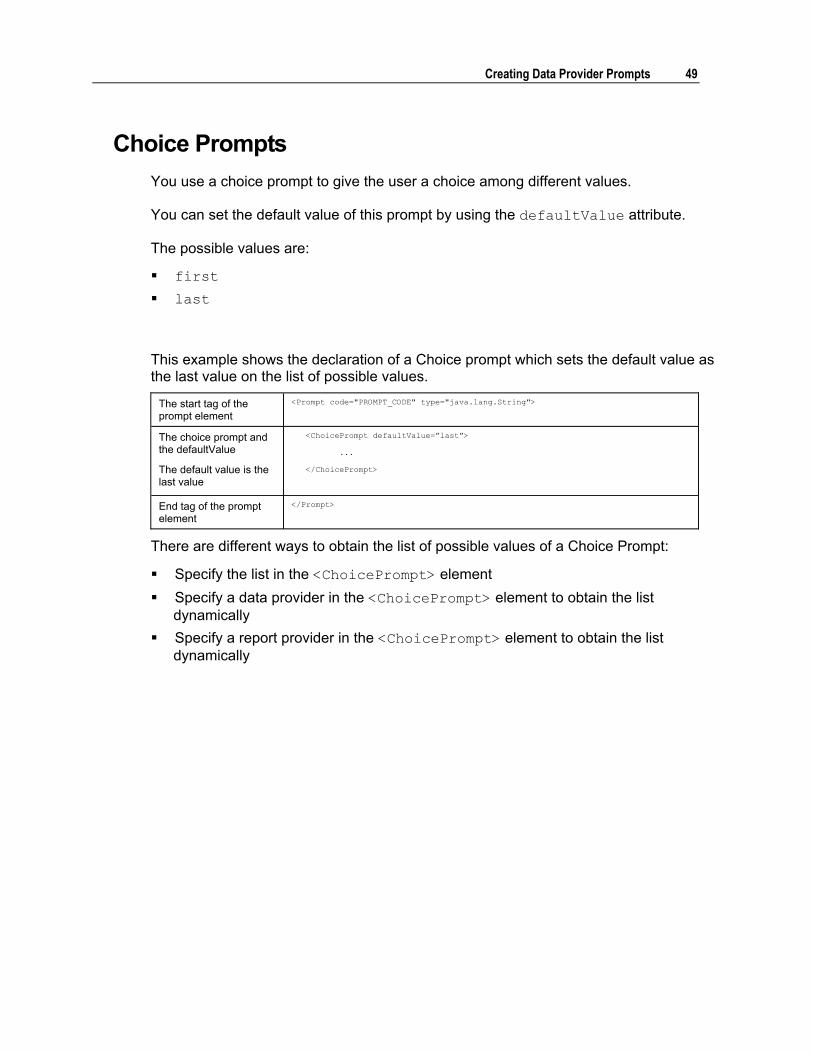
Choice Prompts You use a choice prompt to give the user a choice among different values.
You can set the default value of this prompt by using the defaultValue attribute.
The possible values are:
! first ! last
This example shows the declaration of a Choice prompt which sets the default value as the last value on the list of possible values.
The start tag of the prompt element
<Prompt code="PROMPT_CODE" type="java.lang.String">
The choice prompt and the defaultValue
The default value is the last value
<ChoicePrompt defaultValue=�last�>
...
</ChoicePrompt>
End tag of the prompt element
</Prompt>
There are different ways to obtain the list of possible values of a Choice Prompt:
! Specify the list in the <ChoicePrompt> element ! Specify a data provider in the <ChoicePrompt> element to obtain the list
dynamically ! Specify a report provider in the <ChoicePrompt> element to obtain the list
dynamically

50 Developing Reports
With Explicit List of Values
In the <ChoicePrompt> element, you can specify the list of possible values. You can use this type of list for values which are common to all of your users and which do not change.
To specify a value, you use:
! The <ExplicitValues> element to create the list ! More than one <ChoiceItem> elements to specify a possible value
This example shows Choice Prompt with three possible values with the default value being the last value on the list:
The start tag of the prompt element
<Prompt code="PROMPT_CODE" type="java.lang.String">
The choice prompt element and the defaultValue
<ChoicePrompt defaultValue=�last�>
The possible values with their display value and value
<ExplicitValues>
<ChoiceItem displayValue="value1Label">
<Value>value1</Value>
</ChoiceItem>
<ChoiceItem displayValue="value2Label">
<Value>value2</Value>
</ChoiceItem>
<ChoiceItem displayValue="value3Label">
<Value>value3</Value>
</ChoiceItem>
</ExplicitValues>
End tag of the choice prompt element
</ChoicePrompt>
End tag of the prompt element
</Prompt>
With Dynamic List of Values
If the values of your Choice Prompt change frequently or if the values depend on the user, you can fill the list of options dynamically by using a Data provider.
This data provider can be either:
! local data provider A local data provider is one that is written in the Choice Prompt itself
! Report data provider A report declared for the report but not contained in the Choice Prompt which uses it

Creating Data Provider Prompts 51
Because this list is dynamic, the <ChoicePrompt> element does not have a defaultValue attribute.
You use the <DynamicValues> elements to display the elements. This element has the following attributes:
! displayColumn This is the column used for display values.
! valueColumn This is the column used to get the return value of the selected value
These columns must exist in the data provider.
This example shows a ChoicePrompt with dynamic values:
<Prompt code="PROMP_CODE" type="java.lang.String">
<ChoicePrompt>
<DynamicValues displayColumn="BILL_PERIOD_NAME" valueColumn="BILL_PERIOD_KEY" >
�
In the <ChoicePrompt> element, you can specify the list of possible values. You can use this type of list for values which are common to all of your users and which do not change.
To specify a value, you use:
! The <ExplicitValues> element to create the list ! More than one <ChoiceItem> elements to specify a possible value
This example shows Choice Prompt with three possible values with the default value being the last value on the list:
The start tag of the prompt element
<Prompt code="PROMP_CODE" type="java.lang.String">
The choice prompt element
<ChoicePrompt>
A dynamic value <DynamicValues displayColumn="BILL_PERIOD_NAME" valueColumn="BILL_PERIOD_KEY" >
...
End tag of the choice prompt element
</ChoicePrompt>
End tag of the prompt element
</Prompt>

52 Developing Reports
Example of DynamicValues Based on a Prompt Provider
This example shows a Choice Prompt with Dynamic Values obtained using a local prompt provider.
The start tag of the prompt element
<Prompt code="BILL_PERIOD_KEY" type="java.lang.Long">
The choice prompt element
<ChoicePrompt>
A dynamic value <DynamicValues displayColumn="BILL_PERIOD_NAME" valueColumn="BILL_PERIOD_KEY" >
The Data Provider <TabularDataProvider code="BILL_PERIOD" maxRows="1000" timeout="100">
The SQL Statement <DalQuery instanceName="cbu_database"><![CDATA[SELECT DISTINCT
NMY_BILL_PERIOD_DIM.BILL_PERIOD_KEY,
NMY_BILL_PERIOD_DIM.BILL_PERIOD_NAME,
NMY_BILL_PERIOD_DIM.BILL_PERIOD_START
FROM
NMY_BILL_PERIOD_DIM,
NMY_USER_DIM,
NMY_BILL_ACCT_ACL,
NMY_FUNCT_SCOPE_LNK,
NMY_ACTOR_LNK,
NMY_BILL_ACCT_DIM,
NMY_MAIN_INVOICE_FACT
WHERE
( NMY_BILL_ACCT_DIM.BILL_ACCT_KEY=NMY_BILL_ACCT_ACL.BILL_ACCT_KEY )
AND ( NMY_MAIN_INVOICE_FACT.BILL_ACCT_KEY=NMY_BILL_ACCT_DIM.BILL_ACCT_KEY )
AND ( NMY_MAIN_INVOICE_FACT.BILL_PERIOD_KEY=NMY_BILL_PERIOD_DIM.BILL_PERIOD_KEY )
AND ( NMY_BILL_ACCT_ACL.ACTOR_KEY=NMY_ACTOR_LNK.CHILD_ACTOR_KEY )
AND ( NMY_FUNCT_SCOPE_LNK.ACTOR_KEY=NMY_ACTOR_LNK.PARENT_ACTOR_KEY )
AND ( NMY_USER_DIM.USER_KEY=NMY_FUNCT_SCOPE_LNK.USER_KEY )
AND ( NMY_USER_DIM.USER_LOGIN = ? )
ORDER BY
NMY_BILL_PERIOD_DIM.BILL_PERIOD_START ASC]]></DalQuery>
The Column Binding <Columns>
<Column code="BILL_PERIOD_KEY" type="java.lang.Long"/>
<Column code="BILL_PERIOD_NAME" type="java.lang.String"/>
<Column code="BILL_PERIOD_START" type="java.lang.String"/>
</Columns>
The Prompt Bindings <PromptBindings>
<PromptBinding prompt="USER_LOGIN"/>
</PromptBindings>
End tags </TabularDataProvider>
</DynamicValues>
</ChoicePrompt>
</Prompt>

Creating Data Provider Prompts 53
Example of DynamicValues Based on a Report Provider
This example shows a Choice Prompt with Dynamic list of values obtained using a report provider.
You reference another data provider of the report where the prompt is used.
You use the <TabularDataProviderRef> element and the provider attribute to specify the report provider.
You can also change the way the column is sorted by the report you call. This is useful if the default sort does not apply to the dynamic values.
In this example, the displayColumn="DEST_ZONE_NAME" and valueColumn="DEST_ZONE_KEY" attributes refer to the columns defined in the CONTRACT_DETAILED_CALLS data provider defined in the current report. This example also shows this prompt changing the column sort.
The start tag of the prompt element
<Prompt code=" DEST_ZONE_KEY " type="java.lang.Long">
The choice prompt element
<ChoicePrompt>
A dynamic value <DynamicValues displayColumn="DEST_ZONE_NAME" valueColumn="DEST_ZONE_KEY">
The Reference to the Data Provider
<TabularDataProviderRef provider="CONTRACT_DETAILED_CALLS">
The override of the default sort of the referenced data provider
<ColumnSorts> <ColumnSort column="DEST_ZONE_NAME" order="ascending"/>
</ColumnSorts>
End tags </TabularDataProviderRef>
</DynamicValues>
</ChoicePrompt>
</Prompt>
54 Developing Reports
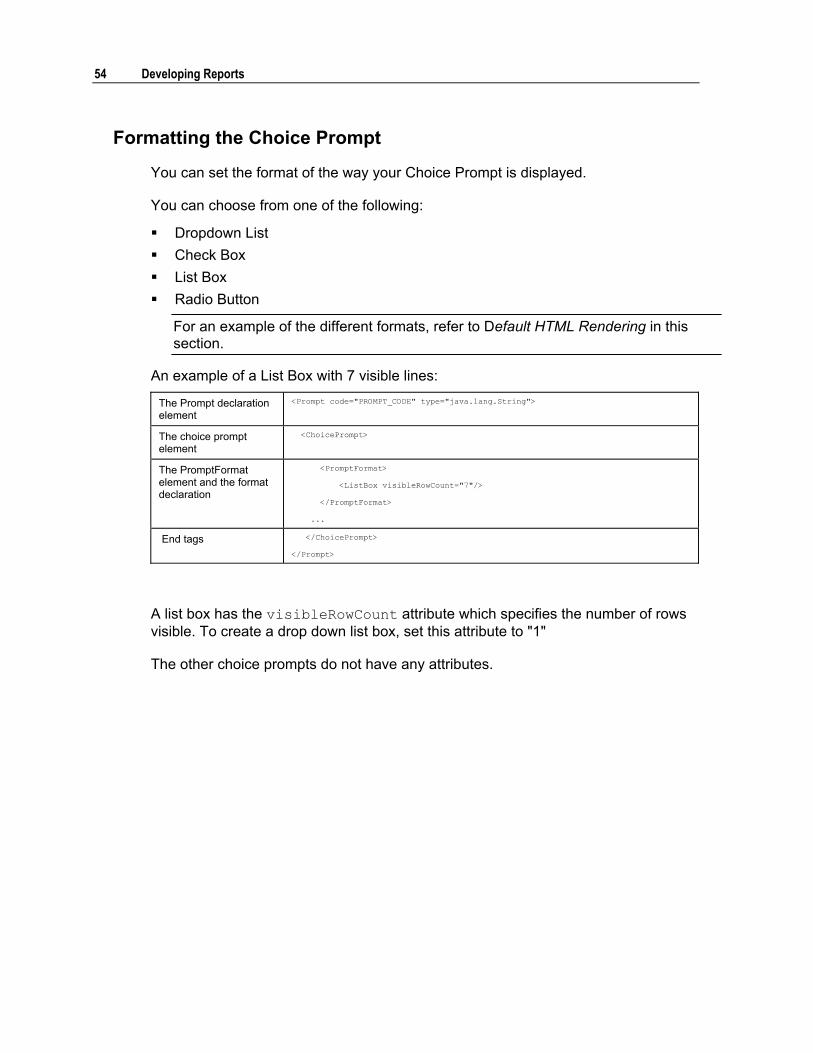
Formatting the Choice Prompt
You can set the format of the way your Choice Prompt is displayed.
You can choose from one of the following:
! Dropdown List ! Check Box ! List Box ! Radio Button
For an example of the different formats, refer to Default HTML Rendering in this section.
An example of a List Box with 7 visible lines:
The Prompt declaration element
<Prompt code="PROMPT_CODE" type="java.lang.String">
The choice prompt element
<ChoicePrompt>
The PromptFormat element and the format declaration
<PromptFormat>
<ListBox visibleRowCount="7"/>
</PromptFormat>
...
End tags </ChoicePrompt>
</Prompt>
A list box has the visibleRowCount attribute which specifies the number of rows visible. To create a drop down list box, set this attribute to "1"
The other choice prompts do not have any attributes.

Creating Data Provider Prompts 55
Cascaded Prompts In some cases, you may want the user to rill in the values in a list.
For example, you may want to allow users to first select a bill period then an invoice then a sub invoice to view a specific contract invoice report .
In the sample, reports there are the following interactive prompts:
! BILL_PERIOD ! MAIN_INVOICE
MAIN_INVOICE depends on the value selected in the BILL_PERIOD prompt
The report's Contract_Invoice_Details Data Provider depends on the selected values in the selected prompts.
The interactive prompt is displayed as follows:
The method for creating this prompt is as follows:
1 Define the interactive prompts:
! BILL_PERIOD
! MAIN_INVOICE
2 Define the SYSTEM_BILL_PERIOD system prompt
3 Define that the SYSTEM_BILL_PERIOD prompt refreshes the MAIN_INVOICE prompt
To do so, define a property on Prompt Block. Use the syntax: <Property key="CASCADED_PROMPT_SYSTEM_BILL_PERIOD_KEY">BILL_PERIOD_KEY</Property>
56 Developing Reports
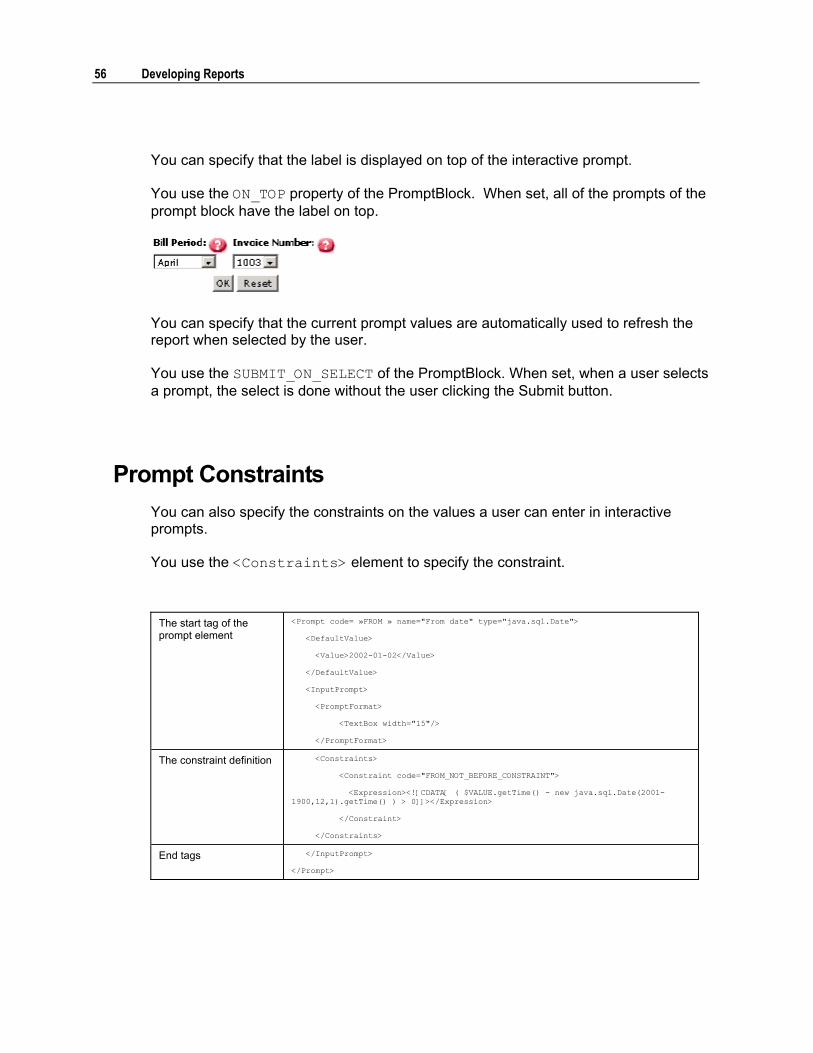
You can specify that the label is displayed on top of the interactive prompt.
You use the ON_TOP property of the PromptBlock. When set, all of the prompts of the prompt block have the label on top.
You can specify that the current prompt values are automatically used to refresh the report when selected by the user.
You use the SUBMIT_ON_SELECT of the PromptBlock. When set, when a user selects a prompt, the select is done without the user clicking the Submit button.
Prompt Constraints You can also specify the constraints on the values a user can enter in interactive prompts.
You use the <Constraints> element to specify the constraint.
The start tag of the prompt element
<Prompt code= »FROM » name="From date" type="java.sql.Date">
<DefaultValue>
<Value>2002-01-02</Value>
</DefaultValue>
<InputPrompt>
<PromptFormat>
<TextBox width="15"/>
</PromptFormat>
The constraint definition <Constraints>
<Constraint code="FROM_NOT_BEFORE_CONSTRAINT">
<Expression><![CDATA[ ( $VALUE.getTime() - new java.sql.Date(2001-1900,12,1).getTime() ) > 0]]></Expression>
</Constraint>
</Constraints>
End tags </InputPrompt>
</Prompt>

Creating Data Provider Prompts 57
You can use other prompt values when comparing values in the definition of the constraint.
58 Developing Reports
Creating Data Provider PromptBlocks
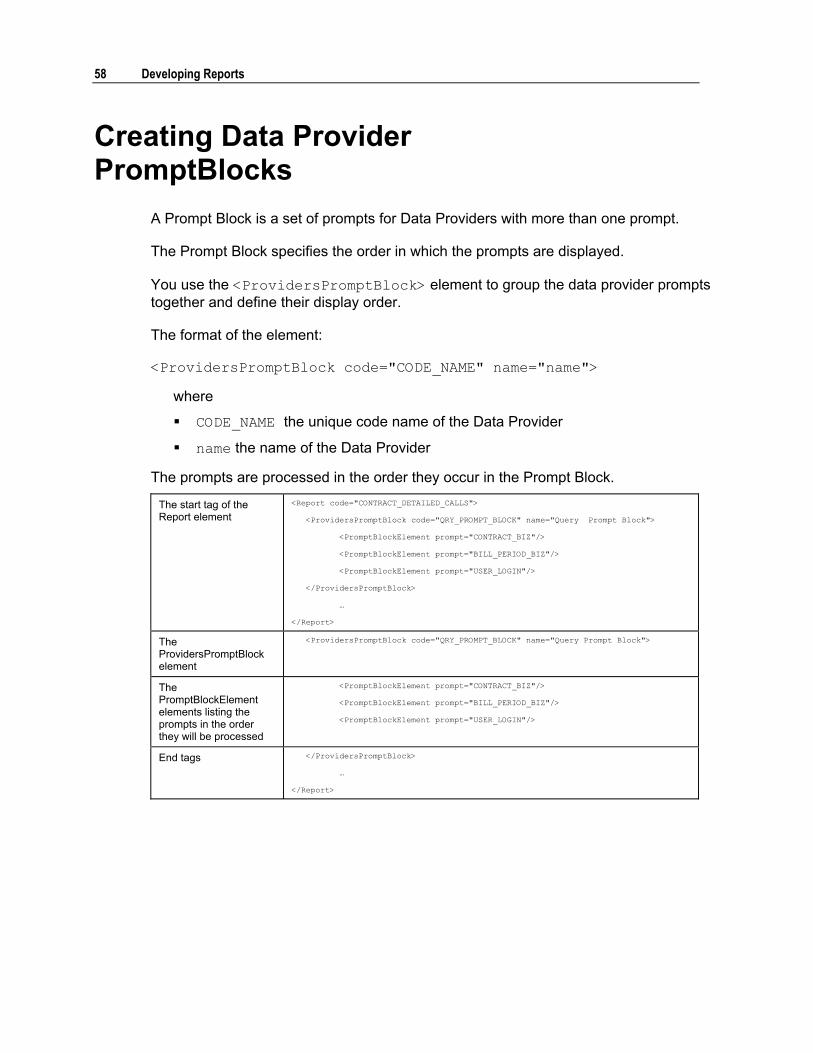
A Prompt Block is a set of prompts for Data Providers with more than one prompt.
The Prompt Block specifies the order in which the prompts are displayed.
You use the <ProvidersPromptBlock> element to group the data provider prompts together and define their display order.
The format of the element:
<ProvidersPromptBlock code="CODE_NAME" name="name">
where
! CODE_NAME the unique code name of the Data Provider
! name the name of the Data Provider
The prompts are processed in the order they occur in the Prompt Block.
The start tag of the Report element
<Report code="CONTRACT_DETAILED_CALLS">
<ProvidersPromptBlock code="QRY_PROMPT_BLOCK" name="Query Prompt Block">
<PromptBlockElement prompt="CONTRACT_BIZ"/>
<PromptBlockElement prompt="BILL_PERIOD_BIZ"/>
<PromptBlockElement prompt="USER_LOGIN"/>
</ProvidersPromptBlock>
�
</Report>
The ProvidersPromptBlock element
<ProvidersPromptBlock code="QRY_PROMPT_BLOCK" name="Query Prompt Block">
The PromptBlockElement elements listing the prompts in the order they will be processed
<PromptBlockElement prompt="CONTRACT_BIZ"/>
<PromptBlockElement prompt="BILL_PERIOD_BIZ"/>
<PromptBlockElement prompt="USER_LOGIN"/>
End tags </ProvidersPromptBlock>
�
</Report>

Creating Data Provider Prompts 59
Prompt Block Rendering
Interactive Prompt Blocks The default display of prompts include:
! localized prompt name ! Helper icon with localized prompt description ! Input element
The file name of the icon displayed after the prompt name is qmark_out.gif.
When user moves the mouse over the icon, a ballon help opens and displays the prompt description.
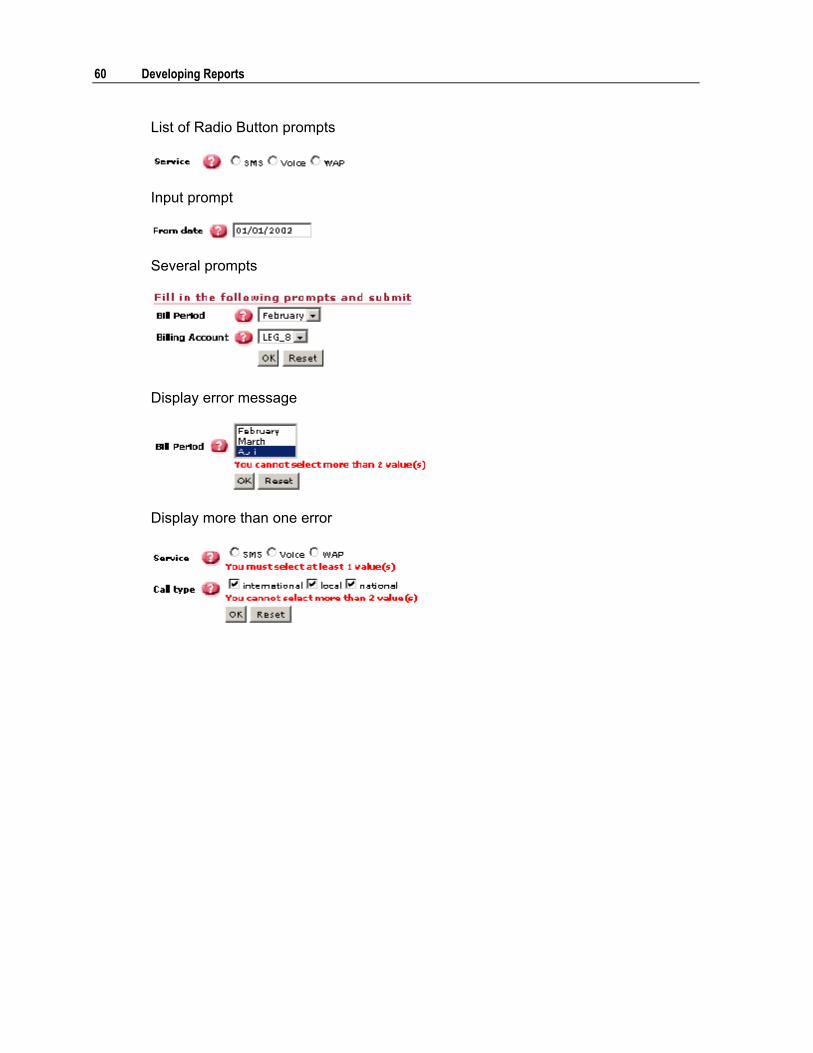
The interactive prompt blocks also display warning and error message for unexpected input
List prompt with three lines visible
Drop Down List prompt
List of Check Box prompt
60 Developing Reports
List of Radio Button prompts
Input prompt
Several prompts
Display error message
Display more than one error

Creating Data Provider Prompts 61
Prompt Value Blocks The prompt values block display the value of the prompt.
The values of these prompts are the values selected or entered by the user in interactive prompts. For example, on one page the user enters the contract number. On the following page with other prompts, the report displays the number entered by the user as display only text.
These prompt value blocks display the value of:
These prompt value blocks display the value of:
! Interactive prompts values ! Non interactive prompts values ! Visible system prompts values
Mono valued prompts
Multi valued prompts


C H A P T E R 5
Creating Tabular Data Transformers
In This Section
About Tabular Data Transformers .......................................... 64 Creating the TabularDataTransformer Element...................... 65 Creating the Detail Element.................................................... 69 Creating Master Detail Columns............................................. 76 Creating Aggregations ............................................................ 82 Creating Filters ....................................................................... 89 Creating PromptBlocks ........................................................... 95 Specifying Sorts...................................................................... 96 Exporting Data ........................................................................ 100

64 Developing Reports
About Tabular Data Transformers For each data provider, your report requires one or more Data Transformers.
The Data Transformer is the part of your report which handles formatting, sorting, and displaying the data you obtain from Data Providers. The data obtained by the data provider is referred to as a data block. This block of information has the following components:
! Header ! Data ! Footer
When creating a Data Transformer, you must specify:
! The Data Transformer code ! The code of the Data Provider ! The list of columns of the detail block ! The display of the detail block
The format of a transformer is:
<TabularDataTransformer code="CODE_NAME" provider="PROVIDER_NAME">
...
</<TabularDataTransformer>
where
! CODE_NAME the unique code name of the Data Transformer
! provider the name of the Data Provider

Creating Tabular Data Transformers 65
Creating the TabularDataTransformer Element
Creating the TabularDataTransformer element involves:
! Creating the element ! Specifying the code ! Specifying the Data Provider ! Specifying the element attributes ! Specifying the columns to display
To create the TabularDataTransformer Element
1 Create a TabularDataTransformer element. Use the syntax: <TabularDataTransformer code="your_code_name" provider="provider_name" ishidden="true" maxRowsPerPage="number"/>
2 Enter the values of the following attributes:
ATTRIBUTE DESCRIPTION code The code of the TabularData Transformer
The code must be unique to the report element.
provider The code of the associated data provider
This attribute is mandatory and only existing data providers can be declared.
ishidden boolean
Specifies if the data provider is hidden by default
maxRowsPerPage Specifies the maximum number of rows before inserting a page break
Example of a <TabularDataTransformer> element: <TabularDataTransformer code="NumberOfCallsAndTotalFeesTabularAnalysis" provider="TotalFeePerCostCenter" isHidden="true" maxRowsPerPage=20>
The default rendering of the TabularDataTransformer is:

66 Developing Reports
When you specify a page break, the page navigation block is displayed:
When the EXPORT_AS_CSV and EXPORT_AS_XML properties are defined for transformer, the corresponding icons are displayed:
Defining the Number of Rows per Page Sometimes the results returned by the Data Provider may be too large to display on a single page or you may want to limit the number of rows displayed. By default, the data transformer displays all the rows returned by the data provider.
You use the attributes of the <TabularDataTransformer> element to specify the maximum number of rows per page.
The format of the element:
<TabularDataTransformer code="CODE_NAME" provider="provider" maxRowsPerPage="number"/>
where
! CODE_NAME the unique code name of the Data Transformer
! provider the name of the Data Provider
! number is the maximum number of rows per page
In this example, the maximum number of rows is 10. <<Report code=�CONTRACT_DETAILED_CALLS� name=�Contract Detailed Calls�>
�
<TabularDataTransformer code="CONTRACT_DETAILED_CALLS" provider="CONTRACT_DETAILED_CALLS" maxRowsPerPage="10"/>
</Report>
Creating Tabular Data Transformers 67
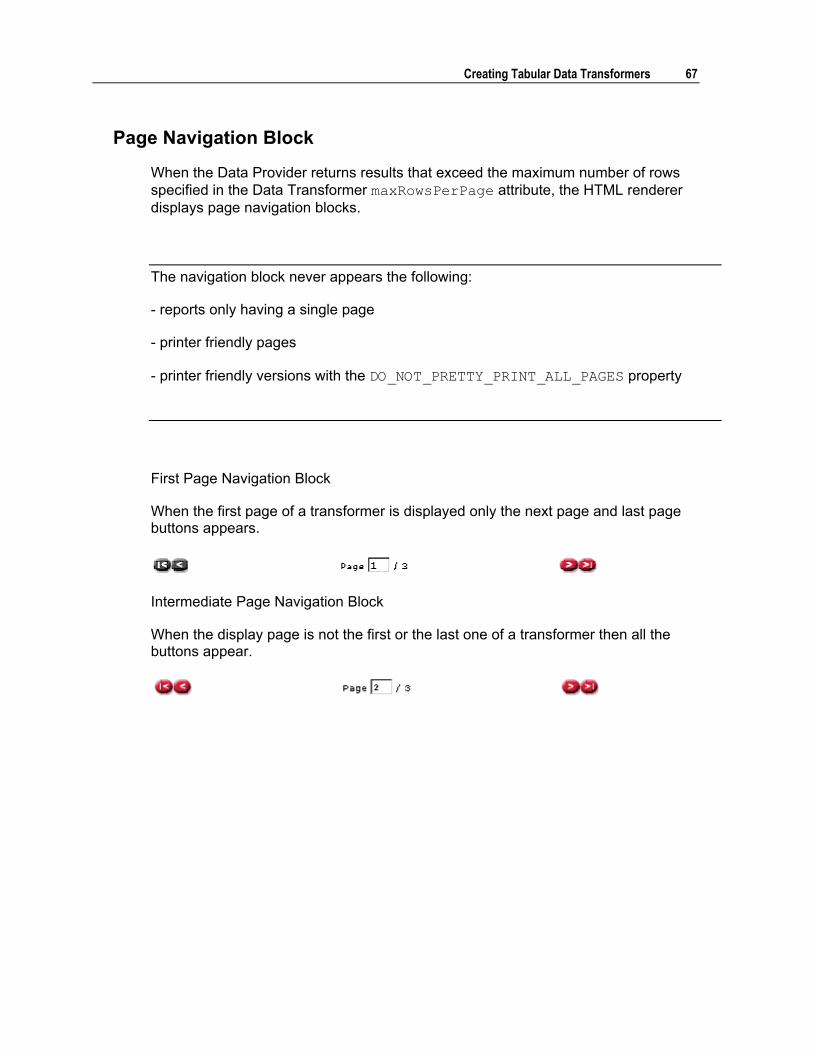
Page Navigation Block
When the Data Provider returns results that exceed the maximum number of rows specified in the Data Transformer maxRowsPerPage attribute, the HTML renderer displays page navigation blocks.
The navigation block never appears the following:
- reports only having a single page
- printer friendly pages
- printer friendly versions with the DO_NOT_PRETTY_PRINT_ALL_PAGES property
First Page Navigation Block
When the first page of a transformer is displayed only the next page and last page buttons appears.
Intermediate Page Navigation Block
When the display page is not the first or the last one of a transformer then all the buttons appear.

68 Developing Reports
Last Page Navigation Block
When the last page of a transformer is displayed only the first page and preceding page buttons appear.
File Names:
Defining the Layout You can specify the layout of the information in your Tabular Data Transformer.
By default, the data is arranged vertically:
You can arrange the layout horizontally by setting the isHorizontal attribute to "true".
Creating Tabular Data Transformers 69
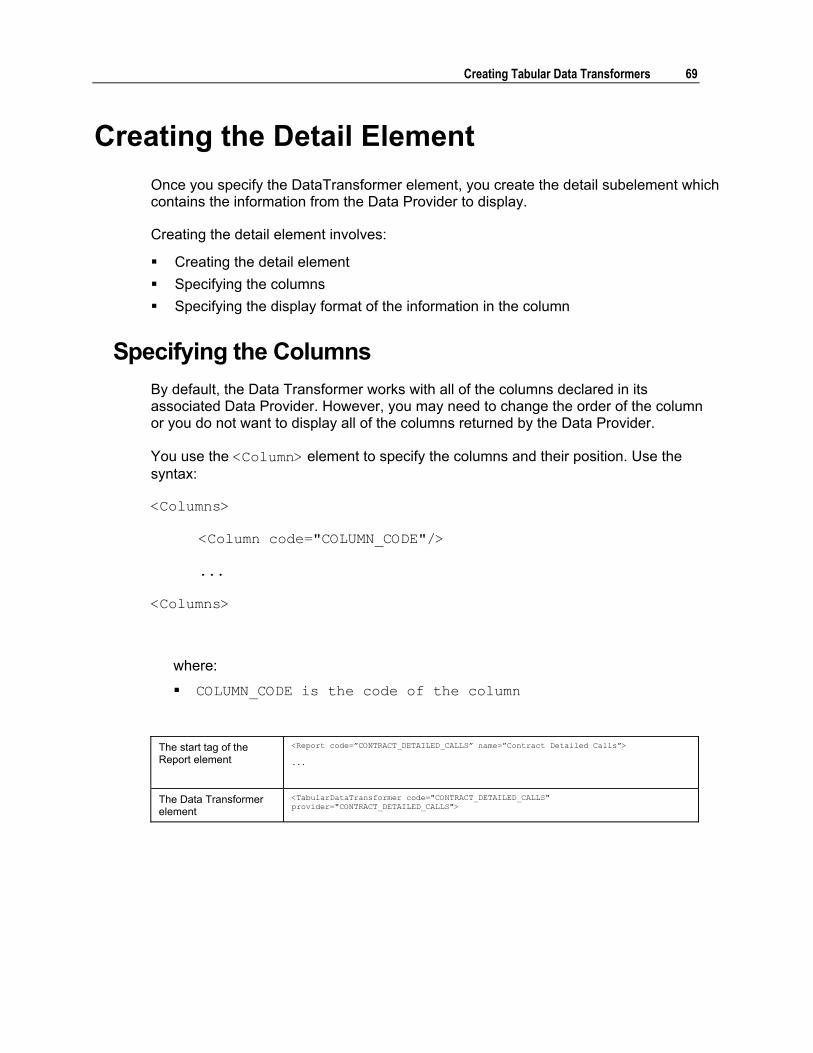
Creating the Detail Element Once you specify the DataTransformer element, you create the detail subelement which contains the information from the Data Provider to display.
Creating the detail element involves:
! Creating the detail element ! Specifying the columns ! Specifying the display format of the information in the column
Specifying the Columns By default, the Data Transformer works with all of the columns declared in its associated Data Provider. However, you may need to change the order of the column or you do not want to display all of the columns returned by the Data Provider.
You use the <Column> element to specify the columns and their position. Use the syntax:
<Columns>
<Column code="COLUMN_CODE"/>
...
<Columns>
where:
! COLUMN_CODE is the code of the column
The start tag of the Report element
<Report code=�CONTRACT_DETAILED_CALLS� name=�Contract Detailed Calls�>
...
The Data Transformer element
<TabularDataTransformer code="CONTRACT_DETAILED_CALLS" provider="CONTRACT_DETAILED_CALLS">

70 Developing Reports
The Columns element and the declaration of the column to display in the order they are declared
<detail>
<Columns>
<Column code="SERVICE_NAME"/>
<Column code="UDR_TYPE_NAME"/>
<Column code="DAY_DATE"/>
<Column code="TIME_OF_DAY"/>
<Column code="DEST_NUMBER"/>
<Column code="DEST_ZONE_NAME"/>
<Column code="BUDR_VOLUME"/>
<Column code="BUDR_FEE"/>
<Column code="UDR_TARIFF_NAME"/>
</Columns>
</detail>
end tags .�
</Report>
When retrieving a column for calculations but not for display, you must set the isHidden column attribute to true.
Specifying Display Formats Display formats are specified for Data and Footer values and cells.
Combining all the possibilities you can design a Data Transformer to display information like this:

Creating Tabular Data Transformers 71
The header is a one line row which displays the column header. If it exists, the localized name is used.
If you can sort the information in the column, the column header is a hyperlink. When a sort is defined on a column then the order of the sort is displayed on the right side of the column name.
For descending sorts:
For ascending sorts:
The nmy_vtab_H style is for the column name.
Data
The data is the set of information displayed as rows.
The format of the data is specified for each column.
If declared, the format and pattern are retrieved and applied.
The nmy_vtab_D style is for the cell displaying the value
Value Format
The expression defines the format of the value dynamically.
The format can be defined several ways:
! Applying a defined format to the value: $F{EuroFormat}($VALUE).
! Applying a definition to the value: $D{DurationFormat}($VALUE).
! Applying an expression to the value: $F{PercentFormat}($VALUE * 100 / $A{SUM_S_FEE})
72 Developing Reports
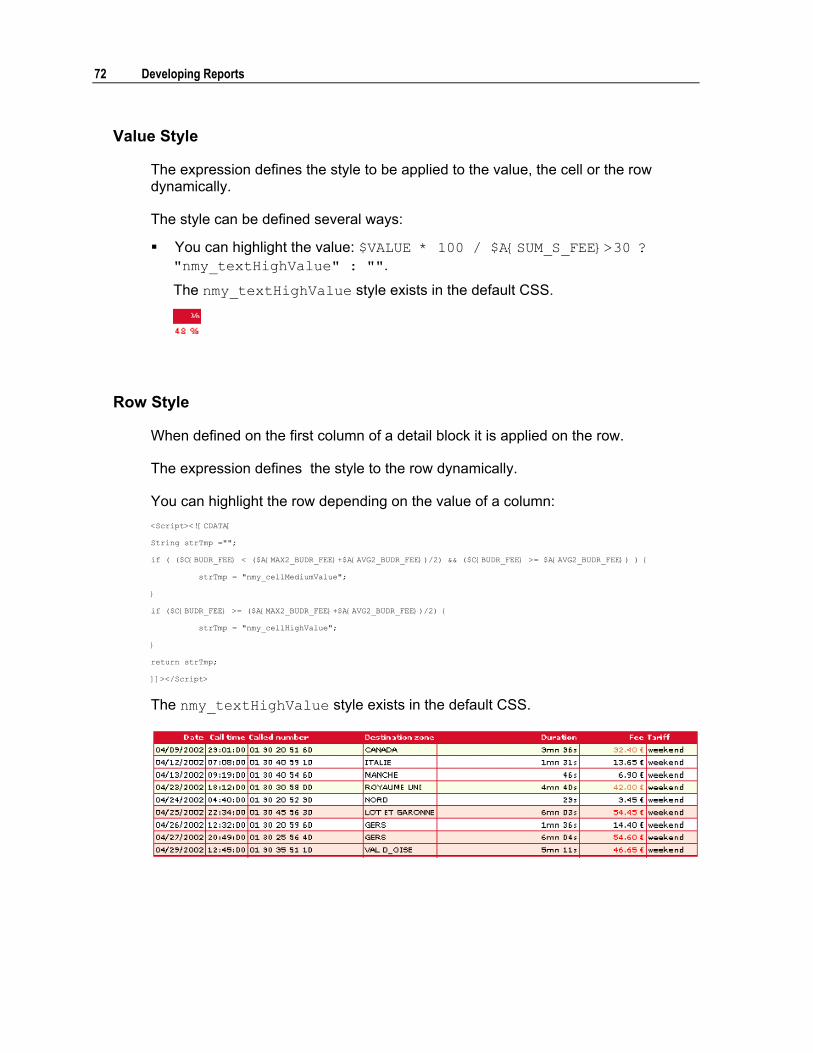
Value Style
The expression defines the style to be applied to the value, the cell or the row dynamically.
The style can be defined several ways:
! You can highlight the value: $VALUE * 100 / $A{SUM_S_FEE}>30 ? "nmy_textHighValue" : "".
The nmy_textHighValue style exists in the default CSS.
Row Style
When defined on the first column of a detail block it is applied on the row.
The expression defines the style to the row dynamically.
You can highlight the row depending on the value of a column: <Script><![CDATA[
String strTmp ="";
if ( ($C{BUDR_FEE} < ($A{MAX2_BUDR_FEE}+$A{AVG2_BUDR_FEE})/2) && ($C{BUDR_FEE} >= $A{AVG2_BUDR_FEE}) ) {
strTmp = "nmy_cellMediumValue";
}
if ($C{BUDR_FEE} >= ($A{MAX2_BUDR_FEE}+$A{AVG2_BUDR_FEE})/2) {
strTmp = "nmy_cellHighValue";
}
return strTmp;
]]></Script>
The nmy_textHighValue style exists in the default CSS.

Creating Tabular Data Transformers 73
You can also alternate style row per row: ($ROW%2==0) ? "nmy_alt1" : "nmy_alt2".
The nmy_alt1 and nmy_alt2 styles exist in the default CSS.
Value Image
The expression defines which image to call depending on a column value dynamically: <Script><![CDATA[
String strTmp="level_space.gif";
if ( $VALUE > ($A{AVG_S_FEE} + ($A{MAX_S_FEE} - $A{AVG_S_FEE})*4/5) ) strTmp = "smile_angry.gif";
if ( $VALUE < ($A{AVG_S_FEE} - ($A{AVG_S_FEE} - $A{MIN_S_FEE})*9/10) ) strTmp = "smile_happy.gif";
return strTmp;
]]></Script>
The smile_angry.gif, smile_happy.gif and level_space.gif images exist in the directory of the application images.
Value Report Links
The expression defines the hyperlink on the value to display dynamically: $D{ExternalLinkReport2Prompts}("STD_CCS_CostCenterAnalysisDashboard", "BILL_PERIOD_KEY", ""+$P{BILL_PERIOD_KEY} ,"PCCKEY", $C{COST_CENTER_KEY} )

74 Developing Reports
The ExternalLinkReport2Prompts definition is defined in the GlobalDefinitions.xml file that comes with QRA. This method requires defining which report you want to go to and which parameters and their values.
Footer
The footer is the multi row section which displays the defined aggregates. In the same column where an aggregate have been defined in the footer zone an aggregate is displayed.
When they are several aggregates defined for the same column, they are displayed one under the other.
The style nmy_vtab_A is for the aggregate value.
When the isHidden attribute is set on an aggregate, then the HTML renderer does not display the aggregate.
No aggregates
An aggregate per column but not all columns

Creating Tabular Data Transformers 75
Heterogeneous number of aggregate per column
Total fee column has 4 defined aggregates, #Calls column has 1 defined aggregate and #Contracts has no defined aggregate.

76 Developing Reports
Creating Master Detail Columns Creating a Master Detail block element involves:
! Creating the Master element ! Specifying the columns to display ! Specifying the display order ! Specifying the aggregation if any
To specify the master column
In order to group data of a particular column, you use the <master> element.
You use the attributes of the <master> element to determine the parent column and if you want a page break before each new master.
The format of the element:
<Master keyColumnCode="COLUMN_CODE" pageBreak="true">
where
! COLUMN_CODE is the column code of the master column
! pageBreak specifies if a page break occurs before the next master
In this example, the report:
! A master column is SERVICE_NAME (keyColumnCode="SERVICE_NAME") ! A page break occurs each time the master value changes (pageBreak="true") ! that the column value to display is the same as the column value to group
(<Column code="SERVICE_NAME"/>)
The Data Provider root tag
<TabularDataTransformer code="CONTRACT_DETAILED_CALLS" name="Contract Detailed Calls" provider="CONTRACT_DETAILED_CALLS" maxRowsPerPage="10">
Master declaration root element
<Masters>
The SERVICE_NAME Master element and column declaration
<Master keyColumnCode="SERVICE_NAME" pageBreak="true">
<Columns>
<Column code="SERVICE_NAME"/>
</Columns>
</Master>
End tags </Masters>
</TabularDataTransformer>

Creating Tabular Data Transformers 77
To specify the columns to display
In the master detail, you can group data for display in order to help you improve the display of information.
For example, if you want to group events by month, you can specify the month as the master and also display the year.
In this example, the report:
! A master column is MONTH_NAME ! The column values to display are YEAR and MONTH_NAME
Master declaration root element
<Masters>
The MONTH_NAME master element and column declarations
<Master keyColumnCode="MONTH_NAME" pageBreak="true">
<Columns>
<Column code="YEAR"/>
<Column code="MONTH_NAME"/>
</Columns>
</Master>
End tag </Masters>
By default, the master column is not sorted. And the data are displayed as they are retrieved from the data provider. You must specify the default sort, otherwise the master and its details may not be in order.
To specify the default order
You can sort the display of your master column.
In the Master element, you specify the sorts using the <ColumnSort> element.
The format of the element:
<ColumnSort column="COLUMN_CODE" order="sort_order"/>
where
! COLUMN_CODE the code name of the column
! sort_order the order of the sort
Possible values: ascending
descending

78 Developing Reports
In the example, the MONTH_NAME is used to group the data.
A default sort is applied on the DATE column (<ColumnSort column="DATE" order="ascending"/>)
When the report is executed, the data transformer data is grouped by Month ordered by Date
Master declaration root element
<Masters>
The MONTH_NAME Master element and column declarations
<Master keyColumnCode="MONTH_NAME">
<Columns>
<Column code="YEAR"/>
<Column code="MONTH_NAME"/>
</Columns>
Sorts declaration root element and column sort declaration to sort on DATE in ascending order
<Sorts>
<ColumnSorts>
<ColumnSort column="DATE" order="ascending"/>
</ColumnSorts>
</Sorts>
End tags </Master>
</Masters>
You can also define interactive sorts.
To specify the aggregation
You can also use column aggregation feature to display aggregation on the detail below a master column.
This example
Master declaration root element
<Masters>
The Service Name Master element and column declaration
<Master keyColumnCode="SERVICE_NAME">
<Columns>
<Column code="SERVICE_NAME"/>
</Columns>

Creating Tabular Data Transformers 79
The Aggregation declaration element and the column declaration to display the sum of the values found in the BUDR_FEE column
<Aggregations>
<Aggregation code="SUM1_BUDR_FEE">
<ColumnOperation column="BUDR_FEE" operation="sum"/>
</Aggregation>
The Aggregation declaration element and the column declaration to display the maximum value found in the BUDR_FEE column
<Aggregation code="MAX1_BUDR_FEE">
<ColumnOperation column="BUDR_FEE" operation="max"/>
</Aggregation>
End tags </Aggregations>
</Master>
</Masters>
To specify more than one master detail group
A report can also have several master-detail groups.
The order of the display is determined by the order of its declaration.
This example produces a report which looks like:
Service Name: Value1
Call type: Value1
Detail
Call type: Value2
Detail
Service Name: Value2
Call type: Value1
Detail
Call type: Value4
Detail
Master declaration root element
<Masters>
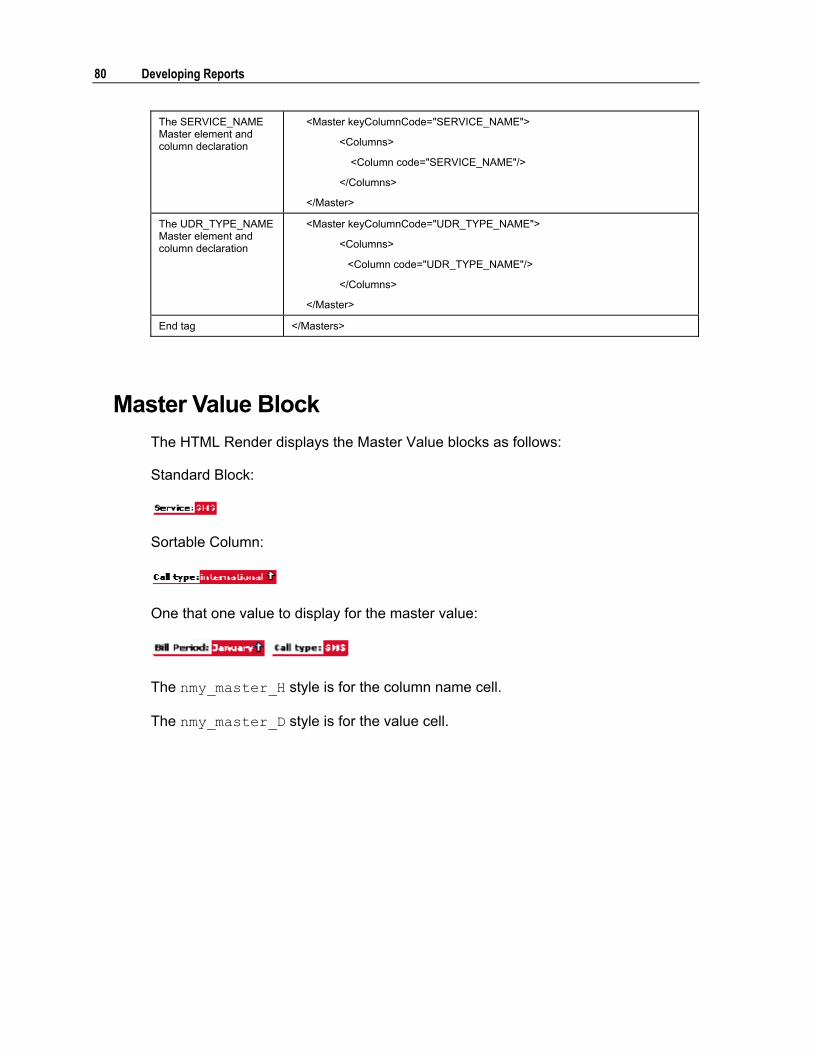
80 Developing Reports
The SERVICE_NAME Master element and column declaration
<Master keyColumnCode="SERVICE_NAME">
<Columns>
<Column code="SERVICE_NAME"/>
</Columns>
</Master>
The UDR_TYPE_NAME Master element and column declaration
<Master keyColumnCode="UDR_TYPE_NAME">
<Columns>
<Column code="UDR_TYPE_NAME"/>
</Columns>
</Master>
End tag </Masters>
Master Value Block The HTML Render displays the Master Value blocks as follows:
Standard Block:
Sortable Column:
One that one value to display for the master value:
The nmy_master_H style is for the column name cell.
The nmy_master_D style is for the value cell.
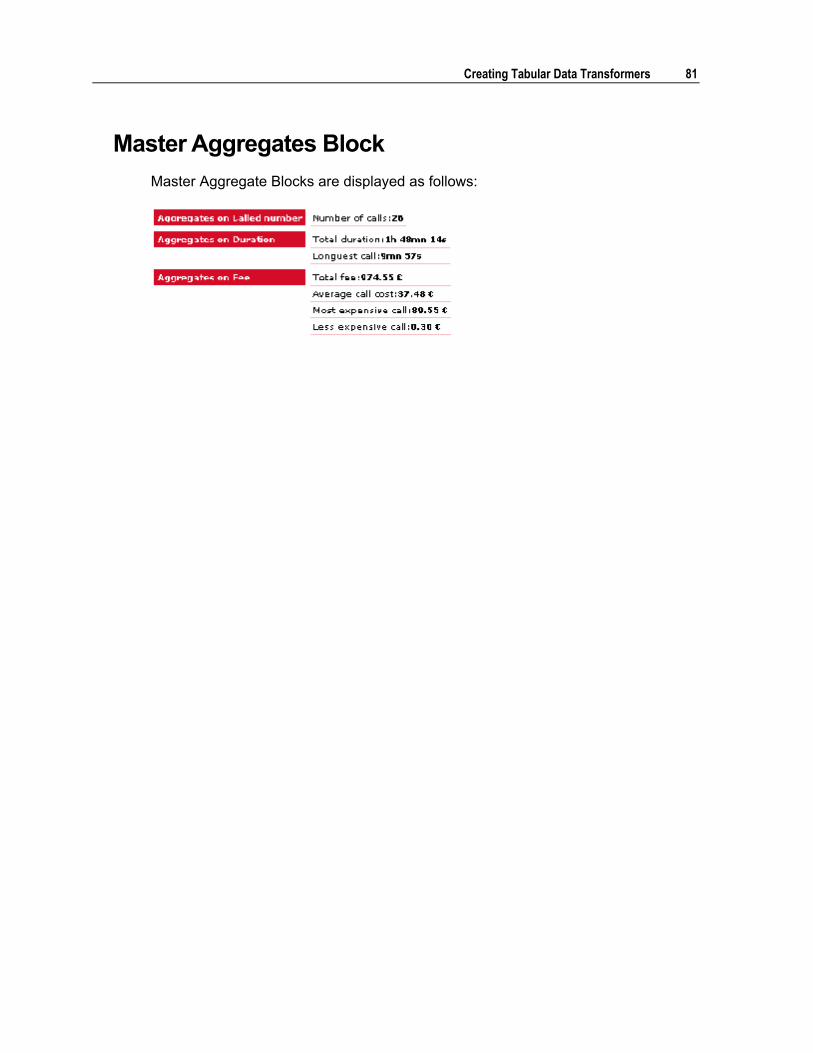
Creating Tabular Data Transformers 81
Master Aggregates Block Master Aggregate Blocks are displayed as follows:

82 Developing Reports
Creating Aggregations You can define several aggregations on each column. An aggregate is always associated with a column and has a code for localization.
Creating Aggregations involves:
! Specifying the column ! Specifying the operator
About Aggregations You can define several aggregations on each column. An aggregate is always associated with a column and has a code for localization.
Creating Aggregations involves:
! Specifying the column ! Specifying the operator
The format of a aggregation is:
<Aggregation code="CODE_NAME">
<ColumnOperation column="COLUMN_CODE" operation="operation">...
</Aggregation>
where
! CODE_NAME the unique code name of the aggregation
! COLUMN_CODE the column code
! operation is the operation to preform
The report processor displays aggregate values for each column. If a column has more than one aggregate, the aggregates are displayed one line at a time.
If specified, the localized aggregate�s name is displayed to the left of the aggregate value.
To create an aggregation
1 Create a Aggregations root tag after the <detail> element. Use the syntax:
<Aggregations>
2 Under this tag, create a Aggregation tag. Use the syntax:

Creating Tabular Data Transformers 83
<Aggregation code=code>
3 Enter the values of the following attributes:
ATTRIBUTE DESCRIPTION
code The code of the aggregate
The code must be unique to the report element.
To specify the column operation
1 Under the Aggregation tag, enter a <ColumnOperation> element. Use the syntax:
<ColumnOperation column="COLUMN_CODE" operation="operation_to_perform"/>
2 Enter the values of the following attributes:
ATTRIBUTE DESCRIPTION COLUMN_CODE The code of the column.
operation The operation to perform on all data in the column:
sum returns the sum
average returns the average
count returns the count
min returns the smallest value
max returns the largest value
Example of Aggregations The Data Provider root tag
<TabularDataTransformer code="TotalFeePerCostCenter" provider="TotalFeePerCostCenter" maxRowsPerPage="10">
The detail element and its column declarations
<Detail>
<Columns>
<Column code="RANK_FROM_PARENT" isHidden="true"/>
<Column code="COST_CENTER_PATH"/>
<Column code="N_CONTRACTS"/>
<Column code="N_CALLS"/>
<Column code="S_FEE"/>
</Columns>
</Detail>
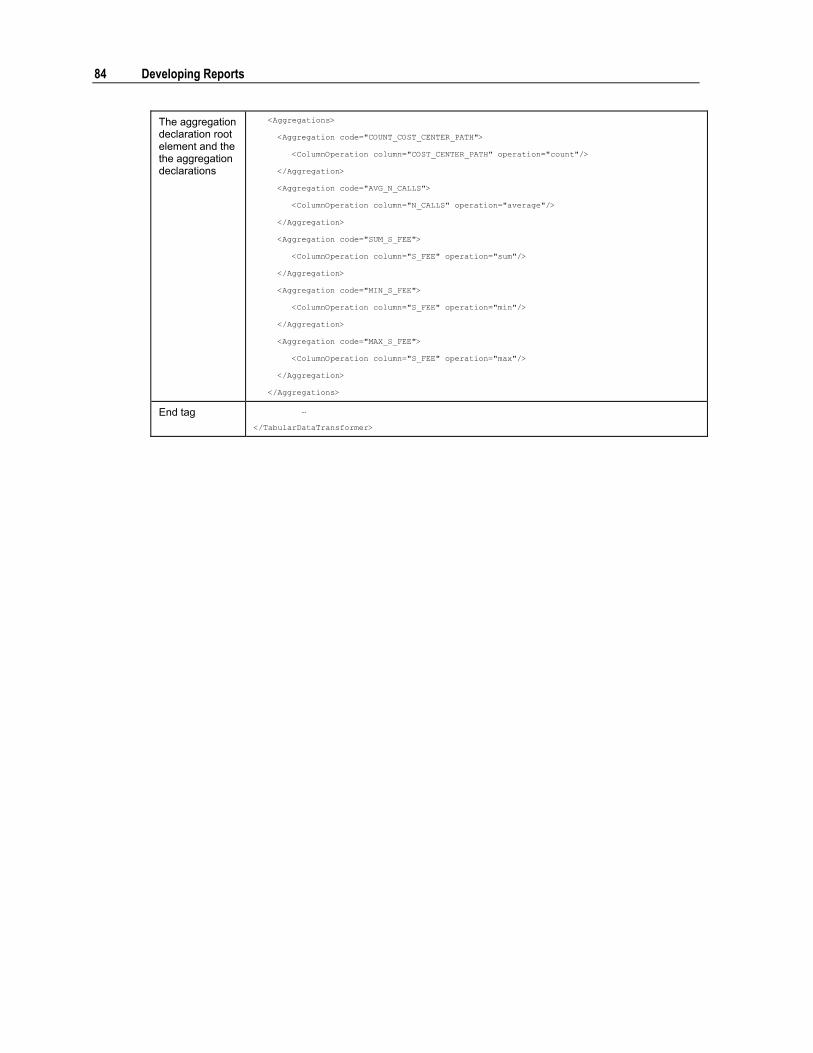
84 Developing Reports
The aggregation declaration root element and the the aggregation declarations
<Aggregations>
<Aggregation code="COUNT_COST_CENTER_PATH">
<ColumnOperation column="COST_CENTER_PATH" operation="count"/>
</Aggregation>
<Aggregation code="AVG_N_CALLS">
<ColumnOperation column="N_CALLS" operation="average"/>
</Aggregation>
<Aggregation code="SUM_S_FEE">
<ColumnOperation column="S_FEE" operation="sum"/>
</Aggregation>
<Aggregation code="MIN_S_FEE">
<ColumnOperation column="S_FEE" operation="min"/>
</Aggregation>
<Aggregation code="MAX_S_FEE">
<ColumnOperation column="S_FEE" operation="max"/>
</Aggregation>
</Aggregations>
End tag �
</TabularDataTransformer>

Creating Tabular Data Transformers 85
Specifying Display Formats Display formats are specified for Data and Footer values and cells.
Combining all the possibilities you can design a Data Transformer to display information like this:
Value Format The expression defines the format of the value dynamically.
The format can be defined several ways:
! Applying a defined format to the value: $F{EuroFormat}($VALUE).
! Applying a definition to the value: $D{DurationFormat}($VALUE).
! Applying an expression to the value: $F{PercentFormat}($VALUE * 100 / $A{SUM_S_FEE})

86 Developing Reports
Value Style The expression defines the style to be applied to the value, the cell or the row dynamically.
The style can be defined several ways:
! You can highlight the value: $VALUE * 100 / $A{SUM_S_FEE}>30 ? "nmy_textHighValue" : "".
The nmy_textHighValue style exists in the default CSS.
Row Style When defined on the first column of a detail block it is applied on the row.
The expression defines the style to the row dynamically.
You can highlight the row depending on the value of a column: <Script><![CDATA[
String strTmp ="";
if ( ($C{BUDR_FEE} < ($A{MAX2_BUDR_FEE}+$A{AVG2_BUDR_FEE})/2) && ($C{BUDR_FEE} >= $A{AVG2_BUDR_FEE}) ) {
strTmp = "nmy_cellMediumValue";
}
if ($C{BUDR_FEE} >= ($A{MAX2_BUDR_FEE}+$A{AVG2_BUDR_FEE})/2) {
strTmp = "nmy_cellHighValue";
}
return strTmp;
]]></Script>
The nmy_textHighValue style exists in the default CSS.

Creating Tabular Data Transformers 87
You can also alternate style row per row: ($ROW%2==0) ? "nmy_alt1" : "nmy_alt2".
The nmy_alt1 and nmy_alt2 styles exist in the default CSS.
Value Image The expression defines which image to call depending on a column value dynamically: <Script><![CDATA[
String strTmp="level_space.gif";
if ( $VALUE > ($A{AVG_S_FEE} + ($A{MAX_S_FEE} - $A{AVG_S_FEE})*4/5) ) strTmp = "smile_angry.gif";
if ( $VALUE < ($A{AVG_S_FEE} - ($A{AVG_S_FEE} - $A{MIN_S_FEE})*9/10) ) strTmp = "smile_happy.gif";
return strTmp;
]]></Script>
The smile_angry.gif, smile_happy.gif and level_space.gif images exist in the directory of the application images.
Value Report Links The expression defines the hyperlink on the value to display dynamically: $D{ExternalLinkReport2Prompts}("STD_CCS_CostCenterAnalysisDashboard", "BILL_PERIOD_KEY", ""+$P{BILL_PERIOD_KEY} ,"PCCKEY", $C{COST_CENTER_KEY} )

88 Developing Reports
The ExternalLinkReport2Prompts definition is defined in the GlobalDefinitions.xml file that comes with QRA. This method requires defining which report you want to go to and which parameters and their values.

Creating Tabular Data Transformers 89
Creating Filters Your Data Transformer can also be used to filter the information returned by the Data Provider.
A filter does just that, it filters the data returned by the Data Provider.
The types of filters are:
! Explicit filters You use an explicit filter when you want to specify how to filter the data coming from the Data Provider. There is no user interaction in determining the values of the filter and it is applied when accessing the Data Provider.
! Interactive filters The values of these filters are specified by the user.
You can use these filters along with a prompt block to create forms like this:
You use the <Filter> element to define the column and the operator for your filter
! For Explicit filters, you use the <ExplicitValue> elements to specify the values. ! For Interactive filters, you use the <PromptedValue> elements to specify the
values.
The format of the element:
<Filter column="COLUMN_CODE" operator="operator">
<PromptedValue prompt="PROMPT_NAME">
or <ExplicitValue prompt="PROMPT_NAME">
...
</Filter>
where

90 Developing Reports
! COLUMN_CODE the code name of the column
! operator the operator to use
! PROMPT_NAME is the prompt
You can create filters:
! With only one value to be selected ! With several values to be selected
The examples are interactive filters. For Explicit filters, use the <ExplicitValue> elements.
To specify a single value filter 1 Set the following attributes of the prompt specified by the <PromptedValue>
element:
! maxOccurs="1"
! minOccurs="1"
2 You can use the following operators in the <Filter> element:
! "equal"
! "not equal"
! "greater than"
! "less than"
3 You can use one of the following formats in the Prompt declaration:
! Drop Down List
! List Box mono selection
! Radio button
To specify a multiple value filter 1 Set the following attributes of the prompt specified by the <PromptedValue>
element:
! maxOccurs to a value greater than "1"
2 You can use the following operators in the <Filter> element:
! "In list"

Creating Tabular Data Transformers 91
! "Not in list"
3 You can use one of the following formats in the Prompt declaration:
! Check box
! List Box multi selection
Example of a Filter This example shows a filter in a Data Transformer:
The Report root element <Report code="CONTRACT_DETAILED_CALLS" name="Contract Detailed Calls">
...
The Data Transformer element
<TabularDataTransformer code="CONTRACT_DETAILED_CALLS" name="Contract Detailed Calls" provider="CONTRACT_DETAILED_CALLS" maxRowsPerPage="10">
The PromptBlock element and PromptBlockElement declarations
<PromptBlock code="CONTRACT_DETAILED_CALLS" name="Transformer prompt block">
<PromptBlockElement prompt="SERVICE_NAME"/>
<PromptBlockElement prompt="UDR_TYPE_NAME"/>
</PromptBlock>>
The Filter declaration element and Filter declarations
<Filters>
<Filter column="SERVICE_NAME" operator="equal">
<PromptedValue prompt="SERVICE_NAME"/>
</Filter>
<Filter column="UDR_TYPE_NAME" operator="equal">
<PromptedValue prompt="UDR_TYPE_NAME"/>
</Filter>
</Filters>
End tags � </TabularDataTransformer> </Report>
The Prompt element for a Choice prompt
<Prompt code="UDR_TYPE_NAME" name="UDR_TYPE_NAME" type="java.lang.String" maxOccurs="1" minOccurs="0">
<ChoicePrompt>
<PromptFormat>
<CheckBox/>
</PromptFormat>
<DynamicValues displayColumn="UDR_TYPE_NAME" valueColumn="UDR_TYPE_NAME">
<TabularDataProviderRef provider="CONTRACT_DETAILED_CALLS">
<ColumnSorts>
<ColumnSort column="UDR_TYPE_NAME" order="ascending"/>
</ColumnSorts>
</TabularDataProviderRef>
</DynamicValues>
</ChoicePrompt>
</Prompt>

92 Developing Reports
The PromptFormat element and checkbox declaration
<PromptFormat>
<CheckBox/>
</PromptFormat>
The dynamic values of the Choice prompt
<DynamicValues displayColumn="UDR_TYPE_NAME" valueColumn="UDR_TYPE_NAME">
<TabularDataProviderRef provider="CONTRACT_DETAILED_CALLS">
The column sorts <ColumnSorts>
<ColumnSort column="UDR_TYPE_NAME" order="ascending"/>
</ColumnSorts>
End tags </ChoicePrompt>
</Prompt>
Declaration of the Choice prompt
<Prompt code="SERVICE_NAME" name="SERVICE_NAME" type="java.lang.String">
<ChoicePrompt>
The format <PromptFormat>
<RadioButton/>
</PromptFormat>
The dynamic values of the Choice prompt
<DynamicValues displayColumn="SERVICE_NAME" valueColumn="SERVICE_NAME">
<TabularDataProviderRef provider="CONTRACT_DETAILED_CALLS">
The column sorts <ColumnSorts>
<ColumnSort column="SERVICE_NAME" order="ascending"/>
</ColumnSorts>
End tags </TabularDataProviderRef>
</DynamicValues>
</ChoicePrompt>
</Prompt>
Filter Block It has the same comportment as the prompt block
Except that all the filters are optional and should be available for activation.

Creating Tabular Data Transformers 93
Custom Filters Your users can also filter the displayed data. You use a custom filter block to give your users the possibility to do this..
You must specify the allowed combination of filter (column + operator + operand) of your filter block.
The first time a user accesses a report with a custom filter block, the rendering is as follows:
The list of columns displayed is the list of columns having at least one declared filter.
The list of operators is the operators of filters defined for the the selected column.
When no column is selected the operator drop down list is empty.
The user can select a column then an operator, so the corresponding operand control appears.
For a Check Box prompt, the rendering is as follows:

94 Developing Reports
When the user submits the transformer, the block is filtered and the the rendering is as follows:
Users can define several filters of information this way.
Here is an example where the user has defined 3 filters:
To define custom filter you must declare the following property for each filter:
<Filter code="UDR_TARIFF_NAME_IN_LIST" column="UDR_TARIFF_NAME" operator="in_list">
<Properties>
<Property key="GROUP">true</Property>
</Properties>
<PromptedValue prompt="UDR_TARIFF_NAME_IN_LIST"/>
</Filter>
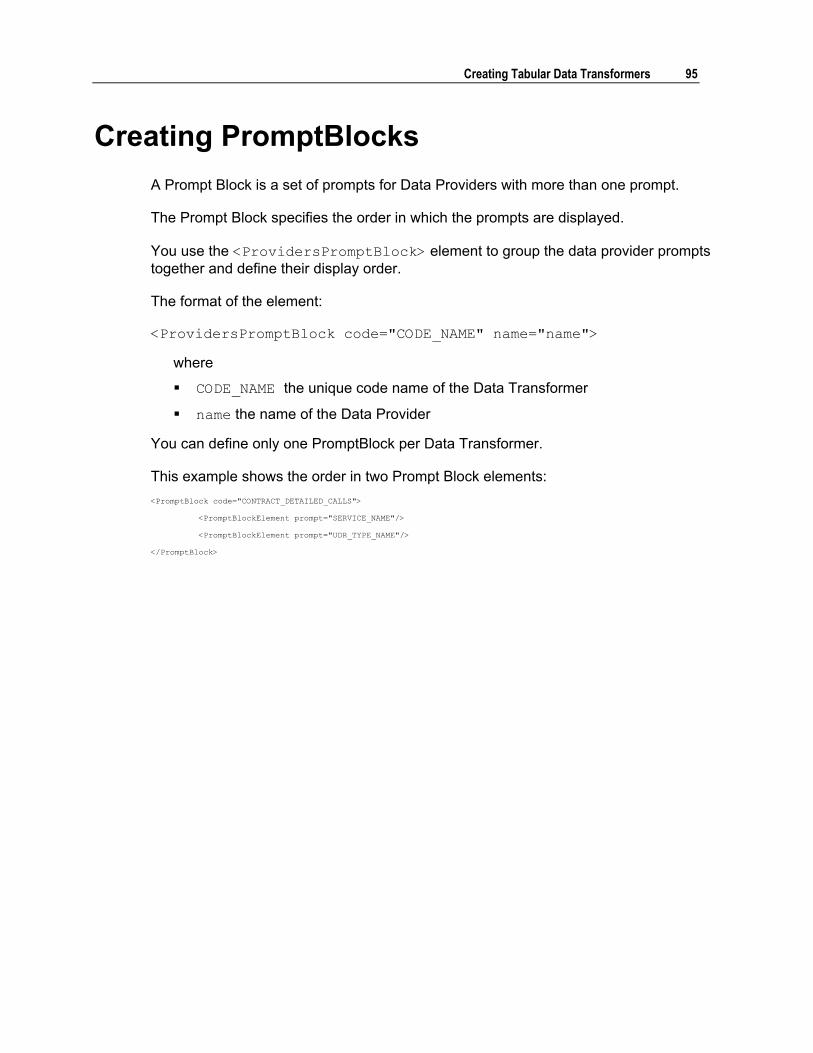
Creating Tabular Data Transformers 95
Creating PromptBlocks A Prompt Block is a set of prompts for Data Providers with more than one prompt.
The Prompt Block specifies the order in which the prompts are displayed.
You use the <ProvidersPromptBlock> element to group the data provider prompts together and define their display order.
The format of the element:
<ProvidersPromptBlock code="CODE_NAME" name="name">
where
! CODE_NAME the unique code name of the Data Transformer
! name the name of the Data Provider
You can define only one PromptBlock per Data Transformer.
This example shows the order in two Prompt Block elements: <PromptBlock code="CONTRACT_DETAILED_CALLS">
<PromptBlockElement prompt="SERVICE_NAME"/>
<PromptBlockElement prompt="UDR_TYPE_NAME"/>
</PromptBlock>

96 Developing Reports
Specifying Sorts Most of the time, the column sorting is done with the Data Provider. The specified sort is usually appropriate for most reports. However, you can also use a Data Transformer to sort columns.
You can also use the sort feature to have two or more Tabular Data Transformers with different sorts using data from the same Data Provider.
Specifying the Default Column Sort You use the <ColumnSort> element to specify the name of the column and the order of the sort.
The format of the element:
<ColumnSort column="COLUMN_CODE" order="sort_order"/>
where
! COLUMN_CODE the code name of the column
! sort_order the order of the sort
Possible values: ascending
descending
This example shows how to sort the BUDR_VOLUME column declared in either the data provider or in the data transformer.
The Data Transformer element
<TabularDataTransformer code="CONTRACT_DETAILED_CALLS" name="Contract Detailed Calls" provider="CONTRACT_DETAILED_CALLS" maxRowsPerPage="10">
The Columns declaration element and column declarations
<Columns>
<Column code="SERVICE_NAME"/>
...
</Columns>
The Sorts declaration element and Column sort declarations
<Sorts>
�
<ColumnSorts>
<ColumnSort column="BUDR_VOLUME" order="ascending"/>
</ColumnSorts>
</Sorts>
End tags </ProvidersPromptBlock>
�
</Report>

Creating Tabular Data Transformers 97
Specifying Interactive Sorting Your Tabular Data Transformer can define columns with interactive sorting.
Specifying Basic Interactive Sorting
You use the <SortableColumns> element to define the maximum number of column sorts and the <SortableColumn> element to specify the columns that can be sorted.
The format of the element:
<SortableColumns maxColumnSorts="number">
where
! number the maximum number of column sorts
In this example, the columns used in the data transformer come from the data provider.
The Data Transformer element
<TabularDataTransformer code="ContractInvoiceOverview" name="Contract Detailed Calls" provider="ContractInvoiceOverview">
�
The Sorts declaration element and the SortableColumn declarations
<Sorts>
<SortableColumns maxColumnSorts="1">
<SortableColumn column="CONTRACT_NAME"/>
<SortableColumn column="MEMBER_NAME"/>
<SortableColumn column="LEVEL_NAME"/>
<SortableColumn column="SERVICE_CHARGES"/>
<SortableColumn column="USAGE_CHARGES"/>
<SortableColumn column="OTHER_CHARGES"/>
<SortableColumn column="TOTAL_TAX"/>
<SortableColumn column="TOTAL_AMOUNT"/>
</SortableColumns>
�
End tags </Sorts>
�
</TabularDataTransformer>
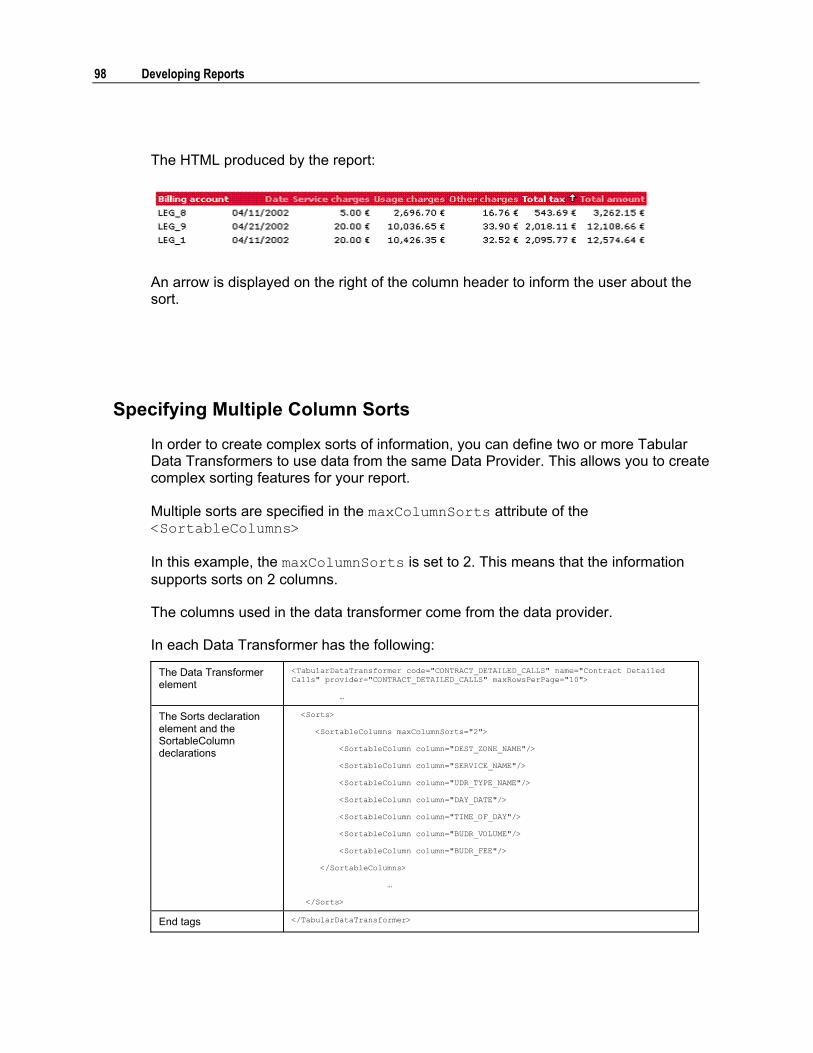
98 Developing Reports
The HTML produced by the report:
An arrow is displayed on the right of the column header to inform the user about the sort.
Specifying Multiple Column Sorts
In order to create complex sorts of information, you can define two or more Tabular Data Transformers to use data from the same Data Provider. This allows you to create complex sorting features for your report.
Multiple sorts are specified in the maxColumnSorts attribute of the <SortableColumns>
In this example, the maxColumnSorts is set to 2. This means that the information supports sorts on 2 columns.
The columns used in the data transformer come from the data provider.
In each Data Transformer has the following:
The Data Transformer element
<TabularDataTransformer code="CONTRACT_DETAILED_CALLS" name="Contract Detailed Calls" provider="CONTRACT_DETAILED_CALLS" maxRowsPerPage="10">
�
The Sorts declaration element and the SortableColumn declarations
<Sorts>
<SortableColumns maxColumnSorts="2">
<SortableColumn column="DEST_ZONE_NAME"/>
<SortableColumn column="SERVICE_NAME"/>
<SortableColumn column="UDR_TYPE_NAME"/>
<SortableColumn column="DAY_DATE"/>
<SortableColumn column="TIME_OF_DAY"/>
<SortableColumn column="BUDR_VOLUME"/>
<SortableColumn column="BUDR_FEE"/>
</SortableColumns>
�
</Sorts>
End tags </TabularDataTransformer>
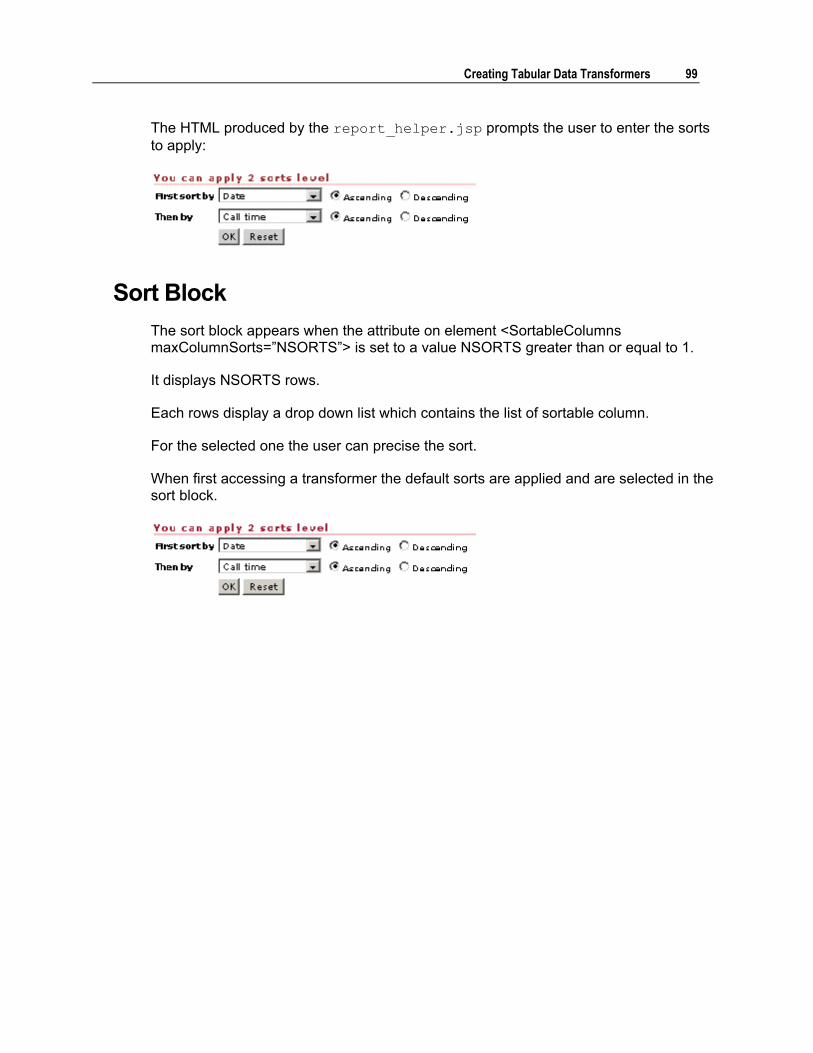
Creating Tabular Data Transformers 99
The HTML produced by the report_helper.jsp prompts the user to enter the sorts to apply:
Sort Block The sort block appears when the attribute on element <SortableColumns maxColumnSorts=�NSORTS�> is set to a value NSORTS greater than or equal to 1.
It displays NSORTS rows.
Each rows display a drop down list which contains the list of sortable column.
For the selected one the user can precise the sort.
When first accessing a transformer the default sorts are applied and are selected in the sort block.

100 Developing Reports
Exporting Data You can use the Export As feature to allow your users to export the data in TabularDataTransformer or MatrixDataTransformer. They can export the data in the following formats:
! XML ! CSV
When available, the Transformer title zone displays a clickable button corresponding to the available formats.
An example of a transformer title zone with XML and CSV exports available:
Exporting as XML To allow you users to download the data as XML, you specify the EXPORT_AS_XML as a property of your transformer.
When specified, the following button appears on the title zone:
When clicked, the server generates an XML file corresponding to the data displayed in the transformer.
This button is always displayed on the right corner of the transformer title zone. If the CSV download is also available to users, the CSV button is to the left of the XML button.
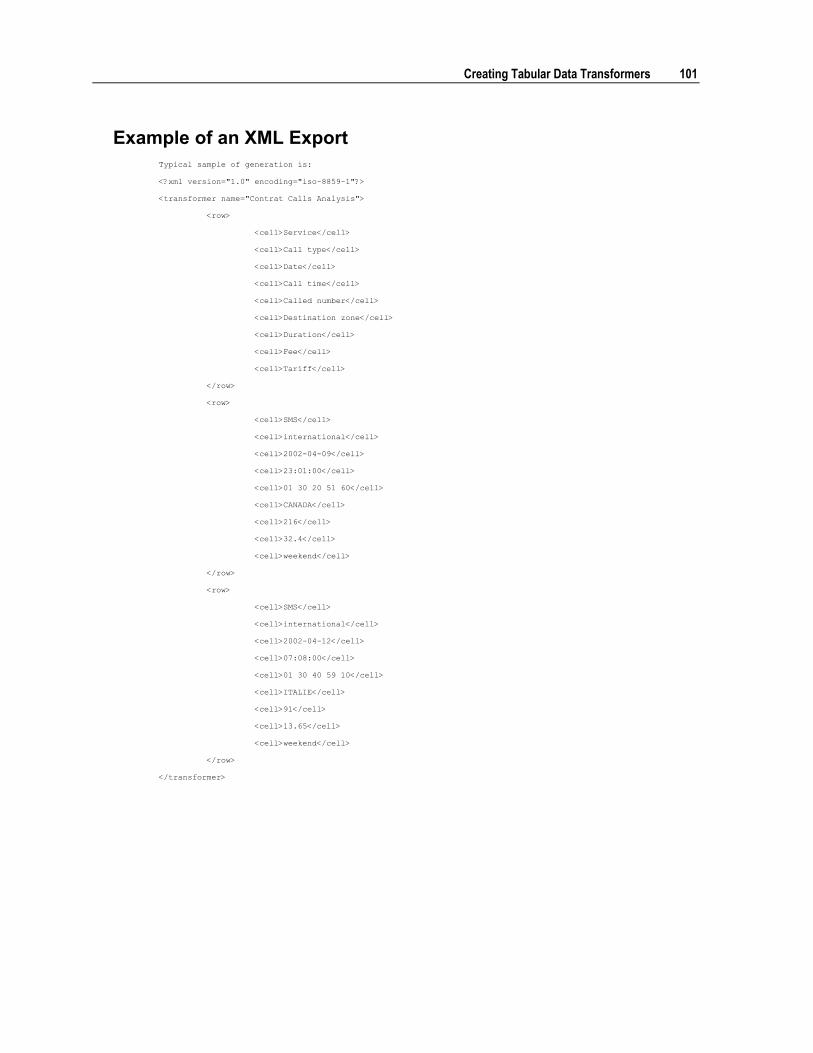
Creating Tabular Data Transformers 101
Example of an XML Export Typical sample of generation is:
<?xml version="1.0" encoding="iso-8859-1"?>
<transformer name="Contrat Calls Analysis">
<row>
<cell>Service</cell>
<cell>Call type</cell>
<cell>Date</cell>
<cell>Call time</cell>
<cell>Called number</cell>
<cell>Destination zone</cell>
<cell>Duration</cell>
<cell>Fee</cell>
<cell>Tariff</cell>
</row>
<row>
<cell>SMS</cell>
<cell>international</cell>
<cell>2002-04-09</cell>
<cell>01 30 20 51 60</cell>
<cell>CANADA</cell>
<cell>216</cell>
<cell>32.4</cell>
<cell>weekend</cell>
</row>
<row>
<cell>SMS</cell>
<cell>international</cell>
<cell>2002-04-12</cell>
<cell>07:08:00</cell>
<cell>01 30 40 59 10</cell>
<cell>ITALIE</cell>
<cell>91</cell>
<cell>13.65</cell>
<cell>weekend</cell>
</row>
</transformer>
<cell>23:01:00</cell>

102 Developing Reports
Exporting as CSV To allow you users to download the data as CSV, you specify the EXPORT_AS_CSV as a property of your TabularDataTransformer or MatrixDataTransformer.
When specified, the following button appears on the title zone:
When clicked, the server generates a CSV file corresponding to the data displayed in the transformer.
This button is always displayed to the left of the Download as XML button when both are available.
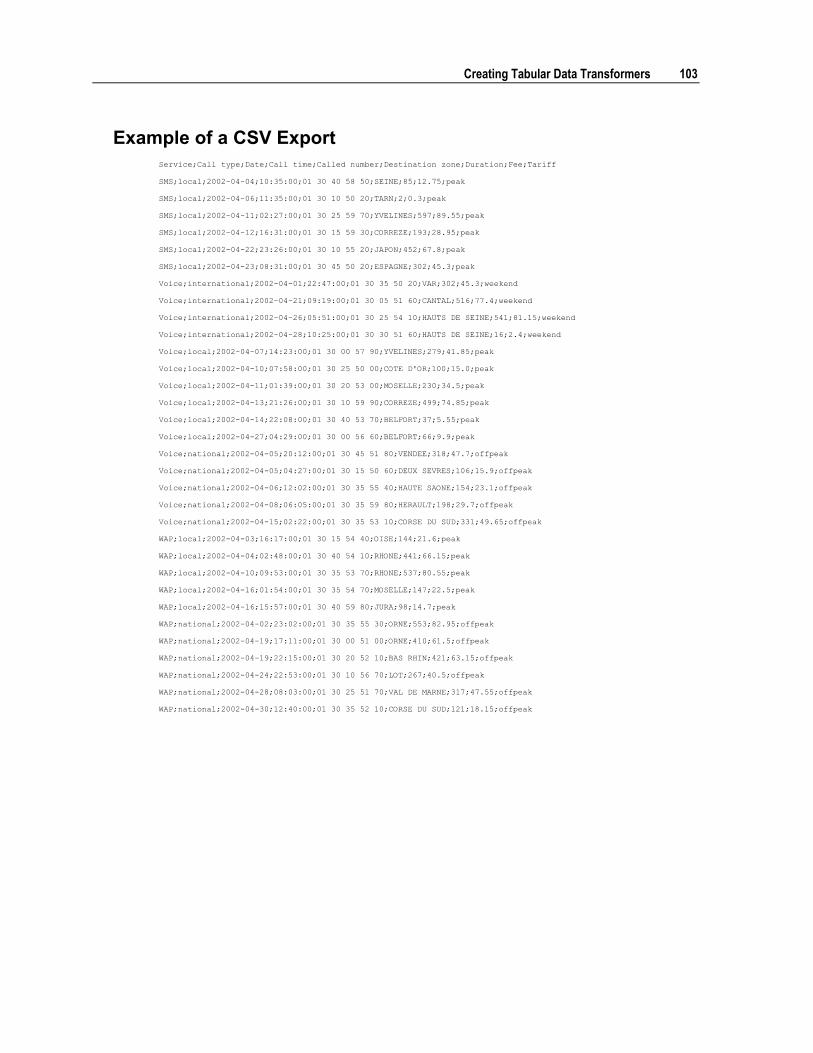
Creating Tabular Data Transformers 103
Example of a CSV Export Service;Call type;Date;Call time;Called number;Destination zone;Duration;Fee;Tariff
SMS;local;2002-04-04;10:35:00;01 30 40 58 50;SEINE;85;12.75;peak
SMS;local;2002-04-06;11:35:00;01 30 10 50 20;TARN;2;0.3;peak
SMS;local;2002-04-11;02:27:00;01 30 25 59 70;YVELINES;597;89.55;peak
SMS;local;2002-04-12;16:31:00;01 30 15 59 30;CORREZE;193;28.95;peak
SMS;local;2002-04-22;23:26:00;01 30 10 55 20;JAPON;452;67.8;peak
SMS;local;2002-04-23;08:31:00;01 30 45 50 20;ESPAGNE;302;45.3;peak
Voice;international;2002-04-01;22:47:00;01 30 35 50 20;VAR;302;45.3;weekend
Voice;international;2002-04-21;09:19:00;01 30 05 51 60;CANTAL;516;77.4;weekend
Voice;international;2002-04-26;05:51:00;01 30 25 54 10;HAUTS DE SEINE;541;81.15;weekend
Voice;international;2002-04-28;10:25:00;01 30 30 51 60;HAUTS DE SEINE;16;2.4;weekend
Voice;local;2002-04-07;14:23:00;01 30 00 57 90;YVELINES;279;41.85;peak
Voice;local;2002-04-10;07:58:00;01 30 25 50 00;COTE D'OR;100;15.0;peak
Voice;local;2002-04-11;01:39:00;01 30 20 53 00;MOSELLE;230;34.5;peak
Voice;local;2002-04-13;21:26:00;01 30 10 59 90;CORREZE;499;74.85;peak
Voice;local;2002-04-14;22:08:00;01 30 40 53 70;BELFORT;37;5.55;peak
Voice;local;2002-04-27;04:29:00;01 30 00 56 60;BELFORT;66;9.9;peak
Voice;national;2002-04-05;20:12:00;01 30 45 51 80;VENDEE;318;47.7;offpeak
Voice;national;2002-04-05;04:27:00;01 30 15 50 60;DEUX SEVRES;106;15.9;offpeak
Voice;national;2002-04-06;12:02:00;01 30 35 55 40;HAUTE SAONE;154;23.1;offpeak
Voice;national;2002-04-08;06:05:00;01 30 35 59 80;HERAULT;198;29.7;offpeak
Voice;national;2002-04-15;02:22:00;01 30 35 53 10;CORSE DU SUD;331;49.65;offpeak
WAP;local;2002-04-03;16:17:00;01 30 15 54 40;OISE;144;21.6;peak
WAP;local;2002-04-04;02:48:00;01 30 40 54 10;RHONE;441;66.15;peak
WAP;local;2002-04-10;09:53:00;01 30 35 53 70;RHONE;537;80.55;peak
WAP;local;2002-04-16;01:54:00;01 30 35 54 70;MOSELLE;147;22.5;peak
WAP;local;2002-04-16;15:57:00;01 30 40 59 80;JURA;98;14.7;peak
WAP;national;2002-04-02;23:02:00;01 30 35 55 30;ORNE;553;82.95;offpeak
WAP;national;2002-04-19;17:11:00;01 30 00 51 00;ORNE;410;61.5;offpeak
WAP;national;2002-04-19;22:15:00;01 30 20 52 10;BAS RHIN;421;63.15;offpeak
WAP;national;2002-04-24;22:53:00;01 30 10 56 70;LOT;267;40.5;offpeak
WAP;national;2002-04-28;08:03:00;01 30 25 51 70;VAL DE MARNE;317;47.55;offpeak
WAP;national;2002-04-30;12:40:00;01 30 35 52 10;CORSE DU SUD;121;18.15;offpeak


C H A P T E R 6
Creating Matrix Data Transformers
In This Section
About Matrix Data Transformers............................................. 106 Differences Between Matrix and Tabular Data Transformers. 107 Working with Dimensions ....................................................... 108 Working with Measures .......................................................... 110 Examples ................................................................................ 111

106 Developing Reports
About Matrix Data Transformers A Matrix Data Transformer is based on a TabularDataProvider and has:
! A prompt block used for interactive filters on dimension values ! Charts ! Sorts on dimension values ! Formats and expressions on dimension values and measures
The matrix block presents the information in a 2 dimension matrix.
! The row dimensions area ! The column dimensions area ! The measures area

Creating Matrix Data Transformers 107
Differences Between Matrix and Tabular Data Transformers
! Format expressions Only values to format can be changed when using expressions to manage format.
! Sorts Dimensions must always be sorted so that they can be crossed.
By default, a dimension break has an ascending sort on its key column.
You can specify if the dimension is sortable and which column break to use in the Transformer.
! Pagination Matrix Data Transformers do not support multiple pages.
! Custom Filters Are not available for Matrix Data Transformers.
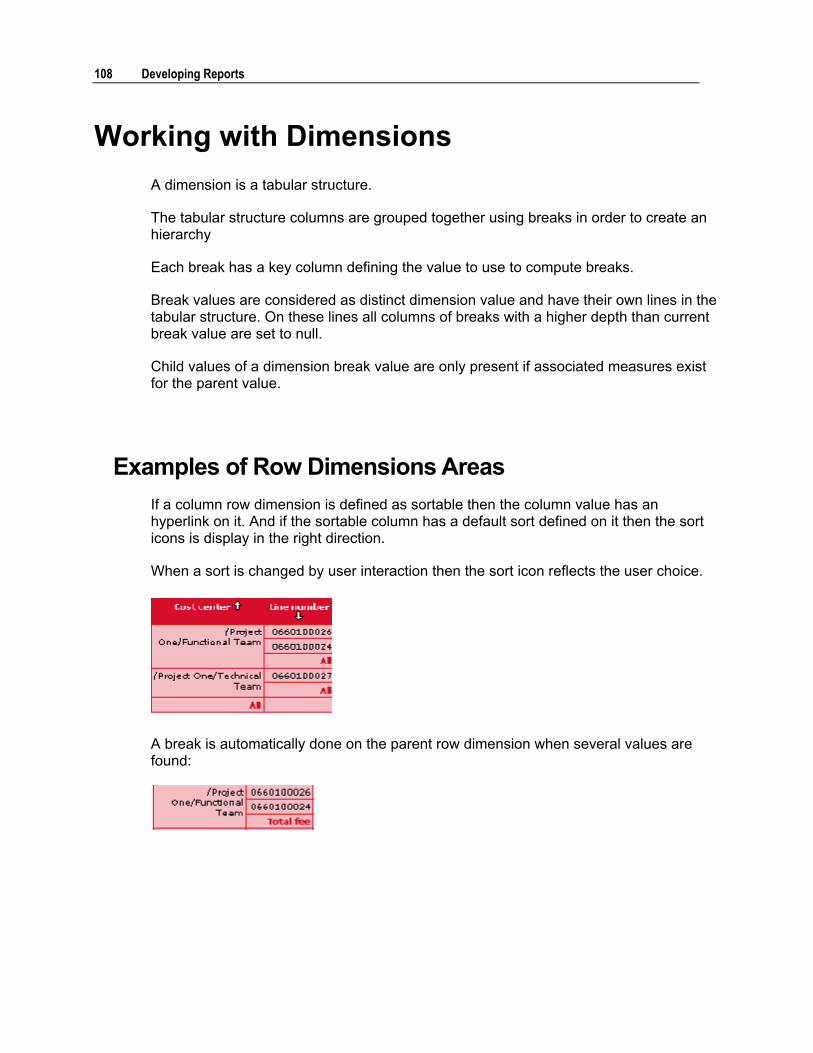
108 Developing Reports
Working with Dimensions A dimension is a tabular structure.
The tabular structure columns are grouped together using breaks in order to create an hierarchy
Each break has a key column defining the value to use to compute breaks.
Break values are considered as distinct dimension value and have their own lines in the tabular structure. On these lines all columns of breaks with a higher depth than current break value are set to null.
Child values of a dimension break value are only present if associated measures exist for the parent value.
Examples of Row Dimensions Areas If a column row dimension is defined as sortable then the column value has an hyperlink on it. And if the sortable column has a default sort defined on it then the sort icons is display in the right direction.
When a sort is changed by user interaction then the sort icon reflects the user choice.
A break is automatically done on the parent row dimension when several values are found:

Creating Matrix Data Transformers 109
Column Dimension Area
A break is automatically done on the parent column dimension when several values are found:

110 Developing Reports
Working with Measures A measure is a provider column and an aggregation operation.
The aggregation operations are the same as available on TabularDataTransformer:
OPERATION
SUPPORTED INPUT TYPES
OUTPUT TYPES
DESCRIPTION
Min Double
Long
Timestamp
Date
Time
Double
Long
Timestamp
Date
Time
null considered lesser than any non null value and equal to null
Max Double
Long
Timestamp
Date
Time
Double
Long
Timestamp
Date
Time
null considered lesser than any non null value and equal to null
Sum Double
Long
Double
Long
returns null if any of the values to aggregate is null
Average Double
Long
Double
Long
returns null if any of the values to aggregate is null
Count Any type Long returns number of aggregated PROVIDER lines
independent of specified column, null values are counted
it is NOT a count distinct
it does NOT count matrix cells
Examples of Measure Areas
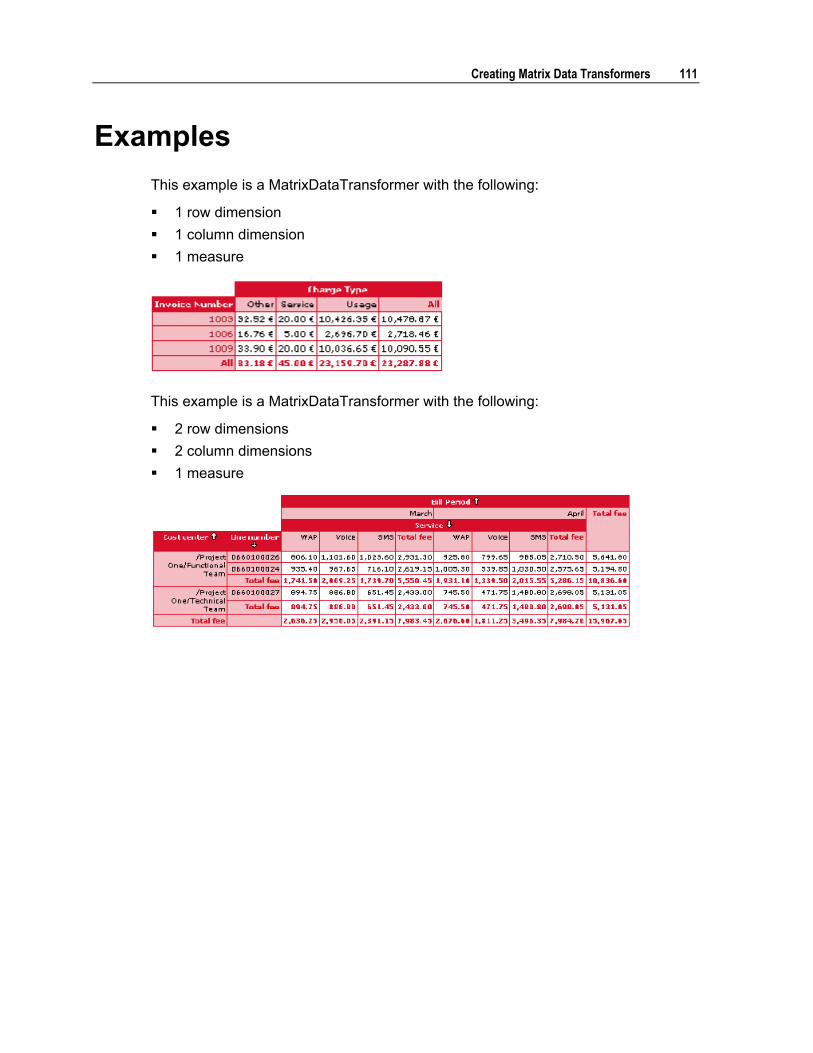
Creating Matrix Data Transformers 111
Examples This example is a MatrixDataTransformer with the following:
! 1 row dimension ! 1 column dimension ! 1 measure
This example is a MatrixDataTransformer with the following:
! 2 row dimensions ! 2 column dimensions ! 1 measure

112 Developing Reports
This example is a MatrixDataTransformer with the following:
! 2 row dimensions ! 2 column dimensions ! 2 measures
When there is more than one measure defined then the measure headers are display and repeated for each column value.
By default when there are 2 measures the display of measure is in line
To display each measure in the column, define the property MEASURE_IN_COLUMN and set it to "true".
This example is a MatrixDataTransformer with the following:
! 1 row dimension ! 1 column dimension ! 2 measures
When there is more than one measure defined then the measure headers are display and repeated for each column value.
In this sample Amount and Duration are repeated for each Charge Type value.
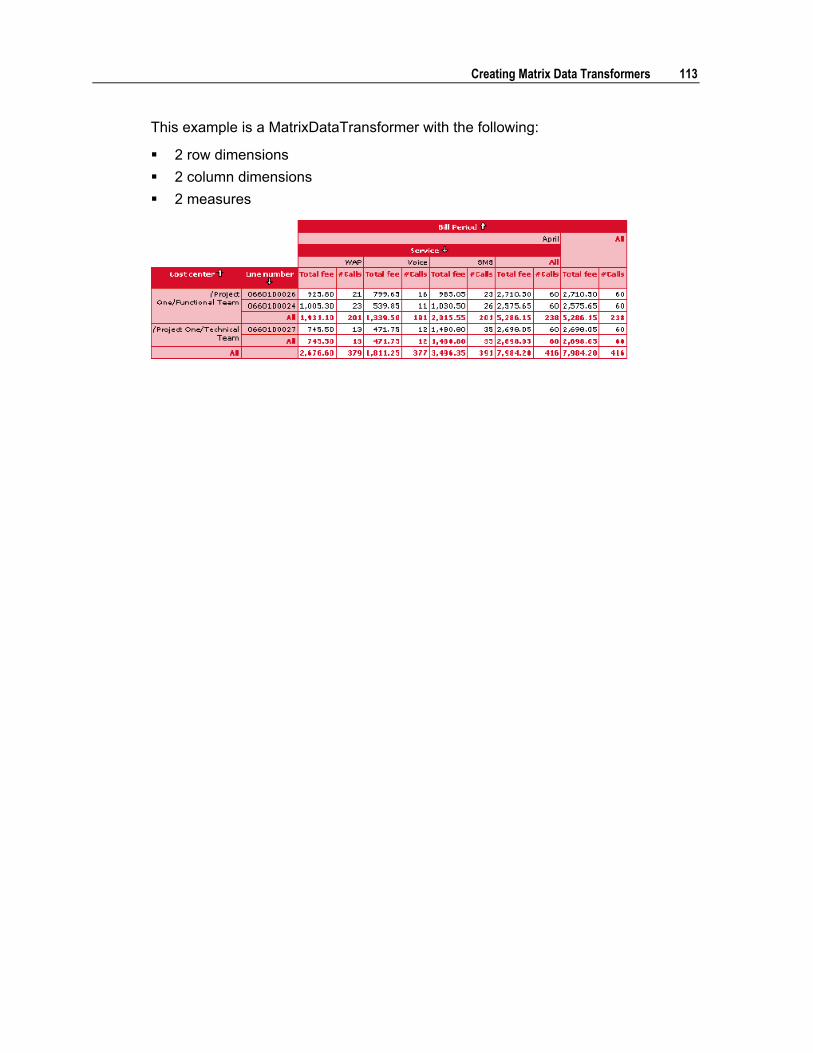
Creating Matrix Data Transformers 113
This example is a MatrixDataTransformer with the following:
! 2 row dimensions ! 2 column dimensions ! 2 measures

C H A P T E R 7
Creating Charts
In This Section
About Creating Charts ............................................................ 116 Creating the Chart Element .................................................... 117 Specifying the Chart Styles..................................................... 119 Specifying the Chart Data Set ................................................ 121 Specifying the Axes ................................................................ 123 Sample Charts ........................................................................ 124
116 Developing Reports
About Creating Charts The chart is a visual representation of the data which is retrieved sorted and filtered in the Tabular or Matrix Data Transformer. The Chart Engine is responsible for generating these charts. It is based on the KavaChart java library.
You can create charts for the following:
! Detail when there is no master ! Detail of a master detail ! Summary of a master
Creating a chart involves:
! Creating the Chart element ! Specifying the type of chart ! Specifying the size ! Specifying the titles ! Specifying the type of graphic file ! Specifying the tooltips
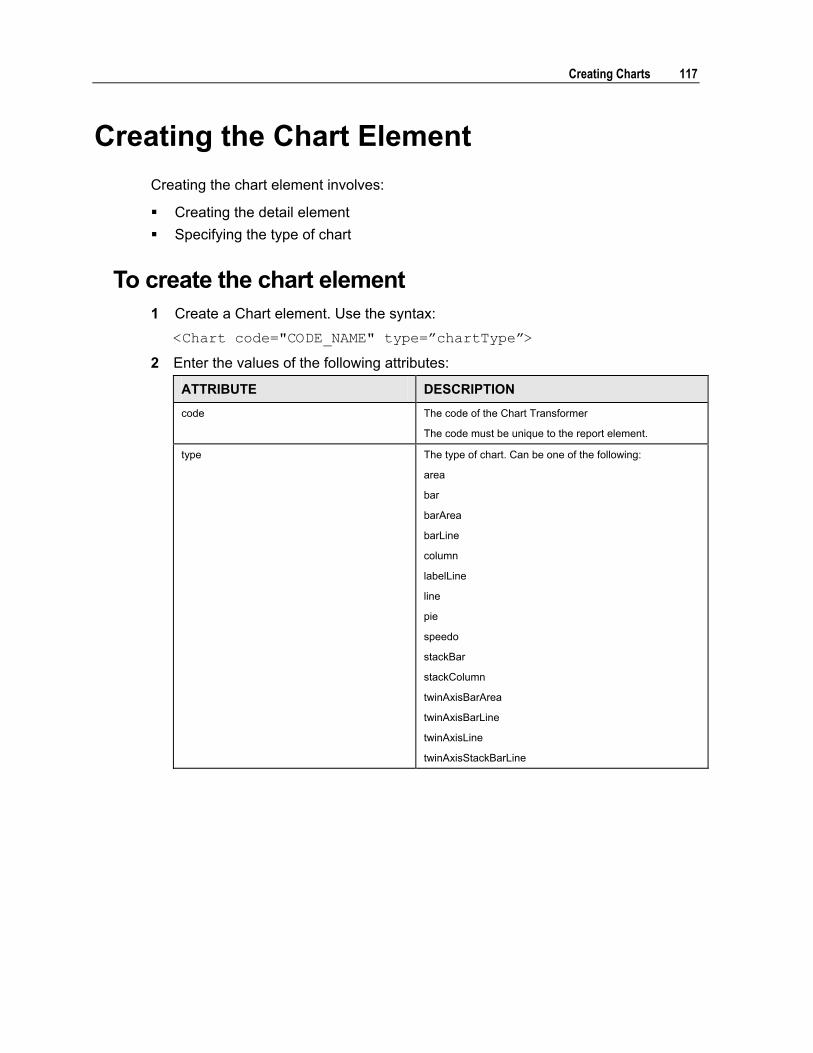
Creating Charts 117
Creating the Chart Element Creating the chart element involves:
! Creating the detail element ! Specifying the type of chart
To create the chart element 1 Create a Chart element. Use the syntax:
<Chart code="CODE_NAME" type=�chartType�>
2 Enter the values of the following attributes:
ATTRIBUTE DESCRIPTION
code The code of the Chart Transformer
The code must be unique to the report element.
type The type of chart. Can be one of the following:
area
bar
barArea
barLine
column
labelLine
line
pie
speedo
stackBar
stackColumn
twinAxisBarArea
twinAxisBarLine
twinAxisLine
twinAxisStackBarLine

118 Developing Reports
To specify the size of the chart
In the <chart> element, enter the following attributes:
! height to specify the height in pixels ! width to specify the width in pixels
Specifying the Titles of the Chart
In the <chart> element, enter the following attributes:
! title to specify the title of the chart ! subtitle to specify the subtitle of the chart
To specify the image file format
In the <chart> element, enter the following attributes:
! codec to specify the type of image file to create ! contentType to specify the content type of the image file
You can enter one of the following codec/content type:
ENCODER NAME
CONTENT TYPE
DESCRIPTION
j_png image/png PNG lossless compression.
jpeg image/jpeg JDK native lossy jpeg encoder
j_jpeg image/jpeg JIMI java lossy jpeg encoder (slower than jpeg, but may be useful in case of video hardware dependency problems)
You can set a default file format in the Chart properties file. This attribute overrides the default format.
Creating Charts 119
Specifying the Chart Styles The Chart engine applies the styles defined for a chart. You can specify the default and chart specific styles for the following elements:
! Title ! Series properties ! Chart Background ! Plot area (size, colors, fonts, �) ! Axis ! Legend (position, formatting �) ! Tooltip
The styles of a chart are declared in the styles.properties file. The property files are located in <home_dir>channels/WEB-INF/classes/nmycfg/qra/chart.
In this file you specify:
! Default styles for all charts ! Default styles per chart type ! Specific styles
The Chart engine uses the same order when applying the styles to your chart.
In order to become familiar with chart styles and how they work, we suggest modifying the default styles in the samples.
For the list of Chart engine styles, refer to the Chart Style Reference Appendix in this manual.
To set the styles of a chart
In the <chart> element, enter the following attributes:
! style to specify the Specific styles declared in styles.properties The specified styles override the default styles
The styles must be separated by a space

120 Developing Reports
Example of a <chart> element with a style attribute specifying the following styles:
! noLegend ! textLabelsOn
<Chart code="CHARTPIE" name="pie" type="pie" codec="jpeg" height="250" width="300" style="noLegend textLabelsOn">

Creating Charts 121
Specifying the Chart Data Set Depending on the chart type, you may need to use several Datasets. For instance, you may need more than one dataset when you compare several columns returning the same type of data.
You must specify a dataset title for each data set.
On a chart type which supports several Y Axes, you can declare the dataset using the second axis called YAux. In order to use this second axis, you set the useAuxAxis attribute to "true"
Example of a Chart Data Set Dataset tag <Datasets>
Fee Data Set <Dataset title="Fee">
<DoubleSeries code="yValues">
<Column code="S_FEE"/>
</DoubleSeries>
<StringSeries code="Labels">
<Column code="S_FEE"/>
</StringSeries>
<StringSeries code="Links">
<Column code="COST_CENTER_PATH" formatCode="link"/>
</StringSeries>
</Dataset>
Number of calls Dataset
<Dataset title="#Calls" useAuxAxis="true">
<DoubleSeries code="yValues">
<Column code="N_CALLS"/>
</DoubleSeries>
<StringSeries code="Labels">
<Column code="N_CALLS"/>
</StringSeries>
<StringSeries code="Links">
<Column code="COST_CENTER_PATH" formatCode="link"/>
</StringSeries>
</Dataset>
Closing tag </Datasets>

122 Developing Reports
To define the Y values
You define the column code which is used to retrieve the values. Use the syntax:
<DoubleSeries code="yValues">
<Column code="COLUMN_CODE"/>
</DoubleSeries>
To define the labels for each Y value
You define the column code which is used to retrieve the labels of the values. Use the syntax:
<StringSeries code="yValues">
<Column code="COLUMN_CODE"/>
</StringSeries>
To define hyperlinks for each Y value
You define the column code which is used to retrieve the labels of the values.
You specify the formatCode attribute as a link and specify the column which has been defined in the data transformer to generate hyperlinks for each data of the chart.
<StringSeries code="Links">
<Column code="COLUMN_CODE" formatCode="link"/>
</StringSeries>
Creating Charts 123
Specifying the Axes
To define the title of the X axis
You can define the label by defining which column of the data transformer provides the labels. Use the syntax:
<XAxis title="Title of the X Axis">
<Labels>
<Column code="COLUMN_NAME"/>
</Labels>
</XAxis>
To define the title of the Y axis
You can define the title of the Y axis by setting the title attribute. Use the syntax:
<YAxis title="My Y Axis Title"/>
To define the title of the YAux axis
You can define the title of the YAux axis by setting the title attribute.
YAux can be declared when the chart supports 2 vertical Y axes. Use the format:
<AuxAxis title="My Title"/>
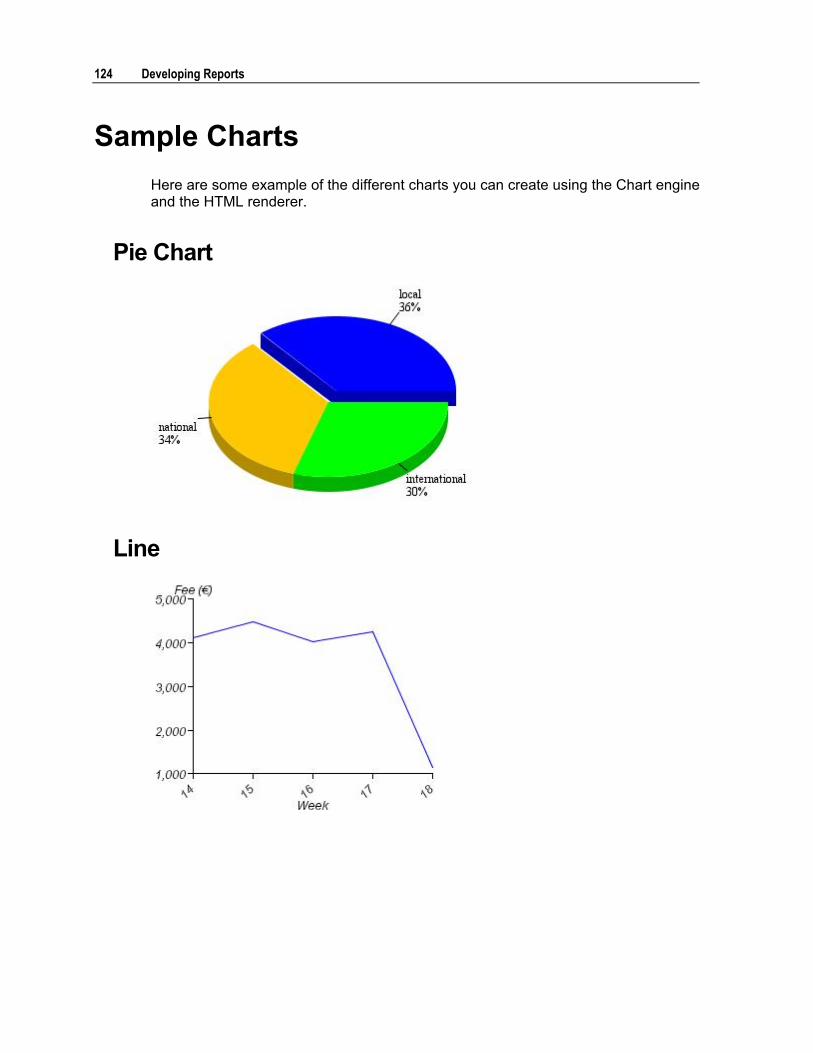
124 Developing Reports
Sample Charts Here are some example of the different charts you can create using the Chart engine and the HTML renderer.
Pie Chart
Line

Creating Charts 125
Vertical Bar Chart
Horizontal Bar Chart

126 Developing Reports
Combined Bar and Line Chart

Creating Charts 127
2 Dimension Column

128 Developing Reports
Vertical Column Bar Chart
Stacked Horizontal Bar Chart

Creating Charts 129
Chart Navigation Block The block allows the user to view the hidden defined chart attached to a transformer.


C H A P T E R 8
Working with Reports
In This Section
About Working with Reports ................................................... 132 Specifying the Layout ............................................................. 133 Localizing Reports .................................................................. 143 Customizing Reports .............................................................. 145 Reloading Reports .................................................................. 147
132 Developing Reports
About Working with Reports Once you have completed creating your Data Accessors and Data Transformers, you can focus on making the report meet your user's needs.
Working with reports involves:
! Specifying the display format ! Localizing the display ! Customizing the report renderer ! Reloading the report definition file

Working with Reports 133
Specifying the Layout Once you have created your and declared the report definition file, you now need to decide what your report will look like.
Here are some examples of reports you can create using the QRA.
These examples are divided into the following categories:
! MonoTransformer reports These reports display data from a single data transformer. They may have more than one way of displaying data, but the source of the data remains a single data transformer. For instance, for a given transformer, the report may display the data as a pie chart and a table.
! MultiTransformer reports These reports display data from more than one data transformer. By using different data transformers, the reports can present a dashboard of information to give users a more complete and exhaustive view of their account. The report_view.jsp uses the NB_TRANSFORMER_PER_LINE property declared in the report definition file to determine the number of transformers displayed per line.
Along with these categories, there is a utility report for displaying printer-friendly reports.
MonoTransformer Report Templates
Simple Report
This report displays only one vertical tabular block based on one transformer.
An example of this template:

134 Developing Reports
Chart and Data Reports
This report displays a vertical tabular block and the chart based on the same transformer.
An example of this template:
MultiChart Reports
These reports have several charts and the detail of the same transformer.

Working with Reports 135
Display MultiCharts
When all charts are declared with the attribute isHidden=false, the chart navigation bar is not shown and all the charts are displayed.
The charts are displayed before the detail block.

136 Developing Reports
Interactive Multicharts
When at least one chart is declared as hidden (attribute isHidden=true) the visible charts are displayed and a chart navigation bar is displayed underneath the chart to let the user select the hidden charts.

Working with Reports 137
Master/Detail Reports
This report is a master/detail(chart) report

138 Developing Reports
Summary and Master/Detail Report

Working with Reports 139
MultiTransformer Report Templates
Dashboard Reports
This is an example of a report with:
! 6 transformers ! NB_TRANSFORMER_PER_LINE=2
If no NB_TRANSFORMER_PER_LINE is specified, the HTML Renderer displays 2 transformers per line.
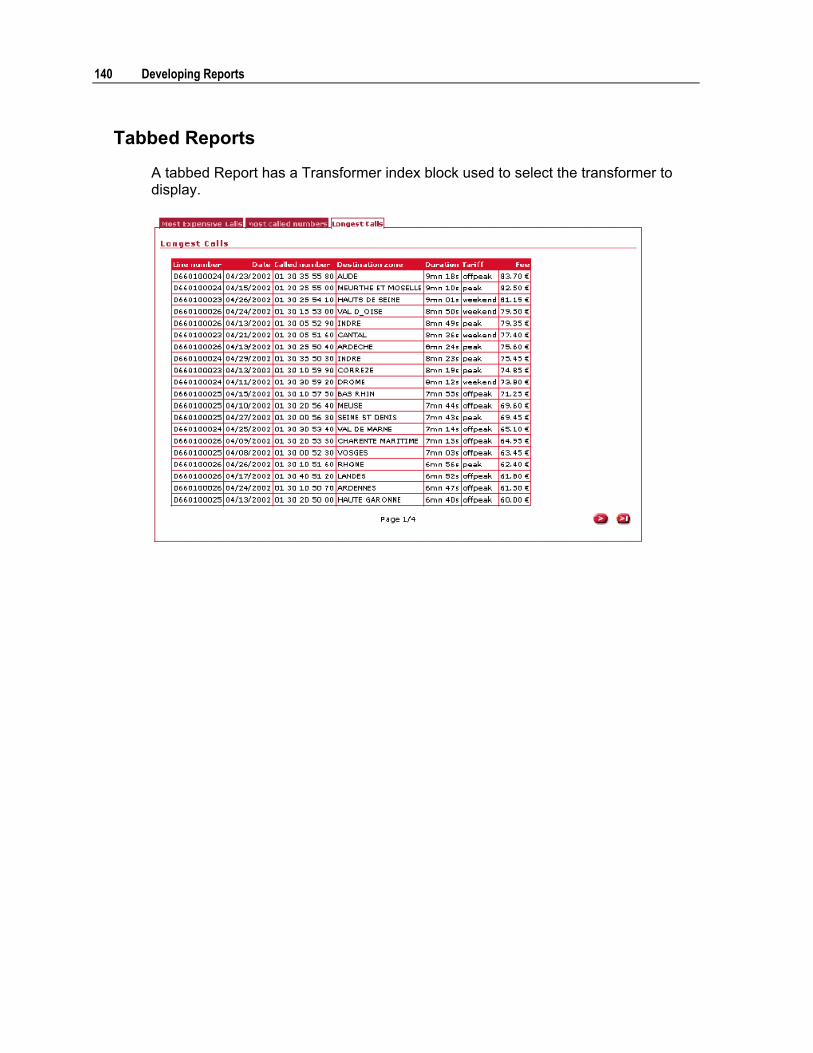
140 Developing Reports
Tabbed Reports
A tabbed Report has a Transformer index block used to select the transformer to display.

Working with Reports 141
Printer Friendly The default report view lets the user interact with the report via prompts, filters, sorts, pages, hyperlinks.
At any time, the user may click on a link for a printer-friendly version of the report. This is a link represented by a printer as seen in the example.This removes the interactive items (menus, title, header, footer) from the report and presents a version that is ready to print.
Normal View

142 Developing Reports
Printer Friendly View
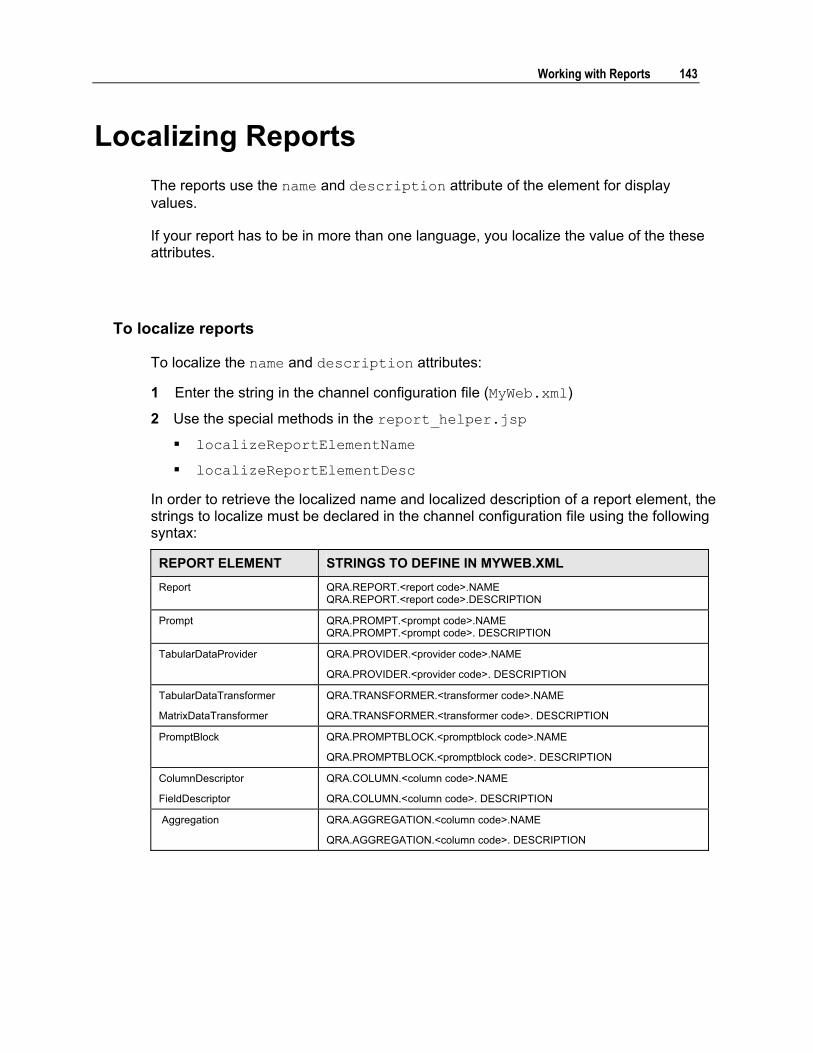
Working with Reports 143
Localizing Reports The reports use the name and description attribute of the element for display values.
If your report has to be in more than one language, you localize the value of the these attributes.
To localize reports
To localize the name and description attributes:
1 Enter the string in the channel configuration file (MyWeb.xml)
2 Use the special methods in the report_helper.jsp
! localizeReportElementName
! localizeReportElementDesc
In order to retrieve the localized name and localized description of a report element, the strings to localize must be declared in the channel configuration file using the following syntax:
REPORT ELEMENT STRINGS TO DEFINE IN MYWEB.XML
Report QRA.REPORT.<report code>.NAME QRA.REPORT.<report code>.DESCRIPTION
Prompt QRA.PROMPT.<prompt code>.NAME QRA.PROMPT.<prompt code>. DESCRIPTION
TabularDataProvider QRA.PROVIDER.<provider code>.NAME
QRA.PROVIDER.<provider code>. DESCRIPTION
TabularDataTransformer
MatrixDataTransformer
QRA.TRANSFORMER.<transformer code>.NAME
QRA.TRANSFORMER.<transformer code>. DESCRIPTION
PromptBlock QRA.PROMPTBLOCK.<promptblock code>.NAME
QRA.PROMPTBLOCK.<promptblock code>. DESCRIPTION
ColumnDescriptor
FieldDescriptor
QRA.COLUMN.<column code>.NAME
QRA.COLUMN.<column code>. DESCRIPTION
Aggregation QRA.AGGREGATION.<column code>.NAME
QRA.AGGREGATION.<column code>. DESCRIPTION

144 Developing Reports
For example, you enter the following in MyWeb.xml to localize the name of the Call Analysis Dashboard report.
The string to localize is QRA.REPORT.STD_INV_CallAnalysisDashboard.NAME
The entry in MyWeb.xml is: <string name="QRA.REPORT.STD_INV_CallAnalysisDashboard.NAME">
<value name="en">Call Analysis Dashboard</value>
<value name="fr">Tableau de bord d'analyse des appels</value>
</string>
Working with Reports 145
Customizing Reports You can enhance and customize the standard reports.
Enhancing your reports involves:
! Customizing the report_view.jsp used to display the reports ! Adding properties to report elements
Customizing the Report View JSP The report_view.jsp is the jsp which handles the display of the data transformer and prompt blocks.
This JSP can be modified to meet you needs or can be used as a template to help you get started with writing your own reports.
You can modify this file by doing the following:
! Change formatting ! Change position of elements ! Add your company visual identity ! Generate and display charts
You can also add additional properties to report elements
Adding Properties to Report Elements You can add your own properties to any report element. You can use this to customize your reports to fit your Telco Service Manager requirements.
An example is in the CONTRACT_DETAILED_CALLS report. The CONTRACT_DETAILED_CALLS Data Transformer has an additional property called ALTERNATE_ROWS.
The Data Transformer alternates the color of the rows when the ALTERNATE_ROWS property exists and is set. <TabularDataTransformer code="CONTRACT_DETAILED_CALLS" provider="CONTRACT_DETAILED_CALLS" maxRowsPerPage="10">
<Properties>
<Property key="ALTERNATE_ROWS">true</Property>
</Properties>

146 Developing Reports
To access and use a property, you use the following method:
getProperty("ALTERNATE_ROWS")
For example you can retrieve the value of the property implementing the following code: �
TabularDataTransformer transformer ;
�
System.out.println(�Value of the Alternate Rows Property on element Transformer: � + transformer.getProperty("ALTERNATE_ROWS"));
�

Working with Reports 147
Reloading Reports When the Telco Service Manager starts, the report configuration file is loaded into memory. Once this file is loaded, changes made to this file are not taken into account. This presents a problem because when you develop an Account Management Application, you often have to modify the contents of this file.
In order to keep you from having to stop and restart your application server every time you modify this file, you can use a special JSP. The framework_reloadqra.jsp JSP reloads the Report configuration file. This file is located in <home_dir>/channels/common/fwk.
The framework_reloadqra.jsp implements the ReportingMgr.reloadConfiguration()method to reload the report configuration.
This JSP is for development purposes only and should not be used in production environments.


A P P E N D I X A
Chart Style Reference
In This Section
General Properties.................................................................. 150 Specific Chart Properties ........................................................ 156
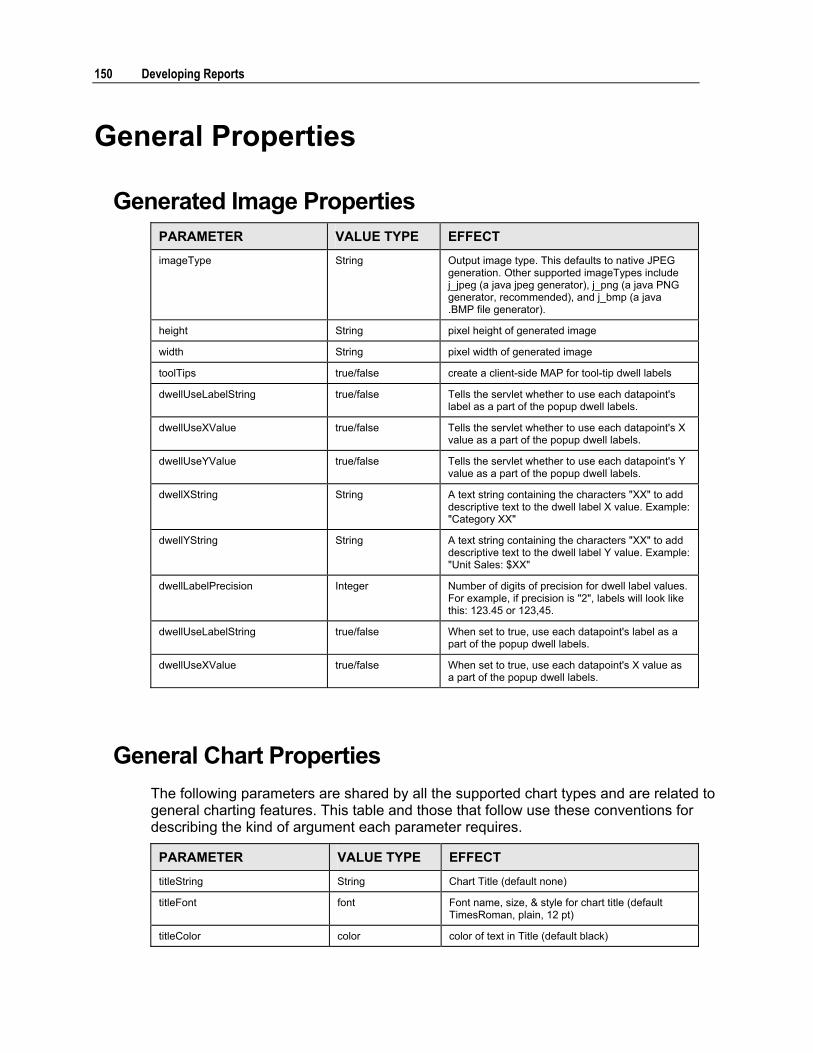
150 Developing Reports
General Properties
Generated Image Properties PARAMETER VALUE TYPE EFFECT imageType String Output image type. This defaults to native JPEG
generation. Other supported imageTypes include j_jpeg (a java jpeg generator), j_png (a java PNG generator, recommended), and j_bmp (a java .BMP file generator).
height String pixel height of generated image
width String pixel width of generated image
toolTips true/false create a client-side MAP for tool-tip dwell labels
dwellUseLabelString true/false Tells the servlet whether to use each datapoint's label as a part of the popup dwell labels.
dwellUseXValue true/false Tells the servlet whether to use each datapoint's X value as a part of the popup dwell labels.
dwellUseYValue true/false Tells the servlet whether to use each datapoint's Y value as a part of the popup dwell labels.
dwellXString String A text string containing the characters "XX" to add descriptive text to the dwell label X value. Example: "Category XX"
dwellYString String A text string containing the characters "XX" to add descriptive text to the dwell label Y value. Example: "Unit Sales: $XX"
dwellLabelPrecision Integer Number of digits of precision for dwell label values. For example, if precision is "2", labels will look like this: 123.45 or 123,45.
dwellUseLabelString true/false When set to true, use each datapoint's label as a part of the popup dwell labels.
dwellUseXValue true/false When set to true, use each datapoint's X value as a part of the popup dwell labels.
General Chart Properties The following parameters are shared by all the supported chart types and are related to general charting features. This table and those that follow use these conventions for describing the kind of argument each parameter requires.
PARAMETER VALUE TYPE EFFECT
titleString String Chart Title (default none)
titleFont font Font name, size, & style for chart title (default TimesRoman, plain, 12 pt)
titleColor color color of text in Title (default black)
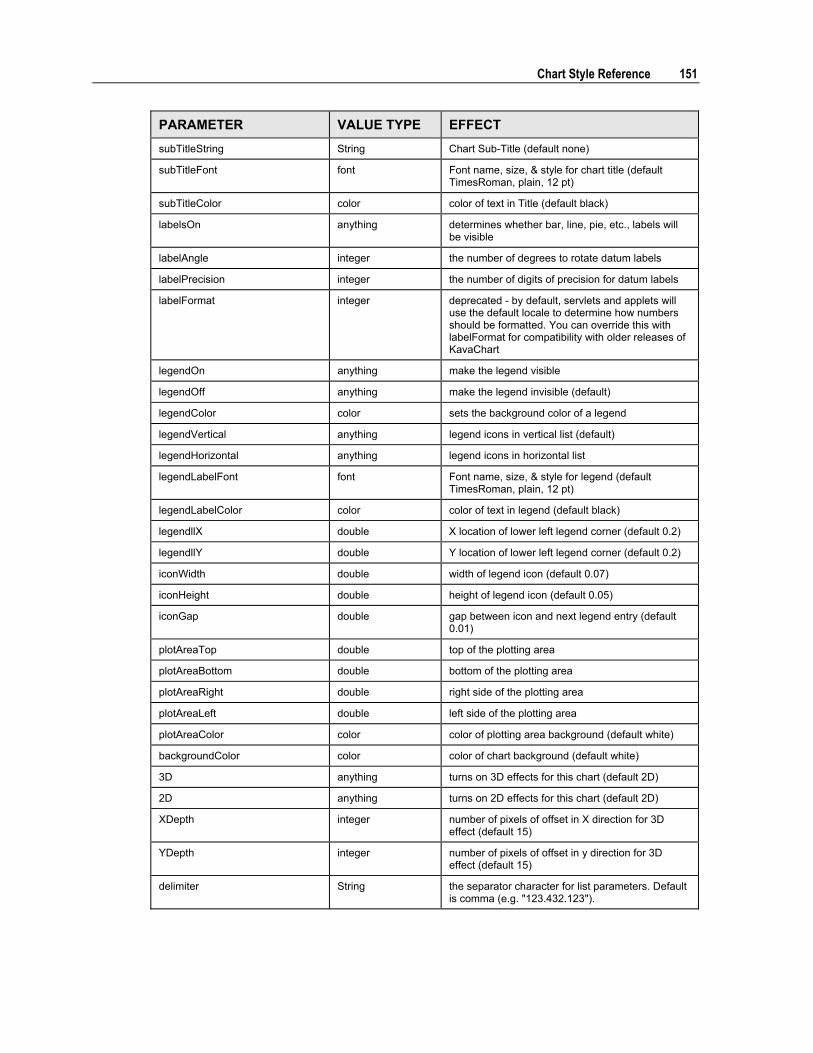
Chart Style Reference 151
PARAMETER VALUE TYPE EFFECT subTitleString String Chart Sub-Title (default none)
subTitleFont font Font name, size, & style for chart title (default TimesRoman, plain, 12 pt)
subTitleColor color color of text in Title (default black)
labelsOn anything determines whether bar, line, pie, etc., labels will be visible
labelAngle integer the number of degrees to rotate datum labels
labelPrecision integer the number of digits of precision for datum labels
labelFormat integer deprecated - by default, servlets and applets will use the default locale to determine how numbers should be formatted. You can override this with labelFormat for compatibility with older releases of KavaChart
legendOn anything make the legend visible
legendOff anything make the legend invisible (default)
legendColor color sets the background color of a legend
legendVertical anything legend icons in vertical list (default)
legendHorizontal anything legend icons in horizontal list
legendLabelFont font Font name, size, & style for legend (default TimesRoman, plain, 12 pt)
legendLabelColor color color of text in legend (default black)
legendllX double X location of lower left legend corner (default 0.2)
legendllY double Y location of lower left legend corner (default 0.2)
iconWidth double width of legend icon (default 0.07)
iconHeight double height of legend icon (default 0.05)
iconGap double gap between icon and next legend entry (default 0.01)
plotAreaTop double top of the plotting area
plotAreaBottom double bottom of the plotting area
plotAreaRight double right side of the plotting area
plotAreaLeft double left side of the plotting area
plotAreaColor color color of plotting area background (default white)
backgroundColor color color of chart background (default white)
3D anything turns on 3D effects for this chart (default 2D)
2D anything turns on 2D effects for this chart (default 2D)
XDepth integer number of pixels of offset in X direction for 3D effect (default 15)
YDepth integer number of pixels of offset in y direction for 3D effect (default 15)
delimiter String the separator character for list parameters. Default is comma (e.g. "123.432.123").

152 Developing Reports
PARAMETER VALUE TYPE EFFECT defaultFont Font A new default font for your charts. This parameter
overrides the default font setting for KavaChart graphs. This parameter sets a new default for all KavaChart graphics running within the Java Virtual Machine in the current session, so you should use it cautiously. Its primary value is for settings that wish to start with consistent font usage for all charts.
backgroundImage URL or file name Charts can replace the solid background color with a GIF or JPEG image for added effect.
outlineColor Color Color to use for outlining bars, plotareas, etc. (Default none). Using this param automatically enables outlining for most objects
outlineDataRepresentation true|false If outlineColor is set to some color, you can selectively turn the outlining off for the DataRepresentation (Bars, Pie, Area, etc.) by setting this property to "false". Default is "true".
outlinePlotarea true|false If outlineColor is set to some color, you can selectively turn the outlining off for the Plotarea (the region bounded by the x and y axes) by setting this property to "false". Default is "true".
outlineBackground true|false If outlineColor is set to some color, you can selectively turn the outlining off for the Background (the total chart image area) by setting this property to "false". Default is "true".
outlineLegend true|false If outlineColor is set to some color, you can selectively turn the outlining off for the chart Legend by setting this property to "false". Default is "true".
Axis Properties The following tables contain parameters for adjusting axes. Line, area, bar, and their derivatives use these parameters. Axis parameters consist of a set of parameters and an option list. The option list is contained in a separate table.
If you're modifying an X Axis (usually on the top or bottom of a chart), use xAxisParameterName instead of yAxisParameterName. X Axes are on the left and right for Horizontal Bar Type charts. Speedo charts have a single Axis, which is a Y Axis.
If you're modifying an Auxiliary Y Axis (charts that have left and right axes, for example), use auxAxisParameterName instead of yAxisParameterName.
AXIS PARAMETER VALUE TYPE EFFECT
yAxisTitle string Axis title
yAxisTitleFont font Axis title font
yAxisTitleColor color Axis title color
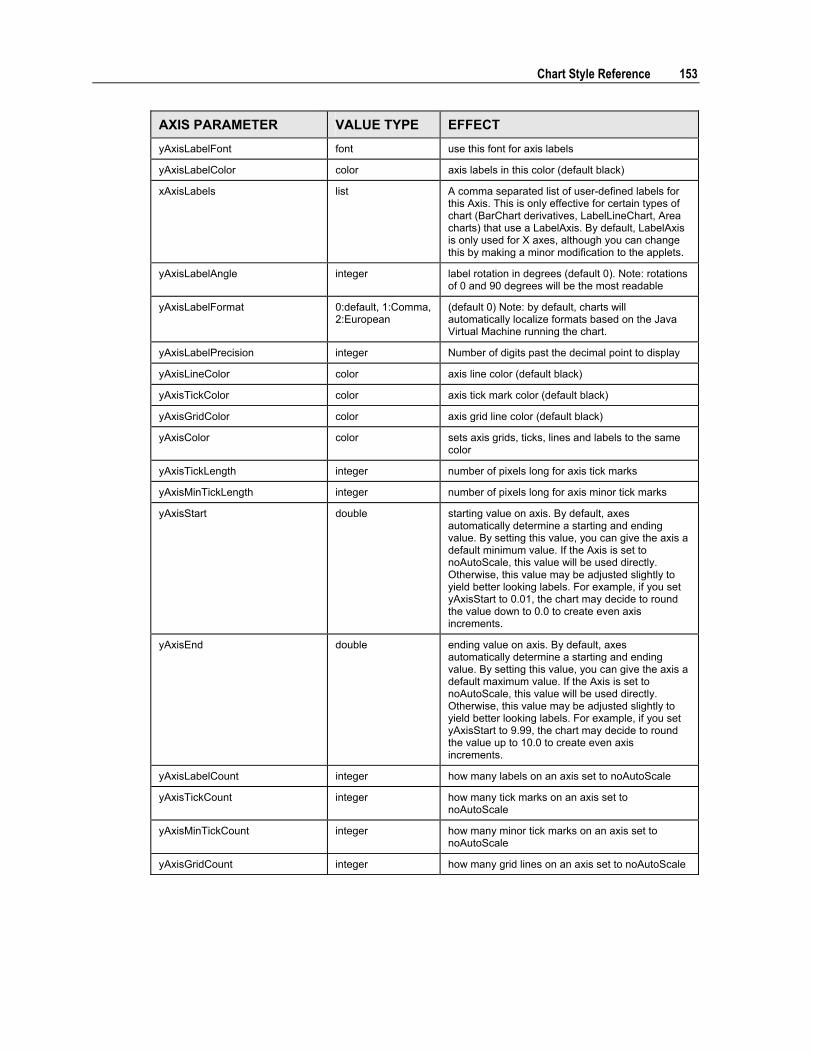
Chart Style Reference 153
AXIS PARAMETER VALUE TYPE EFFECT yAxisLabelFont font use this font for axis labels
yAxisLabelColor color axis labels in this color (default black)
xAxisLabels list A comma separated list of user-defined labels for this Axis. This is only effective for certain types of chart (BarChart derivatives, LabelLineChart, Area charts) that use a LabelAxis. By default, LabelAxis is only used for X axes, although you can change this by making a minor modification to the applets.
yAxisLabelAngle integer label rotation in degrees (default 0). Note: rotations of 0 and 90 degrees will be the most readable
yAxisLabelFormat 0:default, 1:Comma, 2:European
(default 0) Note: by default, charts will automatically localize formats based on the Java Virtual Machine running the chart.
yAxisLabelPrecision integer Number of digits past the decimal point to display
yAxisLineColor color axis line color (default black)
yAxisTickColor color axis tick mark color (default black)
yAxisGridColor color axis grid line color (default black)
yAxisColor color sets axis grids, ticks, lines and labels to the same color
yAxisTickLength integer number of pixels long for axis tick marks
yAxisMinTickLength integer number of pixels long for axis minor tick marks
yAxisStart double starting value on axis. By default, axes automatically determine a starting and ending value. By setting this value, you can give the axis a default minimum value. If the Axis is set to noAutoScale, this value will be used directly. Otherwise, this value may be adjusted slightly to yield better looking labels. For example, if you set yAxisStart to 0.01, the chart may decide to round the value down to 0.0 to create even axis increments.
yAxisEnd double ending value on axis. By default, axes automatically determine a starting and ending value. By setting this value, you can give the axis a default maximum value. If the Axis is set to noAutoScale, this value will be used directly. Otherwise, this value may be adjusted slightly to yield better looking labels. For example, if you set yAxisStart to 9.99, the chart may decide to round the value up to 10.0 to create even axis increments.
yAxisLabelCount integer how many labels on an axis set to noAutoScale
yAxisTickCount integer how many tick marks on an axis set to noAutoScale
yAxisMinTickCount integer how many minor tick marks on an axis set to noAutoScale
yAxisGridCount integer how many grid lines on an axis set to noAutoScale

154 Developing Reports
The following lists include various options for adjusting the look of an X or Y axis. Use these parameters in a list, like this: param name=xAxisOptions value="gridOff, tickOff, lineOn". If you're modifying an auxiliary Y axis (such as in a chart that has left and right axes), use auxAxisOptions.
AXIS OPTIONS (YAXISOPTIONS, XAXISOPTIONS OR AUXAXISOPTIONS)
VALUE TYPE EFFECT
autoScale true|false automatically create axis scale (default)
noAutoScale true|false axis scale defined in applet parameters
rotateTitle true|false "true" if vertical axis title should be parallel with axis
logScaling true|false "true" if axis should use log scaling
lineOn true|false axis line is visible (default)
lineOff true|false axis line is invisible
tickOn true|false major tick marks are visible (default)
tickOff true|false major tick marks are invisible
minTickOn true|false minor tick marks are visible
minTickOff true|false minor tick marks are invisible (default)
labelsOn true|false axis labels are visible (default)
labelsOff true|false axis labels are invisible
gridOn true|false grid lines are visible
gridOff true|false grid lines are invisible (default)
rightAxis true|false this axis goes on the right
topAxis true|false this axis goes on the top
bottomAxis true|false this axis goes on the bottom
leftAxis true|false this axis goes on the left (default)
Dataset Properties Datasets can vary a great deal from chart to chart. Some kinds of charts only use Y values, others use both X and Y values. Some charts use a color to represent an entire dataset (bar charts, line graphs), and some use a color for each data value (pie charts, individual bar charts). In general, every chart must define a list of numbers for Y data.
DATASET PARAMETERS VALUE TYPE EFFECT
dataset0Color color color to use for this dataset (default varies)

Chart Style Reference 155
DATASET PARAMETERS VALUE TYPE EFFECT dataset0Colors list of colors colors to use for pie slices or bars (default
varies)
dataset0Image URL (or filename) image to use for this dataset's markers (default none). Use this property to define line markers for scatter plots.
dataset0LineWidth integer pixel width of plot line
dataset0LabelFont font font to use for this dataset's labels (default TimesRoman 12pt)
dataset0LabelColor color color to use for this dataset's labels (default black)
dataset0Color color color to use for this dataset (default varies)
dataset0Colors list of colors colors to use for pie slices or bars (default varies)
dataset0Image URL (or filename) image to use for this dataset's markers (default none). Use this property to define line markers for scatter plots.
dataset0LineWidth integer pixel width of plot line
dataset0LabelFont font font to use for this dataset's labels (default TimesRoman 12pt)
dataset0LabelColor color color to use for this dataset's labels (default black)

156 Developing Reports
Specific Chart Properties
line and labelLine Chart Properties Line charts can use any general parameters. Line charts have variable line width (adjustable by dataset), image markers, and labels that can be toggled on or off. You can also toggle lines on or off to create a scatter plot.
LabelLineApp takes user-defined labels along the X axis.
Line Chart parameters include:
PARAMETERS VALUE TYPE EFFECT plotLinesOn anything plot lines should display (default)
plotLinesOff anything Create a scatter plot by making plot lines invisible
bar, column, stackBar, stackColumn Chart Properties Bar charts can use any general parameters. Bar charts have variable bar width, an adjustable baseline, and labels that can be toggled on or off.
stackBarApp and stackColumnApp stack data series rather than clustering them.
Bar Chart parameters include:
PARAMETERS VALUE TYPE EFFECT
barBaseline double bars ascend or descend from this value
barClusterWidth double This determines how wide each bar should be. If the value is 1.0, bar 1 will touch bar 2. If the value is 0.5, each bar will take 50% of the available space. If you have more than one data series defined, this value describes the total width of a cluster of bars.

Chart Style Reference 157
pie Chart Properties Pie charts can use any general parameters. Pie charts can toggle percentage, value, and textual labels. They can also set a beginning angle value, and can set an exploded slice for emphasis.
Pie slice colors are defined using dataset0Colors.
Pie Chart parameters include:
PARAMETERS VALUE TYPE EFFECT
explodeSlice integer slice number to explode
textLabelsOn anything make string labels visible
textLabelsOff anything make string labels invisible (default)
valueLabelsOn anything make numeric labels visible
valueLabelsOff anything make numeric labels invisible (default)
percentLabelsOn anything make percentage labels visible (default)
percentLabelsOff anything make percentage labels invisible
labelPosition integer 0: at center of slice, 1: at edge of slice, 2: outside edge of slice with pointer
startDegrees integer degrees counterclockwise from 3 o'clock for first slice
xLoc double x Location for center of pie (between 0 & 1, default 0.5)
yLoc double y Location for center of pie (between 0 & 1, default 0.5)
pieWidth double % of window for pie diameter (default .6 = 60%)
pieHeight double % of window for pie diameter (default .6 = 60%)
pointerLengths list a values to redefine the pointer lengths for external labels. By default, this value is 0.2.
lineColor Color redefines the color used for pie slice pointers

158 Developing Reports
speedo Chart Properties Speedo charts can use any general parameters. Speedo charts have adjustable axis locations and styles, as well as adjustable needle styles. This applet can be particularly useful in conjunction with an image background to superimpose a dial and needle on a scanned image of a physical
This chart draws only the first value of dataset 0.
Speedo Chart parameters include:
PARAMETERS VALUE TYPE EFFECT
needleStyle integer Kind of needle (default 1) 0 = arrow, 1 = line, 2 = thick arrow, 3 = swept arc
speedoPosition integer 0 (default) is a mostly complete circle, 1 - 4 are semi circles in various positions, 5-8 are quarter circles in various positions
labelsInside anything labels on the inside of the speedo
labelsOutside anything labels on the outside of the speedo
barArea Chart Properties BarArea combination charts can use any general parameters. BarArea charts have variable bar width, and labels that can be toggled on or off. If you don't include a parameter to define X axis labels, this chart will use Datum labels (param dataset0Labels) beneath each bar. If Datum labels aren't defined, this chart will display each bar's Y value beneath it. Data series can be assigned to either Bar or Area style charting. Bars draw over areas, and may be stacked or clustered. Areas are always stacked.
BarArea Chart parameters include:
PARAMETERS VALUE TYPE EFFECT
datasetNType Bar|Area dataset N will be either Bar or Area, based on this value.
stackedBar true|false If "true", bars will be stacked, one series upon another.
barBaseline double bars ascend or descend from this value
clusterWidth double This determines how wide each bar should be. If the value is 1.0, bar 1 will touch bar 2. If the value is 0.5, each bar will take 50% of the available space. If you have more than one data series defined, this value describes the total width of a cluster of bars.
barLabelsOn true|false determines whether labels will be drawn above each bar
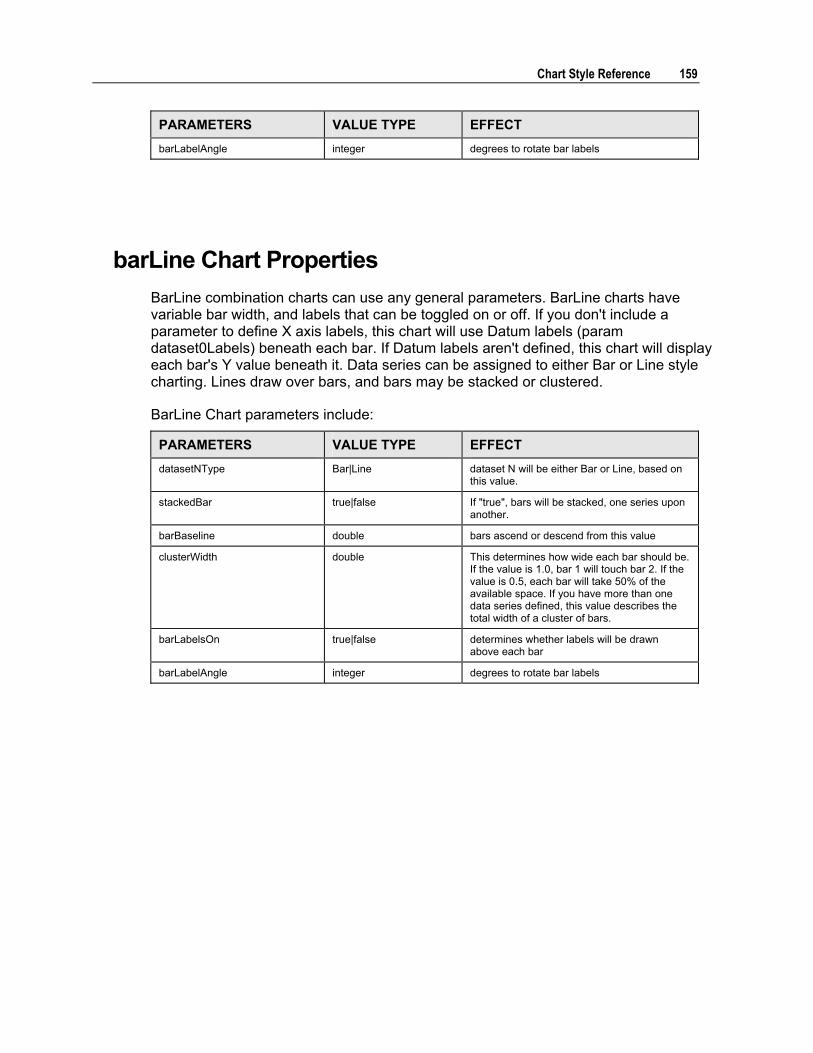
Chart Style Reference 159
PARAMETERS VALUE TYPE EFFECT barLabelAngle integer degrees to rotate bar labels
barLine Chart Properties BarLine combination charts can use any general parameters. BarLine charts have variable bar width, and labels that can be toggled on or off. If you don't include a parameter to define X axis labels, this chart will use Datum labels (param dataset0Labels) beneath each bar. If Datum labels aren't defined, this chart will display each bar's Y value beneath it. Data series can be assigned to either Bar or Line style charting. Lines draw over bars, and bars may be stacked or clustered.
BarLine Chart parameters include:
PARAMETERS VALUE TYPE EFFECT datasetNType Bar|Line dataset N will be either Bar or Line, based on
this value.
stackedBar true|false If "true", bars will be stacked, one series upon another.
barBaseline double bars ascend or descend from this value
clusterWidth double This determines how wide each bar should be. If the value is 1.0, bar 1 will touch bar 2. If the value is 0.5, each bar will take 50% of the available space. If you have more than one data series defined, this value describes the total width of a cluster of bars.
barLabelsOn true|false determines whether labels will be drawn above each bar
barLabelAngle integer degrees to rotate bar labels

161
Index
A Aggregations
about � 82 creating � 82 example � 83 master detail � 78 operations � 83 specifying operator � 83
C CBU Reports
and the QRA � 16 customizing � 145 developing � 19 localizing � 143 reloading � 147
Charts about � 116 axes � 123 creating � 117 data set � 121 image file format � 118 labels � 123 samples � 124 size � 118 specifying properties � 118, 150, 156 titles � 118
D Data Providers
about � 28 binding � 42 creating � 31 data source � 33 example � 29 mapping of returned columns � 40 prompts � 44, 58 prompts in SQL � 35, 37 settings � 31 SQL statement � 35, 37
Data Sources
data providers � 33 specifying new data source � 33
F Filters
about � 89 example � 91 multiple value filter � 90 single value filter � 90
H Help
technical support � x
I instance_route.properties Configuration File
configuring � 33 Interactive Prompts
about � 47 constraints � 56 declaring � 47, 49 formatting � 54 rendering � 59, 61 syntax � 47, 50, 54 types � 47
M Master Detail
about � 76 aggregations � 78 default order � 77 master detail groups � 79 specifying columns � 77 specifying master column � 76
Matrix Data Transformer about � 106 and Tabular Data Transformer � 107 dimensions � 108 examples � 111 measures � 110
P PromptBlocks
162 Developing Reports
about � 58 creating � 58
Prompts about � 35, 44 interactive prompts � 47 prompt - binding � 42 setting in SQL � 37, 38 system prompts � 45
Q QRA Report Definition File
about � 22 creating � 19, 23 declaring � 25 format � 22 location � 22
Query Reporting and Analysis (QRA) Toolkit about � 16 and Customer Analysis � 16 and the MyWeb channel � 17 data providers � 28 defining � 22 report definition file � 22
R reportelements.properties Configuration
File about � 24 location � 24 using � 25
S Sorting
about � 96 default sort � 96 interactive sorting � 97, 98 multiple column sorts � 98
System Prompts about � 45 specifying � 45 types � 45
T Tabular Data Transformers
about � 64 aggregations � 82, 83 and Matrix Data Transformers � 107 columns � 69 creating � 65, 69 data � 71 declaring � 64, 65 default sort � 96 exporting data � 100 filters � 89, 90, 91 footer � 74 format � 71 header � 70, 71 images � 73 interactive sort � 97, 98 layout � 68 links in � 73 master detail columns � 69, 70, 76, 77,
78, 79 number of rows � 66 page navigation � 67 styles � 71, 72