developing logistics network from a resilience...
TRANSCRIPT
Developing Logistics Network from a Resilience Perspective
C.Y. LAM
Graduate School of Engineering, Hiroshima University, Japan
Abstract
Logistics entities are interrelated to each other,
any disruption or sudden unavailability of the
entities may cause severe cascading disruption
effects on the functioning of the entire logistics
network. In analyze the cascading disruption effects,
it is important to actively concern the normal
logistics practices, rather than passively emphasize
on learning from the past incidents. This paper
proposes a resilience analysis framework for the
analysis and design of logistics network on how to
help the network to cope with complexity under
disruption. Under the resilience analysis framework,
the logistics network is modeled as a probabilistic
network graph, the resilience can then be analyzed
by the reliability of all the independent connection
paths among the logistics entities with connection
weightings. The design of the logistics network is
then further proposed by means of dependency
routing. Therefore, this paper can provide an
efficient way to analyze and design the stability of
the logistics network as well as to understand the
ability of the network to return to a stable state after
disruptions from failure.
1. Introduction
Logistics network is one of the critical
infrastructure networks that comprising identifiable
assets in providing a reliable flow of products and
services for the smooth functioning of a society, and
it is also essential to the economics of a society [1].
In a logistics network, its entities are separated by
distance and time while connections are formed
among them, such that the products and services
from different markets or regions can be linked
together for proper functioning of a logistics network
[2]. Since the entities in the logistics network are
interdependent, any disruption or sudden
unavailability of the entities may cause severe
cascading disruption on the functioning of the entire
network. A disruption (e.g. delay in a production
process, traffic congestion, delivery tardiness, etc.)
on an entity in the network may not only affect itself,
it may also cause cascading disruption effect in the
next entity of the logistics network. Moreover, the
logistics network may also be disrupted by some
other interrelated disruptions. For example, a
flooding and rainfall may cause extensive landslides
that may affect a logistics route; a power failure and
blackout may cause the traffic light systems to
breakdown, and it may result in heavy congestion in
rush hour.
The analysis of logistics network from a risk
management perspective has been conducted by
many researchers, and the review can be found in
[3], [4], [5]. Apart from the risk management
perspective, this research study proposes a resilience
analysis framework for the analysis and design of a
logistics network. Resilience is a field for
understanding and management of safety that
focuses on how to help a network or system to cope
with complexity under pressure to achieve success
[6], and it has been successfully applied in various
research areas [7], [8], such as ecosystems, computer
networks, soci-economic systems, etc. Therefore, by
adopting a resilience perspective, it can provide an
efficient way to analyze the security and stability of
the logistics network as well as to understand the
ability of the network to return to a stable state after
disruptions from failure.
2. Logistics Network Resilience
2.1. Resilient Network Analysis
Under the resilience analysis framework, a
network is considered as resilient if it is impervious
and resilient to disruptions, i.e. a vulnerable logistics
network might be hit by a damaging disruption
event, but will soon recover if it is resilient. A
logistics network that is not resilient would take
longer time to recover, and one that is not vulnerable
would not be affected by the disruption in the first
place.
In the approach of resilience analysis, the
logistics network is modeled as a probabilistic graph
with a set of vertices
with number of nodes and a set
of number of connections between the nodes
in the network . Because the survivability of the
logistics network depends on the number of
independent connection paths between the nodes in
the network [9], the resilience of a node can then
be determined by the reliability of all the
independent connection paths towards that node in
terms of the weighting on the connection,
i.e. . Moreover, the resilience
of the entire network can then be determined by the
weighted sum of all the node resilience , i.e.
. Additionally, the effect of
International Journal of Sustainable Energy Development (IJSED), Volume 5, Issue 2, December 2016
Copyright © 2016, Infonomics Society 275

redundancy can be applied for a more comprehensive
resilient analysis on the logistics network, in which
redundancy is regarded as a set of additional
connection paths (redundant paths) that may not be
significant in the normal functioning of the network,
but it may be significant to the network when there
are disruptions in the network. Therefore,
redundancy is defined as ,
where is the probability associated with each risk
in the network, such that for the network facing
various or increased number of risks, tends
toward 0% or completely secure as the number of
redundancy increase, such that the hypothesis are:
-
, the variance in the resilience of
the network without redundancy ( ) is the same
as the resilience of the network with redundancy
( ).
-
, variance is not equal.
2.2. Resilient Network Design
The ability of the network in coping with
disruption can be quantitatively determined by the
resilience analysis framework. In knowing the
resilient status of the network, it is necessary to
create a robust logistics network. Based on the effect
of redundancy in the network resilience analysis, it
can help to further efficiently and effectively
optimize the logistics network, i.e. efficiently design
a route that can maximize the overall reliability of
the logistics network, effectively consolidate various
routes to reduce some highly overlapped routes, and
enhance the integration of the logistics network. In
general, the optimization approach of the logistics
network is proposed to be at the restoration and
recovery of the network by means of dependency
routing.
The structure of a logistics network may be
distorted after a disruption, the functioning of the
network may only depend on its existing and usable
resources, such as those still workable connection
paths/ nodes, etc., so a dependency routing approach
can be adopted to restore and recover the services in
the network. The dependency routing approach
considers the workable dependency between the
entities in the network and their priorities according
to the overall recovery efforts, the preferential paths
in the network during disruption can then be
determined and used as the restoration and recovery
path. Under the dependency routing modeling
approach for the restoration and recovery of the
logistics network, different combinations of the
network structure under different disruption
scenarios are determined, such that it is useful for
policy makers or management teams to develop
contingency plan for the network disruption. The
conceptual framework for the restoration and
recovery of the logistics network by means of
dependency routing is illustrated in Fig.1.
1
7
65
8 34
2 Determine the characteristics
(e.g. critical node) of the
logistics network
213
413
653
c a
c b
f h
e
j
8
7
. . .
. . .
312
148
567
a c
e b
j h
c
f
3
3
. . .
. . .
Forward Approach Backward Approach
Dependencies related to Critical Node 3:
Optimization on the dependency routings of
the forward / backward sequencing for the
network restoration and recovery of the
logistics network after disruption
Determine the
dependencies
and the related
routings of the
characteristics
of the logistics
network
a h
b c
d g
f
e
jh
Determine the
compensated
networks
Figure 1. The conceptual framework for the restoration and
recovery of the logistics network
3. An Illustrative Example
A logistics network with 14 nodes and 20
connections are used to illustrated the resilience
analysis approach, and the single line diagram of the
logistics network is presented in Fig.2, in which node
1 and node 2 are the major supply node in the
network, and the reliability for the nodes and the
connections are set as 0.98 and 0.88, respectively.
The data for the node weightings and the reliability
of the connections are summarized in Table 1.
By adopting the resilience analysis approach, all
the connections between a pair of nodes are
determined by Dijkstra's Shortest Path Algorithm,
and the determined shortest paths between the supply
nodes and other demand nodes in the network as well
as the corresponding reliability are presented in
Table 2. Moreover, the resilience of the demand
nodes is also determined according to the mentioned
approach, and the results are presented in Table 3.
1
9
1011
5
6
13
12
2
14
3
7 8
41
2
54
8
3
6
7
11
12
19 20
1314
1516
17 18
9 10
Figure 2. A logistics network with 14 nodes and 20 connections
International Journal of Sustainable Energy Development (IJSED), Volume 5, Issue 2, December 2016
Copyright © 2016, Infonomics Society 276

Table 1. Weighting of nodes
Node 1 2 3 4 5 6 7
Weight 1.00 1.00 0.39 0.20 0.03 0.04 0.00
Node 8 9 10 11 12 13 14
Weight 0.00 0.12 0.03 0.01 0.02 0.05 0.06
Table 2. Reliability of Connections
Node Connection Reliability
3 (1-2); (6-8-5) 0.928
(2); (4-5) 0.973
4 (1-4); (6-8) 0.949
(4); (2-5); (3-8); (1-6-7-13-14-15-9) 0.996
5 (6); (1-3) 0.973
(3); (1-6); (4-8); (2-5-9-15-14-13-7) 0.996
6 (6-7); (1-4-9-15-14-13) 0.879
(3-7); (4-9-15-14-13);
(2-5-10-17-16-20-12)
0.937
7 (1-4-10); (6-8-9-17) 0.872
(4-10); (2-5-9-17) 0.910
8 (1-4-10-18) 0.600
(4-10-18) 0.681
9 (1-4-9); (6-8-10-17) 0.872
(4-9); (2-5-10-17); (3-7-13-14-15) 0.957
10 (1-4-9-15); (6-7-13-14) 0.840
(4-9-15); (3-7-13-14) 0.872
11 (1-4-9-15-14); (6-7-13) 0.850
(3-7-13); (4-9-15-14) 0.872
12 (6-7-11); (1-4-9-16-20-19) 0.830
(3-7-11); (4-9-16-20-19) 0.850
13 (6-7-12); (1-4-9-16-20) 0.850
(3-7-12); (4-9-16-20); (2-5-10-17-15-14-13-11-19)
0.913
14 (1-4-9-16); (6-7-12-20) 0.840
(4-9-16); (3-7-12-20) 0.872
Table 3. Resilience of the Demand Nodes
Node 3 4 5 6 7 8
Resilience 0.98 1.90 1.93 1.78 1.74 1.25
Node 9 10 11 12 13 14
Resilience 1.79 1.67 1.68 1.64 1.72 1.67
In Table 3, it can be found that the resilience of
the demand nodes are ranging from 0.98 to 1.93, and
the associated resilience index of the entire logistics
network is 1.480, in which a higher resilience index
representing a higher reliability of the network as
well as its higher ability to return to its normal
operating state after disruptions.
In order to determine the effect of redundancy in
network structure, five redundant connections are
added incrementally to the logistics network so as to
increase the average degree of the nodes to a value of
above 3, in which the redundant connections are
added between node 1 and 12 (connection 21), node
11 and 13 (connection 22), node 10 and 14
(connection 23), node 8 and 14 (connection 24), and
node 3 and 8 (connection 25). The network diagram
with 5 additional redundant connections is shown in
Fig.3, in which the average degree of the nodes
increases as the number of redundant connections
increases (from 2.8 to 3.5). Additionally, the
matrixes for the number of paths between a pair of
nodes in the network are presented in Table IV, in
which the number of paths increases as the number
of redundant connections increases, such that the
number of alternative paths for the supply to reach
the demand nodes is increased.
1
9
1011
5
6
13
12
2
14
3
7 8
41
2
54
8
3
6
7
11
12
19 20
1314
1516
17 18
9 10
21
2223
24
25
Redundant ConnectionRedundant Connection
Figure 3. A logistics network with 5 additional redundant
connections
Table 4. Matrix for the Number of Connections
1* 2* 3* 4* 5*
n 1 2 1 2 1 2 1 2 1 2
3 2 2 2 2 2 2 2 2 3 3
4 3 4 3 4 3 4 3 4 3 4
5 3 4 3 4 3 4 3 4 3 4 6 3 4 3 4 3 4 3 4 3 4
7 2 2 2 2 2 2 3 3 3 3
8 1 1 1 1 1 1 2 2 3 3 9 3 4 3 4 3 4 3 4 3 4
10 2 2 2 2 3 3 3 3 3 3
11 2 2 3 3 3 3 3 3 3 3 12 3 3 3 3 3 3 3 3 3 3
13 3 3 3 4 3 4 3 4 3 4
14 2 2 2 2 3 3 3 4 3 4
*Number of Redundancy Connection
As the redundant connections are added
incrementally to the logistics network, the resilience
of the demand nodes and the entire network can then
be determined, and the results and their plots are
presented in Table V-VI and Figures 4-5,
respectively.
Table 5. Resilience of the Demand Nodes
n
3 1.863 1.863 1.863 1.863 1.914
4 1.930 1.933 1.933 1.933 1.933 5 1.948 1.948 1.948 1.948 1.951
6 1.914 1.914 1.914 1.914 1.918
7 1.747 1.747 1.747 1.854 1.873 8 1.256 1.256 1.256 1.656 1.877
9 1.890 1.890 1.890 1.890 1.890
10 1.678 1.678 1.838 1.838 1.847 11 1.668 1.863 1.863 1.863 1.863
12 1.907 1.907 1.907 1.907 1.907
13 1.887 1.903 1.903 1.908 1.908 14 1.710 1.710 1.834 1.869 1.889
International Journal of Sustainable Energy Development (IJSED), Volume 5, Issue 2, December 2016
Copyright © 2016, Infonomics Society 277
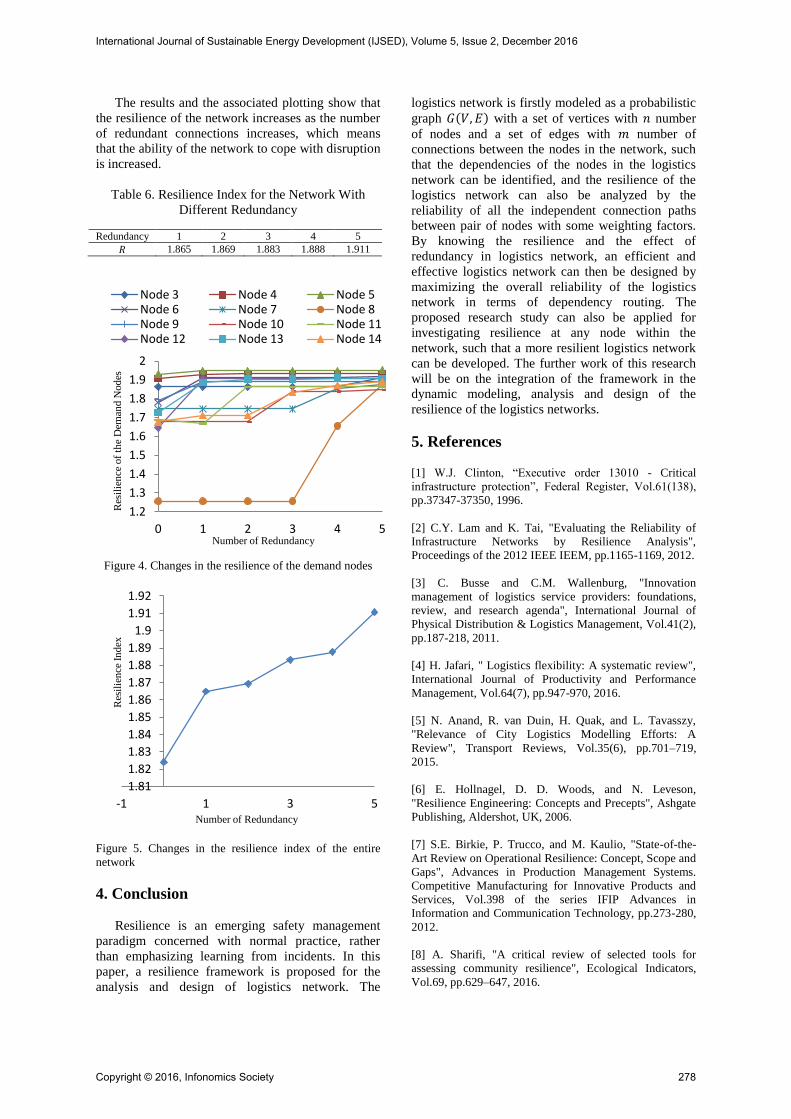
The results and the associated plotting show that
the resilience of the network increases as the number
of redundant connections increases, which means
that the ability of the network to cope with disruption
is increased.
Table 6. Resilience Index for the Network With
Different Redundancy
Redundancy 1 2 3 4 5
1.865 1.869 1.883 1.888 1.911
Figure 4. Changes in the resilience of the demand nodes
Figure 5. Changes in the resilience index of the entire
network
4. Conclusion
Resilience is an emerging safety management
paradigm concerned with normal practice, rather
than emphasizing learning from incidents. In this
paper, a resilience framework is proposed for the
analysis and design of logistics network. The
logistics network is firstly modeled as a probabilistic
graph with a set of vertices with number
of nodes and a set of edges with number of
connections between the nodes in the network, such
that the dependencies of the nodes in the logistics
network can be identified, and the resilience of the
logistics network can also be analyzed by the
reliability of all the independent connection paths
between pair of nodes with some weighting factors.
By knowing the resilience and the effect of
redundancy in logistics network, an efficient and
effective logistics network can then be designed by
maximizing the overall reliability of the logistics
network in terms of dependency routing. The
proposed research study can also be applied for
investigating resilience at any node within the
network, such that a more resilient logistics network
can be developed. The further work of this research
will be on the integration of the framework in the
dynamic modeling, analysis and design of the
resilience of the logistics networks.
5. References [1] W.J. Clinton, “Executive order 13010 - Critical
infrastructure protection”, Federal Register, Vol.61(138),
pp.37347-37350, 1996.
[2] C.Y. Lam and K. Tai, "Evaluating the Reliability of
Infrastructure Networks by Resilience Analysis",
Proceedings of the 2012 IEEE IEEM, pp.1165-1169, 2012.
[3] C. Busse and C.M. Wallenburg, "Innovation
management of logistics service providers: foundations,
review, and research agenda", International Journal of
Physical Distribution & Logistics Management, Vol.41(2),
pp.187-218, 2011.
[4] H. Jafari, " Logistics flexibility: A systematic review",
International Journal of Productivity and Performance
Management, Vol.64(7), pp.947-970, 2016.
[5] N. Anand, R. van Duin, H. Quak, and L. Tavasszy,
"Relevance of City Logistics Modelling Efforts: A
Review", Transport Reviews, Vol.35(6), pp.701–719,
2015.
[6] E. Hollnagel, D. D. Woods, and N. Leveson,
"Resilience Engineering: Concepts and Precepts", Ashgate
Publishing, Aldershot, UK, 2006.
[7] S.E. Birkie, P. Trucco, and M. Kaulio, "State-of-the-
Art Review on Operational Resilience: Concept, Scope and
Gaps", Advances in Production Management Systems.
Competitive Manufacturing for Innovative Products and
Services, Vol.398 of the series IFIP Advances in
Information and Communication Technology, pp.273-280,
2012.
[8] A. Sharifi, "A critical review of selected tools for
assessing community resilience", Ecological Indicators,
Vol.69, pp.629–647, 2016.
1.2
1.3
1.4
1.5
1.6
1.7
1.8
1.9
2
0 1 2 3 4 5
Res
ilie
nce
of
the
Dem
and
Nod
es
Number of Redundancy
Node 3 Node 4 Node 5 Node 6 Node 7 Node 8 Node 9 Node 10 Node 11 Node 12 Node 13 Node 14
1.81
1.82
1.83
1.84
1.85
1.86
1.87
1.88
1.89
1.9
1.91
1.92
-1 1 3 5
Res
ilie
nce
In
dex
Number of Redundancy
International Journal of Sustainable Energy Development (IJSED), Volume 5, Issue 2, December 2016
Copyright © 2016, Infonomics Society 278

[9] D. Wang, and W.H. Ip, “Evaluation and Analysis of
Logistics Network Resilience With Application to Aircraft
Servicing”. IEEE Systems Journal, Vol.3(2), pp.166-173,
2009.
[10] J. Cohen, “Statistical Power Analysis for the
Behavioral Sciences”, Lawrence Erlbaum Associates,
Hillsdale, New Jersey, 1988.
International Journal of Sustainable Energy Development (IJSED), Volume 5, Issue 2, December 2016
Copyright © 2016, Infonomics Society 279