developing gis tools to integrate mcdm models for the ... · developing gis tools to integrate mcdm...
TRANSCRIPT

Developing GIS Tools to Integrate MCDM Models for theAnalysis of Bank Branch Closures
Lihua Zhao and Barry J. GarnerSchool of Geography, The University of New South Wales, Sydney 2052
[email protected]; [email protected]
Abstract. In this research, MCDM methods have been integrated with a GIS to provide the means to prioritise branchclosure procedures based upon a variety of different choice criteria and on the importance (weight) a decision makermight attach to these. Both MCDM and GIS are well established methods and fields of research. Their integration,however, seems at best an emerging field. This paper describes the tools developed to link, using loose coupling, theMCDM models in the CDP package with a GIS. Two ArcView GIS functions have been developed and used to linkGIS and CDP packages through DDE data communication, and some menus and buttons have been added to theArcView graphical user interface. The approach here is to represent the methodology for the development ofeffective spatial decision support environment (SDSS) for branch bank rationalisation by integrating MCDM andGIS. This decision making environment is designed to enable the decision maker to evaluate the applicability of theprocedures and techniques in order to generate decision making scenarios and finally implement the decisionprocess by re-evaluating different scenarios based on his/her own familiar concept and knowledge.
1. INTRODUCTION
Bank closures, an important part of branch networkplanning and management involving the process ofselecting branches from a number of potentialalternatives, is a complex decision making process. Itinvolves conflicting quantitative and qualitative criteriaand multiple decision makers. The decision makingprocess can benefit from the use of Multi-CriteriaDecision Making (MCDM) techniques that can be usedto facilitate the decision making process by making theprocess more explicit, rational, and efficient (Hobbs etal., 1992).
A number of different models have been proposed tostructure and solve multi-criteria decision problems andcomputational methods developed for their application.In this research the analysis is based on two models:the Simple Multi-Attribute Rating Technique (SMART)and the Analytical Hierarchy Process (AHP). There aretwo main reasons for choosing these particular models.Firstly, in principle, they possess all of the capabilitiesrequired to address the considerations involved in thecontext of branch closure decision making. For a reviewof the models, methods of implementation, and theirapplication see Corner and Kirkwood (1991) forSMART and Saaty (1977; 1980; 1992; 1995) for AHP.
Secondly, using different methods to suggestalternative solutions provides consistency checks,stimulates insights, and helps resolve discrepancies inthe results that assist decision-making. The resultsprovide insights into the use of different techniqueswhen confronting decisions based on multiple criteria.The approach recognizes that no single method is bestfor different users. The results confirm that scenariosgenerated by alternative MCDM methods can differand that a multi-method approach helps build insight
and confidence. This is consistent with suggestionsmade by various researchers of using two or moremulti-criteria solution methods (see Corner andBuchanan, 1997; Hobbs and Horn, 1997; Salminen etal., 1998).
The highly spatial characteristic is one more criticalelement in banking business, branch closure decisionsregarding customers, markets, profitability, branches,and performance relate to the market area where thebank and branches are located. So state-of-art GIS isthe most important ingredient in the decision makingsystem, instead of general DSS.
GIS has long been used for decision support, mainly fortheir map design, comparison, and spatial analysiscapabilities. This capability can be further enhanced byintegrating GIS with MCDM models to create a SDSSthat will provide decision makers with easier access toGIS procedures, allow them to assess the performanceof different MCDM techniques, evaluate theimportance of the selected criteria, enable them toevaluate the applicability of the procedures andtechniques in order to create decision making scenariosand, finally, to implement the decision process by re-evaluating alternative scenarios in the context of theirown knowledge and understanding of the problem.
Within the framework of GIS, MCDM models have beenincreasingly applied in the last five years as a usefulmethodology for spatial decision support in land-userelated problems. Several approaches to integrating GISwith MCDM models have been developed, rangingfrom a simple integration based on loose coupling ofone or more MCDM models with a GIS (Carver, 1991;Pereira and Duckstein, 1993; Jankowski and Richard,1994; Jankowski, 1995), to a closely integrated systemwhere MCDM models become an integral part of the

GIS (Janssen and Rievelt, 1990; Eastman et al., 1993;Tkach, 1997).
The goal of this paper is to present the methodologyused to integrate the DecisionPlus (CDP) MCDMpackage with ArcView GIS to develop a SSDS suitablefor prioritising branch banks for closure based on avariety of different choice criteria and on theimportance (weight) attached to these by decisionmakers. In the paper, Section 2 introduces the generaldecision support requirements for a SDSS and thevarious methods of software integration are reviewed.Section 3 introduces the software components thatform the basis of the SDSS developed in this researchand the approach adopted for integrating these todevelop the system. Section 4 focuses on the interfacedesign for the system, and a preliminary application ofthe integrated system is presented in Section 5.
2. DECISION SUPPORT ENVIRONMENT FORBRANCH BANK RATIONALISATION
2.1 Approaches to systems integration
There has been a considerable discussion in theliterature of the different methods of integrating externalsoftware packages with GIS, and a number of differentviewpoints exist. The most widely acceptedclassification is based on the architecturalcharacteristics of the method of integration accordingto the degree and form of data exchange or sharingbetween GIS and the external package(s) (Goodchild etal., 1992; Nyerges, 1992; Fedra, 1993; Goodchild et al.,1993). In this classification a basic distinction is madebetween loose coupling and close coupling (Figure 1).
In loose coupling, the two software systems exchangeinput and output files by means of an efficientinterchange of data between the two packages. At thislevel of integration, no system modification orprogramming is required and the two systems runindependently. Close coupling, on the other hand,involves writing some form of program to automate orfacilitate the integration process. The systems shareboth the communication files and the common userinterface. Close coupling normally involves modifyingthe operation of the GIS software itself and a variety ofmechanisms are available in most GIS packages toassist with this.
Another approach to classification is that based on thedirection of integration between systems whichrecognises the difference between one-directional, two-directional, and dynamic integration (Anselin et al.,1993). In one-directional integration, there is a single,one-way flow of information between the GIS and thedecision support system and the flow may originatefrom either. In the system developed here, the datagenerated in GIS serves as the input data to thedecision support system. In the case of two-directionalintegration, the systems are linked through a two-way
flow of information. In most research employing thisapproach, the GIS generates data that is input to thedecision support system for processing, the results ofwhich are subsequently transferred back to the GIS andadded to the existing attribute data base as new datawhich may then be further analysed or displayed.Dynamic integration is a more advanced form of two-directional integration that enables data to move backand forth between the two software modules in a moreflexible way determined by the user's needs. This typeof integration is especially useful when the decision-maker wants to revise the data or the decision scenariosafter examining the results obtained from anintermediate iteration.
(1) Loose Coupling Systems
(2) Close Coupling SystemsFigure 1: System integration - Loose and Close
coupling
2.2 Why the loose coupling approach?
The aim of integrating GIS with MCDM models in thisresearch is to develop a tool that meets therequirements for advanced application in identifyingpreferences for branch bank closure. The integrationapproach significantly contributes to the embedding ofmulti-criteria problem handling methods within a spatialinformation system and to fuse capabilities available inthe individual systems to provide some desired level ofusability. Several factors favour the choice of the loosecoupling approach for developing the SDSS in thisresearch.
GIS-DSS Common Interface
GIS DSSI/O Files
GIS analyst/Decision-maker
GIS Interface
GIS DSSI/O Files
GIS analyst/Decision-maker
DSS Interface

Firstly, both MCDM and GIS are well-established toolsbut essentially separate fields of research. The state-of-art software now available may be used directly whenloosely coupled and this integration technique is thebasis of most approaches that involves the integrationof systems (Parks, 1993).
Secondly, GIS and MCDM software packages aretypically proprietary systems and as such they aredeveloped and maintained externally with limitedopportunities for local modification. It is not necessaryto start from scratch to develop a closely coupledintegrated system. At a technical level, MCDMpackages are of comparable size and complexity to aGIS, consequently re-implementation of a MCDMpackage within GIS would be a daunting and costlytask.
Finally, an important feature of more recent GISsoftware development is that it is now much easier tocustomise them or loosely integrate them with othersoftware packages for specific GIS-based applications.There is some value in determining the limits ofintegration possible using existing systems and inidentifying the additional facilities which wouldfacilitate the task of integration. An alternative form ofthe integration problem is that of coupling GIS andother systems to deliver the capabilities needed tosatisfy the requirements of an application.
The above considerations has suggested that the loosecoupling approach is appropriate for the task addressedhere. Following the argument of Abel et al. (1994), theapproach to the problem of systems integrationadopted in this research is to loosely couple pre-existing systems to fuse a desired set of capabilitieswith some targeted degree of usability of the integratedsystem. A similar approach has been used indeveloping integrated systems for land useapplications based on raster data (Janssen and Rievelt,1990; Carver, 1991; Fedra, 1993; Nyerges, 1993;Jankowski and Richard, 1994). While the pre-existingsoftware packages themselves are not actuallymodified, their integration typically involves the designof specialist linkage components to facilitate coupling.In this context, identifying the types of linkagecomponents needed is one of the core issues of thesystems integration problem.
2.3 Requirements and criteria for a SDSS byintegrating GIS and MCDM
It is widely recognised that GIS has the potential tosupport additional types of analysis than the purelyspatial but that this potential has not yet been fullyrealised (Goodchild et al., 1992). The development ofSDSS based on the integration of GIS and MCDMmodels is an important one of these and a number ofresearchers have addressed the requirements andcriteria for developing SDSS. An important contributionis that by Densham (1991) who lists the basic criteria for
a decision support system. Carver (1991) argued thatGIS typically contain spatial analysis techniques,DBMS, graphical display and tabular output, but ideallySDSS should provide a framework for the integration ofthese GIS functions with the expert knowledge orexpertise of the decision maker and advanced analysiscapabilities of MCDM.
Another characteristic of a SDSS is communicationamong the various software packages. The ability topass data and instructions between different softwarepackages is fundamental to the development of moresophisticated spatial analysis techniques that areinvisible to the end user.
Heywood et al. (1995) have identified the criteria forintegrating SDSS with multi-criteria modelling andsuggest that, from the viewpoint of decision-makers,the multi-criteria modelling environment has to betransparent, robust, easy to use, and flexible. Some GIS-related software packages already have incorporatedmodels for decision-making capability, for exampleIDRISI and DEFINITE.
3. INTEGRATING GIS AND MCDM SOFTWARE
3.1 The ArcView GIS software
ArcView, developed by ESRI, is one of the most widelyused commercial Windows GIS packages. It is primarilydesigned for the manipulation of spatial vector data,extended with optional modules for the analysis ofnetwork data (Network Analyst extension), raster data(Spatial Analyst extension), and other types of data.The object oriented Avenue script language supportedby ArcView allows external programs or computerpackages to be integrated into the ArcViewenvironment to offer enhanced functionality for spatialanalysis, and the customising facility ArcView GUI(Menus, Buttons, Tools) provides a user friendlyapproach to using the integrated tools. ArcView alsohas integration capabilities that allow users to accesssystem resources (i.e. clipboard and system variables),issue operating system commands inside ArcView, andto support Dynamic Data Exchange (DDE) in theMicrosoft Windows environment and RemoteProcedure Call (RPC) in Unix.
3.2 Criterium DecisionPlus MCDM software
Much of the information typically needed for makingdecisions is incomplete, uncertain, or otherwiseunavailable. This is complicated by the fact thatobtaining better information is generally timeconsuming and/or expensive and therefore cannot be
undertaken without careful consideration of theexpected benefits of the investment. In other words, “ifI had more or better information, what is the likelihood Iwould make a different decision?”. When facing thedecisions which are difficult and involve many different

criteria against which various options or alternativesare compared, tracking and rating the importance of thecriteria and maintaining control of the decision problemare major challenges.
Criterium DecisionPlus (CDP) runs as a Windowsapplication to assist decision-makers in making andpresenting decisions. It is an important set of tools thatcan be used to meet the challenges. CDP is designed tolet decision-makers list their criteria and alternativesdirectly at the computer screen conventionally usingmouse and keyboard. Once the decision-makers weighteach of the decision criteria, CDP synthesises theinputs and presents the results in order of preference.The decision maker is still in control to accept theresults and make the final decision. More detail aboutthe package can be obtained from (InfoHarvest, 2000).
With CDP, decisions can be made more quickly and atlower cost than more traditional methods. The benefitsof using CDP include:• providing immediate feedback for ‘what-if’
analyses• assisting in reducing and focusing data collection
efforts, and allowing decision-makers toconcentrate on the "critical few" criteria
• quantifying trade-offs and uncertainties• facilitating consensus building• documenting the decision process• saving time and money.
3.3 Dynamic Data Exchange (DDE)
DDE is a Microsoft Windows protocol that lets two ormore programs running under Windows simultaneouslyexchange data - a form of interprocess communicationthat uses shared memory to exchange data betweenapplications. Applications can use DDE for one-timedata transfers and for ongoing exchanges and updatingof data.
DDE enables applications to be set up to pass bothdata and commands from one software package to theother. Normally one application requests the transferand the other responds. The application that does therequesting is called the client application, and theapplication that responds is called the server. Theinformation passing between client and server is calledthe conversation. A client application can use DDE toestablish a link to an item in a server application. Aftersuch a link is established, the server sends periodicupdates of the linked item to the client, typicallywhenever the value of the item changes. Thus, apermanent data stream is established between the twoapplications which remains in place until it is explicitlydisconnected.
This mechanism enables two applications tocontinuously and automatically exchange data andcreate a relationship between data stored in oneapplication with data stored in another. Bothapplications must support DDE to be able to participatein this data exchange, and all applications must be
located on the same machine: DDE will not run over anetwork. Basically, DDE allows the automation of cutand paste actions, the export of files, calculation ofstatistics for specific locations. From an end userstandpoint, automation via DDE creates an easy to use,seamless application.
The integration between software packages is generallyplatform dependent. DDE is supported by all theMicrosoft Windows operating systems (Windows 3.1x,Windows 95 and Windows NT). Communication cantake place between any software applications thatsupport DDE. ArcView fully supports DDE either as aclient or as a server (ESRI, 1995).
DDE is essential to developing a SDSS that utilisesseveral different applications in the context of theproblem being addressed. DDE enables ArcView andCDP software packages to have conversations witheach other (ESRI, 1995; Razavi, 1995; Alexander et al.,1997; Zhao and Garner, 2001). During theseconversations, data can be passed betweenapplications, calculations performed and the ‘value-added’ data passed back to the client application. Inaddition, all of these transfers are transparent to theend user.
3.4 The framework of the system integration
The SDSS developed in this research is designedaround the integration of the Criterium DecisionPlus3.0.3 (CDP) software with ArcView GIS 3.2 usingDynamic Data Exchange (DDE) in the MicrosoftWindows environment (Figure 2). Following thearguments by Jankowski (1995), the loose couplingarchitecture is used for linking together the twosoftware packages by means of a bi-directional datatransfer in which ArcView is the visualisation engineand DecisionPlus the criteria data analysis engine. Itsmain objective is to provide an efficient way to gatherspatial criteria, evaluate branch alternatives, anddisplay the results of spatial and multi-criteria analyses.
In this system, GIS database management functions areused for managing data derived from different sourcesand formats, and integrating data based on spatialrelations. The analytical functions facilitate spatialmanipulation and generate data based on spatialanalysis, and the visual display functions are used fordisplaying the results of spatial analysis and thedecision scores from the MCDM models.
The multiple criteria evaluation process is realisedusing the CDP software, the functions of which includethe enumeration of criteria preferences, selection ofaggregation functions, the generation of decisionscores, and sensitivity analysis.
ArcView GIS
Spatial database
Map display
Spatial analysis
CDP MCDM
Criteria Matrix
Decision Scores
Weight criteria
Transferfiles
DDE
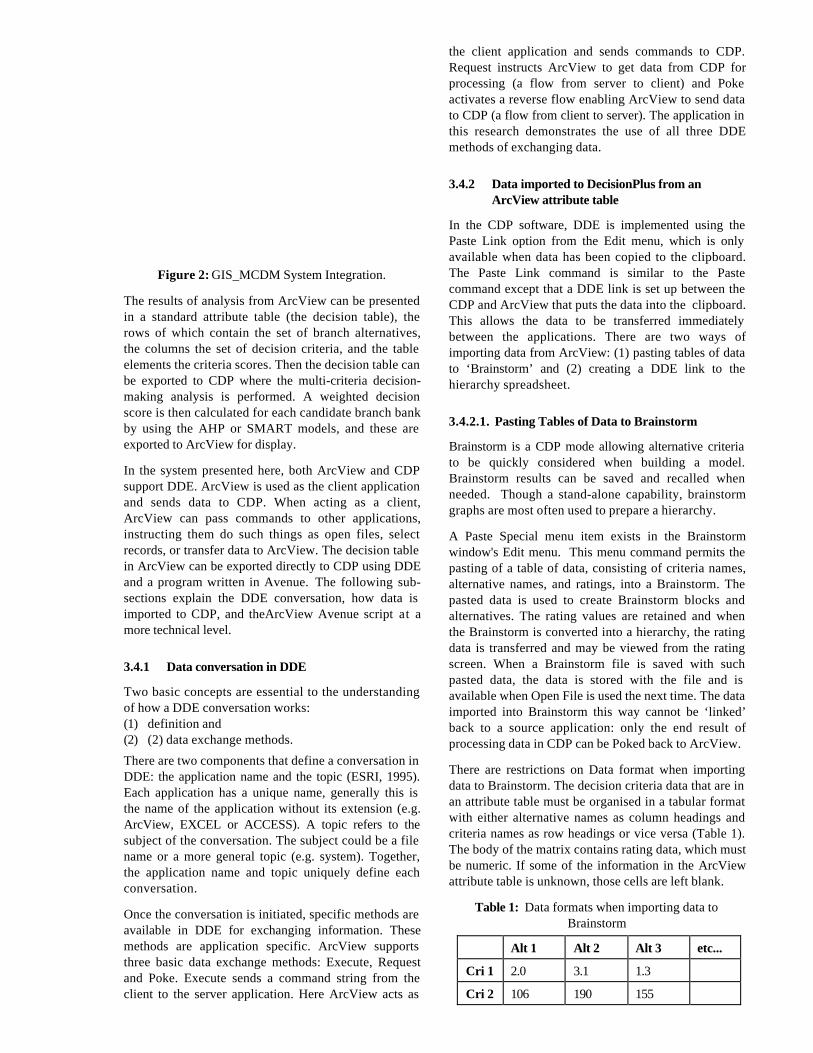
Figure 2: GIS_MCDM System Integration.
The results of analysis from ArcView can be presentedin a standard attribute table (the decision table), therows of which contain the set of branch alternatives,the columns the set of decision criteria, and the tableelements the criteria scores. Then the decision table canbe exported to CDP where the multi-criteria decision-making analysis is performed. A weighted decisionscore is then calculated for each candidate branch bankby using the AHP or SMART models, and these areexported to ArcView for display.
In the system presented here, both ArcView and CDPsupport DDE. ArcView is used as the client applicationand sends data to CDP. When acting as a client,ArcView can pass commands to other applications,instructing them do such things as open files, selectrecords, or transfer data to ArcView. The decision tablein ArcView can be exported directly to CDP using DDEand a program written in Avenue. The following sub-sections explain the DDE conversation, how data isimported to CDP, and theArcView Avenue script at amore technical level.
3.4.1 Data conversation in DDE
Two basic concepts are essential to the understandingof how a DDE conversation works:(1) definition and(2) (2) data exchange methods.
There are two components that define a conversation inDDE: the application name and the topic (ESRI, 1995).Each application has a unique name, generally this isthe name of the application without its extension (e.g.ArcView, EXCEL or ACCESS). A topic refers to thesubject of the conversation. The subject could be a filename or a more general topic (e.g. system). Together,the application name and topic uniquely define eachconversation.
Once the conversation is initiated, specific methods areavailable in DDE for exchanging information. Thesemethods are application specific. ArcView supportsthree basic data exchange methods: Execute, Requestand Poke. Execute sends a command string from theclient to the server application. Here ArcView acts as
the client application and sends commands to CDP.Request instructs ArcView to get data from CDP forprocessing (a flow from server to client) and Pokeactivates a reverse flow enabling ArcView to send datato CDP (a flow from client to server). The application inthis research demonstrates the use of all three DDEmethods of exchanging data.
3.4.2 Data imported to DecisionPlus from anArcView attribute table
In the CDP software, DDE is implemented using thePaste Link option from the Edit menu, which is onlyavailable when data has been copied to the clipboard.The Paste Link command is similar to the Pastecommand except that a DDE link is set up between theCDP and ArcView that puts the data into the clipboard.This allows the data to be transferred immediatelybetween the applications. There are two ways ofimporting data from ArcView: (1) pasting tables of datato ‘Brainstorm’ and (2) creating a DDE link to thehierarchy spreadsheet.
3.4.2.1. Pasting Tables of Data to Brainstorm
Brainstorm is a CDP mode allowing alternative criteriato be quickly considered when building a model.Brainstorm results can be saved and recalled whenneeded. Though a stand-alone capability, brainstormgraphs are most often used to prepare a hierarchy.
A Paste Special menu item exists in the Brainstormwindow's Edit menu. This menu command permits thepasting of a table of data, consisting of criteria names,alternative names, and ratings, into a Brainstorm. Thepasted data is used to create Brainstorm blocks andalternatives. The rating values are retained and whenthe Brainstorm is converted into a hierarchy, the ratingdata is transferred and may be viewed from the ratingscreen. When a Brainstorm file is saved with suchpasted data, the data is stored with the file and isavailable when Open File is used the next time. The dataimported into Brainstorm this way cannot be ‘linked’back to a source application: only the end result ofprocessing data in CDP can be Poked back to ArcView.
There are restrictions on Data format when importingdata to Brainstorm. The decision criteria data that are inan attribute table must be organised in a tabular formatwith either alternative names as column headings andcriteria names as row headings or vice versa (Table 1).The body of the matrix contains rating data, which mustbe numeric. If some of the information in the ArcViewattribute table is unknown, those cells are left blank.
Table 1: Data formats when importing data toBrainstorm
Alt 1 Alt 2 Alt 3 etc...
Cri 1 2.0 3.1 1.3
Cri 2 106 190 155

etc...
Cri 1 Cri 2 etc...
Alt 1 2.0 106
Alt 2 3.1 109
Alt 3 1.3 155
etc...
3.4.2.2. Creating a DDE Link to the HierarchySpreadsheet
Elements of a decision are organized to form a treestructure in CDP. This visible structure of a decision iscalled a Decision hierarchy. In addition to the usualgraphical representation of the hierarchy model, themodel information also can be put into a spreadsheetformat (a Hierarchy Spreadsheet). This allows the userto review and edit the values of the weights and ratingsdirectly, view the associated priorities, and cut andpaste data to and from the spreadsheet. A block of cellscontaining ratings of alternatives may be imported froma spreadsheet that supports DDE links into theHierarchy Spreadsheet.
If some data in ArcView are changed after the data havebeen imported into Brainstorm, the changed cells canbe updated through the DDE link in the HierarchySpreadsheet between the two packages.
Because ArcView only supports Manual link - dataexchange does not occur automatically; the destination(CDP) must request the new data from the source(ArcView). In the integrated system, attribute data inArcView need to be exported to Excel, then a ‘hot’ DDELink is created from an Excel spreadsheet to the CDPHierarchy spreadsheet. This means that if data in Excelchanges, the changes will be automatically forwardedto CDP, and all calculations updated. This is efficientwhen doing "what if" analysis to get different rankingpriorities based on different sets of criteria.
There are some special requirements when linking datato a CDP Hierarchy Spreadsheet:
• Only one ‘live’ link is supported at a time. Creatinga new link destroys the existing link.
• Data cannot be entered or copied into a range of adata set that is receiving information from a DDElink, that is, a cell cannot be receiving values fromtwo different links simultaneously.
• If a model is closed, the link must be recreated byhand when the model is next loaded. Informationon the last link may be found in the Notes of theGoal block.
• When a data set is saved, information about DDEis also saved.
3.4.2.3. The ArcView Avenue Script and ArcViewapplication framework
Avenue is an object oriented programming languageand development environment that is part of ArcView.Avenue provides a high degree of uniformity, stability,and reusability. As in all object-oriented systems, theemphasis in Avenue is on identifying objects and thensending them requests (ESRI, 1994). ArcView's objectsare members of a class hierarchy that are organised intofunctional categories related to all aspects of theapplication and it can be used to create ArcViewapplications.
Developing ArcView GIS applications requiresfamiliarity with its object model that describes objectsand their attributes, operations, and relationships toother objects. ESRI has adopted the graphical notationused in Object Modelling Technique (OMT) to presentthese relationships (Rumbaugh et al.,1991; Razavi,1995).
4. INTERFACE DESIGN FOR A GIS-BASEDMULTI-CRITERIA DECISION MAKING SYSTEM(GIS-MCDMS)
4.1 Development methodology for an ArcView GISapplication
The development methodology is one of the mostimportant parts of implementing a GIS project. Razavi(1995) has proposed the structured methodology fordeveloping ArcView GIS applications, which comprisesthe following stages:
1. Requirement analysis2. Prototyping3. Construction4. Structured testing
The four stages constitute the bedrock of effective GISapplication development. The purpose of requirementsanalysis is to acquire a complete understanding of theproblem and to specify the specific requirements of thesoftware to be used to resolve the clearly definedproblem. Prototyping begins with customisation of theinterface controls and project components and furtherdefine and diagram the data flow. In the constructionphase, the Avenue scripts required for the applicationare developed. The scripts are usually linked to acontrol interface and perform their work independently.The purpose of structured testing is to identifyapplication software defects and to resolve as many ofthese as possible.
The techniques and procedures in Razavi’s (1995)structured methodology have been applied indeveloping many software applications, details aboutwhich are provided in (Demarco, 1979; Davis, 1990;Martin, 1991; Rumbaugh et al., 1991). The interfaceprototyping of the integrated system will be describedand illustrated briefly in the remainder of this Section.

Section 5 will present a demonstration to test thesystem .
4.2 Developing the ArcView Application Interface
During the process of application development, humaninteraction with ArcView program is considered andlets users control the application through the programinterface that provides a flexible, friendly interaction.
Interaction with ArcView takes place through theGraphical User Interface (GUI), also known asdocument GUI (DocGUI). ArcView has five types ofdocument GUIs: views, tables, charts, layouts, andscripts. Each ArcView DocGUI can be created/modifiedand controls to the ArcView interface may be addedeither interactively through the Customise dialog box,or dynamically using Avenue script (ESRI, 1994). Adiagrammatic representation the object model for theuser interface in which a DocGUI class is the startingpoint for the model is shown in Figure 3. A DocGUIclass models the controls used in accessing ArcViewGIS documents. The document GUI object consists ofthe menus, buttons, tools and pop up menus that canbe customised. Generally, button bars consist offrequently used menu items and a tool bar is a set ofmutually exclusive tool buttons that associate a specificprocedure with the cursor.
Figure 3: The Avenue object model for the userinterface
4.3 Customising and modifying the ArcViewInterface
ArcView provides the tools to create and customise theinterface for an application. In this application,interface design is in the ARC/VIEW software, theAvenue language can be used to customise the menusand icons as well as to develop the connection betweenGIS software and CDP software. The Customise dialogbox in ArcView is used to customise the user interface.Menus, button bars, tool bars, and pop up menus canbe customised so that they contain the controls thatmeet the user’s requirements for a particularapplication.
View Document GUI and Table Document GUI havebeen modified to suit the application. The menu system,
tailored for the analysis of branch bank closures, hasbeen added to the view document GUI. The menu(Figure 4) consist of the commands which will be usedmost often for a ranking analysis of branch banks toidentify candidates for closure, such as getting thebranch trading area data, calculating distancesbetween branches and shopping centres, et cetera.Button Bars consist of frequently used menu items, andcreate a fast method for executing the same commandsavailable through the menu. The button bars add to theview GUI are based on the Branch Analysis Menu.
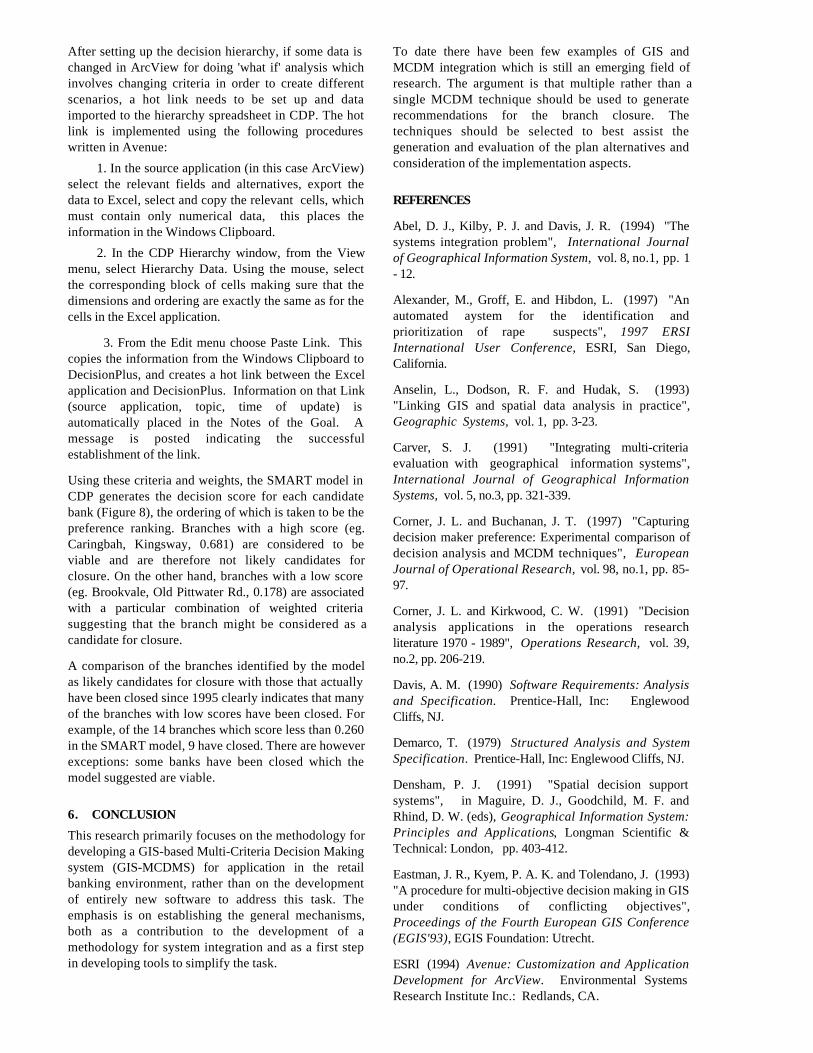
In Table GUI (Figure 5), a DDE menu has been added toprovide the user with the ability to set up DDE linkbetween the ArcView and CDP packages and transferdata between them. The controls in the menu are basedon Avenue scripts. Another Xtool menu has beenadded to provide some easy to use controls forhandling the attribute table data. Some of the morefrequently used menu items have been added as Buttonbars also.
In addition to customising the user interface forArcView GUI, the project window can be tailored too. Awell designed user interface and project window makesan application consistent and easier to use. Thecustomised interface is stored with the project inArcView. This will change the ArcView system to onethat is customised for the particular branch bankclosure application environment.
5. DEMONSTRATION
The SDSS outlined above has been applied in a numberof pilot studies to test its efficiency. The resultsreported here are based on a random sample of 49Commonwealth Bank branches in the SydneyMetropolitan area in 1995, some of which had beenclosed by 2000. The test of the success of the SDSS iswhether or not it can identify these as candidates forclosure.
The criteria listed in Table 2 are used in combination asa basis for deciding whether or not a particular branchis a candidate for closure. The criteria are sortedhierarchically by level. Two levels are used in thisdemonstration.
Some criteria data are generated based on GIS spatialmanipulation and analysis. The database managementfunctions in ArcView are used for managing dataderived from different sources and formats, andintegrating data based on spatial relations. The resultsproduced by ArcView are presented in a standardattribute table (the decision table), the rows in whichcontain the set of branch alternatives, the columns the
DocProject DocGUI
MenuBarrr
ButtonBar ToolBar PopupSet
Application
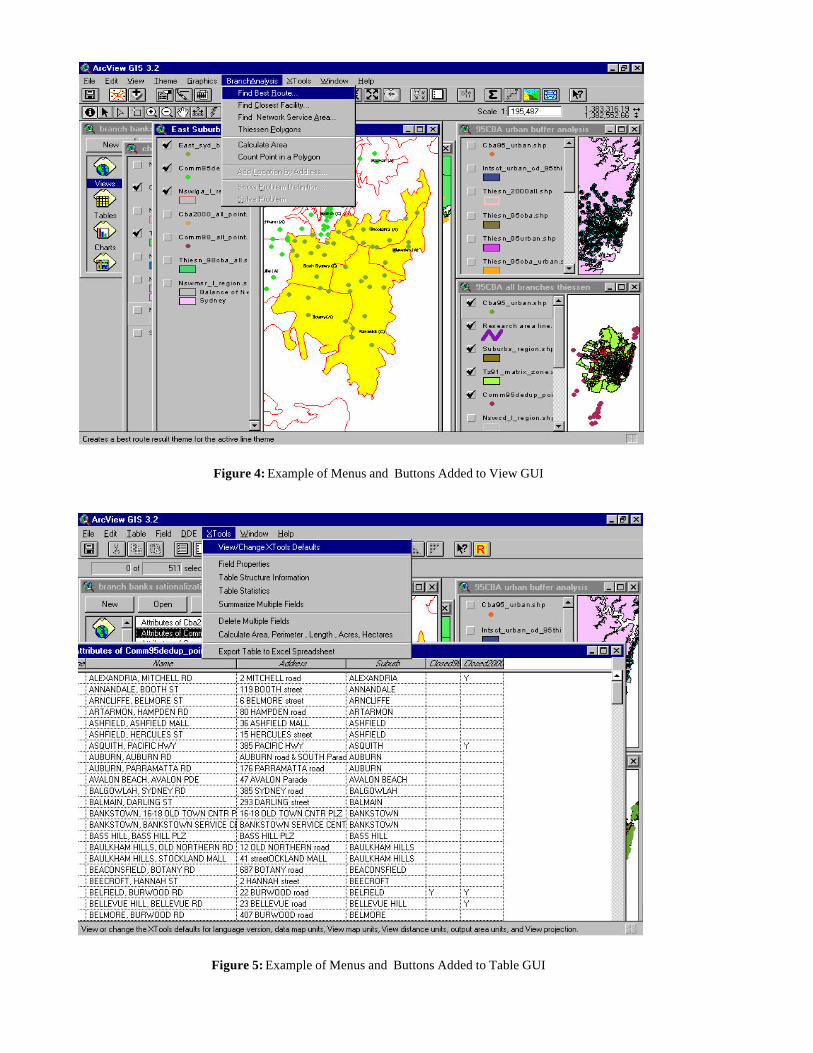
Figure 4: Example of Menus and Buttons Added to View GUI
Figure 5: Example of Menus and Buttons Added to Table GUI

set of decision criteria, and the table elements thecriteria scores. The decision table can be exporteddirectly to CDP through DDE and a program written inAvenue. The multi-criteria decision-making analysis isperformed in CDP, a weighted decision score is thencalculated for each candidate branch bank.
Table 2: The Principle Social and Demographic CriteriaDetermining Branch Profitability
Criteria Attributes (Subcriteria)
Banking population (age 15 & over)
Population (over 15) growth rate
Competitor's branches
Average annual family income
Average age
Employed people
Total (small ) business No.
Cat
chm
ent
area
spec
ific
vari
able
s
Catchment area
Small business in 200m buffer zone
Competitor's branch No. in 200m buffer
Working population in 200m buffer
Same bank's branches in 500m buffer
At shopping centre
Shopping centers Within 500m buffer
Present of a free car park
Lo
cati
on
sp
ecif
icva
riab
le
Proximity to public transport (within1km)
The following steps are involved in importing attributetabular data from ArcView to Brainstorm:
1. Open the attribute table in ArcView whichcontains the criteria data.
2. Select Export Data to CDP from DDE menu. Thisprocess, implemented through the Avenue script, willrun the procedure to select export fields (including
criteria and alternative names), create or locate a tableof data that fits the above description, export selecteddata and place Tab Delimited Strings tables onto theClipboard. The link between the two packages is alsoestablished.
3. In CDP, select the Paste Special menu optionfrom Brainstorm's Edit menu. From the Paste Specialdialog box (Figure 6), indicate whether the rowsrepresent criteria and the columns alternatives or viceversa by selecting the appropriate option button. Thealternatives and criteria from Arcview are exported tothe Brainstorm.
Figure 6: Paste Special Dialog Box in CDP
4. Delete, add notes, connect, and add additionalcriteria as in any Brainstorming session to set updecision hierarchy, and then save the brainstorm model(Figure 7).
Figure 7: Brainstorm Model in CDP
After setting up the decision hierarchy, if some data ischanged in ArcView for doing 'what if' analysis whichinvolves changing criteria in order to create differentscenarios, a hot link needs to be set up and dataimported to the hierarchy spreadsheet in CDP. The hotlink is implemented using the following procedureswritten in Avenue:
1. In the source application (in this case ArcView)select the relevant fields and alternatives, export thedata to Excel, select and copy the relevant cells, whichmust contain only numerical data, this places theinformation in the Windows Clipboard.
2. In the CDP Hierarchy window, from the Viewmenu, select Hierarchy Data. Using the mouse, selectthe corresponding block of cells making sure that thedimensions and ordering are exactly the same as for thecells in the Excel application.
3. From the Edit menu choose Paste Link. Thiscopies the information from the Windows Clipboard toDecisionPlus, and creates a hot link between the Excelapplication and DecisionPlus. Information on that Link(source application, topic, time of update) isautomatically placed in the Notes of the Goal. Amessage is posted indicating the successfulestablishment of the link.
Using these criteria and weights, the SMART model inCDP generates the decision score for each candidatebank (Figure 8), the ordering of which is taken to be thepreference ranking. Branches with a high score (eg.Caringbah, Kingsway, 0.681) are considered to beviable and are therefore not likely candidates forclosure. On the other hand, branches with a low score(eg. Brookvale, Old Pittwater Rd., 0.178) are associatedwith a particular combination of weighted criteriasuggesting that the branch might be considered as acandidate for closure.
A comparison of the branches identified by the modelas likely candidates for closure with those that actuallyhave been closed since 1995 clearly indicates that manyof the branches with low scores have been closed. Forexample, of the 14 branches which score less than 0.260in the SMART model, 9 have closed. There are howeverexceptions: some banks have been closed which themodel suggested are viable.
6. CONCLUSION
This research primarily focuses on the methodology fordeveloping a GIS-based Multi-Criteria Decision Makingsystem (GIS-MCDMS) for application in the retailbanking environment, rather than on the developmentof entirely new software to address this task. Theemphasis is on establishing the general mechanisms,both as a contribution to the development of amethodology for system integration and as a first stepin developing tools to simplify the task.
To date there have been few examples of GIS andMCDM integration which is still an emerging field ofresearch. The argument is that multiple rather than asingle MCDM technique should be used to generaterecommendations for the branch closure. Thetechniques should be selected to best assist thegeneration and evaluation of the plan alternatives andconsideration of the implementation aspects.
REFERENCES
Abel, D. J., Kilby, P. J. and Davis, J. R. (1994) "Thesystems integration problem", International Journalof Geographical Information System, vol. 8, no.1, pp. 1- 12.
Alexander, M., Groff, E. and Hibdon, L. (1997) "Anautomated aystem for the identification andprioritization of rape suspects", 1997 ERSIInternational User Conference, ESRI, San Diego,California.
Anselin, L., Dodson, R. F. and Hudak, S. (1993)"Linking GIS and spatial data analysis in practice",Geographic Systems, vol. 1, pp. 3-23.
Carver, S. J. (1991) "Integrating multi-criteriaevaluation with geographical information systems",International Journal of Geographical InformationSystems, vol. 5, no.3, pp. 321-339.
Corner, J. L. and Buchanan, J. T. (1997) "Capturingdecision maker preference: Experimental comparison ofdecision analysis and MCDM techniques", EuropeanJournal of Operational Research, vol. 98, no.1, pp. 85-97.
Corner, J. L. and Kirkwood, C. W. (1991) "Decisionanalysis applications in the operations researchliterature 1970 - 1989", Operations Research, vol. 39,no.2, pp. 206-219.
Davis, A. M. (1990) Software Requirements: Analysisand Specification. Prentice-Hall, Inc: EnglewoodCliffs, NJ.
Demarco, T. (1979) Structured Analysis and SystemSpecification. Prentice-Hall, Inc: Englewood Cliffs, NJ.
Densham, P. J. (1991) "Spatial decision supportsystems", in Maguire, D. J., Goodchild, M. F. andRhind, D. W. (eds), Geographical Information System:Principles and Applications, Longman Scientific &Technical: London, pp. 403-412.
Eastman, J. R., Kyem, P. A. K. and Tolendano, J. (1993)"A procedure for multi-objective decision making in GISunder conditions of conflicting objectives",Proceedings of the Fourth European GIS Conference(EGIS'93), EGIS Foundation: Utrecht.
ESRI (1994) Avenue: Customization and ApplicationDevelopment for ArcView. Environmental SystemsResearch Institute Inc.: Redlands, CA.

ESRI 1995: ArcView2: Working with Visual Basic, inESRI White Paper, Redlands, CA, .
Fedra, K. (1993) "GIS and environmental modelling",in Goodchild, M. F., Parks, B. O. and Steyaert, L. T.(eds), Environmental Modelling with GIS , OxfordUniversity Press: New York, pp. 35 - 50.
Goodchild, M. F., Haining, R. and Wise, S. (1992)"Integrating GIS and spatial data analysis: problemsand possibilities", International Journal ofGeographical Information Systems, vol. 6, no.5, pp.407 - 423.
Goodchild, M. F., Parks, B. O. and Steyaert, L. T. (1993)Environmental Modelling with GIS . Oxford UniversityPress: New York.
Heywood, I., Oliver, J. and Tomlinson, S. (1995)"Building an exploratory multi-criteria modellingenvironment for spatial decision support", in Fisher, P.(eds), Innovations in GIS 2: Selected Papers from theSecond National Conference on GIS Research UK ,Taylor & Francis: London, pp. 127-136.
Hobbs, B. F., Chankong, V., Hamadeh, W. and Stakhiv,E. Z. (1992) "Does choice of multicriteria methodmatter? An experiment in water resources planning",Water Resources Research, vol. 28, , pp. 1767 - 1779.
Hobbs, B. F. and Horn, G. T. F. (1997) "Building publicconfidence in energy planning: A multimethod MCDMapproach to demand-side planning at BC gas.", EnergyPolicy, vol. 25, no.3, pp. 357-375.
InfoHarvest (2000) Criterium DecisionPlus User'sGuide. InfoHarvest Inc: Seattle.
Jankowski, P. (1995) "Integrating geographicalinformation systems and multiple criteria decision-making methods", International Journal ofGeographical Information System, vol. 9, , pp. 251-273.
Jankowski, P. and Richard, L. (1994) "Integration ofGIS-based suitability analysis and multicriteriaevaluation in a spatial decision support system forroute selection", Environment and Planning B:Planning and Design, vol. 21, no.3, pp. 323-340.
Janssen, R. and Rievelt, P. (1990) "Multicriteriaanalysis and GIS: an application to agricultural landusein the Netherlands", in Scholten, H. J. and Stillwell, J.C. H. (eds), Geographical Information Systems forUrban and Regional Planning, Cluwer AcademicPublisher: Dordrecht,
Martin, J. (1991) Rapid Application Development.Macmillan Publishing Co.: New York.
Nyerges, T. (1992) "Coupling GIS and spatial analyticalmodels", Proceedings of 5th International Symposium
on Spatial Data Handling, Humanities and SocialSciences Computing Laboratory, University of SouthCarolina: Columbia, South Carolina, pp. 534 - 543.
Nyerges, T. (1993) "Understanding the scope of GIS:its relationship to environmental modelling", inGoodchild, M., Parks, B. and Sayert, L. (eds),Environmental Modeling and GIS , Oxford UniversityPress: New York, pp. 75 - 93.
Parks, B. O. (1993) "The need for integration", inGoodchild, M. F., Parks, B. O. and Steyaert, L. T. (eds),Environmental Modelling with GIS , Oxford UniversityPress: New York, pp. 31 - 34.
Pereira, J. M. C. and Duckstein, L. (1993) "A multiplecriteria decision-making approach to GIS-based landsuitability evaluation", International Journal ofGeographical Information Systems, vol. 7, no.1, pp.407 - 424.
Razavi, A. H. (1995) ArcView developer's guide.Onword Press: Santa Fe.
Rumbaugh, J., Blaha, M., W.Premerlani, Eddy, F. andLorensen, W. (1991) Objected-Oriented Modelling andDesign. Prentice-Hall, Inc: Englewood Cliffs, NJ.
Saaty, T. L. (1977) "A scaling method for priorities inhierarchical structures", Journal of MathematicalPsychology, vol. 15, pp. 234 - 281.
Saaty, T. L. (1980) The Analytical Hierarchy Process.McGraw-Hill: New York.
Saaty, T. L. (1992) Multicriteria Decision-making, TheAnalytical Hierarchy Process. RWS Publications:Pittsburg.
Saaty, T. L. (1995) Decision Making for Leaders.RWS Publications: Pittsburgh.
Salminen, P., Hokkanen, J. and Lahdelma, R. (1998)"Comparing multicriteria methods in the context ofenvironmental problems", European Journal ofOperational Research, vol. 104, no.3, pp. 485-496.
Tkach, R. J. (1997) "A new approach to multi-criteriadecision making in water resources", Journal ofGeographic Information and Decision Analysis, vol. 1,no.1, pp. 25 - 43.
Zhao, L. and Garner, J. B. (2001) "Towards thedevelopment of a Spatial Decision Support System(SDSS) for identifying the closure of branch banks",2001 Geography, A Spatial Odyssey: Proceedings ofNZGS and IAG Joint Conference, Dunedin, NewZealand (in press).

Page 12 of 12
Figure 8: Decision Scores