developing affective mental imagery stimuli with ... · developing affective mental imagery stimuli...
TRANSCRIPT

¦ 2015 � vol. 11 � no. 2
TTTThe QQQQuantitative MMMMethods for PPPPsychology
T
Q
M
P
113
Developing affective mental imagery stimuli with multidimensional scaling
Matthew J. Facciani ����, a
a Department of Psychology, University of South Carolina
AbstractAbstractAbstractAbstract � The goal of this paper is to provide an example of how multidimensional scaling (MDS) can be used for stimuli development. The study described in this paper illustrates this process by developing affective mental imagery stimuli using the circumplex model of affect as a guide. The circumplex model of affect argues that all emotions can be described in terms of two underlying primary dimensions: valence and arousal (Russel, 1980). We used MDS to determine if affective mental imagery stimuli obtained from verbal prompts could be separated by arousal and valence to create four distinct categories (high –positive, low-positive, high-negative, and low-negative) as seen in other stimuli. 60 students from the University of South Carolina participated in the first experiment to evaluate three sets of stimuli. After being analyzed using MDS, selected stimuli were then assessed again in a second experiment to validate their robust valence and arousal distinctions. The second experiment was conducted with 34 subjects to validate 40 of the best stimuli from experiment 1. It was found that mental imagery stimuli can produce a reliable affective response for the dimensions of valence and arousal and that MDS can be an effective tool for stimuli development.
Keywords Keywords Keywords Keywords � multidimensional scaling, stimuli development, mental imagery, affect, SYSTAT
���� [email protected]
IntroductionIntroductionIntroductionIntroduction
Knowing which statistical methods to use can greatly
assist the vital (yet tedious) process of stimuli
development for psychological research. This study
aimed to illustrate how multidimensional scaling (MDS)
could assist with the development of affective mental
imagery stimuli. MDS revealed if the present stimuli
were congruent with the circumplex theory of affect
(Russel, 1980). This process can be applied to a wide
range of potential stimuli.
Core Affect
The term affect has been used in the behavioral
sciences since the early days of Wilhelm Wundt. Wundt
characterized affect as a feeling state vital to cognition.
This feeling state could be altered from a variety of
experiences. His example was that “the
unpleasureableness of a toothache, of an intellectual
failure, and of a tragic experience are all regarded as
identical affective contents” (1897, p.85). Thus, how
people felt about things could be altered in the same
way regardless of the stimulus they were presented
with. Wundt’s conceptualization of affect was quite
congruent with contemporary psychologists. Affect is
presently regarded as a mental state in response to a
stimulus which can be pleasant or unpleasant with
some degree of arousal (Barrett & Bliss Moreau, 2009;
Russell 2003). Valence can be described as how
positive or negative an emotion is and arousal can be
described by how strong an emotion is (Russell, 2003).
Core affect then characterizes emotion as an
internal and consciously accessible state which is
comprised of an integral blend of valence and arousal
(Brosch, Pourtoise, & Sander, 2010; Russel, 2003). Core
affect can be altered by different stimuli. The greater
the change in core affect from the stimulus, the stronger
affective quality the stimulus has (Brosch, Pourtoise, &
Sander, 2010; Russel, 2003). A person’s core affect can
be understood from a linear combination of the
dimensions of valence and arousal (Barrett & Russel,
1999; Feldman, 1995; Russel, 1980; Russel & Barrett,
1999). The affective state may have positive valence
and high arousal differing it from an affective state that
elicits positive valance and low arousal. For example,
the affective states of calm and excited would be
considered positive emotions; however, they would
differ significantly on arousal.
A common way to scientifically study core affect is
to present a participant with an affective stimulus, and
document the ensuing affective response. Picture, word,
sound, and smell stimuli have been shown to reliably
elicit affective responses derived from the judgments
participants make on them (Alaoui-Ismaïli, et al., 1997;
¦ 2015 � vol. 11 � no. 2
TTTThe QQQQuantitative MMMMethods for PPPPsychology
T
Q
M
P
114
Jackson et al., 2000; Roberts &Wedell, 1994; Zentner,
Grandjean, &Scherer, 2008;). The variability in
judgments of affective stimuli have been shown to
result in a circumplex-like pattern which fostered the
concept of the circumplex model of affect.
The Circumplex Model of Affect
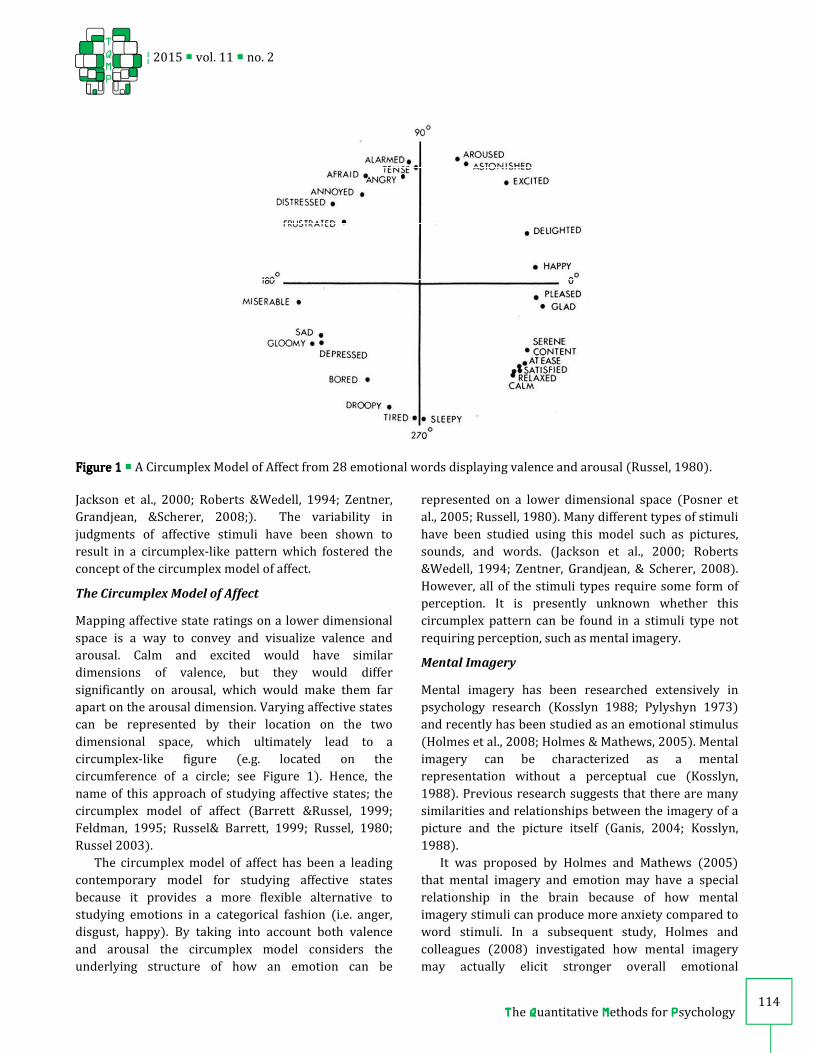
Mapping affective state ratings on a lower dimensional
space is a way to convey and visualize valence and
arousal. Calm and excited would have similar
dimensions of valence, but they would differ
significantly on arousal, which would make them far
apart on the arousal dimension. Varying affective states
can be represented by their location on the two
dimensional space, which ultimately lead to a
circumplex-like figure (e.g. located on the
circumference of a circle; see Figure 1). Hence, the
name of this approach of studying affective states; the
circumplex model of affect (Barrett &Russel, 1999;
Feldman, 1995; Russel& Barrett, 1999; Russel, 1980;
Russel 2003).
The circumplex model of affect has been a leading
contemporary model for studying affective states
because it provides a more flexible alternative to
studying emotions in a categorical fashion (i.e. anger,
disgust, happy). By taking into account both valence
and arousal the circumplex model considers the
underlying structure of how an emotion can be
represented on a lower dimensional space (Posner et
al., 2005; Russell, 1980). Many different types of stimuli
have been studied using this model such as pictures,
sounds, and words. (Jackson et al., 2000; Roberts
&Wedell, 1994; Zentner, Grandjean, & Scherer, 2008).
However, all of the stimuli types require some form of
perception. It is presently unknown whether this
circumplex pattern can be found in a stimuli type not
requiring perception, such as mental imagery.
Mental Imagery
Mental imagery has been researched extensively in
psychology research (Kosslyn 1988; Pylyshyn 1973)
and recently has been studied as an emotional stimulus
(Holmes et al., 2008; Holmes & Mathews, 2005). Mental
imagery can be characterized as a mental
representation without a perceptual cue (Kosslyn,
1988). Previous research suggests that there are many
similarities and relationships between the imagery of a
picture and the picture itself (Ganis, 2004; Kosslyn,
1988).
It was proposed by Holmes and Mathews (2005)
that mental imagery and emotion may have a special
relationship in the brain because of how mental
imagery stimuli can produce more anxiety compared to
word stimuli. In a subsequent study, Holmes and
colleagues (2008) investigated how mental imagery
may actually elicit stronger overall emotional
Figure 1Figure 1Figure 1Figure 1 � A Circumplex Model of Affect from 28 emotional words displaying valence and arousal (Russel, 1980).

¦ 2015 � vol. 11 � no. 2
TTTThe QQQQuantitative MMMMethods for PPPPsychology
T
Q
M
P
115
responses in comparison to verbal processing in
several emotions. These researchers concluded this
may be due to (i) the sensitivity of emotional brain
regions to imagery, (ii) how similar imagery is to
perception, (iii) and the influence of emotional
autobiographical memories. While emotional mental
imagery has been studied extensively, it is unknown if
mental imagery can produce affective states similarly
seen in word, sound, and picture stimuli.
Multidimensional scaling could be a useful statistical
method to determine if mental imagery could produce
an affective circumplex pattern.
Multidimensional scaling
MDS is an exploratory data analysis technique that
allows the researcher to visualize the structure of the
data (Torgerson, 1952). MDS conceptualizes
similarities between objects as distances in lower
dimensional space (Kruskal & Wish, 1978). The
mathematical objective of MDS is to find a space of low
dimensionality in which objects can be placed so that
the Euclidian distance between them match perceived
similarity expressed by the participants (Shepard,
1962). The map comprised of all the points is specified
by a corresponding representative function. This
function states how the distances should be ideally
related. The solution is found by the ideal configuration
which satisfies the function as best as possible
(Groenen & van de Velden, 2004). This solution is then
evaluated by a measure that assesses how good or bad
the fit is. This measure is called stress which is a
normed sum-of-squares of errors. The more error there
is between the observed data and the proposed map,
the higher the stress. Generally, a stress value lower
than .05 is considered excellent (Kruskal & Wish,
1978). To show the goodness of fit for MDS, the R-
squared value can explain how much of the variance in
the data is accounted for by the corresponding
distances. R-squared and stress are only two of the
various techniques available to analyze circumplex
models (Tracey, 2000).
MDS is a great way to visualize the data from a
single matrix. This single matrix is a matrix of similarity
(or dissimilarity) such that the entry in row i, column j
indicates to what level the subject felt that item i was
similar (or dissimilar) to item j. If the researcher wants
to compare multiple matrices of data and explore
individual differences, different techniques must be
used. To examine a lower dimensional representation
of the individual matrices, Individual Differences Multi-
Dimensional Scaling (INDSCAL) (Carroll & Chang,
1970) can be used to find individual differences which
is vital for stimuli development. This technique creates
a prototype of the averaged matrices first. After that,
each individual matrix is compared to the prototype to
see how different it is from the common configuration.
If a matrix has to stretch itself greatly to fit the
prototype, then it does not have a good fit and is
considered to be dissimilar. Thus, for INDSCAL, a low
stress value for a particular matrix would suggest it is
quite similar to the common configuration. Generally,
increasing the number of matrices will increase the
stability of the prototype of averaged matrices (Carroll
& Chang, 1970). Giguère (2006) offers a great guide for
collecting and analyzing data in multidimensional
scaling experiments using SPSS. Jaworska &
Chupetlovska-Anastasova (2009) discuss how
multidimensional scaling can be used for various
psychological domains, but do not discuss how it can be
used for stimuli development. The present study aims
to illustrate how MDS and INDSCAL can be used for
affective mental imagery stimuli development.
MethodsMethodsMethodsMethods
Participants
Ninety four students from the University of South
Carolina were recruited via Sona Systems (participant
recruitment software) and received partial course
credit to participate in the experiments. Sixty of these
participants participated in the first experiment and 34
participated in the second experiment. Participants
were given an informed consent form, in accordance
with the institutional review board at the University of
South Carolina, and completed the experiment in a
controlled room on a computer.
Materials and Procedure
The initial set of mental imagery stimuli was generated
from the four quadrants of the valence-by-arousal
affective space: positive high, positive low, negative
high and negative low. One hundred and twenty total
stimuli were created by the author and other lab
members. Participants were asked to imagine various
objects and scenarios, for example, ‘imagine a winning
lottery ticket.’ For each trial, a participant had 4
seconds to imagine the object or scenario, then make a
response on a computer indicating the degree to which
they felt positive, happy, relaxed, calm, excited, anxious,
angry, negative, sad, and disgusted, with 1

¦ 2015 � vol. 11 � no. 2
TTTThe QQQQuantitative MMMMethods for PPPPsychology
T
Q
M
P
116
corresponding to “not at all” and 9 corresponding to
“very much” (Figure 2). Imagery stimuli were
presented 10 separate times each, to obtain a rating on
each of 10 scales. Stimuli were presented using E-Prime
2.0 software (Psychology Software Tools, Pittsburgh,
PA).
Experiment 1
Ratings for the 120 phrases were collected to examine
the variability in the ratings among stimuli. Of the 60
participants who participated in this study, 20
participants were run for each stimuli set consisting of
40 phrases. Segmenting the 120 phrases into three sets
was done to shorten the experiment and reduce test
fatigue (each participant only rated 40 stimuli). The
stimuli with the most extreme valance and arousal
ratings revealed by the MDS results were compiled into
a new stimuli set for experiment 2.
Experiment 2
The goal of collecting data from this set was to validate
the affective responses to the selected stimuli and
create a validated subset of stimuli with strong
differences on valence and arousal ratings. Participants
in experiment 2 completed the same procedure with a
subset of stimuli from experiment 1. By doing this, a
subset of categorical affective stimuli from experiment
1 was created. This selected subset of the 40 most
extreme stimuli from experiment 1 formed four distinct
categories (high positive, low positive, high negative,
low negative). The selection was made by judging
which stimuli were most extreme in each quadrant (i.e.
high positive stimuli would be in the top right of the
MDS solution).
Data Preprocessing
Each participant’s data from E-Prime was transferred in
Excel to create a spreadsheet for all of the data per each
experiment. The rows represent the participant’s rating
scores for each scale and the columns represent the
stimuli (i.e. “kitten” is LP5). Each stimuli had a label
assigned (HN for high negative, HP for high positive, LN
for low negative, and LP for low positive) as well as an
ID number. Finally, the excel data is taken from the
Excel file (see Figure 3) and transferred into SYSTAT.
Listing 1Listing 1Listing 1Listing 1 � SYSTAT code for importing the Excel file into
SYSTAT.
FPATH "C:\Users\Matthew\Desktop\"
/USE, SAVE, OUTPUT, IMPORT
IMPORT mental.xlsx/ TYPE=EXCEL,SHEET=1
ESAVE MentalImagery4
rem *** PROFILEs FOR different Stimuli
USE MentalImagery4
Three participants were removed from final analysis
of experiment 2. We removed these participants
because 3 out of the 4 participants with the highest
stress value were responding with one answer in the
Figure 2Figure 2Figure 2Figure 2 � Illustration of experimental task. Stimuli were presented on a computer screen with E-PRIME for 4 s
followed by the participant’s response to a rating scale.

¦ 2015 � vol. 11 � no. 2
TTTThe QQQQuantitative MMMMethods for PPPPsychology
T
Q
M
P
117
ratings for the majority of the experiment and were
probably not giving a strong effort. The other
participant with a high stress value did have a variety of
responses so we felt their data was still legitimate.
Correlation Matrices
Pairwise correlations were computed from the
participant’s judgment ratings and the affective
imagery stimuli. These pairwise correlations were then
used to create a correlation matrix of ratings for each
participant (see Figure 4). These correlation matrices
determine the relationship between the affective
ratings and measures the similarity between the
stimuli. The data were analyzed as similarities, which
produced data matrices. The number of data matrices
corresponds to the number of subjects. For example,
there were 34 data matrices produced during MDS in
Experiment 2 because Experiment 2 had 34 subjects.
The correlation matrices of subject data were then
appended to prepare for INDSCAL. To analyze
similarity of stimulus ratings, Individual Differences
Multi-Dimensional Scaling (INDSCAL) (Carroll & Chang,
1970) was conducted. See Listing 2 for example code.
Multidimensional scaling methods
MDS visualizes dissimilarities between objects as
distances in lower dimensional space. The objects
would be the mental imagery stimuli for the present
study. Similarity among imagery stimuli is then
computed from the affective judgment ratings. The
relationship between the affective ratings was created
by a correlation matrix and is the measure of similarity
between the objects. Each object can be represented on
a two dimensional space by a single point. The present
Figure 3Figure 3Figure 3Figure 3 � Excel file with E-prime data showing first two participants (subject column), rating scales (emotion
column), and the first five high negative stimuli shown in the screen capture (coded HN1-HN5).

¦ 2015 � vol. 11 � no. 2
TTTThe QQQQuantitative MMMMethods for PPPPsychology
T
Q
M
P
118
study would aim for a configuration which mirrors the
circumplex model of affect and the farther two points
are on the space, the more dissimilar they are.
Importantly, each point in the lower dimensional space
represents each stimulus making it quite easy to
visually determine how similar and different the stimuli
are from each other. The final step is to use the
appended matrices for monotonic MDS and ultimately
INDSCAL using the Kruskal method. See Listing 3.
Evaluation of stimuli can be done visually or looking
at the highest (or lowest) distances from the
coordinates in two dimensions. The appendix provides
the example output of the MDS and INSCAL solution.
The MDS methods for both Experiment 1 and 2 were
identical. Affective judgment ratings for each stimuli
were compiled in an Excel spreadsheet from the E-
prime experiment. The Excel spreadsheet was then
loaded into SYSTAT (Systat Software, Inc., 2007), which
had each subject’s ratings of all the stimuli. SYSTAT
software was used to conduct the INDSCAL to
determine the individual differences in the ratings of
stimuli to find which stimuli were consistently rated in
a particular area of the circumplex. For INDSCAL, a low
stress value for a particular matrix would suggest it is
quite similar to the common configuration. The
strength of association between the participant’s
original data and the overall values predicted by the
INDSCAL model can be represented by R-squared. So if
a single participant’s data had a high stress value and
low R-squared, the researchers could conclude that
their affective ratings were not consistent with the
aggregate ratings from the rest of the participants. We
Figure 4Figure 4Figure 4Figure 4 � Pearson correlation matrix produced in SYSTAT from participant’s judgment ratings and affective imagery
stimuli.

¦ 2015 � vol. 11 � no. 2
TTTThe QQQQuantitative MMMMethods for PPPPsychology
T
Q
M
P
119
felt that R-squared and stress values were sufficient for
our study, but as noted above there are many other
techniques to analyze circumplex models (Tracey,
2000).
ResultsResultsResultsResults
A circumplex structure emerged from the mental
imagery ratings from experiment 1 (see Figure 5).
Valence was separated very well overall with the
exception of ‘rainy day’ being neutral in valence in
experiment 1. Arousal was not separated as well with
many stimuli falling in the middle of the space (see
Figure 5). Based on the configuration resulting from
Experiment 1, 40 stimuli with valence and arousal
ratings on the extremes of the valence-arousal space
(e.g. in the outside corner of the four quadrants) were
selected for experiment 2. Evaluation of stimuli from
the first experiment was done visually and by choosing
the highest (or lowest) distances from the coordinates
in two dimensions.
Experiment 2 showed very good separation of
valence and arousal and validated most of the stimuli,
Listing 2Listing 2Listing 2Listing 2 � SYSTAT code for running correlations on the affective mental imagery stimuli data. The correlation
matrices were then appended to prepare for INDSCAL. Code for only four participants is shown as an example for
clarity purposes. Additional participant data can be added by following the same procedure.
rem CORRelations
CORR
SELECT Subject = 1
SAVE MentalImagery1_Cor_S1
PEARSON HN1 HN2 HN3 HN4 HN5 HN6 HN7 HN8 HN9 HN10,
HP1 HP2 HP3 HP4 HP5 HP6 HP7 HP8 HP9 HP10,
LN1 LN2 LN3 LN4 LN5 LN6 LN7 LN8 LN9 LN10,
LP1 LP2 LP3 LP4 LP5 LP6 LP7 LP8 LP9 LP10
SELECT Subject = 2
SAVE MentalImagery1_Cor_S2
PEARSON HN1 HN2 HN3 HN4 HN5 HN6 HN7 HN8 HN9 HN10,
HP1 HP2 HP3 HP4 HP5 HP6 HP7 HP8 HP9 HP10,
LN1 LN2 LN3 LN4 LN5 LN6 LN7 LN8 LN9 LN10,
LP1 LP2 LP3 LP4 LP5 LP6 LP7 LP8 LP9 LP10
SELECT Subject = 3
SAVE MentalImagery1_Cor_S3
PEARSON HN1 HN2 HN3 HN4 HN5 HN6 HN7 HN8 HN9 HN10,
HP1 HP2 HP3 HP4 HP5 HP6 HP7 HP8 HP9 HP10,
LN1 LN2 LN3 LN4 LN5 LN6 LN7 LN8 LN9 LN10,
LP1 LP2 LP3 LP4 LP5 LP6 LP7 LP8 LP9 LP10
SELECT Subject = 4
SAVE MentalImagery1_Cor_S4
PEARSON HN1 HN2 HN3 HN4 HN5 HN6 HN7 HN8 HN9 HN10,
HP1 HP2 HP3 HP4 HP5 HP6 HP7 HP8 HP9 HP10,
LN1 LN2 LN3 LN4 LN5 LN6 LN7 LN8 LN9 LN10,
LP1 LP2 LP3 LP4 LP5 LP6 LP7 LP8 LP9 LP10
NEW
APPEND MentalImagery1_Cor_S1 MentalImagery1_Cor_S2
ESAVE MentalImagery1_Cor
APPEND MentalImagery1_Cor MentalImagery1_Cor_S3
ESAVE MentalImagery1_Cor
APPEND MentalImagery1_Cor MentalImagery1_Cor_S4
ESAVE MentalImagery1_Cor
Listing 3Listing 3Listing 3Listing 3 � SYSTAT code for running MDS on the affective mental imagery stimuli data.
USE MentalImagery1_Cor
MDS
MODEL HN1 .. LP10 / SHAPE=SQUARE
ESTIMATE / LOSS=KRUSKAL DIM=2 SPLIT=MATRIX
ESTIMATE / LOSS=KRUSKAL DIM=2 SPLIT=MATRIX WEIGHT
ESTIMATE / LOSS=KRUSKAL DIM=2 SPLIT=MATRIX REGRESSION=MONO

¦ 2015 � vol. 11 � no. 2
TTTThe QQQQuantitative MMMMethods for PPPPsychology
T
Q
M
P
120
but there were a few exceptions (see Figure 6). ‘A bowl
of rotten eggs’, for example, was more similar to high
arousal stimuli in the first experiment, but was more
similar to low arousal stimuli in the second experiment.
Additionally, ‘jail cell’ were low negative in the first
experiment, but became high negative in the second
experiment. ‘Unopened present’ also changed arousal
from the first experiment as it moved from low positive
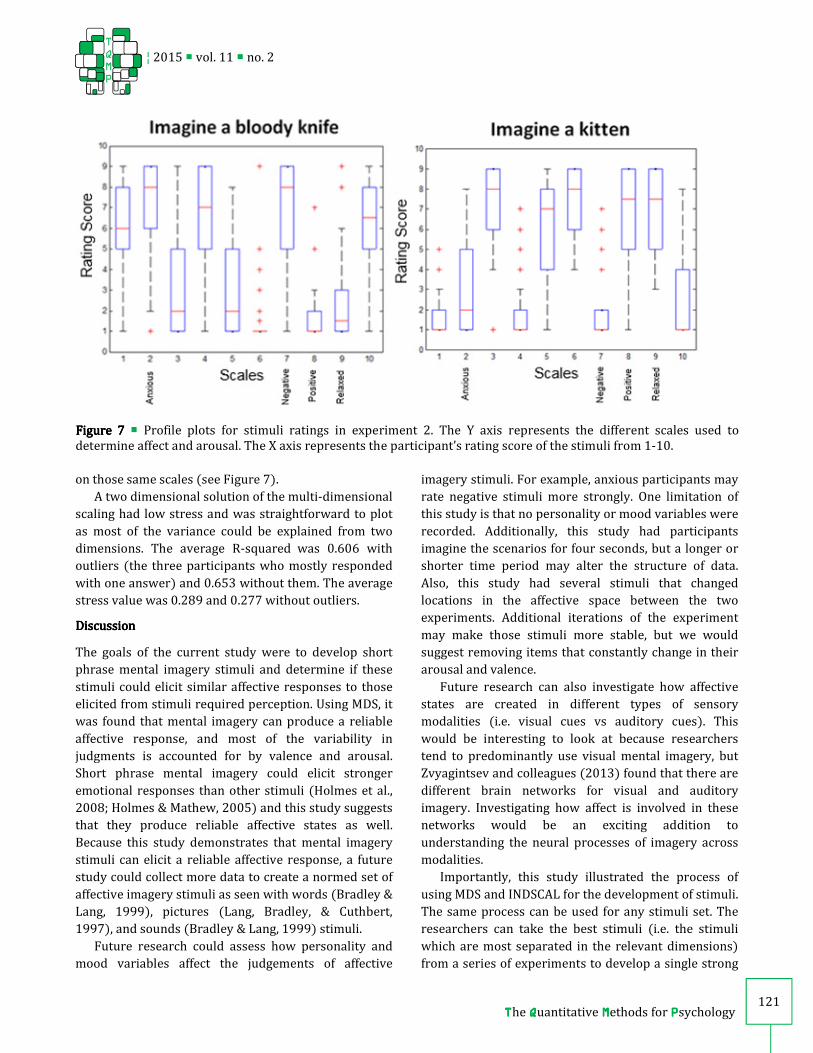
to slightly high positive. Profile plots revealed which
affective rating scales contributed to the location of a
point on the space. For example, ‘bloody knife’ had high
ratings for the ‘negative’ and ‘anxious’ scales across
participants which contrasted to ‘kitten’ having low
ratings in the ‘negative’ and ‘anxious’ scales.
Conversely, ‘bloody knife’ had low ratings on the ‘calm’
and ‘positive’ scales, whereas ‘kitten’ had high ratings
Figure 5Figure 5Figure 5Figure 5 � Experiment 1: A two-dimensional multidimensional scaling solution for three stimuli sets (N=20). Each
dot represents a short phrase whereas blue represents negative stimuli and red represents positive. The collection of
dots produces a clear representation of the circumplex on the dimensions of arousal and valence. The stimulus
“rainy day” can be seen close to the center coordinate in the second panel, which suggests neutral valence and
arousal.
Figure 6Figure 6Figure 6Figure 6 � Experiment 2: A multidimensional scaling solution for the validated stimuli set (N=34). Each dot
represents a short phrase. The collection of dots produces a clear representation of the circumplex on the
dimensions of arousal and valence. Blue represents negative stimuli, whereas red represents positive. The scales on
this figure represent arbitrary units of distance. The “a bowl of rotten eggs” stimulus can be seen as the filled in blue
dot in the lower left quadrant.
¦ 2015 � vol. 11 � no. 2
TTTThe QQQQuantitative MMMMethods for PPPPsychology
T
Q
M
P
121
on those same scales (see Figure 7).
A two dimensional solution of the multi-dimensional
scaling had low stress and was straightforward to plot
as most of the variance could be explained from two
dimensions. The average R-squared was 0.606 with
outliers (the three participants who mostly responded
with one answer) and 0.653 without them. The average
stress value was 0.289 and 0.277 without outliers.
DiscussionDiscussionDiscussionDiscussion
The goals of the current study were to develop short
phrase mental imagery stimuli and determine if these
stimuli could elicit similar affective responses to those
elicited from stimuli required perception. Using MDS, it
was found that mental imagery can produce a reliable
affective response, and most of the variability in
judgments is accounted for by valence and arousal.
Short phrase mental imagery could elicit stronger
emotional responses than other stimuli (Holmes et al.,
2008; Holmes & Mathew, 2005) and this study suggests
that they produce reliable affective states as well.
Because this study demonstrates that mental imagery
stimuli can elicit a reliable affective response, a future
study could collect more data to create a normed set of
affective imagery stimuli as seen with words (Bradley &
Lang, 1999), pictures (Lang, Bradley, & Cuthbert,
1997), and sounds (Bradley & Lang, 1999) stimuli.
Future research could assess how personality and
mood variables affect the judgements of affective
imagery stimuli. For example, anxious participants may
rate negative stimuli more strongly. One limitation of
this study is that no personality or mood variables were
recorded. Additionally, this study had participants
imagine the scenarios for four seconds, but a longer or
shorter time period may alter the structure of data.
Also, this study had several stimuli that changed
locations in the affective space between the two
experiments. Additional iterations of the experiment
may make those stimuli more stable, but we would
suggest removing items that constantly change in their
arousal and valence.
Future research can also investigate how affective
states are created in different types of sensory
modalities (i.e. visual cues vs auditory cues). This
would be interesting to look at because researchers
tend to predominantly use visual mental imagery, but
Zvyagintsev and colleagues (2013) found that there are
different brain networks for visual and auditory
imagery. Investigating how affect is involved in these
networks would be an exciting addition to
understanding the neural processes of imagery across
modalities.
Importantly, this study illustrated the process of
using MDS and INDSCAL for the development of stimuli.
The same process can be used for any stimuli set. The
researchers can take the best stimuli (i.e. the stimuli
which are most separated in the relevant dimensions)
from a series of experiments to develop a single strong
Figure 7Figure 7Figure 7Figure 7 � Profile plots for stimuli ratings in experiment 2. The Y axis represents the different scales used to
determine affect and arousal. The X axis represents the participant’s rating score of the stimuli from 1-10.

¦ 2015 � vol. 11 � no. 2
TTTThe QQQQuantitative MMMMethods for PPPPsychology
T
Q
M
P
122
set of stimuli. The circumplex model of affect provides
an easy map to measure stimuli, but future studies can
use MDS to visualize the similarities of stimuli from any
theory. The key part of the present study is that it
describes how using multidimensional scaling in a
series of experiments can develop stimuli. We hope that
future researchers can employ this technique in their
own stimuli development.
Authors’ notes and acknowledgments Authors’ notes and acknowledgments Authors’ notes and acknowledgments Authors’ notes and acknowledgments
I would like to thank Jongwan Kim, Mary-Catherine
Newell, Neha Jaggi, and Arjamand Sami for their help
creating stimuli and collecting data for this study.
Correspondence to: Matthew Facciani, Department of
Psychology, University of South Carolina, Columbia,
South Carolina, 29208, USA.
ReferencesReferencesReferencesReferences
Alaoui-Ismaïli, O., Robin, O., Rada, H., Dittmar, A. and
Vernet-Maury, E. (1997) Basic emotions evoked by
odorants: comparison between autonomic resp-
onses and self-evaluation. Physiological Behavior,
62, 713 -720.
Barrett, L.F., Bliss-Moreau, E., 2009. Affect as a
psychological primitive. Advances in Experimental
Social Psychology, 41, 167-218.
Barrett, L. F., & Russell, J. A. (1999). Structure of current
affect. Current Directions in Psychological Science, 8,
10–14.
Bradley, M. M., & Lang, P. J. (1994). Measuring emotion:
The self-assessment manikin and the semantic
differential. Journal of Behavioral Therapy and
Experimental Psychiatry, 25, 49–59.
Bradley, M. M., & Lang, P. J. (1999). International
affective digitized sounds (IADS): Stimuli,
instruction manual and affective ratings (Tech. Rep.
No. B-2). Gainesville, FL: The Center for Research in
Psychophysiology, University of Florida
Bradley, M. M., & Lang, P. J. (1999). Affective norms for
English words (ANEW): Instruction manual and
affective ratings (Tech. Rep. No. C-1). Gainesville, FL:
University of Florida, The Center for Research in
Psychophysiology.
Brosch T., Pourtois G., & Sander D. (2010). The
perception and categorisation of emotional stimuli:
A review. Cognition & Emotion, 24(3): 377-400.
Carroll, J. D., & Chang, J. J. (1970). Analysis of individual
differences in multidimensional scaling via an N-
way generalization of “Eckart-Young”
decomposition. Psychometrika, 35(3), 283-319.
Feldman, L. A. (1995). Valence focus and arousal focus:
Individual differences in the structure of affective
experience. Journal of Personality and Social
Psychology, 69, 153–166.
Ganis, G., Thompson, W. L., and Kosslyn, S. M. (2004).
Brain areas underlying visual mental imagery and
visual perception: an fMRI study. Cognitive Brain
Research, 20, 226-241.
Giguère, G. (2006). Collecting and analyzing data in
multidimensional scaling experiments: A guide for
psychologists using SPSS. Tutorials in Quantitative
Methods for Psychology, 2(1), 27-38.
Groenen, P., & VandeVelden, M. “Multidimensional
Scaling,” (2004). Econometric Institute Report.
Holmes, E.A. & Mathews, A. (2005). Emotion, 5(4), 489-
497.
Holmes, E.A., Mathews, A., Mackintosh, B., & Dalgleish,
T. (2008). Emotion, 8(3), 395-409.
Jackson, D. C., Malmstadt, J. R., Larson, C. L. and
Davidson, R. J. (2000), Suppression and
enhancement of emotional responses to unpleasant
pictures. Psychophysiology, 37, 515–522.
Jaworska, N., & Chupetlovska-Anastasova, A. (2009). A
review of multidimensional scaling (MDS) and its
utility in various psychological domains. Tutorials in
Quantitative Methods for Psychology, 5(1), 1-10.
Kosslyn, S. M. (1988). Aspects of a cognitive
neuroscience of mental imagery. Science, 240, 1621-
1626. Reprinted in B. J. Baars, W. P. Banks, and J. B.
Newman (Eds.), Essential sources in the scientific
study of consciousness. Cambridge, MA: MIT Press.
pp. 457-468.
Kruskal, J. B., & Wish, M. (1978). Multidimensional
scaling (Vol. 11). Sage.
Lang P. J., Bradley, M., M., & Cuthbert, B. N. (1997).
International Affective Picture System (IAPS):
Technical Manual and Affective Ratings (National
Institute of Mental Health Center for the Study of
Emotion and Attention, Gainesville, FL).
Lang, P. J., Bradley, M. M., & Cuthbert, B. N. (1997).
Motivated attention: Affect, activation, and action. In
P. J.Lang, R. F. Simons, & M. T. Balaban (Eds.),
Attention and orienting: Sensory and motivational
processes (pp.97–135). Hillsdale, NJ: Erlbaum.
Pylyshyn, Z. W. (1973). What the mind’s eye tells the
mind’s brain: a critique of mental imagery.
Psychological Bulletin, 80, 1-24
Posner, J., Russell, J., Peterson, B.S., 2005. The
circumplex model of affect: an integrative approach
to affective neuroscience, cognitive development,

¦ 2015 � vol. 11 � no. 2
TTTThe QQQQuantitative MMMMethods for PPPPsychology
T
Q
M
P
123
and psychopathology. Developmental Psycho-
pathology, 17, 715–734.
Roberts, J.S., & Wedell, D.H. (1994). Context effects on
similarity judgments of multidimensional stimuli:
Inferring the structure of the emotion space. Journal
of Experimental Social Psychology, 30, 1–38.
Russell, J., 1980. A circumplex model of affect. Journal of
Personality and Social Psychology, 39, 1161–1178.
Russell, J. A., & Barrett, L. F. (1999). Core affect,
prototypical emotional episodes, and other things
called emotion: Dissecting the elephant. Journal of
Personality and Social Psychology, 76, 805–819.
Russell, J. A. (2003). Core affect and the psychological
construction of emotion. Psychological Review, 110,
145-172.
Shepard, R. N. (1962). The analysis of proximities:
Multidimensional scaling with an unknown distance
function. I. Psychometrika, 27(2), 125-140.
Systat Software, Inc. (2007). SYSTAT 12 statistics.
Torgerson, W. S. (1952). Multidimensional scaling: I.
theory and method. Psychometrika, 17, 401-419
Tracey, T. J. G. (2000). Analysis of circumplex models. In
H. E. A. Tinsley, & S. D. Brown (Eds.), Handbook of
applied multivariate statistics and mathematical
modeling (pp. 641–664). New York: Academic Press.
Wundt, W. (1998b). Outlines of psychology (C.H. Judd,
Trans.). Bristol, UK: Thoemmes Press (Original work
published 1897).
Zentner, M., Grandjean, D., & Scherer, K. R. (2008).
Emotions evoked by the sound of music:
characterization, classification, and
measurement. Emotion,8(4), 494.
Zvyagintsev, M., Clemens, B., Chechko, N., Mathiak, K. A.,
Sack, A. T., & Mathiak, K. (2013). Brain networks
underlying mental imagery of auditory and visual
information. European Journal of Neuro-
science, 37(9), 1421-1434.
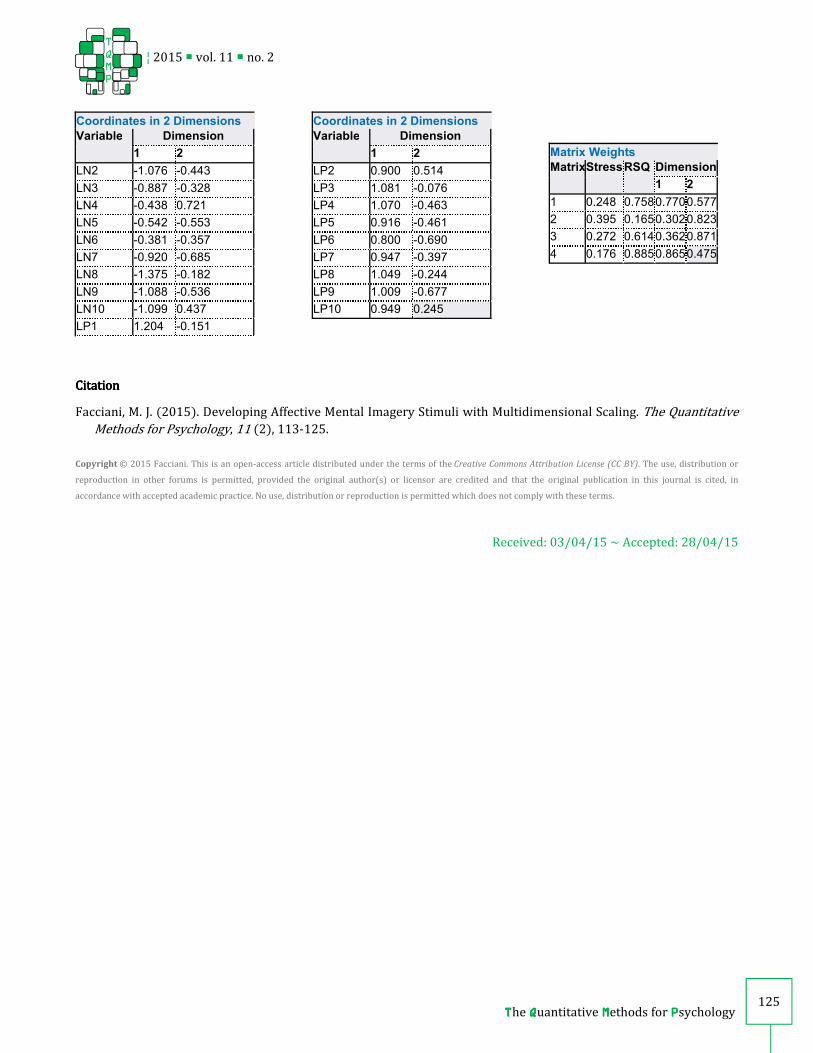
AppendixAppendixAppendixAppendix:::: SYSTATSYSTATSYSTATSYSTAT output of coordinates of stimuli and plot of MDS solutionoutput of coordinates of stimuli and plot of MDS solutionoutput of coordinates of stimuli and plot of MDS solutionoutput of coordinates of stimuli and plot of MDS solution
Each dot represents where the stimuli falls on the multidimensional space.

¦ 2015 � vol. 11 � no. 2
TTTThe QQQQuantitative MMMMethods for PPPPsychology
T
Q
M
P
124
Iteration History
Iteration STRESS
0 0.332
1 0.263
Stress of Final Configuration : 0.263
Proportion of Variance (RSQ) : 0.606
The Shepard Diagram represents the distances between points in the MDS plot against the observed similarities.
Ideally these points should adhere to a straight or slightly curved line.
Coordinates in 2 Dimensions
Variable Dimension
1 2
HN1 -1.094 0.255
HN2 -0.903 0.319
HN3 -0.591 0.350
HN4 -1.175 0.215
HN5 -0.774 0.531
HN6 -0.732 -0.637
HN7 -0.901 0.567
Coordinates in 2 Dimensions
Variable Dimension
1 2
HN8 -0.981 0.046
HN9 -0.635 -0.043
HN10 -1.045 -0.152
HP1 0.368 0.194
HP2 0.681 0.566
HP3 0.644 0.148
HP4 0.950 0.418
Coordinates in 2 Dimensions
Variable Dimension
1 2
HP5 0.735 0.420
HP6 1.002 0.083
HP7 0.851 0.192
HP8 0.523 0.633
HP9 0.857 0.000
HP10 1.081 0.347
LN1 -0.981 -0.125
¦ 2015 � vol. 11 � no. 2
TTTThe QQQQuantitative MMMMethods for PPPPsychology
T
Q
M
P
125
Coordinates in 2 Dimensions
Variable Dimension
1 2
LN2 -1.076 -0.443
LN3 -0.887 -0.328
LN4 -0.438 0.721
LN5 -0.542 -0.553
LN6 -0.381 -0.357
LN7 -0.920 -0.685
LN8 -1.375 -0.182
LN9 -1.088 -0.536
LN10 -1.099 0.437
LP1 1.204 -0.151
Coordinates in 2 Dimensions
Variable Dimension
1 2
LP2 0.900 0.514
LP3 1.081 -0.076
LP4 1.070 -0.463
LP5 0.916 -0.461
LP6 0.800 -0.690
LP7 0.947 -0.397
LP8 1.049 -0.244
LP9 1.009 -0.677
LP10 0.949 0.245
Matrix Weights
MatrixStress RSQ Dimension
1 2
1 0.248 0.7580.7700.577
2 0.395 0.1650.3020.823
3 0.272 0.6140.3620.871
4 0.176 0.8850.8650.475
CitationCitationCitationCitation
Facciani, M. J. (2015). Developing Affective Mental Imagery Stimuli with Multidimensional Scaling. The Quantitative
Methods for Psychology, 11 (2), 113-125.
Copyright © 2015 Facciani. This is an open-access article distributed under the terms of the Creative Commons Attribution License (CC BY). The use, distribution or
reproduction in other forums is permitted, provided the original author(s) or licensor are credited and that the original publication in this journal is cited, in
accordance with accepted academic practice. No use, distribution or reproduction is permitted which does not comply with these terms.
Received: 03/04/15 ~ Accepted: 28/04/15