developing a mobile app for the corvallis transit system...
TRANSCRIPT

Oregon State University Policy Analysis Laboratory
1
Developing a mobile app for the Corvallis Transit
System: Public policy intervention, programming
solution
Jos Grandolfo, Evan Hatteberg, Matt Levering, Ian Davidson, Trang Tran, Chris
Vanderschuere
Problem Statement Driven by their mission to preserve the environment and enhance neighborhood livability,
the City of Corvallis Transit System (CTS) actively seeks to increase ridership on its public
bus system. These efforts reflect in the sustained growth in ridership, which gained
considerable momentum in 2011 with the implementation of a fare-less bus program.
Though the bus system remains a popular alternative for residents, growth of Oregon
State University, parking shortages, and traffic congestion are a continuing challenge for
Corvallis.
Despite the economic, energy, and environmental benefits of public transportation,
increasing ridership beyond the small fraction of regular users is an ongoing challenge for
policymakers and transit officials across the country. Urban form and existing
infrastructure largely predetermine the extent of coverage and practicality of transit use.
Where public transportation is an option, most still opt for the convenience and control
provided by the automobile. Further complicating efforts to increase ridership are macro
level influences, like fluctuating fuel prices and socio-economic conditions that cause an
intractable rise and decline of public transportation use.
Nevertheless, strategies to alter fare prices, improve service quantity and quality, and
expand marketing have proven successful. This paper begins with a brief review of the
literature discussing the internal factors determining ridership, focusing on the promising
developments in information technology. Next, the authors review common features and
services offered by current transit applications on the mobile phone market. We then
present findings from a survey of 153 residents from the City of Corvallis, which aimed to
identify areas where public transportation in Corvallis could be improved and how a
mobile phone application may address these needs. The paper concludes with a discussion
of the early developments of Transport (IOS) and Transit (Android), Corvallis’ first mobile
phone applications that provide real-time bus information.
Literature Review Although a region’s economy, population, and geography are the primary factors
determining public transportation ridership (Taylor et al., 2009), transit officials do

Oregon State University Policy Analysis Laboratory
2
possess a number of direct strategies to expand their customer base. Research suggests
ridership is sensitive to fare prices, especially within student populations. Discounted
fares and “fare-free” experiments generally exhibit sustained increases in ridership after
implementation (Brown et al. 2003; Litman, 2004). However, lower costs cannot
overcome a general resistance to using public transportation if the service is infrequent or
unavailable, or if the overall quality of service is poor.
Frequency and coverage of transit service displays strong evidence of attracting new
customers, while encouraging existing riders to use public options more frequently
(Taylor & Fink, 2009). Despite findings that increased service supply expands ridership, a
lack of infrastructure often limits service expansion as an immediate policy option. Other
direct strategies include improvements in the quality of service, which is often an
undervalued method for increasing ridership and reducing automobile travel (Lutman,
2008). Exploring the determinants of public transit ridership, Syed and Khan (2000) found
bus information, on-street service, station safety, customer service, and safety en-route
were the five most influential factors determining ridership.
Advances in technology have opened an entirely new area for transit officials to deliver
route information, connection schedules, and expected arrival and departure times. In fact,
recent literature suggests real-time information is one of the strongest determinants of
ridership and may encourage a mode-shift to public transportation (Multisystems, Inc,
2003). Early forms of real-time information using signs at transit stops revealed
uninspiring results. Although perceived wait time declined in some areas (Schweiger,
2003), general satisfaction with transit and overall ridership did not increase at stops
displaying real-time information (Science Applications International, 2003; Mehndiratta,
2000). Signs were helpful, but customers wanted access to real-time data from their
homes, businesses, and areas nearby transit stops (Mehndiratta, 2000).
Rapid growth in Automatic Vehicle Location (AVL) on transit vehicles, widespread
internet deployment, and improvements to smartphone technology provided the
infrastructure to meet this customer demand. Development of mobile applications (apps)
with access to real-time transit information is encouraging, yet research on its impact on
ridership is sparse. Early studies showed positive results, yet most simply compared
results before and after implementation, without controlling for the endogenous factors
affecting ridership (Tang & Thakuriah, 2012).
As more transit systems have introduced mobile phone applications, a growing body of
literature is investigating its effectiveness. Watkins et al. (2011) provided one of the first
analyses, which determined both perceived and actual wait time decreased for users
accessing real-time information from the “OneBusAway” application. Riders using the
mobile phone application averaged a wait time two minutes less than others accessing
traditional schedule information. The Chicago Transit Authority was an early adopter of
real-time information, first providing route information on their website and later
implementing the mobile application, “Bus Tracker.” Tang and Thakuriah (2012) used
longitudinal ridership data beginning with the rollout of Bus Tracker and found the
service provided “modest” increases in ridership. The researchers included a number of

Oregon State University Policy Analysis Laboratory
3
control variables for unemployment, gas prices, socio-economic characteristics, and
service factors, yet still found an increase of 126 riders per week on routes that used the
Bus Tracker service compared to others without access to real-time information.
While the research on real-time information delivered by mobile applications is
promising, evidence to suggest it attracts new riders to shift from private to public
transportation modes remains limited. Nonetheless, one early study found real-time bus
arrival information systems do assist in the maintenance of ridership (Multisystems, Inc,
2003), and this assessment of real-time information technology remains mostly true a
decade later. Several studies suggest future efforts should focus on complementary
marketing campaigns and the development of feature-rich applications (Schweiger, 2011;
Tang and Thakuruah 2011). Tang and Thakuriah (2011) note marketing efforts are
imperative to reach non-riders and encourage them to “try” public transportation.
Software recommendation systems represent a new a form of advertisement for
applications, which targets users most likely to adapt mobile phone software (Tang and
Thakuriah 2012). Applications may also attract more users by incorporating multiple
features, such as trip planners and route maps in addition to real-time information. Zhang
et al. (2011) recommend future development focus on “multimodal” applications that
appeal to all commuters regardless of transportation type. A multipurpose application will
expand the user base and may encourage commuters using cars or other forms of private
transportation to experiment with public options.
Existing transit applications
A quick search in either the Play Store for Android devices or the App Store for iOS devices
shows multiple apps that help users navigate public transit. Most of the apps are limited to
specific geographic areas or transit systems. For example, the app “NYC Bus and Subway
Maps” provides data specific to New York City. While the majority of apps are location
limited there are still quite a few that are not. Google Maps has a transit feature, which has
data on 475 transit agencies around the world. Other apps are created by third parties and
contain information from various locations, like “Where’s My Bus.” All of these apps have
common elements or tools that should be considered when creating an app for the
Corvallis Transit System. Below are common elements of the various transit apps
Real-time Map and Schedule
A 2-D map with routes overlaid displaying the real-time or estimated location of
the desired bus.
Route Schedules
This feature allows users to look up detailed information about a specific route.
This information is usually a static table with stops and estimated times of specific
bus lines. This information is no different from the data typically posted at bus
stops.

Oregon State University Policy Analysis Laboratory
4
Trip Planner
This feature predicts the shortest paths between any two points in the transit
network using real-time information provided by a bus arrival prediction system,
relying on GPS equipped transit vehicles. Typically the user can see multiple route
options and receive details on a route or multiple routes including estimated time
of travel, number of transfers required, and estimated walking distance.
Notifications
The ability to enable “push notifications” that make the user aware Bus A’s location
and estimated time of arrival to User A’s location. Routine notifications help
regular commuters. For example, if user A always rides the Blue Line Bus at
5:00pm the app will notify the user that the Blue Line Bus’ status and location a
few minutes before.
For additional more specific information about the user interface we suggest looking at
the following apps as models.
● Where is My Bus?
● One Bus Away.
● Moovit
● Transit
Methods In an effort to develop a real-time transit application for the Corvallis Transit System,
researchers conducted a survey of Corvallis residents to determine areas where the
current system could improve and what features would be most useful in an application.
These results served to inform app developers of where early efforts in application design
should focus. Due to strict time constraints, we utilized a convenience sample by emailing
students and faculty at Oregon State University and asking for participants in-person at
high foot-traffic areas. 153 members of the Corvallis community participated in and
completed the survey. Participants were informed that the survey was designed to help
improve the Corvallis Transit System. Upon agreeing to take part in the survey,
participants were asked to answer 12 questions regarding their usage and knowledge of
the Corvallis Transit System as well as their opinions on what could be improved. For the
full survey, see Appendix A.
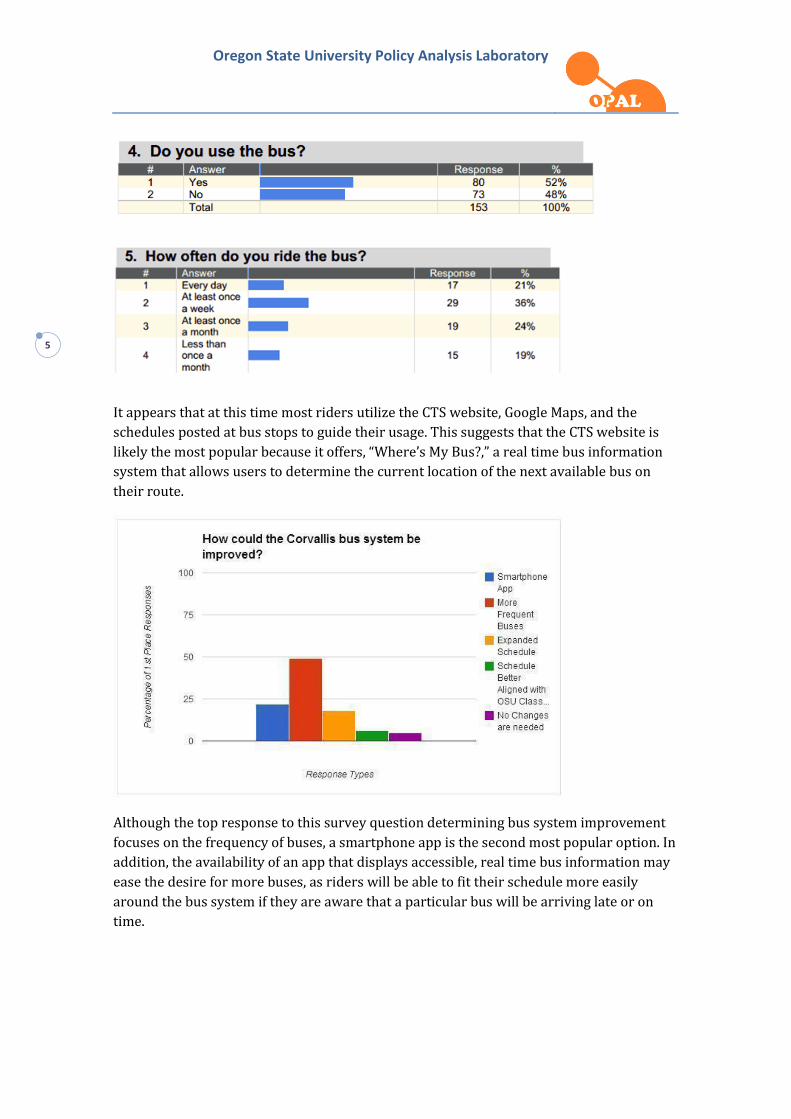
Survey findings The first two graphs display the percentage of our sample population that uses the
Corvallis Transit System, and how often they ride. This is a preliminary view into the
usefulness of a smartphone app. A large proportion are riding at least once a week to
every day (57%), meaning that an app would allow them to efficiently view and use the
bus system in conjunction with their daily schedule.
Oregon State University Policy Analysis Laboratory
5
It appears that at this time most riders utilize the CTS website, Google Maps, and the
schedules posted at bus stops to guide their usage. This suggests that the CTS website is
likely the most popular because it offers, “Where’s My Bus?,” a real time bus information
system that allows users to determine the current location of the next available bus on
their route.
Although the top response to this survey question determining bus system improvement
focuses on the frequency of buses, a smartphone app is the second most popular option. In
addition, the availability of an app that displays accessible, real time bus information may
ease the desire for more buses, as riders will be able to fit their schedule more easily
around the bus system if they are aware that a particular bus will be arriving late or on
time.

Oregon State University Policy Analysis Laboratory
6
The final question directly addresses what users would prefer in a CTS app. Bus arrival
time for each stop, and real time bus location information top the list, again showing that
users most want real time information about the current location of their bus. The rest of
the responses are evenly distributed between closest routes, access to schedules, and a
bus system map. All of these options seem to be valued but perhaps as peripheral parts of
the CTS app. Trip planner received the least votes, possibly due to respondents’ lack of
knowledge about what a “trip planner” is or what service it would perform.
Respondents were asked to comment at the end of the survey with any additional notes or
suggestions to inform CTS about their preferences. Selected representative quotes are
presented below:
“My biggest impediment to riding the bus is a combination of the bus's tardiness and how
it runs related to class start times--I want to ride it more than I do, but sometimes it's too
much of a hassle. Also, a real-time function on the app would be so helpful, to know when
to keep waiting and when to give up.”
“The ‘Where's my bus’ (WMB) site isn't very mobile friendly….most of us riders are always
interested in the ETA to stops outside of home and work so we don't waste time getting to
a stop early or having to repeatedly look up common stop numbers.”
“It is difficult to know when exactly a bus should arrive. It is one thing to be a few minutes
late here and there, it is another to be unable to tell where and when the bus is actually
going to stop. As a full time student with 2 jobs and 2 internships, I HAVE to have reliable
transportation.”
In terms of responses relating to app development, and in reviewing the ending
statements of survey respondents, it seemed that the overall focus was directed towards
the availability of real time bus information. Respondents also seemed interested in
peripheral functions, such as bus schedules and route maps, but were focused on an app
Oregon State University Policy Analysis Laboratory
7
that allowed them to be able to determine and guide their transit use to fit their personal
schedule.
Appathon
Twenty-five student app developers and seven policy students came together during the
"Appathon,” an all-day event in which the electric engineering and computer science
(EECS) students worked to produce a feasible Corvallis transit app. On Friday, April 18th,
the survey results were presented to the Appathon team, led by student and president of
the App Development Club Chris Vanderschuere. The data from the graphs above was
used to inform developers of the valued components of a proposed CTS app. Therefore, the
key focus was access to real time bus information in conjunction with bus arrival times for
each stop location. The addition of closest routes, bus stop locations, and a route map were
deemed as secondary objectives but still necessary as additional features that would only
add to the apps user friendliness and utility. The Appathon moved forward with
development on the IOS and Android operating systems with these priorities. Early efforts
resulted in beta versions of Transit for the IOS operating system and Transport for
Android.
Analysis and conclusion The findings from the survey of Corvallis residents suggest that a real-time transit
application will provide a valuable service for both current and potential bus riders. A
majority of riders already consult various services for bus information, yet it appears
existing options lack the reliability and accessibility users desire. Multiple respondents
indicate that they would ride the bus more often, but simply cannot trust what they
perceive as unreliable bus service. While an app does not address bus reliability, it does
give riders more control of their commute and may alleviate the concerns of those hesitant
to use the bus system
Whereas a mobile phone application was a highly ranked area for improving the bus
experience in Corvallis, respondents overwhelmingly felt increasing the frequency of
service was most important. Evidence from previous research finds that real-time transit
information reduces both perceived and actual wait time, which may also influence an
individual’s perception of service frequency. It is possible that reduced wait time for the
bus will make frequency of service less important for some individuals. Although current
research does not address a possible relationship between real-time information and
perceived service frequency, it should be an area of future investigation.
Despite the relatively small sample size, the results clearly indicate that an opportunity
exists to expand bus ridership in Corvallis. Approximately 11% of respondents ride the
bus every day and only about half ride the bus at all. The literature provides evidence to
suggest that Transport and Transit will provide a modest increase in the frequency of bus
use for current riders, which is about half of our sample population. The challenge for the
Corvallis transit officials will be educating the occasional and non-rider of the new transit

Oregon State University Policy Analysis Laboratory
8
service. The public release of both apps should coincide with a strong and ongoing
marketing effort to reach these populations. Advertisements at bus stops and on vehicles
should accompany efforts to reach students at Oregon State University and others likely to
utilize mobile phone applications. One strategy to expand the use of the apps may be to
gradually add features that make it useful for other types of commuters. If individuals use
Transport and Transit for their automobile travel or other trip planning services, they may
decide to experiment with other features of the application and try the bus system. Moving
forward, the key for sustained increases in ridership will be getting Transport and Transit
on the mobile phones of Corvallis residents and ensuring their experience on the bus
remains positive.
References
Brian D. Taylor and Camille Fink (2009), The Factors influencing transit ridership: A
review and analysis of the ridership literature. UCLA Department of Urban Planning,
University of California Transportation Systems Center (www.uctc.net); at
www.uctc.net/papers/681.pdf.
Brown, J., Hess, D. B., & Shoup, D. (2003). Fare-free public transit at universities: An
evaluation. Journal of Planning Education and Research, 23(1), 69-82.
Litman, T. (2004). Transit price elasticities and cross-elasticities. Journal of Public
Transportation, 7, 37-58.
Litman, T. (2008). Valuing transit service quality improvements. Journal of Public
transportation, 11(2), 43-63.
Mehndiratta, S., Cluett, C., Kemp, M., Lappin, J., (2000). Transit watch – bus station video
monitors: Customer satisfaction evaluation. U.S. Department of Transportation, ITS Joint
Program Office. Retrieved from website:
http://ntl.bts.gov/lib/jpodocs/repts_te/13655/13655.pdf
Multisystems, Inc, United States, (2003) Strategies for improved traveler information
(No.92). Federal Transit Administration, Transit Cooperative Research Program.
Schweiger, C. L. (2003). Real-time bus arrival information systems (No. 48). Federal
Transit Administration, Transit Cooperative Research Program.
Schweiger, C. L. (2011). Use and deployment of mobile device technology for real-time
transit information (Vol. 91). Federal Transit Administration, Transit Cooperative
Research Program.
Science Applications International Corporation, (2003). Oregon Regional Intelligent
Transportation Systems Integration Program. California Oregon Advanced Transportation
System (COATS) Bi-State Rural Integration Program. Final Phase III Report: Transit
Tracker Information Displays.
Oregon State University Policy Analysis Laboratory
9
Syed, S. J., & Khan, A. M. (2000). Factor analysis for the study of determinants of public
transit ridership. Journal of Public Transportation, 3(3).
Tang, L., & Thakuriah, P. V. (2011). Will psychological effects of real-time transit
information systems lead to ridership gain?. Transportation Research Record: Journal of
the Transportation Research Board, 2216(1), 67-74.
Tang, L., & Thakuriah, P. V. (2012). Ridership effects of real-time bus information system:
A case study in the City of Chicago. Transportation Research Part C: Emerging
Technologies, 22, 146-161.
Taylor, B. D., Miller, D., Iseki, H., & Fink, C. (2009). Nature and/or nurture? Analyzing the
determinants of transit ridership across US urbanized areas. Transportation Research Part
A: Policy and Practice, 43(1), 60-77.
Zhang, L., Li, J. Q., Zhou, K., Gupta, S. D., Li, M., Zhang, W. B. & Misener, J. A. (2011). Traveler
information tool with integrated real-time transit information and multimodal trip
planning. Transportation Research Record: Journal of the Transportation Research Board,
2215(1), 1-10.

Oregon State University Policy Analysis Laboratory
10
Appendix A: Survey
Corvallis Transportation System Questionnaire
OPAL project
The City of Corvallis wants to make the bus system more convenient and accessible. One
way to do this is by developing a mobile app for users. For this purpose they’d like your
input on the Corvallis bus system and how they can improve the service. Please take 5
minutes to let us know what you think.
1. What is your zip code?
__________________
2. How old are you? (circle age range)
16-24 years 56-70 years
25-40 years 70+ years
41-55 years
3. Do you identify yourself as:
Male Female Prefer not to answer
4. Do you use the bus?
Yes No
If YES, please answer the following questions: If NO, please answer the following
questions:
How often do you ride the bus?
a) Every day

Oregon State University Policy Analysis Laboratory
11
b) At least once a week
c) At least once a month
d) Less than once a month
What’s your primary method of transportation?
a) Car/truck
b) Bicycle
c) Carpooling
d) Walking
e) Other:
What resources do you use to find out bus information? (Circle as many as apply)
a) Google Maps / Transit
b) CTS website
c) QR codes posted at bus stops
d) Schedules posted at bus stops
e) None of the above
f) Other: Are you aware that the Corvallis bus system is fareless (free to ride)?
o Yes
o No
What are some reasons you ride the bus?
a) Convenience
b) Gas prices
c) Environmental reasons
d) Parking issues
e) I don’t have another method of transportation
What’s preventing you from riding the bus?
a) Infrequency of service

Oregon State University Policy Analysis Laboratory
12
b) It doesn’t go where I want to go
c) Route systems/schedules are hard to understand
d) I don’t have a need
e) I find the experience sometimes unpleasant
5. How could the Corvallis bus system be improved? Please rank your choices in order of
preference.
a. Smartphone App
b. More Frequent Buses
c. Expanded Schedule
d. Schedule better aligned with OSU class times
e. No changes are needed
6. What would you want to see in a Corvallis bus app? Check all that apply.
a. Closest routes
b. Bus stop locations
c. Bus arrival time for my stop
d. Real time bus location information
e. Access to schedule
f. Trip planner
g. Bus system map
7. What type of mobile device are you using?
a. iPhone
b. Android
c. Other:
Oregon State University Policy Analysis Laboratory
13
8. Would you like to see a Park and Ride service?
a. Yes
b. No
c. Don’t know
9. If you would like a Park and Ride service, what locations would be most convenient
for you?
Thank you for taking the time to complete this survey. The results will be compiled and
reported to the City of Corvallis to aid in the improvement of the Corvallis Transit System.
Please feel free to add any additional information or comments on the back of this sheet