developing a local instruction theory on ratio · pdf filedeveloping a local instruction...
TRANSCRIPT

DEVELOPING A LOCAL INSTRUCTION THEORY
ON RATIO AND SCALE
Master Thesis
Wisnuningtyas Wirani
137785078
SURABAYA STATE UNIVERSITY
POSTGRADUATE PROGRAMME
STUDY PROGRAMME OF MATHEMATICS EDUCATION
2015

DEVELOPING A LOCAL INSTRUCTION THEORY
ON RATIO AND SCALE
MASTER THESIS
A Thesis submitted to
Surabaya State University Postgraduate Programme
as a Partial Fulfillment of the Requirement for the Degree of
Master of Science in Mathematics Education Programme
Wisnuningtyas Wirani
137785078
SURABAYA STATE UNIVERSITY
POSTGRADUATE PROGRAMME
STUDY PROGRAMME OF MATHEMATICS EDUCATION
2015

i
APPROVAL OF SUPERVISORS
Thesis by Wisnuningtyas Wirani, NIM 137785078, with the title Developing a
Local Instruction Theory on Ratio and Scale has been qualified and approved to be
tested.
Supervisor I,
Prof. Dr. Siti M. Amin, M.Pd.
Date,
…………………………
Supervisor II,
Dr. Agung Lukito, M.S.
Date,
…………………………
Acknowledged by
Head of the Mathematics Education Study Programme
Dr. Agung Lukito, M.S.
NIP 196201041991031002

ii
APPROVAL
Thesis by Wisnuningtyas Wirani, NIM 137785078, with the title Developing a
Local Instruction Theory on Ratio and Scale has been defended in front of the Board
of Examiners on 29 June 2015.
Board of Examiners
Name Signature Position
Dr. Agung Lukito, M.S.
………………………….
Chairman/Supervisor II
Prof. Dr. Siti M. Amin, M.Pd.
………………………….
Member/Supervisor I
Prof. I Ketut Budayasa, Ph.D.
………………………….
Member
Dr. Abadi, M.Sc.
………………………….
Member
Dr. Siti Khabibah, M.Pd.
………………………….
Member
Acknowldged by
Director of Postgraduate Programme
Prof. I Ketut Budayasa, Ph.D.
NIP 195712041994021001

iii
DEDICATION
Sungguh saya bukan siapa-siapa tanpa doa dan didikan orangtua
Untuk ibuku, Sunarni
Yang selalu mengajarkan dan menanamkan “maaf”, “tolong”, dan “terima
kasih”
Untuk adekku, Anggra Nur Cahyo
Yang telah menunjukkan arti kegigihan dan kesabaran
Untuk suamiku, Ronggo Nurseto
Yang berjuang bersama mulai dari nol
Untuk bapakku, Prof. Dr. Sukadiyanto, M.Pd.
Yang telah mengajarkan kesederhanaan, hidup untuk menanam kebaikan,
dan berpikir visioner

iv
ABSTRACT
Wirani, W. 2015. Developing a Local Instruction Theory on Ratio and Scale.
Thesis, Mathematics Education Study Programme, Postgraduate Programme of
Surabaya State University. Supervisors: (I) Prof. Dr. Siti M. Amin, M.Pd. and (II)
Dr. Agung Lukito, M.S.
Keywords: ratio, multiplicative comparison, double number line, RME, design
research
For students in the elementary education, learning ratio is important as their base in
learning and reasoning about proportion on a higher level of education. There are
two key concepts of ratio, multiplicative comparison and composed unit. Even
though ratio holds the notion of multiplicative comparison between numbers,
students struggle to use multiplicative comparison in ratios. According to many
studies, students use difference and addition to determine the relationship between
number in ratio. Considering students’ misconception in relating numbers in ratio
and the lack of explanation about learning instruction on ratio and scale, there is a
need to develop a local instruction theory to support students in learning ratio and
scale. Therefore, the study aims at contributing a local instruction theory, which
supports students in learning ratio and scale by using double number line. To
emerge the model, the contexts in the study are about plans and maps. The study
used design research as the research approach and consisted of two cycles of
teaching experiment. The learning instructions are designed by implementing
Realistic Mathematics Education (RME). The study was conducted in SDIT At
Taqwa, Surabaya. The participants of the study were the mathematics teacher and
students of grade five. In this study, data such as video registrations of the learning
and students’ written work were obtained. These data were confronted to the
hypothetical learning trajectory. The analysis result indicates that some students
were able to use multiplicative comparison to determine the relationship between
numbers on ratios using double number line and some other still used difference
and addition to relate the numbers.

v
ABSTRAK
Wirani, W. 2015. Developing a Local Instruction Theory on Ratio and Scale. Tesis,
Program Studi Pendidikan Matematika, Program Pascasarjana Universitas Negeri
Surabaya. Pembimbing: (I) Prof. Dr. Siti M. Amin, M.Pd. dan (II) Dr. Agung
Lukito, M.S.
Kata kunci: rasio, multiplicative comparison, garis bilangan ganda, RME, design
research
Mempelajari rasio merupakan hal yang penting bagi siswa di sekolah dasar sebagai
dasar untuk mempelajari dan menalar mengenai proposi pada tingkat pendidikan
yang lebih tinggi. Terdapat dua konsep penting pada rasio, yaitu multiplicative
comparison dan composed unit. Meskipun rasio terkait dengan penggunaan
multiplicative comparison untuk menyatakan hubungan antar bilangan, siswa
mengalami kesulitan dalam menyatakan hubungan antar bilangan dalam suatu rasio
atau antar rasio dengan menggunakan multiplicative comparison. Berdasarkan
penelitian, siswa menggunakan selisih dan penjumlahan untuk menyatakan
hubungan antar bilangan pada rasio. Menyadari miskonsepsi yang terjadi pada
siswa dan kurangnya penjelasan mengenai instruksi pembelajaran pada
perbandingan dan skala, diperlukan adanya pengembangan local instruction theory
yang dapat mendukung siswa untuk memahami perbandingan dan skala. Oleh
karena itu, penelitian ini bertujuan untuk memberikan kontribusi local instruction
theory, yang dapat mendukung siswa untuk memahami rasio dan skala dengan
menggunakan garis bilangan ganda. Untuk memunculkan model, konteks yang
digunakan pada penelitian ini antara lain denah dan peta. Design research
digunakan sebagai pendekatan penelitian yang terdiri dari dua siklus eksperimen
pembelajaran. Instruksi pembelajaran pada penelitian ini disusun dengan
mengimplementasikan Realistic Mathematics Education (RME). Pengambilan data
dilakukan di SDIT At Taqwa, Surabaya. Partisipan penelitian ini adalah guru
matematika dan siswa kelas lima. Pada penelitian ini, data yang diperoleh berupa
fragmen video penting yang terkait dengan pembelajaran dan pekerjaan siswa. Data
tersebut akan dibandingkan dengan hypothetical learning trajectory. Hasil analisis
menunjukkan bahwa sebagian siswa menggunakan multiplicative comparison
untuk menentukan hubungan antar bilangan pada rasio dengan menggunakan garis
bilangan ganda, dan sebagian siswa lain masih menggunakan selisih dan
penjumlahan.

vi
PREFACE
Praise and thank to Allah for every blessing and joy. Finishing the thesis will be
impossible without support and cooperation from many people. Therefore, I would
like to give my appreciation to:
1. Prof. Dr. Siti M. Amin, M.Pd. and Dr. Agung Lukito, M.S as my supervisors in
Surabaya State University. Thank you for the encouragement and guidance
during writing this thesis. I enjoyed every discussion we had, it brought
enlightenment every time I face the dead end.
2. Dr. Dolly van Eerde and Drs. Monica Wijers as my supervisors in Netherlands
for the concerns and the thoughtful feedback to improve the first part of the thesis
and the design of this study.
3. Dr. M. L. A. M Dolk as the coordinator of IMPoME in the Freudenthal Institute,
Utrecht University, for sharing thoughts and looking things from different
perspectives.
4. Lecturers and staffs of UNESA and Utrecht University for many kinds of help.
5. Dikti and NESO for funding the study.
6. The principal, the curriculum vice principal, the teachers, and students of class
5B and 5C of SDIT At Taqwa for cooperating during the data collection.
7. Colleagues of IMPoME 2013 in Surabaya and Palembang for the joyous and
unforgettable moment.
8. Prof. Dr. Marsigit, M.A. and family for supports and prayers.
This thesis is not perfect as the writer still learning from her point of view. To
improve, the writer needs different points of view from the readers. Therefore,
critics and feedback are welcomed.
Wisnuningtyas Wirani

vii
TABLE OF CONTENTS
APPROVAL OF SUPERVISORS ........................................................................ i
APPROVAL .......................................................................................................... ii
DEDICATION ...................................................................................................... iii
ABSTRACT .......................................................................................................... iv
ABSTRAK ............................................................................................................. v
PREFACE ............................................................................................................. vi
TABLE OF CONTENTS .................................................................................... vii
LIST OF TABLES ................................................................................................ x
LIST OF FIGURES ............................................................................................. xi
LIST OF APPENDICES ................................................................................... xiii
CHAPTER 1: INTRODUCTION ........................................................................ 1
A. Research Background ...................................................................................... 1
B. Research Question ........................................................................................... 3
C. Research Aim ................................................................................................... 4
D. Definition of Key Terms .................................................................................. 4
E. Significance of the Research ............................................................................ 5
CHAPTER 2: THEORETICAL FRAMEWORK ............................................. 6
A. The Concepts ................................................................................................... 6
1. Proportion and proportional reasoning ........................................................ 6
2. Ratio and scale ............................................................................................ 7
B. The Importance of Learning Ratio and Scale .................................................. 9
C. Knowledge Gap ............................................................................................. 10
D. Students’ Misconceptions .............................................................................. 11
E. Double Number Line ..................................................................................... 15
F. Realistic Mathematics Education ................................................................... 16
G. Indonesian Mathematics Curriculum ............................................................. 21
H. Social Norms, Socio-mathematical Norms and the Role of Teacher ............ 22
I. Local Instruction Trajectory........................................................................... 24
CHAPTER 3: METHODOLOGY ..................................................................... 25
A. Research Approach ........................................................................................ 25
B. Data Collection .............................................................................................. 28
1. Observation ............................................................................................... 28
2. Semi-structured interview ......................................................................... 28
3. Pretest ........................................................................................................ 29
4. The pilot study (first cycle) ....................................................................... 29
5. The teaching experiment (second cycle) ................................................... 30
6. Posttest ...................................................................................................... 30
7. Validity and reliability .............................................................................. 31

viii
C. Data Analysis ................................................................................................. 31
1. Observation ............................................................................................... 31
2. Semi-structured interview ......................................................................... 32
3. Pretest ........................................................................................................ 32
4. The pilot study (first cycle) ....................................................................... 32
5. The teaching experiment (second cycle) ................................................... 33
6. Posttest ...................................................................................................... 33
7. Validity and reliability .............................................................................. 34
D. Research Subject ............................................................................................ 35
CHAPTER 4: HYPOTHETICAL LEARNING TRAJECTORY .................. 36
A. Lesson 1 ......................................................................................................... 37
B. Lesson 2 ......................................................................................................... 44
C. Lesson 3 ......................................................................................................... 50
D. Lesson 4 ......................................................................................................... 55
E. Lesson 5 ......................................................................................................... 58
CHAPTER 5: RETROSPECTIVE ANALYSIS .............................................. 61
A. The Timeline of the Study ............................................................................. 61
B. Data of Preparation Phase .............................................................................. 63
1. Class Observation ...................................................................................... 63
2. Teacher Interview ...................................................................................... 64
C. Analysis of the Pilot Study ............................................................................ 65
1. Pretest ........................................................................................................ 66
2. Lesson 1 ..................................................................................................... 67
3. Lesson 2 ..................................................................................................... 72
4. Lesson 3 ..................................................................................................... 79
5. Lesson 4 ..................................................................................................... 85
6. Lesson 5 ..................................................................................................... 89
7. Posttest ...................................................................................................... 93
8. Discussion ................................................................................................. 95
D. Analysis of the Teaching Experiment ............................................................ 99
1. Pretest ........................................................................................................ 99
2. Lesson 1 ................................................................................................... 101
3. Lesson 2 ................................................................................................... 109
4. Lesson 3 ................................................................................................... 117
5. Lesson 4 ................................................................................................... 129
6. Lesson 5 ................................................................................................... 140
7. Posttest .................................................................................................... 151
8. Discussion ............................................................................................... 154
E. Validity and Reliability ................................................................................ 157
CHAPTER 6: CONCLUSION AND DISCUSSION ...................................... 158
A. Conclusion ................................................................................................... 158

ix
B. Discussion .................................................................................................... 161
1. The weakness of the study ...................................................................... 161
2. Suggestion ............................................................................................... 163
REFERENCES .................................................................................................. 164
LEARNING TRAJECTORY ON RATIO AND SCALE ............................. 168

x
LIST OF TABLES
Table 2.1. The concept of ratio and scale in the Indonesian mathematics
curriculum (Kemendikbud, 2013) ........................................................ 22 Table 4.1. Conjectures of students’ answer for problem 1a in lesson 1................ 40
Table 4.2. Conjectures of students’ answer for problem 1b in lesson 1 ............... 42 Table 4.3. Conjectures of students’ answer for activity 2 in lesson 1 ................... 43 Table 4.4. Conjectures of students’ answer for problem a in lesson 2.................. 46
Table 4.5. Conjectures of students’ answer for problem b in lesson 2 ................. 47 Table 4.6. Conjectures of students’ answer for activity 2 in lesson 2 ................... 49 Table 4.7. Conjectures of students’ answer for problem 1a in lesson 3................ 51 Table 4.8. Conjectures of students’ answer for problem 1b in lesson 3 ............... 52
Table 4.9. Conjectures of students’ answer for problem 2 in lesson 3 ................. 54 Table 4.10. Conjectures of students’ answer for problems in lesson 4 ................. 57 Table 4.11. Conjectures of students’ answer for problems in lesson 5 ................. 59 Table 5.1. The timeline of the study ..................................................................... 62
Table 5.2. The students’ actual answer on lesson 1 cycle 1 .................................. 71 Table 5.3. The students’ actual answer on lesson 2 cycle 1 .................................. 77 Table 5.4. The students’ actual answer on lesson 3 cycle 1 .................................. 83
Table 5.5. The students’ actual answer on lesson 4 cycle 1 .................................. 88
Table 5.6. The students’ actual answer on lesson 5 cycle 1 .................................. 92 Table 5.7. Refinement of learning material and additional HLT .......................... 95 Table 5.8. The students’ actual answer on lesson 1 cycle 2 ................................ 108
Table 5.9. The students’ actual answer on lesson 2 cycle 2 ................................ 116 Table 5.10. The students’ actual answer on lesson 3 cycle 2 .............................. 128
Table 5.11. The students’ actual answer on lesson 4 cycle 2 .............................. 139 Table 5.12. The students’ actual answer on lesson 5 cycle 2 .............................. 151 Table 5.13. Reflection for the next study related to ratio.................................... 156
Table 6.1. Local instruction theory on ratio and scale ........................................ 160

xi
LIST OF FIGURES
Figure 2.1. A proportion problem about heights (Riehl & Steinthorsdottir, 2014)
......................................................................................................... 11
Figure 2.2. The child determined the difference within the given ratio to determine
the number of paperclips for Mr. Tall (Riehl & Steinthorsdottir,
2014) ................................................................................................ 12 Figure 2.3. Determining the width p (Singh, 2000) .............................................. 12
Figure 2.4. Using double number line in ratio problems ...................................... 15 Figure 2.5. Levels of emergent model (Gravemeijer, 1997) ................................. 20 Figure 3.1. Micro cycles form and shape the local instruction theory (Gravemeijer
& Cobb, 2006) ................................................................................. 27 Figure 4.1. The studio plan and the blank studio plan .......................................... 39 Figure 4.2. Making illustration and determining the real length........................... 41 Figure 4.3. Instructions to draw a classroom plan ................................................ 43
Figure 4.4. Three different size maps and a double scale line .............................. 45 Figure 4.5. Students have to draw double scale lines ........................................... 47
Figure 4.6. Using double scale line to determine real distance ............................. 48 Figure 4.7. A Bali map and its route ..................................................................... 50
Figure 4.8. Working with the stretched route ....................................................... 52 Figure 4.9. Problem 2 in lesson 3 .......................................................................... 54 Figure 4.10. Problem a in lesson 4 ........................................................................ 56
Figure 4.11. Problem b in lesson 4 ........................................................................ 57 Figure 4.12. Problem c in lesson 4 ........................................................................ 57
Figure 4.13. Problems with shopping context ....................................................... 59 Figure 4.14. A problem with food consumption context ...................................... 59 Figure 5.1. Choosing references ........................................................................... 68 Figure 5.2. Using a reference to measure .............................................................. 68
Figure 5.3. Using a scale line to measure.............................................................. 69 Figure 5.4. An illustration of ratio 3 cm:30 km .................................................... 73 Figure 5.5. The students’ reasoning ...................................................................... 74
Figure 5.6. An inappropriate double scale line ..................................................... 74 Figure 5.7. The students’ double scale line ........................................................... 75 Figure 5.8. Misplacing 90 km ............................................................................... 76 Figure 5.9. The example of the students’ work ..................................................... 80
Figure 5.10. An illustration of Aisyah’s double scale line .................................... 80 Figure 5.11. An example of the students’ work .................................................... 82 Figure 5.12. The students’ work ........................................................................... 87 Figure 5.13. The student ordered numbers inappropriately .................................. 91 Figure 5.14. The teacher writings about difference and comparison .................. 102
Figure 5.15. Using the width and the length to measure the coloured lines ....... 104 Figure 5.16. The students used an ice stick to measure the scale line and the other
lines ................................................................................................ 105

xii
Figure 5.17. The student’s drawing in comparing a scale line to the orange line 106 Figure 5.18. The students drew the plan first ...................................................... 107
Figure 5.19. Students comparing the double scale line and the distance on maps
....................................................................................................... 110 Figure 5.20. The teacher divided the lower scale line and asked a student to write
information for every 1 cm ............................................................ 112 Figure 5.21. Tegar’s double scale line for map A ............................................... 113
Figure 5.22. Information on Diva’s double scale line ......................................... 114 Figure 5.23. An illustration of Sisi’s drawing ..................................................... 119
Figure 5.24. Sisi’s double scale line becomes more precise compared to the
previous .......................................................................................... 120 Figure 5.25. Students determined the real distance for every 0,5 cm ................. 121 Figure 5.26. Rizqi’s (a) and Danis’ (b) illustration ............................................. 126 Figure 5.27. An illustration of the teacher’s drawing on the board .................... 131 Figure 5.28. The students used multiplication to express the relationship between
numbers .......................................................................................... 132
Figure 5.29. Tegar was using the double number line to solve the problem ...... 134 Figure 5.30. The student only related the numbers from 10 ............................... 135 Figure 5.31. The students simplified the given ratio ........................................... 136
Figure 5.32. The student used multiplication to express relationship between
numbers .......................................................................................... 138
Figure 5.33. The teacher used fractional form and simplified it ......................... 141 Figure 5.34. Rizqi determined the relationship between numbers ...................... 142
Figure 5.35. Students directly simplified the given ratio and started from 4 ...... 143 Figure 5.36. Sisi used multiplicative comparison to solve the problem ............. 145
Figure 5.37. An example of the student’s work .................................................. 146 Figure 5.38. The students expressed multiplicative comparison using the model
....................................................................................................... 147
Figure 5.39. Diva drew the model as in using a double scale line ...................... 148 Figure 5.40. An example of students’ work ........................................................ 149
Figure 5.41. Students used the double number line ............................................ 153 Figure 5.42. Examples of students’ answer with no illustration ......................... 153

xiii
LIST OF APPENDICES
APPENDIX A. The Classroom Observation Scheme .................................... 1689
APPENDIX B. The Teacher’s Interview Scheme ............................................ 170
APPENDIX C. Pretest, Posttest, and Examples of Expected Answer ............. 171
APPENDIX D. Teacher Guide ......................................................................... 178

1
CHAPTER 1
INTRODUCTION
A. Research Background
Many things in life are related to mathematics. One of the example is
proportion. According to Tourniare and Pulos (1985), proportion is two
equivalent ratios. People might not recognize the use of proportion in daily life.
To illustrate the use of proportion in daily life, we provide an example. There
is promotion price of tissue in two different shops, namely shop A and shop B.
From brochures, we know that in shop A, people can buy 3 packs of tissue for
IDR 8.000. In shop B, the price for 4 packs of tissue is IDR 9.000. A woman
wants to buy tissue and she decides to go to shop B because the price is cheaper.
When the woman is able to reason that tissue in shop B is cheaper, she has the
notion of proportional reasoning. Proportional reasoning is related to the idea
of reasoning for the equality of two ratios.
Proportion is related to ratio. What is ratio and how it is related to
proportion? According to Lamon (2012), ratio is a comparison between two
quantities. Refer back to the definition of proportion, proportion consists of two
ratios. Ratio is a common topic we can find in the daily life. For example, in
shopping context, shops usually give promotion of a product with label “buy 3
get 1 free”. In this case, we compare the number of product we buy and the
number of free product we get.
Ratio is also related to scale. We can say that scale is special case of ratio

2
which talks about distance. To be more specific, scale is comparison between
distance on the map and real distance (Ben-Chaim et al., 2012). We may find
scale in maps. However, there are different examples which contains the notion
of scale such as plans, miniature, and printing/copying. Scale usually use to
shrink or enlarge objects. In maps, scale can be represented into symbols or
drawings, for example double scale line. As an example, when we open google
maps, we can see two scale lines with different measurement. These scale lines
represent distance on the map and real distance.
Several studies have been done to find out students’ thinking related to
proportion and ratio (Karplus et al., 1983; Hart, 1984; Tourniare & Pulos, 1985;
Singh, 2000). These studies provide explanation on students’ misconception in
learning ratio and proportion. There are two key concepts of ratio,
multiplicative comparison and composed unit (Lobato and Ellis, 2010, as cited
in Rathouz et al., 2014). In working on ratio problems, students tend to use
subtraction and addition rather than use multiplication and division to
determine relationship of numbers on ratios (Hart, 1984; Singh, 2000; Riehl &
Steinthorsdottir, 2014).
In Indonesia, the learning of proportion is under the name of learning ratio.
Ratio becomes one of important topics in school mathematics in Indonesia.
Curriculum in Indonesia has been changed several times. However, the topic
of ratio remains in the curriculum, especially mathematics curriculum for grade
five. If we observe mathematics textbooks in Indonesia, the topic involves

3
contexts such as maps and shopping. However, the instructional learning on
the textbook is limited to determine the real distance, the distance on the map,
and the scale using formal method. The textbook focuses on students’ ability
to calculate rather than understanding the concept of ratio. In addition, the
context does not support students to investigate the concepts of ratio using
students’ informal knowledge. Therefore, when it comes to ratio problems,
students usually stick to the formula to determine real distance and use cross-
multiplication to solve problems.
To help students in learning ratio, we can use a certain context and a model
to help students in visualizing information. One of models we can use to
introduce ratio is double number line. Using the context of maps, double
number line elicits in the double scale line, in which scale is involved.
According to Küchemann et al., (2014), double number line is a proper model
to introduce ratio to students. This argument is supported by Abels et al. (2006)
who mention the benefit of using double number line as a model. Numbers on
the double number line are well ordered. It supports students to see the aligned
relationship along the lines.
B. Research Question
Based on research background, we formulate the research question as follows:
How can the double number line support students in learning ratio and scale?

4
C. Research Aim
Study which explicates the learning instruction on ratio and scale is still rare.
Therefore, the study aims at developing the local instruction theory on topic
ratio and scale. In this study, we involve double number line as a model to help
students understand multiplicative comparison. We also involve contexts
which fit well and elicit the model of double number line.
D. Definition of Key Terms
We define the key terms from the title, the research question, and the
research aim to avoid misunderstanding of meaning and to restrict the focus of
study.
1. To support
To facilitate, to engage, and to stimulate students to do investigations,
observations, and discussions to achieve certain purposes.
2. Ratio
Ratio is comparison between two quantities. Ratio is the subset of
proportion. In this study, we focus on determine missing value of equivalent
ratios.
3. Scale
Scale is comparison between distance on the map and real distance. Scale is
the subset of ratio. In this study, we use scale in the map context.
4. Double number line
A double number line is a mathematical model which consists of two

5
number lines with two different scales. In this study, we use double number
line to represent ratios and to express multiplicative comparison between
ratios.
5. Local instruction theory
The instruction theory in this study consists of envisioned learning route and
mathematical activities on topic ratio and scale.
E. Significance of the Research
There are two significancies of the study. The first significancy is to contribute
to the development of local instruction theory to support students in learning
ratio and scale. The second significancy is to give mathematics teachers an
insight about learning instructions to support students in learning ratio and
scale by involving certain contexts and double number line as a model.

6
CHAPTER 2
THEORETICAL FRAMEWORK
In this chapter, we will present the elements involved in the study. Before we
discuss about ratio and scale, firstly we will discuss about proportion and
proportional reasoning. We provide literature review about the importance of
learning ratio and scale, the knowledge gap, and students’ misconceptions in
learning ratio.
In this study, we will design a learning trajectory based on the design principles
of Realistic Mathematics Education (RME). Considering the study will take place
in Indonesia, the context will be modified so that it is familiar to Indonesian
students. Besides, we will provide an overview of the topic according to the
Indonesia mathematics curriculum.
A. The Concepts
1. Proportion and proportional reasoning
Tourniare and Pulos (1985) defined proportion as equality relationship
between two ratios in the form of 𝑎
𝑏=
𝑐
𝑑. To say that two ratios are
equivalent, one must be able to reason. According to Ellis (2013), reasoning
related to the idea of equality of two ratios is adressed as proportional
reasoning. One must be able to understand that to get an equivalent ratio,
multiplication and division are needed. Therefore, proportional reasoning
becomes an indicator for students who have good understanding of

7
multiplicative comparison (Lamon, 2012).
Proportion problems can be distinguished into two types, missing value
problems and comparison problems (Tourniare & Pulos, 1985). Missing
value problems usually provide three given numbers, in which children are
asked to determine an unknown number to satisfy the equivalent ratios. As
an example, given a car needs 36 minutes to travel 24 km. Children are asked
to determine how many minutes needed for a car to travel 6 km. For
comparison problems, children are asked to compare ratios. Given car brand
A consumes 3 litres of fuel to travel 40 km while car brand B consumes 4
litres to travel 50 km. We can say that the fuel consumption of car brand B
is more efficient.
2. Ratio and scale
Ratio is a part of proportion. In general, ratio is widely used in
describing the relationship between two measurements. Lamon (2012)
defined ratio as a comparison of two quantities. For example, if there are 3
boys and 7 girls in a classroom, then the ratio between boys and girls is 3:7.
Ratio can be represented as fractional form. As mentioned before, to
determine whether two ratios are equal, we can write ratios into fractions.
Using fractional form, it is easier to perceive ratio as a unit (Lamon, 2012).
In ratio, using the example above, it is incorrect to say that the number
of girls is four more than the number of boys. According to Lobato and Ellis
(2010, as cited in Rathouz et al., 2014) there are two key concepts of ratio,
8
composed units and multiplicative comparisons. To interpret the ratio 3:7 in
composed units, students must be able to perceive that for every 3 boys,
there are 7 seven girls. In addition, if students are able to express that the
number of girls is 7/3 times as many of the number of boys, it means students
understand that there is a multiplicative comparison in ratio.
Even though there is not much literature that specifically discusses
about scale, Freudenthal (1999) mentioned scale as the example of ratio.
Ratio and scale are connected one another. In addition, Ben-Chaim et al.,
(2012) claimed that “scale (in measurement) can be defined as the ratio
between a unit of measure on a map and the real distance (using the same
unit of measurement)” (p. 25). Since scale also compares two quantities, we
may derive a conclusion that scale is also ratio. There are different ways to
express scale, for example a verbal scale, representative scale, and graphic
scale (Roberge & Cooper, 2010). Scale and its representations are usually
found in map and resizing context.
According to the literature review, we can conclude that proportion, ratio, and
scale are related. The three key terms talk about comparison. Proportion
denotes equal comparison between two ratios while ratio denotes comparison
between two quantities. Since ratio is comparing two quantities, scale is a part
of ratio which compares distance on the map and real distance. There are two
key concepts of proportion which ratio and scale also have, multiplicative
comparison and composed unit. In this study, we will focus on perceiving

9
multiplicative comparison between numbers on ratios. Students need to use
multiplicative comparison to determine missing values problems to show that
they understand the concept of ratio.
B. The Importance of Learning Ratio and Scale
Multiplicative reasoning, equivalence, and computational fluency become
the focus of mathematical themes for students in grade 3-5 (NCTM, 2000).
During these grades, children must be able to understand the idea and the
relationship of multiplication and division. Moreover, children must be able to
recognize, create, and use the idea of equivalence using numbers and
representations. In equivalence, children will involve fractions, decimals,
multiplications, and divisions as their prior knowledge. Regarding to
multiplicative reasoning and equivalence, children should be fluent in
understanding the relationship among numbers. As mentioned before,
proportion, ratio, and scale are related to multiplicative comparison and
equivalence. Therefore, children must be able to employ the three
mathematical themes in confronting with proportion, ratio, and scale.
Children’s prior knowledge will be used together with ratio to study other
topics such as similarity (Streefland, 1984) and linear equations (Ellis, 2013).
When children study the concept of similarity in geometry, they will utilize the
concept of ratio. For example, to prove that a triangle is similar to another
triangle, students must be able to see which sides are being compared and
whether the three pairs of sides are proportional. Comparing corresponding

10
sides on triangle is in fact ratio. Moreover, comparing whether all pairs of
corresponding sides holds the same ratio is related to proportion.
On the lower level of secondary education, children will encounter ratio as
an integrated concept. Children’s understanding about ratio will be used in the
concept of slope in linear equations (Rathouz et al., 2014). As an example, to
describe what slope is, students must be able to perceive the relationship
between the value of x and y. The comparison between x and y can be written
as m, in a linear equation it is called as gradient. Observing every pair of x and
y, children find out that the value of all pairs is the same. Thus, children who
have a strong ratio concept will have better understanding of slope (Ellis,
2013).
C. Knowledge Gap
Many studies have been done to explore students’ understanding in
learning ratio and proportion (Karplus et al., 1983; Hart, 1984; Tourniare &
Pulos, 1985; Singh, 2000). However, the study about developing a local
instruction theory on ratio and explanation on how the learning sequences help
students to learn the concept of ratio are still rare. Therefore, as a researcher,
we need to carry out the study which aims at developing learning sequences on
ratio. We hope the result of the study can contribute to the development of local
instruction theory on ratio.
Other than that, there must be a change in introducing ratio in school. As
mentioned before, ratio and proportion can be written as fractional form.

11
Teachers have tendency to instruct students to solve ratio and proportion
problems in fractional form using cross-multiplication. Students who already
understand the formal method of working with fractions might solve the
problems using cross-multiplication. However, teachers need to be careful in
introducing cross-multiplication. It may cause students to make mistakes,
especially when students use incorrect proportions (Ellis, 2013).
D. Students’ Misconceptions
There are different strategies children use to solve ratio problems.
According to Tourniare & Pulos (1985), there are at least four strategies.
1. Constant difference (subtraction and addition)
In this strategy, children determine the difference within the ratio. Later,
children add the difference on another ratio. We provide the problem of Mr,
Short and Mr. Tall as in figure 2.1.
From the problem, we know that the given ratio for the height of Mr. Short
is 4 matchsticks:6 paperclips. Riehl and Steinthorsdottir (2014) found out
that some children use constant difference to solve the problem as in figure
Figure 2.1. A proportion problem about heights (Riehl & Steinthorsdottir,
2014)

12
2.2.
2. Multiplicative and constant difference
Children compare numerator or denominator between ratios using
multiplicative comparison. However, when the relationship between ratios
is non-integer, children use constant difference. As an example, we provide
an example from a study (Singh, 2000). A child was asked to determine the
width of a rectangle. The researcher provided another dimension of
rectangle as the given ratio as in figure 2.3.
The child tried to determine the relationship between 36 and 27 using
division. However, she could not obtain an integer as the relationship.
Therefore, to determine p, she subtracted 36 by 27 and added the difference
to 20.
Figure 2.2. The child determined the difference within the given ratio to
determine the number of paperclips for Mr. Tall (Riehl & Steinthorsdottir,
2014)
Figure 2.3. Determining the width p (Singh, 2000)

13
3. Building up (repeated addition)
In this strategy, children are able to perceive the ratio within numbers.
However, instead of using multiplicative comparison to determine the
relationship between ratio, children use addition. We provide an example to
illustrate how children use this strategy (Tourniare & Pulos, 1985). “Given,
2 pieces of candy cost 8 cents. How much does 6 pieces of candy cost?”
From the problem, we know that the given ratio is 2 candies:8 cents. To
solve the problem, children may add 8 cents more to get 4 candies and add
8 cents more to get 6 candies. However, even though children are able to
perceive the ratio, this strategy may leads students to an error when the
numbers are non-integer (Steinthorsdottir, 2006).
4. Multiplicative
Children are able to perceive the multiplicative comparison within and
between ratios. Using the candies example, children understand that the
relationship within ratio is the price is four times the number of candies. In
addition, children understand that the number of candies in the second ratio
is six times the number of candies in the first ratio. To determine the price
of 6 candies, children multiply 6 candies by 4.
The first three strategies often happen to children in solving ratio problems
(Hart, 1984; Karplus et al., 1974; Singh, 2000). There are two reasons children
make errors in solving ratio and proportion problems (Steinthorsdottir, 2006).

14
The first, children do not pay attention to the given information on the problem.
Ratio problems provide the given ratio of the problem. Rather than
understanding the given ratio and the complete information, children tend to
solve the problem using part of information (Tourniare & Pulos, 1985). It
means that children do not fully understand the problem, especially the notion
of ratio.
The second error is that children determine difference of numbers between
ratios. As mentioned in previous studies, children are struggling to determine
an integer relationship between numbers in ratios. Therefore, to obtain an
integer, children are more comfortable to use addition and subtraction. We
cannot separate the struggles and the fact that children are experiencing
counting and whole numbers before multiplying, dividing, and working with
non-integer numbers (Lamon, 2012). The second error is related to children’s
fluency in understanding the relationship among numbers. The fact that
children use addition and subtraction in solving ratio problems proves that they
are not able to grasp ratio as a multiplicative operation (Hart, 1984; Karplus et
al., 1974; Singh, 2000).
Based on the literature review, we can conclude that students tend to determine
difference and to do addition in order to find missing values. The cause of these
misconceptions is that students try to obtain integers as the relationship within
ratio and between ratios. To tackle students’ misconception, we plan to design
learning sequences that enable students to focus on the relationship between

15
ratios using multiplicative comparison.
E. Double Number Line
Students in grade 3-5 must be able to develop and to use models or
representations in learning process to achieve three standards (NCTM, 2000):
(1) to model problem situations, (2) to investigate mathematical relationships,
and (3) to justify or to disprove conjectures. Using models or representations,
students are able to select important information related to the problem.
There are different models to introduce ratio to students such as ratio table
and double number line. In this study, we want to involve double number line
in the learning process. On the double number line, we can display two
quantities with different scales. In addition, the use of double number line
supports students in understanding relationship within ratio and between ratios
(Orrill & Brown, 2012). Given 2 mangos can be exchanged with 6 apples and
the problem asks the number of apples for 5 mangos. Students can utilize the
double number line to illustrate the ratio by putting the number of mangos on
the lower line and the number of apples on the upper line as in figure 2.4.
The double number line supports students to understand the relationship
within ratio, the number of apples is three times the number of mangos. To
mangos
apples
0
0
6
2 5
?
Figure 2.4. Using double number line in ratio problems

16
determine the number of apples in another ratio, students multiply 5 mangos
by 3. Thus, students are able to determine the missing value and to understand
that the numbers on the second ratio is 2,5 times the numbers on the first ratio.
In addition, students are able to see the composed unit since the paired numbers
are aligned and connected (Orrill & Brown, 2012).
Double number line is an appropriate model for students in grade five. As
mentioned before, students in grade five do not only involved integers but also
decimals and fractions. According to Abels et al. (2006), double number line
serves many advantages such as it gives visual support and allows students to
have an accurate calculation. Moreover, double number line has the same
nature as number line, numbers on the lines are well ordered. It allows students
to directly observe the relationship between numbers on the lines, especially to
reason that numbers on the right side are greater than numbers on the left side.
In addition, Küchemann et al. (2014) suggested to use double number line to
learn about ratio. To be more specific, double number line support students in
relating numbers within ratio and between ratios using multiplicative
comparison.
F. Realistic Mathematics Education
Realistic Mathematics Education (RME) is an approach which has been
implemented in the Netherlands since the 1970s. The development of RME
was started by Freudenthal (1977, as cited in van den Heuvel-Panhuizen,

17
2003), who thought that mathematics should be connected to the reality.
Freudenthal (1991) proposed that children should experience mathematics as a
human activity. Mathematics will be more relevant and meaningful for children
if they are allowed to investigate the solution of problems using their own
strategy.
Even though mathematics should be meaningful for children, it does not
mean that the context should be real and exists in real life. Since the word
‘realistic’ in Dutch means ‘able to imagine’, it is possible for the teacher to
make up the context. At least, by using the made-up context, students are able
to imagine (van den Heuvel-Panhuizen, 2003).
Choosing and designing contexts are important in developing learning
sequences. To support students in building their own understanding, it is also
important to design learning sequences according to the three key principles of
RME which were proposed by Gravemeijer (1997).
1. Reinvention/mathematising
The idea of the first key principle is to give students an opportunity to
experience the same process as the process of how a specific concept of
mathematics was invented. By having a discussion and informal talk,
students will develop their informal knowledge to formal knowledge
(Freudenthal, 1991).
To emerge students’ reinvention on the double number line, we provide
problems in the beginning of the learning which ask students to use the

18
length of an object as a reference to measure the length of a room. The
problems also ask students to express the length of a room using the length
of an object. When students use their references to mark and measure the
length of the room on the picture, they have their own illustration of the
informal model. In another lessons, we also ask students to draw an
illustration which represents the relationship between two quantities such as
double scale line and double number line.
2. Didactical phenomenology
To define phenomenology more clearly, Freudenthal (1999) described
mathematical objects as nooumena. In addition, experiencing a
mathematical object can be called as phainomenon. Freudenthal (1983, as
cited in Gravemeijer & Bakker, 2006) also distinguished phenomenologies
into mathematical phenomenology, historical phenomenology, and
didactical phenomenology. Here are the descriptions for each
phenomenology.
The mathematical phenomenology analyses how a mathematical
thought object organizes mathematical phenomena, the historical
phenomenology analyses how, and by what organizing activity,
various concepts, procedures and tools are constituted over time, and
the didactical phenomenology looks at both from a didactical
perspective. (p. 2)

19
We involve contexts related to scaling as a didactical phenomena. For
the context, Roberge and Cooper (2010) suggested to use a context which is
familiar with students’ surrounding and continue the context with a new
situation. Students are familiar with environment around their home and
school. In this study, we design the first activity with plan context and
continue to larger area, for example travelling to different cities using maps.
In plan and map contexts, students will use a reference.
According to Streefland (1991), mathematical activities involving the
reference promotes the notion of comparison and multiplication. Students
compare the reference to determine how many times the reference fits the
length of the object or the path. In this case, the reference becomes the
representation of fraction (Roberge & Cooper, 2010). It is also possible to
include following problems involving real distance and travel time. Using
the length of the path, students can determine the total travel time by
multiplying the given time for a certain distance to the number of reference
fits the path.
In this study, we will involve the context of map and travelling in which
students are familiar with. We design problems about determining the real
distance, the length of travel time, and fuel consumption to introduce the
concept of ratio. Using these contexts, we expect students are able to
understand the relationship within ratio and between ratios.

20
Figure 2.5. Levels of emergent model (Gravemeijer, 1997)
3. Self-developed models
Models may support students in learning mathematical concepts,
especially to bridge informal and formal knowledge (Gravemeijer, 1997).
There are different levels in which the informal model of shifts to the formal
model for. In this study, we use double number line as a model to support
students in solving ratio problems. We will describe each level of models as
seen in figure 2.5 and its connection with the study.
a. Situational level
In the first level, students use strategies which are within the context of
the situation (mainly out-of-school situations) (Gravemeijer, 1997).
Students’ strategies in solving problems depend on their prior
knowledge. In the study, we provide problems which involve students’
prior knowledge in making and using a reference as a scale line. Students
use the length of a reference to determine how many time it fits the length
of an object. While comparing and iterating the reference on the object,
students make their own illustration to represent the comparison between
the length of the reference and the length of the object.
b. Referential level
Students will solve problems using strategies and models which are
referring to the problems (Gravemeijer, 1997). In other words, the model

21
in this level becomes a model of for problems. In the study, the scale line
develops to the double scale line. Students will be asked to illustrate the
relationship between distance on the map and real distance into a double
scale line. The double scale line considers the precise measurement.
Therefore, the model will be more like a ruler, in which spaces between
numbers are important.
c. General level
After some time, the focus of the model shifts towards the mathematical
relations (Gravemeijer, 2004). In the general level, the model becomes a
model for for the mathematical activity. Later in the study, it is
unnecessary for students to preserve the precise mesurement between
numbers on the model. As the context is not always about finding the real
distance, students shift the model to the formal double number line.
d. Formal level
In the last level, students will work with conventional procedures and
symbols (Gravemeijer, 1997). Students will not need the model to solve
ratio problems. The focus is to elicit the multiplicative comparison using
the formal method.
G. Indonesian Mathematics Curriculum
Before students are introduced to ratio, they have learned about addition,
subtraction, multiplication, division, and measurement in the previous grades.
Students also have prior knowledge about fractions, percentages, and decimals.

22
We provide the standard competence and the basic competence of learning
ratio for students grade five in table 2.1.
Table 2.1. The concept of ratio and scale in the Indonesian mathematics
curriculum (Kemendikbud, 2013)
The Standard and Basic Competence in Grade 5
3. Understanding the factual and
conceptual knowledge by observing
and asking about their environment
3.4 Learning the concept of
ratio and scale
H. Social Norms, Socio-mathematical Norms and the Role of Teacher
The notion of social norm comes from a situation where a person is
involved in a specific environment (Tatsis & Koleza, 2008). To interact well,
the person must agree to the written or unwritten rules set in the environment.
A social norm is general and can be found in different situations (Yackel &
Cobb, 1996), for example in a mathematics classroom. However, we cannot
say that norms in the mathematics classroom are socio-mathematical norms.
Socio-mathematical norms are unique and can be applied only in the
mathematics classroom.
What makes socio-mathematical norms different compared to social
norms? Socio-mathematical norms are about noticing mathematical difference,
mathematical sophistication, and acceptable mathematical explanation and
justification (Yackel & Cobb, 1996). The mentioned aspects are aiming to grow
an intellectual autonomy in mathematics, which means that students are aware
that they are able to reason and to draw conclusions based on their

23
mathematicals knowledge.
A certain classroom culture contributes to the mathematics reformation
(Gravemeijer, 2004). One of affecting elements in the classroom is the teacher.
Since it is important to raise students’ awareness of what they are capable of in
the mathematics classroom, the role of the teachers is important. Teachers
support students by asking questions or making explicit statements on why a
students’ strategy in solving a problem counts as a good strategy. In addition,
the teacher may ask students to reason how their answers are different
compared to other students’ answers.
In the study, the role of the teacher is to focus on supporting students to
discuss about concepts related to ratio. For example, the teacher can conduct a
discussion about a scale line, double scale line, and double number line during
the lessons. During the discussion, the teacher may ask questions such as what
students know about the term, what students can derive from the term, what
information the model holds, and what differences and similarities among those
models. In addition, the teacher should give an example to distinguish between
difference and comparison. The teacher may ask students what they know
about ratio. Later, using students’ understanding about ratio, the teacher gives
reinforcement that difference denotes the notion of subtraction and addition
while comparison denotes the notion of multiplication and division.
Students might not able to understand the notion of ratio on problems and
it may lead to errors. To support students, the teacher points out the given ratio.

24
According to literature review, students often use subtraction and addition to
determine missing value. The teacher should suggest students to focus on
multiplicative comparison between numbers on ratios. The teacher should
discuss students’ answers. For example, the teacher invites students to discuss
what effect students will face if they are using subtraction and addition or
multiplication and division to solve problems.
I. Local Instruction Trajectory
Gravemeijer (2004) defined local instructional theory as “the description of,
and rationale for, the envisioned learning route as it relates to a set of
instructional activities for a specific topic” (p. 107). There are four elements of
local instruction theory: (1) tools as the representation for students to solve the
problem, (2) imagery as students’ understanding on the tools, (3) activity, and
(4) potential mathematical discourse topic. According to the definition, local
instruction in this study provides the description of envisioned learning routes
and mathematical activities on the topic of ratio and scale.
25
CHAPTER 3
METHODOLOGY
A. Research Approach
As mentioned before, the study and the development of local instruction
theory on the teaching and learning of ratio and scale is rare, especially in
Indonesia. According to the research question of the study: How can the double
number line support students in learning ratio and scale problems?, we aim to
design learning sequences on ratio and scale. Moreover, the study wants to find
out how the learning sequences enable students to learn about ratio and scale.
In other words, the study aims to innovate the current learning and to contribute
to the development of local instruction theory on ratio and scale. The aim of
the study fits with the design research approach because it gives insights about
innovative ways of teaching (van Eerde, 2013).
According to Gravemeijer and Cobb (2006), there are three steps in
carrying out design research. In each step, the designed HLT has its own
function. In this section, we will mention and connect the steps to the study.
1. Preparing for the experiment
The aim of this step is to formulate a local instruction theory, which can
be revised and elaborated (Gravemeijer & Cobb, 2006). In this step, the
researcher needs to do literature review to formulate the research aim, the
research question, and to design hypothetical learning trajectory (HLT). The

26
HLT becomes a guideline for the researcher to develop the design
instructional materials in the preparation phase (Bakker, 2004).
Other than that, we perform interview with the teacher and class
observation to find out socio norms, socio-mathematical norms, and the
teaching-learning process in the classroom. To find out whether students
have a notion on a multiplicative comparison and on using double number
line to solve ratio problems, we carry out a pretest. Problems in the pretest
are based on the literature review on ratio and scale.
2. Experimenting in the classroom
According to Gravemeijer and Cobb (2006), the aims of experiment are
to test conjectures on the HLT and to understand how conjectures work. In
this step, the HLT becomes a guideline for the teacher and the researcher to
focus on every activity in the learning sequences, especially the teaching-
learning activity, interview, and observation (Bakker, 2004). There are three
stages of cyclic process in experimenting: testing, understanding, and
developing the learning trajectory. The cyclic process aims to improve the
HLT for the next cycle.
In this study, the first cycle is conducted using the designed HLT. In
every lesson, the researcher compares the HLT to the actual learning.
Moreover, we reflect on what can be improved for the next lesson. The
process is called micro cycles. The micro cycles form macro cycle, which
shapes the local instruction theory (see figure 3.1).

27
Figure 3.1. Micro cycles form and shape the local instruction theory
(Gravemeijer & Cobb, 2006)
Once the first cycle has finished, the researcher analyzes all collected
data and compares the HLT to the actual learning. The researcher finds out
things to be improved or revised for the design. The improved HLT is
carried out on the second cycle.
3. Conducting a retrospective analysis
In general, the aim of the retrospective analysis is to contribute to the
development of a local instruction theory (Gravemeijer & Cobb, 2006). In
this step, the HLT becomes a guideline for the researcher to determine the
focus of the analysis in the retrospective analysis (Bakker, 2014).
In this study, the retrospective analysis is executed after the second
cycle. Furthermore, the HLT is compared to the actual learning. From the
analysis, the researcher confirms findings which are in line or contradict the
HLT. In addition, the researcher derives conclusion from the analysis and
use the conclusion to answer the research question of the study.
28
B. Data Collection
1. Observation
In order to gain an overview about the classroom and the participants, the
researcher observes the learning in the classroom. The researcher pays
attention to the way the teacher manages the class and conducts the lesson,
the interaction among students, and the interaction between the teacher and
students. In specific, the focus of the observation is socio norms and socio-
mathematical norms in the classroom. The researcher makes field notes
according to the observation scheme (see appendix A) and video registration
during the observation.
2. Semi-structured interview
After the observation, the researcher interviews the teacher to ask questions
according to the observation. The interview is conducted according to the
interview scheme (see appendix B) to obtain the intended information.
Through the interview, the researcher gains more information not only about
what happens in the classroom but also things which the researcher cannot
observe in the class, for example the background of the teacher, learning
material and teaching method the teacher used on ratio and scale, and
students’ knowledge. The researcher makes recordings of the interview for
data analysis.
29
3. Pretest
Before the researcher starts implementing the lesson, a pretest is
conducted. The pretest consists of five problems on the topic of ratio and
scale (see appendix C). In general, the goal of each item is to determine
students’ ability in using multiplicative comparison to solve ratio problems.
Moreover, we want to find out whether students use representations to help
them solve problems.
The researcher also conducts an interview and makes video
registrations to gain information about how students understand the topic of
ratio and scale and on how students solve problems. In the first cycle, the
researcher interviews students who become the participant of the pilot study.
In the second cycle, the researcher interviews the focus group students.
4. The pilot study (first cycle)
The first cycle becomes a pilot study which aims to try out the designed
HLT and involves five students of class 5B who are intermediate achievers
according to the teacher’s recommendation. In the first cycle, the researcher
becomes the teacher. With the help of observer, the researcher collects
students’ written work, and makes field notes and video registration on the
teaching-learning process. Once the collected data is analyzed, the
researcher revises and improves the HLT to be implemented in the next
cycle.

30
5. The teaching experiment (second cycle)
In the second cycle, the researcher implements the improved HLT. The
teaching experiment involves 34 students from class 5C and the regular
mathematics teacher. There is one focus group consists of four students with
the intermediate level of mathematics according to the pretest and the
teacher’s recommendation. In the second cycle, the teacher is the regular
mathematics teacher in that class while the researcher acts as the observer.
The researcher collects students’ written work, makes field notes and
video registrations. There are two video recorders to record the activity and
discussion in the focus group and the activity of the whole class.
6. Posttest
Once the researcher has finished implementing all the five lessons, the
researcher conducts a posttest in each cycle. The posttest aims to find out
the development of students’ understanding about ratio, especially the
notion of multiplicative comparison. Furthermore, we want to find out
whether students use representations such as double number line, to solve
problems. The content of the posttest is as the same as in the pretest (see
appendix C). In addition, the researcher interviews students and makes
video registrations for the interview in each cycle to find out students’
development in understanding the topic and solving problems. In the pilot
study, the researcher interviews the five students while in the teaching
experiment, the researcher interviews the focus group students.

31
7. Validity and reliability
Validity and reliability are important in the data collection to derive
valid and reliable conclusion. In general, validity means whether the
instruments truly measure what it intends to measure while reliability means
the independency of the researcher (Bakker & van Eerde, 2014).
To improve the validity, the researcher consults the design materials to
experts. In data collection, the researcher collects data using different
methods. The collected data is triangulated in the analysis. The data
triangulation also contributes to the internal validity of data collection.
Furthermore, the natural learning environment, in which the teacher
conducts the lessons and the learning happens in a regular classroom,
promotes the ecological validity of the study. To increase the reliability of
the data collection, the researcher obtains video registrations by using video
recorders.
C. Data Analysis
1. Observation
In the study, the researcher chooses important and relevant fragments such
as socio and socio-mathematical norms in the class. The researcher
describes and interprets the fragment. The result of the analysis is used to
improve the HLT and to support the conclusion of the study.

32
2. Semi-structured interview
This study analyzes the interview recording as the same as in analyzing the
fragments in observation. Together with the result of observation analysis,
the result of analyzing transcripts and fragment of interview is aiming to
improve the HLT and to support the conclusion of the study.
3. Pretest
The researcher analyzes the pretest in both cycles qualitatively by
looking at students’ reasoning in solving ratio problems. The pretest analysis
aims to determine students’ knowledge about ratio and scale. Important
fragments from the interview reveal students explanation on solving
problems. The researcher describes and use fragments to support students’
written work.
The result of the pretest can be used to improve the HLT about students’
prior knowledge. Along with the recommendation from the teacher, the
result of the pretest in the second cycle is used to determine the focus group
students.
4. The pilot study (first cycle)
In this study, the researcher analyzes the collected data by comparing the
designed HLT to the actual learning. The researcher chooses important
fragments from video registrations about students’ thinking, especially in
the notion of multiplicative comparison and the notion of using double

33
number line to solve the problems. These fragments give information about
the occurrence of the conjectures. Together with the fragments, the
researcher uses relevant field notes and students’ work to illustrate and
describe students’ thinking. The result of the analysis of each lesson is used
to improve the HLT for the next lesson while the result of the whole analysis
is used to improve the HLT for the next cycle.
5. The teaching experiment (second cycle)
The researcher analyzes the collected data in the second cycle by selecting
and describing important fragments from video registrations. In general, the
researcher chooses important fragments to confirm or to refute conjectures
in the HLT. Since the result of the retrospective analysis is to answer the
research question, it is important for the researcher to choose a fragment
which shows students solving problems using the double number line and
multiplicative comparison. The researcher interprets the fragments together
with relevant field notes and students’ written work as an illustration of
students’ thinking. To analyze students’ written work, the researcher uses
conjectures to compare it to the actual students’ work.
6. Posttest
The posttest is analyzed in the same way as in analyzing the pretest. From
the video registrations on interviewing students after the posttest, the
researcher chooses important segments to be described and transcribed. The
34
example of important segments is the fragment shows students explaining
their method in solving problems. From the posttest, the researcher also
derives supporting arguments about the development of students’
understanding in learning ratio and scale, especially in using a double
number line and a multiplicative comparison to solve ratio problems.
7. Validity and reliability
Bakker and van Eerde (2014) classified validity and reliability into
internal and external aspects. In the study, the researcher tests the data with
the HLT. From the analysis, the researcher adjusts and improves the HLT
for the next lesson and cycle. This process contributes to the internal
validity.
External validity is related to the generalizability of the result which can
be used in different contexts (Bakker & van Eerde, 2014). To improve the
generalizability of the study, thick description is needed. In the study, the
researcher provides the description and interpretation on the actual and
observed learning. In addition, the researcher considers the diversity of
environment conditions such that others can adjust the design according to
their own condition.
A study has a high external reliability if it can be replicated. Therefore
the documentation of the study must be very clear that the readers are able
to track how the experiment was going and how the researcher derives the
conclusions (Bakker & van Eerde, 2014). In this study, the researcher

35
explains explicitly about the process and the result. Therefore, the readers
can follow the line of this study.
D. Research Subject
The participants of the study are students in the fifth grade and their
mathematics teacher in SDIT At Taqwa, Surabaya. In the first cycle, the pilot
class is class 5B which consists of five students. For the real experiment, the
chosen class is class 5C which consists of 34 students.

36
CHAPTER 4
HYPOTHETICAL LEARNING TRAJECTORY
Before carrying out a design research study, a researcher needs to design
learning sequences. A researcher has to find out the prior knowledge of students to
learn the topic and decide the end point of the learning. Every learning sequence
contains planning about how the learning will be implemented, which is called
hypothetical learning trajectory (HLT). It is important for a researcher to have HLT
according to background theories. HLT provides an insight about the focus of each
learning. According to Simon (1995), an HLT consists of three components: the
learning goals, the learning activities, and conjectures of students’ answer.
As mentioned in chapter 3, HLT has different functions in the design research
phase (Bakker, 2004). In the design phase, the formulated HLT functions as a guide
of the design of developed instructional material. Researchers will have a
foundation as a focus of the study and still be able to improve the planning and the
learning material during design phase. The HLT becomes a guideline not only for
researchers, but also teachers in teaching experiment. It helps researchers and
teachers to focus on teaching process, interview, and learning observation. In this
phase, the HLT can be improved for the next lessons. In the retrospective analysis
phase, the HLT functions as a guideline for researchers to analyze the collected
data. Using the HLT, researchers compare conjectures of students’ answer to the
actual learning and produce instruction theories. The HLT can also be improved

37
before researchers implementing the next cycle.
In this study, we focus on developing a local instruction theory on ratio and
scale. Using information on the preparation phase, such as reviewing literature and
interviewing the teacher about students’ prior knowledge, we design five lessons
which aim to support students to learn about ratio using double number line. Each
lesson has its own learning goal. We provide the instructional activities for learning
ratio as follows.
A. Lesson 1
1. Starting points
In previous grades, students have learned about expressing inequality
informally by comparing a pair of opposite characteristics, estimation,
multiplication, and division. Before students learn about ratio, they have
learned about fraction and decimal. Using the preliminary knowledge, we
would like to allow students to develop their knowledge. Thus, we assume
that students have starting points such as:
Students are able to estimate the length of an object
Students are able to compare two quantities
Students are able to use multiplication and division
Students are able to present numbers into fractions and decimals
2. The learning goals
Students are able to use a scale line.

38
Students are able to use the length of a reference to describe the length
of an object.
Students are able to use the scale line to describe the real length.
Students are able to make and to use a scale line in a plan.
3. Description of activity
Activity 1
Problem 1a
The teacher starts the lesson by displaying the picture of a studio plan.
The purpose of displaying a picture of a studio plan is to trigger students to
come up with the notion of a scale line. To support students, the teacher asks
information students usually get from a plan and leads students to mention
about scale. These are questions the teacher can ask students:
“What do you know about scale?”
“Where do you find scale other than in a plan?”
“What representation do you use to illustrate scale?”
A scale can be in different forms. As in a plan, it can be in numeric or
illustration such as a scale line. Some students might not familiar with a
scale line. Thus, the teacher supports students by telling that a scale line is
a line which contains a certain scale.
Later, the teacher asks students to measure the dimension of the
bedroom. Some students might propose using a ruler since it is a plan. The

39
teacher asks students to imagine it is in a real condition, therefore it is
impossible to use a ruler because it will be inefficient. Besides, the focus is
not about being precise in measuring but describing how many times the
length of an object fits the length of another object. The teacher suggests
students to use a paper strip as a ruler. If students have no idea, the teacher
may lead students to use furniture on the plan to measure the dimension of
bedroom. An object which students use to measure is called reference. Once
students are able to use the reference, the teacher proceeds to students’
worksheet. Figure 4.1 illustrates the problem. The teacher narrates the
context:
“An architect draws a studio plan. However, he does not write the
measurement of the studio. If people who are interested in buying the studio
want to know the measurement of the studio, what will they do?”
To emerge discussion, the teacher gives students some time to think and to
Below is a studio plan.
Choose an object on the plan as your reference. Make a scale line with the same length as your reference.
Use the blank plan to measure the coloured walls. Make an illustration to determine how many times your reference fits the coloured walls.
KITCHEN
BATHROOM
BEDROOM
Figure 4.1. The studio plan and the blank studio plan

40
discuss with their friends. We provide conjectures of students’ answer in
table 4.1.
Table 4.1. Conjectures of students’ answer for problem 1a in lesson 1
Conjectures of students’ answer Suggestions for the teacher
Students are not able to use the
length of a reference as a scale line
and not able to illustrate the
relationship of a reference and a
coloured wall
The teacher may encourage
students to use the reference to
determine how many times the
reference can fit the coloured
walls. To make an illustration, the
teacher can encourage students to
compare the reference and the
object, then mark how many times
the reference fits the length of the
object
Students are able to use the length
of a reference as a scale line,
determine the length of walls, and
illustrate the comparison between
the reference and the coloured wall
If students use small furniture, the
teacher may ask students to use
large furniture
Once students finish working, the teacher conducts class discussion. The
teacher can discuss about different references give different measurements.
For example, to fit the orange wall using the length of a bed, we need two
times of the bed’s length. However, when we use the length of a couch, we
need seven times of its length to fit the orange wall. The teacher needs to
point out that different references influence different measurement,
especially in determining how many times the reference fits the coloured

41
walls.
Problem 1b
The context of the problem is as the same as the previous problem.
Students will encounter a problem which involves a scale line with a specific
measurement as in figure 4.2. The problem promotes students to make their
own model to compare the length of a scale line and the cables.
Students will be given some time to think and to discuss with their friends.
We provide conjectures of students’ answer in table 4.2.
A technician will install cables from the power to bedroom and toilet. The orange and green lines illustrate the installation of cables. Make an illustration to determine how many times the scale line fits the other lines.
Determine the real length of both cables.
Here is my illustration. The length of orange line is __________. So, the real length is ________. Here is my illustration. The length of green line is __________. So, the real length is ________.
power
Figure 4.2. Making illustration and determining the real length

42
Table 4.2. Conjectures of students’ answer for problem 1b in lesson 1
Conjectures of students’ answer Suggestions for the teacher
Students are not able to use the
scale line and not able to draw an
illustration to compare the length
of a scale line and the cables
The teacher may encourage
students to draw the scale line
above the orange or green line.
Ask students to determine how
many times the scale line fits the
other lines by marking the orange
or green line
Students are able to use the scale
line and able to draw an
illustration to compare the length
of a scale line and the cables
The teacher may ask students to
find out how they use the scale
line
In the class discussion, the teacher needs to point out the illustration
students make to illustrate how many times the scale line fits the cables. The
illustration will be students’ own construction model. There are questions
the teacher can ask to students in the class discussion:
“What do you know about the blue line on the problem?”
“What the blue line represents?”
“How do you use the blue line to measure the orange and green line?”
Activity 2
In this activity, students will have to draw a plan for their classroom.
Figure 4.3 shows the problem on the worksheet. We provide conjectures of
students’ answer in table 4.3.

43
Table 4.3. Conjectures of students’ answer for activity 2 in lesson 1
Conjectures of students’ answer Suggestions for the teacher
Students are not able to use a scale
line to draw a classroom plan and
to determine the real dimension of
the classroom
The teacher may encourage
students to imagine how many
times their reference fits the
classroom. Later, ask students to
draw the dimension of classroom
using the scale line. Since students
already estimate the real length of
the reference, ask students if for
one reference the length is x, then
what about, for instance, four
times of reference
Students are able to use a scale line
to draw a classroom plan and to
determine the real dimension of
the classroom
The teacher may ask students to
think about what will happen if
another student choose different
reference with different length
In a class discussion, it is important to point out how students use a
reference as a scale line to draw the classroom plan. Students might choose
Make a plan of your classroom. Choose an object as your reference. Use the reference as a scale line to draw the plan. Describe the dimension of your classroom.
I use ___________ as a reference. I estimate its real length is _________. Below is my scale line: Below is my classroom plan:
Figure 4.3. Instructions to draw a classroom plan

44
different references and different estimations for the length. The teacher can
discuss how different references and different lengths may affect students’
classroom plan.
B. Lesson 2
1. The learning goals
Students are able to work with a double scale line.
Students are able to use information about real distance and distance on
the map to determine which map fits the given double scale line.
Students are able to illustrate the relationship between the distance on the
map and the real distance into a double scale line.
Students are able to use the double scale line to determine real distances.
2. Description of activity
Problem a
The teacher starts the lesson by asking following questions related to a
map:
“What information you can get from a map?”
“Have you ever seen a double scale line? What do you know about it?”
“Why do you think it is called as a double scale line?”
“Why there are two lines on a double scale line?”
Later, the teacher proceeds to introduce the problem to students. The teacher
may narrate the problem. Give students some time to understand

45
information given on the problem and to discuss with their friends. In this
lesson, students are allowed to use a ruler to measure. Figure 4.4 illustrates
the problem. We provide conjectures of students’ answer in table 4.4.
Figure 4.4.
Here are three maps with different sizes. A map usually has a double scale line. Below is the double scale line. Given the distance from Gresik to Surabaya is 15 km, determine which map fits the double scale line. What will happen to other maps if those maps use the provided double scale line? Explain your answer.
Map A
Map B
Map C
Figure 4.4. Three different size maps and a double scale line

46
Table 4.4. Conjectures of students’ answer for problem a in lesson 2
Conjectures of students’ answer Suggestions for the teacher
Students have no idea on working
with the double scale line
The teacher may remind students
about why there are two lines on a
double scale line and what
information it holds
Students are able to determine
which map fits the double scale
line but they are not able to reason
for other maps
The teacher may encourage
students to compare 15 km on the
double scale line to the two other
maps
Students are able to determine
which map fits the double scale
line and able to reason for other
maps
The teacher may ask students to
show his reason using different
distances from the three maps and
the double scale line
In a class discussion, the teacher points out what will happen to other maps
if those maps use the provided double scale line. Moreover, the teacher leads
students to discuss why a double scale line on a map should represent the
precise measurement. Other than that, the teacher may direct the discussion
to ratio. The teacher tells students that a double scale line is a way to
illustrate ratio and that ratio is a comparison between two quantities. The
teacher may discuss ratio in depth relating to the double scale line by asking
following questions:
“What do you know about ratio?”
“What can you tell about double scale line related to ratio?”
“Do you think scale is a ratio? Why?”

47
Problem b
Once students have determine the map which fits the double scale line,
students will have to draw double scale lines for two other maps. Figure 4.5
shows the problem. We provide conjectures of students’ answer in table 4.5.
Table 4.5. Conjectures of students’ answer for problem b in lesson 2
Conjectures of students’ answer Suggestions for the teacher
Students draw inappropriate
double scale lines:
Students do not know how to
draw a double scale line
Students do not write
information on the double scale
line
Information and students’
drawing are not match
The teacher may remind
students about information they
can get from a double scale line
The teacher may remind
students to write information on
the double scale line. Therefore,
others understand what the
double scale line tells
The teacher may lead students
to have precise measurement in
drawing the double scale line
and make sure that the drawing
represents the correct
information
Students draw appropriate double
scale lines
The teacher may ask students to
think about how a double scale
line can be used to determine real
distance or distance on the map
You have determine which map fits the double scale line. Draw double scale lines for the other maps.
Figure 4.5. Students have to draw double scale lines

48
In a class discussion, it is important for the teacher to emphasize the
preciseness in drawing a double scale line. The teacher may relate to the
previous problem, what will happen if a map does not have a proper double
scale line. The teacher may use an example of travelling to a new place using
GPS. If the double scale line on GPS does not show an accurate
measurement, people might get lost while travelling.
Activity 2
In this activity, the teacher may ask whether students are able to use the
double scale line to determine real distance. Later, the teacher narrates the
problem as in figure 4.6. Since students do not know distance on the map,
the teacher encourages students to use a ruler to measure distance between
cities. We provide conjectures of students’ answer in table 4.6.
Figure 4.6.
Look at the map below. Edi and his family lives in Madiun. They will travel to different cities by car on holiday. Each day, they will travel to another city. Edi’s father will choose the shortest route. Edi does not know how far they will travel, so his father makes an illustration. Help Edi’s father to complete the line below by measuring distance between cities and determining real distance. Remember: The distance between Gresik and Surabaya is 15 km
Figure 4.6. Using double scale line to determine real distance

49
Table 4.6. Conjectures of students’ answer for activity 2 in lesson 2
Conjectures of students’ answer Suggestions for the teacher
Students do not use the model to
determine real distances
The teacher may encourage
students to show distances
between cities on the map on the
double scale line. The teacher may
ask students to use the double
scale line to determine real
distances
Students use the model to
determine the relationship between
numbers to find out real distances
Students determine real
distance for each cm
Students observe the
relationship between distances
on the map
The teacher may ask students to
explain their work, especially how
determining distance for each cm
is different to observing
relationship between distances on
the map
It is possible that students might not consider the problem as ratio problem.
In a class discussion, the teacher may ask students to show the ratio of the
problem. Since ratio can be written in fractional form, the teacher may also
relate the given ratio to fraction. Other than that, the teacher may conduct
discussion on how students determine real distances. Some students might
determine real distance for each cm, use formal method, or observe the
relation among distances on the map. The teacher can discuss the drawback
and the benefit of using different methods.

50
C. Lesson 3
1. The learning goals
Students are able to represent the relationship between distance on map
and real distance into an illustration.
Students are able to order the given numbers on the stretched route to
determine real distance.
Students are able to use the stretched route to show the relationship
between numbers.
2. Description of activity
Problem 1a
The teacher starts the lesson by reminding students about a double scale
line. Given a Bali map as in figure 4.7, the teacher instructs students to draw
the double scale line using given information. We provide conjectures of
students’ answer in table 4.7.
Pak Nyoman owns a tour business in Denpasar. He arranges tour for tourists. There is a bus to transport tourists in a journey to five different cities. Here is the route on the map. Pak Nyoman knows 4 cm on the map represents 80 km.
Make a double scale line for the map.
Figure 4.7. A Bali map and its route

51
Table 4.7. Conjectures of students’ answer for problem 1a in lesson 3
Conjectures of students’ answer Suggestions for the teacher
Students draw inappropriate double
scale lines:
Students do not know how to
draw a double scale line
Students do not write
information on the double scale
line
Information and students’
drawing are not match
The teacher may remind students
about information they can get
from a double scale line
The teacher may remind students
to write information on the
double scale line. Therefore,
others understand what the
double scale line tells
The teacher may lead students to
have precise measurement in
drawing the double scale line and
make sure that the drawing
represents the correct
information
Students draw appropriate double
scale lines
The teacher may ask students to
think about how a double scale line
can be used to determine real
distance or distance on the map
In a class discussion, the teacher may remind students using class discussion
in previous lesson about drawing double scale line. The teacher needs to
make sure that students draw a precise double scale line and write
appropriate information on the double scale line.
Problem 1b
The teacher proceeds to narrate the problem as in figure 4.8. While

52
narrating the problem, the teacher informs students that students do not have
to work with a ruler since distances on the map have been given.
Other than that, students will work with a stretched route. Since the model
has developed into more formal model, the teacher tells students that they
may ignore the preciseness of measurement on the stretched route.
Moreover, students need to focus on the given numbers to determine the
relationship between numbers. We provide conjectures of students’ answer
on table 4.8.
Table 4.8. Conjectures of students’ answer for problem 1b in lesson 3
Conjectures of students’ answer Suggestions for the teacher
Students are not able to order the
given numbers on the stretched
The teacher may encourage
students to think of the stretched
To inform the tourists how far the journey is, Pak Nyoman measures the distance of each distance from Denpasar. Here is the result.
Destination Distance on the map (cm)
Ubud 1
Klungkung 2,5
Batur 5
SIngaraja 6,5
Negara 10
If the route is stretched into a line, it will be the illustration below. Use the line to determine the real distance from Denpasar to each destination. Complete the line with information.
Figure 4.8. Working with the stretched route

53
route route as a number line or a scale
line, in which numbers should be
well ordered
Students determine real distances
by relating given numbers using
subtraction and addition
The teacher may encourage
students to observe the relationship
between numbers using
multiplication or division rather
than determine difference between
numbers
Students determine real distances
by relating numbers using
multiplication and division
The teacher may ask students to
help their friends, especially other
students who determine difference
to find out real distance
In a class discussion, it is important for the teacher to discuss students’
work which use addition to determine real distance. The teacher may
compare to other students’ work who observe the relationship between
numbers using multiplication or division. Using students’ work, the teacher
may conduct discussion what will be the drawback of the method and the
benefit of the method. In addition, the teacher invites students to discuss the
operation in finding difference and in comparing. The teacher underlines
that difference is related to subtraction and addition while comparison is
related to multiplication and division.
Referred back to the term ratio, in which students comparing two
quantities, it means multiplication and division are needed. Therefore, the
teacher supports students to observe the relationship between given numbers

54
using multiplication and division rather than determine the difference
between numbers.
Problem 2
In this problem, students will have to draw the model by themselves.
Students might struggle to decide what information should be on the lower
or upper line. Therefore, the teacher decides that the given information is
written on the lower line while the determined value is on the upper line.
Figure 4.9 illustrates the given problem. The problem is related to the
previous problem. It is using the determined real distances on the previous
problem as the given information. We provide conjectures of students’
answer in table 4.9.
Figure 4.9.
Table 4.9. Conjectures of students’ answer for problem 2 in lesson 3
Conjectures of students’ answer Suggestions for the teacher
Students are able to draw the
model but not able to order the
given numbers
The teacher may encourage
students to think of the stretched
route as a number line, in which
numbers are should be well
ordered
Students are able to draw the
model and order the numbers.
Students determine the relationship
The teacher may encourage
students to observe the relationship
between numbers using
Pak Nyoman wants to inform the bus driver about the fuel consumption to reach each destination. He knows that 2 litres of fuel can be used to travel 25 km. Make an illustration as in 1b and use it to determine fuel consumption for each destination.
Figure 4.9. Problem 2 in lesson 3

55
between numbers using addition
and subtraction
multiplication or division rather
than determine difference between
numbers
Students are able to draw the
model and order the numbers.
Students determine the relationship
between numbers using
multiplication and division
The teacher may ask students to
help their friends, especially other
students who determine difference
to find out real distance
Since the problem has similar feature as the previous problem, it is important
for the teacher to lead students to relate given numbers using multiplication
and division rather than relate given numbers using subtraction or division.
D. Lesson 4
1. The learning goals
Students are able to understand that numbers on the model must be well
ordered.
Students are able to express the multiplicative comparison on the model
to determine equivalent ratios.
2. Description of activity
The teacher starts the lesson by reminding students about an illustration
they draw in the previous lesson. The teacher informs students the name of
the illustration, a double number line. Students and the teacher discuss the
name of the model. The teacher may ask following questions:

56
“Why do you think the name is double number line?”
“What is your opinion about double scale line and double number line?”
“Can we use double number line to illustrate ratio which not only involve
distance on the map and real distance?”
The teacher tells students to work and to discuss the problems.
Respectively, figure 4.10, figure 4.11, and figure 4.12 illustrates problem a,
problem b, and problem c. Since the problems have the same feature, the
class discussion is held before the class ends. In the discussion, the teacher
has to point out that numbers on the model must be well order. The teacher
can use the model to reason. For example, numbers on the right side are
greater than numbers on the left side. Moreover, the teacher may ask
whether all pairs of ratio have the same value. To prove that the pairs have
the same value, the teacher can use fractional form. We provide conjectures
of students’ answer for the problems in table 4.10.
Do you remember Pak Nyoman and his tour business? Pak Nyoman is requested to arrange a trip for one destination. Pak Nyoman uses five cars for five different destinations. He wants to include how long the trip will take for every destination. Assume that there is no traffic jam in Bali. It takes 36 minutes to travel 24 km. Pak Nyoman makes the drawing below. Use the double number line to determine the travelling time from Denpasar to each destination.
Figure 4.10. Problem a in lesson 4

57
Table 4.10. Conjectures of students’ answer for problems in lesson 4
Conjectures of students’ answer Suggestions for the teacher
Students do not understand that
numbers on the model must be
well ordered
The teacher may encourage
students to think of the stretched
route as a number line, in which
numbers are should be well
ordered. Smaller numbers should
be put on the left side
Students are not able to express
multiplicative comparison to
determine equivalent ratios
(students use subtraction and
addition to determine equivalent
ratios)
The teacher may remind students
that ratio is related to
multiplication and division.
Encourage students to observe the
relationship between numbers
using multiplication or division
rather than determine difference
between numbers
Students are able to express
multiplicative comparison on the
model to determine equivalent
ratios
The teacher may ask students to
help their friends, especially other
students who determine difference
to find out real distance
Pak Nyoman remembers, when he travelled to Gianyar (45 km away from Denpasar), his car consumed 3 litres of fuel. Determine the fuel consumption for each destination using the double number line.
Pak Nyoman tells drivers that he needs to pay IDR 60.000 for 5 litres of fuel. Help drivers to determine how much money they will spend for fuel to each destination.
Figure 4.11. Problem b in lesson 4
Figure 4.12. Problem c in lesson 4

58
E. Lesson 5
1. The learning goals
Students are able to formulate information into a mathematical model.
Students are able to understand that equivalent ratios can be determined
by using multiplicative comparison.
2. Description of activity
During four lessons, students confront with map and travelling context.
In this meeting, students will confront with another context such as shopping
and food consumption. The teacher may ask whether students can use the
model they usually use to solve problems with different contexts. Later, the
teacher instructs students to work on problems and to discuss with their
friends. Respectively, figure 4.13 and figure 4.14 show problem 1 and
problem 2 in lesson 5. In the last lesson, the teacher ensures that students
are able to determine relationship between numbers using multiplication or
division to find out equivalent ratios. In the class discussion, the teacher may
reinforce that ratio is related to multiplication and division while subtraction
and addition related to difference. We provide conjectures of students’
reaction for problems in lesson 5 in table 4.11.

59
Figure 4.14.
Table 4.11. Conjectures of students’ answer for problems in lesson 5
Conjectures of students’ answer Suggestions for the teacher
Students are not able to formulate
the given information into a
mathematical model
Students do not know what
mathematical model they have
to make
The teacher may encourage
students to think of an
illustration they usually use
during the lessons
The teacher may point out the
given ratio and reminds students
Bali is famous with milk pie. Five tourists go to a gift shop. One of them has finished shopping. Below is the illustration on the cashier machine when he wants to pay for the pies.
a. If other tourists buy 20, 44, 4, and 12 pies, determine how much money each of them has to pay.
b. Once the tourists have finished their shopping, they head to a restaurant.
The tourist who spent IDR 135.000 finds out that she can afford 9 portions of nasi Bali using her spent money. Find out how many portion of nasi Bali each of the other four tourists can afford with the money they spent to buy pies.
Near Tanah Lot, there is a village which is popular for its cow farms. A tourist takes a walk around the village. He meets the farmer and finds out that 8 cows consume 20 sacks of grass each day. The tourist continues his walk and finds out another farms. Here are the list of farms and the number of the cows.
Farm A B C D E
Cows 10 5 13 2 4
Determine the number of sacks for each farm for one day.
Figure 4.13. Problems with shopping context
Figure 4.14. A problem with food consumption context

60
Students do not recognize the
given information as ratio
therefore they cannot formulate
information into a model
Students are not able to order
given numbers well
about the agreement to write the
given numbers on the lower line
and the determined value on the
upper line
The teacher may remind
students about a number line
Students are not able to understand
that equivalent ratios can be
determined by using multiplicative
comparison (students determine
equivalent ratios by determining
difference between numbers)
The teacher may remind students
that ratio is related to
multiplication and division.
Encourage students to observe the
relationship between numbers
using multiplication or division
rather than determine difference
between numbers
Students are able to understand
that equivalent ratios can be
determined by using multiplicative
comparison
The teacher may ask students to
help their friends, especially other
students who determine difference
to find out real distance

61
CHAPTER 5
RETROSPECTIVE ANALYSIS
A. The Timeline of the Study
SDIT At Taqwa is implementing curriculum 2013. In this curriculum, the
teacher and students must be able to finish several themes in two semester. The
vice principal of the school gave the researcher permission to do the study two
weeks before theme seven ended. We carried out the study in two classes, 5B
for the pilot study and 5C for the teaching experiment. According to the vice
principal and the teacher, there is no significant difference in terms of
mathematical ability in both classes.
Considering the time limitation of the study and the school availability, we
conducted two cycles in the study. The pilot study was held when the students
had their theme project. In this time, the students had more time to be involved
in the research because the activity in the classroom was reviewing the study
material. The teaching experiment was held when students had their mid-
semester exam. The study was conducted after students finished the test. To fit
with the given time, the pretest in the teaching experiment was conducted when
the posttest in the pilot study was carried out. We provide the timeline of the
study in table 5.1.

62
Table 5.1. The timeline of the study
Data Collection Date Participants
Classroom observation and the
teacher’s interview
17 February 2015 The regular
teacher and
students in
class 5C
Pretest and the students’ interview
before the pilot study (cycle 1)
18 February 2015 Five students
from class 5B
Cycle 1
Lesson 1: Scale lines and plans 20 February 2015 Five students
from class 5B Lesson 2: Maps and double scale lines 23 February 2015
Lesson 3: Maps and the stretched
route
24 February 2015
Lesson 4: Travelling around Bali 25 February 2015
Lesson 5: Buying things and grass
consumption
26 February 2015
Posttest and the students’ interview 27 February 2015 Five students
from class 5B
Pretest 26 February 2015 Students in
class 5C
The focus group students’ interview 27 February 2015 Four students
from class 5C
Cycle 2
Lesson 1: Scale lines and plans 2 March 2015 The regular
teacher and
students in
class 5C
Lesson 2: Maps and double scale lines 3 March 2015
Lesson 3: Maps and the stretched
route
4 March 2015
Lesson 4: Travelling around Bali 5 March 2015
Lesson 5: Buying things and grass
consumption
9 March 2015
Posttest 10 March 2015 Students in
class 5C
The focus group students’ interview 10-11 March 2015 Four students
from class 5C

63
B. Data of Preparation Phase
Before we carried out the pilot study, we would like to have an insight about
the characteristic of the teacher and the class for the teaching experiment. In
this section, we will discuss about class observation in 5C and the regular
teacher of 5C interview.
1. Class Observation
In this section, we will discuss two main concerns of the class
observation, the classroom environment and the learning process. Observing
the class environment, there were 34 students which were divided into nine
groups. Even though students were grouped, the seat arrangement is
classical. Most of the time, the teacher stood on the front of the class. When
students worked on problems, the teacher walked around the class. The
teacher asked students to get out of the class when they did not behave well.
During the learning, the teacher asked for students’ participation. The
topic of the learning was velocity. The teacher constantly asking and
reminding students about the formula of velocity. Rather than giving
students some time to think and to discuss, the teacher gave an example
before students work on the real problem. The teacher also asked students
to help each other. Later in a class discussion, the teacher gave students an
opportunity to ask, to clarify, and to speak their mind. When students had
different answers, the teacher asked students’ opinion. We could not say that
the teacher led students to use one strategy. However, the teacher kept on

64
reminding students about the formula of velocity. To close the learning, the
teacher reinforced the formula of velocity and pointed out students’ mistake
in working on the problem.
2. Teacher Interview
We conducted an interview with the teacher once the class was over. In
this section, we will discuss the teacher’s background, the learning process,
classroom norms, and RME or PMRI.
The teacher has been teaching in At Taqwa for 1,5 years. She is a
mathematics tutor since in the bachelor programme. The teacher was
assigned to teach grade three when she entered At Taqwa. She also teaches
grade six to prepare students for the final exam. Starting in this year, she
teaches grade five and grade six. The teacher does not have any specific
favourite topic in teaching mathematics. She argued that she has to master
all topics whether she likes it or not.
Students in grade five are using curriculum 2013. They have learned
about ratio and scale. Since the learning is thematic, the context of ratio and
scale depends on the theme. In addition, the teacher said that the thematic
curriculum is not as deep as curriculum 2006. To introduce the concept of
ratio, the teacher asked students to compare two things with opposite
characteristics, such as good and bad, big and small, and short and tall.
Other than that, the teacher used tools such as marbles with different
colours to compare the number of marbles for each colour. To connect with

65
scale topic, the teacher used the context of maps. Students had to investigate
the real distance, the distance on the map, and the scale. The teacher added
that students are not only familiar with map but also plan. They learned
about plan and map in grade three. In this topic, students were able to draw
a plan of their house and school and to understand the cardinal directions.
Curriculum 2013 provides word problems for students. However, the
teacher acknowledged that it becomes drawback for students because they
tend not to read problems and they struggle to understand problems. Even
though the teacher thinks word problems is important, she preferred non-
word problems as in the supplementary worksheet provided by the school.
Talking about models, the teacher does not have any experience in using
models in the learning. Considering the time limitation and the thematic
curriculum, the teacher cannot and have not use the models.
To preserve a conducive condition, the class had some written rules.
However, it was not effective. To create a conducive learning, the teacher
usually asks students who do not behave well to quit the class. For the socio-
mathematical norms, the teacher usually gives students an opportunity to
speak in a class discussion. In addition, the teacher asks students’ comment
about their friends’ work. The teacher has heard about PMRI but she does
not know exactly about it.
C. Analysis of the Pilot Study
The pilot study aims at improving the hypothetical learning trajectory

66
(HLT). In this section, we will discuss about pretest before implementing the
lessons, the learning process during the five lessons, and posttest after
implementing the lessons. In the analysis, we will compare the hypothetical
learning trajectory (HLT) to the actual learning. In the end of the analysis, we
will provide conclusion and refinement of HLT and the learning materials.
In the pilot study, five students were involved. The students were divided
into two groups, the boys group and the girls group. In pilot study, the
researcher played a role as the teacher. The mathematical activities for each
lesson are provided in chapter 4.
1. Pretest
We conducted pretest before the pilot study was implemented. The aim
of conducting pretest is to find out the students’ prior knowledge about ratio.
The test contains five questions: (1) illustrating ratio by using sentences,
figures, or symbols, (2) choosing a sentence which contains the notion of
comparison, (3) working with a scale line, (4) working with a scale line with
specific measurement, and (5) determining equivalent ratios.
For the first question, the students defined ratio as difference. Most
students were not able to give an example other than bigger-smaller and
shorter-taller. In the second problem, the students were not able to
distinguish statements which contain the notion of difference and
comparison. Thus, the students chose a sentence which contains the notion
of difference. Even though the students chose one of statements, they were

67
not able to reason why the statement is comparison. Since the time was
limited to improve the learning material, we use the findings of the pretest
to make an improvement in the second cycle. We will add a problem to
enable students to distinguish between difference and comparison in cycle
two
The students were able to use a given scale line in the third problem.
Instead of stating the length using how many times the scale line fits the
line, the students tend to do a precise measurement using a ruler. However,
the students were not able to work with a scale line with specific
measurement in the fourth problem. They were able to find out how many
times the scale line fits the line. Yet, they were not able to determine the real
distance using the scale line. For the last problem, the students had difficulty
in perceiving the given information as ratio. Even though the students tried
to solve the problem, they used formal method and they were not able to
solve the problem. There was no illustration made by the students to show
how they understood the problem.
2. Lesson 1
In the first lesson, there are two activities. The first activity consists of
two problems and the second activity consists of one problem. For the first
activity, the students worked individually while in the second activity, they
worked in group. The context in the first lesson is studio plan and classroom
plan. The problems in the first lesson aim to enable the students in using the

68
scale line.
Activity 1 (Making and using scale line)
Problem 1a
The aim of the problem is to use the length of a reference to describe
the length of an object. The students had to choose a reference on the plan
to measure the length of coloured walls. In the end, the students were asked
to draw an illustration as a form of comparison between the length of a
reference and an object.
The students chose different references such as a table and a bed as in
figure 5.1.
After choosing a reference, the students used the length of the reference to
determine the length of the coloured walls. The students marked the
coloured walls on the worksheet to know how many times the reference fits
the coloured walls as in figure 5.2.
The students used different tools to measure the reference, for instance
using a ruler, fingers, a pencil, and a paper strip. The students were able to
describe the length of the coloured walls using the length of the reference.
Figure 5.1. Choosing references
Figure 5.2. Using a reference to measure

69
However, they were not able to illustrate the relationship.
Problem 1b
The aim of the problem is to use the scale line to describe the length of
cables. The problem contains an illustration of installed cables in the studio
and a scale line. The students had to measure the length of the cables and to
determine the real length of both cables. In the end, the students were asked
to draw an illustration as a form of comparison between the length of a scale
line and the cables.
In accordance with the HLT, the students were able to use the scale line
to describe and to determine the length of the cables. To find out the length
of the cables, the students used the scale line and marked the cables on the
plan as in figure 5.3. However, the students found difficulty to illustrate the
length comparison between the scale line and the cables. The researcher
helped the students to make an illustration.
Activity 2 (Drawing classroom plan)
The aim of the activity is to enable the students to make and to use a
scale line in a plan. The students were asked to draw a classroom plan using
Figure 5.3. Using a scale line to measure

70
a scale line and to determine the real measurement of the classroom. They
had to choose a large object in the classroom as a reference and to represent
the reference into a scale line.
Both groups chose the width of a door as a reference. However, the two
groups had different estimation of a door’s width and different steps in
drawing the plan. The girls group estimated the width of a door is 0,5 meter
while the boys group’s estimation is 1 meter. The girls group drew the
reference into a scale line and used the scale line to draw a classroom plan.
In reverse, the boys group drew the classroom plan, then drew the scale line.
From this activity, both groups had different real measurement of the
classroom since they used different methods and different scale lines.
From the first lesson, we realize that the students took much time to
read. In the next cycle, we will arrange the sentences on the problems using
points. In addition, there is no problem which points out the difference
between difference and comparison. Therefore, there should be a problem
about difference and comparison on the next cycle.
Based on the analysis of the first lesson, we can conclude that the
students were able to use a scale line to measure other objects on the plan.
The students were also able to describe the length of an object on the plan
by mentioning how many times the scale line fits the object. However,
students needed support from the researcher to make the illustration. We
summarize the conjectures and the students’ actual answer in table 5.2.

71
Table 5.2. The students’ actual answer on lesson 1 cycle 1
Activity Conjectures of
students’ answer
Students’ actual
answer
Making and using a
scale line to
determine the length
of coloured walls
Students are not able
to use the length of a
reference as a scale
line and not able to
illustrate the
relationship of a
reference and a
coloured wall
Students are able to
use the length of a
reference as a scale
line, determine the
length of walls, and
illustrate the
comparison between
the reference and the
coloured wall
The students used
different tools which
have the same length
as the reference to
determine the length
of walls. However,
they were not able to
make an illustration
Using the scale line to
describe the length of
cables and drawing an
illustration as a form
of comparison
between the length of
a scale line and the
cables
Students are not able
to use the scale line
and not able to draw
an illustration to
compare the length of
a scale line and the
cables
The students were
able to use the scale
line but they were not
able to draw an
illustration to compare
the length of a scale
line and the cables
Students are able to
use the scale line and

72
able to draw an
illustration to compare
the length of a scale
line and the cables
Using a scale line to
draw a classroom plan
and to determine the
real dimension of the
classroom
Students are not able
to use a scale line to
draw a classroom plan
and to determine the
real dimension of the
classroom
Students are able to
use a scale line to draw
a classroom plan and
to determine the real
dimension of the
classroom
Rather than making a
scale line first, the
students drawing the
plan, then deciding
what the scale line
will be
3. Lesson 2
In the second lesson, there are two activities. The first activity consists
of two problems while the second activity consists of one problem. The
students worked in groups in the first activity and individually in the second
activity. The context in the second lesson is about map. The problems in the
second lesson aim to enable the students in working with the double scale
line. In the second lesson, Rangga did not come to school. Therefore, the
boys group only consisted of Akbar and Ganang.

73
Activity 1 (Working with information on the map about distances)
Problem a (Matching the map to the double scale line)
The aim of the problem is to use information about the real distance and
the distance on the map. The students were asked to decide which map fits
the given double scale line if the distance between Gresik and Surabaya is
15 km. The researcher handed out the worksheet for lesson 2 and gave the
students some time to read and to discuss.
The students had difficulty in reading and perceiving information,
therefore the researcher narrated the problem. It turned out the students did
not know how to work with double scale line. Before the researcher gave an
example about working with double scale line, the researcher discussed
about the name double scale line with the students. From the discussion, the
students understood that a double scale line is scale lines which have two
measurements, the distance on the map and the real distance.
Later, the researcher gave an example. The researcher gave an
illustration of 3 cm on the map represents 30 km as in figure 5.4. 3 cm and
30 km are aligned because it corresponds to each other.
Figure 5.3. An illustration of ratio 3 cm:30 km
In line with the HLT, the students were able to determine that map B fits the
double scale line. Using the provided double scale line, the students were
able to find the measurement of the half part of the whole line. The students
30 km
3 cm 1,5 cm
15 km
Figure 5.4. An illustration of ratio 3 cm:30 km

74
stated that the distance between two cities in map B is a half of the double
scale line as in figure 5.5.
They found out that the distance on the map is 1,5 cm. It represents 15 km
on the map. These two information becomes powerful tool for the students
to determine which map fits the provided double scale line. The students
understood that the double scale line should be represented precisely.
Otherwise, it may create confusion to people who read the map and the
double scale line.
Problem b (Drawing double scale lines)
The aim of the problem is to enable the students to illustrate the
relationship between the distance on the map and the real distance into a
double scale line. The students were asked to draw the correct double scale
line for the two other maps.
When the students forgot to put information on the double scale line,
the researcher reminded them to write information. Thus, other people will
understand what the double scale line tells about. The students from the boys
group struggled in drawing a proper double scale line as in figure 5.6.
cm
As expected, even though they were able to draw the double scale line, it
Figure 5.6. An inappropriate double scale line
Figure 5.5. The students’ reasoning
Map 2. Because map 2 has a measurement
of 1,5 and map 2 is the middle of 3 cm.

75
does not represent the information given. The students were able to write
information on the double scale line. However, observing the picture, the
length of 4 cm is not twice as long as 2 cm. To support the students, the
researcher reminded them about the previous problem, in which they had to
be precise in drawing double scale line.
The students from the girls group extended their drawing as in figure
5.7. For example for map C, 1 cm represents 15 km. The students drew 4
cm but they struggled to determine the real distance that 4 cm represents.
To help the students, the researcher used fractional form to find the
equivalent ratio. Using the fractional form, the students were able to relate
numbers between ratios and were able to determine the real distance. Since
4 cm is four times 1 cm, therefore the real distance of 15 km should be
multiplied by 4 as well. Hence, the students got 60 km.
Even though some students were able to draw the double scale line and
to extend the double scale line, students in the boys groups did not
understand the relation between numbers on the model. Therefore, the
researcher explained that each pair of ratio is aligned because it represents
the given information.
Activity 2 (Working with the double scale line)
The aim of the problem is to enable the students to use the double scale
Figure 5.7. The students’ double scale line

76
line to determine the real distances. The students did not know what to do.
Thus, the researcher asked them to measure the distance on the map between
two cities on each day.
To guide the students, the researcher told them to start from the given
ratio and to write the given numbers on the lower scale line. The students
must be able to decide which number has a relation to the given ratio on the
lower line. However, the boys group did not have any idea about relation
between numbers. When the researcher asked what the relationship is, they
could not answer. Thus, the researcher used the model on the worksheet to
support the students. If 3 cm on the lower line represents 60 km and it is
divided into three parts, then how many km each part represents. It turned
out the girl groups were able to determine that 1 cm represents 20 km. They
used division to determine the number.
Other than having difficulty in determining relationship between
numbers, the students struggled in working with double scale line. The
students were not familiar with it. Thus, some of them misplaced the real
distance that should be aligned to a corresponding distance on the map as in
figure 5.7.
Figure 5.8. Misplacing 90 km

77
During two lessons, the students were not actively participating on the
learning. There should be reward points to encourage the students to be more
communicative and active.
Based on the analysis of the second lesson, we can conclude that the
students were able to use information such as the distance on the map, the
real distance, and the double scale line. However, the students still struggled
in working with double scale line and understanding relationship between
numbers. We summarize the conjectures and the students’ actual answer in
table 5.3.
Table 5.3. The students’ actual answer on lesson 2 cycle 1
Activity Conjectures of
students’ answer
Students’ actual
answer
Determining a map
which fits the double
scale line and
reasoning
Students have no idea
on working with the
double scale line
The students did not
know how the double
line works
Students are able to
determine which map
fits the double scale
line but they are not
able to reason for
other maps
Students are able to
determine which map
fits the double scale
line and able to reason
for other maps
The students were
able to determine map
B as an appropriate
map for the double
scale line. The

78
students understood
that having
inappropriate double
scale line might create
problem
Making double scale
lines for other maps
Students draw
inappropriate double
scale lines
The students forgot to
write information on
the double scale line.
Some of them also
drew a double scale
line which its length is
not precise.
Students draw
appropriate double
scale lines
The students drew the
double scale line using
precise measurement
and wrote information
on the double scale
line
Using the double
scale line to
determine real
distances
Students do not use
the model to determine
real distances
Students use the model
to determine the
relationship between
numbers to find out
real distances
The students struggled
in using multiplication
to determine
relationship between
numbers to find out
real distances

79
4. Lesson 3
In the third lesson, there are three problems. The students worked in
groups for the first problem. For other problems, they worked individually
but they were allowed to discuss with their friends. The context in the third
lesson is about map and travelling. In this lesson, Rangga joined the
learning.
Problem 1a (Making Double Scale Line)
The aim of the problem is to represent the relationship between the
distance on the map and the real distance into an illustration. The students
were asked to draw the double scale line of a Bali map as a form of
comparison between the real distance and the distance on the map.
The first problem contains information that 4 cm on the map represents
80 km. Using a ruler, the students started to measure and to draw a line with
length of 4 cm. Later, they divided the line into four same parts, in which
each part has the length of 1 cm. In making an illustration, some students
did not put information on the double scale line. To make the double scale
line more meaningful and understandable for the readers, the researcher
reminded the students to put information on the double scale line.
Once the students finished their work, one representative of each group
wrote their work on the board. The students understood that it was
impossible to draw the real 4 cm on the board. Therefore, they divided the
lower scale line into four same parts and assumed that the lengths are the

80
same. Figure 5.9 shows the example of the representatives’ work.
The figure illustrates that both representatives from each group wrote
inappropriate information about the relationship between the distance on the
map and the real distance on the double scale line. Both students divided the
lower scale line into four parts and wrote information on the end of the upper
scale line that it represents 80 km. Both students and their groups could not
reason why they put the information on the first or second small part of the
lower scale line. The researcher decided to clear the students’ confusion.
After drew a double scale line, the researcher asked the students what the
given information is. The researcher told the reason why they need to put
information of 80 km and 4 cm aligned. It is because 4 cm on the map
represents 80 km, therefore the information should be aligned.
To gain information whether the students were able to relate the
distance on the map and the real distance, the researcher proposed another
similar problem, 3 cm on the map represents 60 km. Aisyah volunteer to
make and to explain her illustration. Aisyah drew double scale line and
divided the lower scale line into three parts as shown in figure 5.10.
Figure 5.8.
60 km
3 cm
Figure 5.9. The example of the students’ work
Figure 5.10. An illustration of Aisyah’s double scale line

81
Aisyah aligned 3 cm with 60 km because she understands that 3 cm on the
map represents 60 km. Therefore, the information should represent that
those numbers are corresponding. In addition, Aisyah knew that 1 cm
represents 20 km. Aisyah used division to determine the real distance for 1
cm on the map. It is possible that Aisyah focus on the relationship between
numbers on the double scale line to determine the real distance for given
distance on the map.
Problem 1b (Working with the stretched route)
The aim of the problem is to order the given numbers on the stretched
route. The students were asked to use the stretched route to determine the
real distance of each destination from Denpasar. Given, a list of distances
on the map from Denpasar to several destinations. In addition, the students
had to use the previous ratio information, 4 cm on the map represents 80
km.
The researcher told the students that they were not only dealing with
problems about the distance on the map and the real distance. Moreover, the
students was not working with the double scale line anymore. Therefore, the
researcher told the students to ignore the exact measurement between
numbers. The students had to order the given numbers on the stretched
route.
Once the students ordered the numbers on the stretched route, they
struggled to find the relationship between numbers as in figure 5.11.

82
The researcher helped the students to start from information 4 cm represents
80 km. Since the numbers on the stretched route are well ordered, it enables
the students to see the relationship between different numbers. The students
were able to use division and multiplication in expressing the relationship
between numbers. Moreover, the students multiplied or divided a pair of
ratio to another with a scale factor.
Problem 2
The aim of the problem is to use the stretched route to show the
relationship between numbers. The students were asked to draw an
illustration similar to the stretched route and to use it to determine the fuel
consumption to each destination. Given, 2 litres of gas are used to travel 25
km.
The students struggled in making and completing the illustration. The
researcher and the students had agreed to put the given information on the
lower line while the determined value on the upper line. The struggles
continued when the students had to solve the problem. As expected, the
students forgot how to start. The researcher reminded the students about the
information they have to start solving the problem. Finding relationship
Figure 5.11. An example of the students’ work

83
between numbers somehow difficult for the students. The researcher told
the students to pay attention on the numbers. They had to relate one ratio to
another to determine missing value. In general, the students were able to use
the model to determine the fuel consumption.
Based on the analysis, we can conclude that the students struggled to
represent the relationship between the distance on the map and the real
distance into an appropriate double scale line. Furthermore, the students
were also able to order the numbers on the stretched route and to determine
the relationship between numbers using multiplication and division. We
summarize the conjectures and the students’ actual answer in table 5.4.
Table 5.4. The students’ actual answer on lesson 3 cycle 1
Activity Conjectures of
students’ answer
Students’ actual
answer
Representing the
relationship between
the distance on the
map and the real
distance into an
illustration
Students draw
inappropriate double
scale lines
The students were
able to draw a precise
double number line.
However, they wrote
information
inappropriately
Students draw
appropriate double
scale lines
Ordering the given
numbers on the
Students are not able
to order the given

84
stretched route and
using the model to
determine real
distances
numbers on the
stretched route
Students determine
real distances using
subtraction and
addition
Students determine
real distances using
multiplication and
division
The students were
able to relate numbers
on the stretched route
using multiplication
and division
Drawing a model,
ordering the given
numbers, and using
the model to show the
relationship between
numbers
Students are able to
draw the model but
not able to order the
given numbers
Students are able to
draw the model and
order the numbers.
Students determine the
relationship between
numbers using
addition and
subtraction
Students are able to
draw the model and
order the numbers.
Students determine the
relationship between
numbers using
The students were
able to draw the
model and order the
numbers. They used
multiplication and
division to relate

85
multiplication and
division
numbers
5. Lesson 4
There are three related problems as an exercise in the fourth lesson. The
aim of the problems is to enable students to understand that numbers on the
model must be well ordered. Using the double number line, the students
must be able to express the multiplicative comparison to determine missing
values on other ratios. In the fourth lesson, the students were active and in
turn voluntarily showed how they use the double number line to solve the
problems on the board.
Problem a
Given a Bali map with five different destinations and its distances.
People spend 36 minutes to travel 24 km. The students were asked to use
the double number line to determine how many minutes it takes to travel a
certain distance.
In this problem, the researcher told the students that the illustration on
the first problem is called a double number line. The researcher referred
back to the double scale line. From the discussion, the students understood
that a double number line is lines which consists of two quantities. The given
information placed on the lower line while the determined value placed on
the upper line.

86
Observing the given distances, the students struggled to find the
relationship. The researcher decided to help by relating the given ratio to
fraction and transforming the ratio into fractional form. The researcher
asked the students to simplify the fraction and use it to find the relationship
between numbers on the lower line.
Later, the researcher asked the students whether the paired numbers on
the double number line have the same value. Aisyah argued that all pairs
have the same value but she could not reason. To support the students, the
researcher reminded the students to relate the pairs to fraction and simplify
it. It turned out all pairs have the same form, that is 2
3. Therefore, the students
were sure that all pairs on the model have the same value. In the end, the
students were able to use the model to show the multiplicative comparison
between numbers.
Problem b
Problem b is related to problem a in the use of the distance. Given, every
time the car travels for 45 km, it consumes 3 litres of fuel. The students were
asked to determine the fuel consumption for each destination. The students
transformed the given ratio into fractional form and simplified it. It turned
out that the numbers were difficult and the students spent much time on
calculating the fraction. In general, the students understood that they have
to find the multiplicative comparison between numbers.

87
Problem c
The given information in problem c is derived from the fuel
consumption for every destination in problem b. Given, Pak Nyoman spends
IDR 60.000 for every 5 litres. The students were asked to determine the price
the driver has to pay for each destination. Similar to previous problems, the
students changed the given ratio into fractional form and simplified it to
determine the relationship between given numbers. As expected, once the
students determined the multiplicative comparison between numbers, they
multiplied or divided the pair on the upper line with the scale factor.
There was an interesting answer from Ganang in determining the price
of a certain litre of fuel. The student’s writing on the board reveals that the
student was not truly understand in working with fraction and decimal. As
an illustration of the students’ work on the board, we provide figure 5.12.
Ganang tried to determine the cost for fuel consumption 4/3 litres from 1
litre. Ganang and other students had difficulty in working with fraction. In
this case, Ganang perceived the fraction 4/3 as decimal 4,3. However,
Figure 5.12. The students’ work

88
Ganang multiplied the price of 1 litre fuel by 4 and divided the result by 3.
Ganang also miscalculated the final result and it turned out the cost is larger
than the cost of 5 litres fuel.
Using the double number line, Aisyah did not agree with Ganang’s
answer. She argued that 4/3 litres is located before 4 litres. If the cost of 4
litres fuel, which is greater than 4/3 litres, is only IDR 48.000, it is
impossible for the fuel to cost IDR 516.000.
Based on the analysis, we can conclude that the students understood
that numbers on the model should be well ordered. Therefore, the students
were able to use it to reason that numbers on the left side cannot be greater
than numbers on the right side. The students were also able to express the
notion of multiplicative comparison between numbers and composed unit to
find equivalent ratios on the double number line. We summarize the
conjectures and the students’ actual answer in table 5.5.
Table 5.5. The students’ actual answer on lesson 4 cycle 1
Activity Conjectures of
students’ answer
Students’ actual
answer
Understanding that
numbers on the model
must be well ordered
and expressing
multiplicative
comparison on the
Students do not
understand that
numbers on the model
must be well ordered
The students were
able to arrange
numbers on the lower
line. However, one
student wrote
incorrect determined

89
model number, in which the
number is larger than
the number on its right
side
Students are not able
to express
multiplicative
comparison to
determine equivalent
ratios
(students use
subtraction and
addition to determine
equivalent ratios)
Students are able to
express multiplicative
comparison on the
model to determine
equivalent ratios
The students were
able to determine
equivalent ratios by
relating numbers
using multiplication
and division
6. Lesson 5
In the fifth lesson, the students worked on three problems. The first two
problems are related. The aims of the problems are to formulate the given
information into a mathematical model and to enable students to understand
that equivalent ratios can be determined by using multiplicative comparison.
In this lesson, the students will not deal with map and travelling context.

90
The students will have to solve the problem from different contexts using
the double number line. In turn, the students voluntarily showed how they
solve the problem on the board.
Problem 1a
The context of problem 1 is about buying milk pie, a famous snack from
Bali. One tourist goes to the cashier and the machine shows that he needs to
pay IDR 135.000 for 36 pies. There are four tourists in the shop buy different
numbers of pie. The students were asked to determine the money each
tourist spends to buy pies.
To guide the students, the researcher asked what information they had
and what the question is. The students voluntarily came to the front to show
their work. They did not use fraction anymore as a supportive form to see
the relationship between numbers. As expected, the students directly drew
a line with an arrow and wrote the multiplicative comparison between
numbers to determine the money each tourist should pay for numbers of pie.
Problem 1b
The students had determined the amount of money each tourist should
pay for pies. Using the spent money for each tourist, the students were asked
to determine how many nasi Bali portion each tourist can buy. Given, the
ratio information is a tourist who spent IDR 135.000 to buy pies, he can buy
9 portions of nasi Bali using the same amount of the spent money.
The students started to formulate the given information into a double

91
scale line. In turn, they ordered the amount of money each tourist spent on
the lower double number line. In accordance with the HLT, the students
used multiplicative comparison to express the relationship between
numbers.
Problem 2
The context of problem 2 is about the grass consumption on a farm.
Each day, 8 cows consume 20 sacks of grass. The students were asked to
determine the number of sacks for five different farms.
As in previous problems, the students scanned what information given
and what the question is. They used the information to be formulated onto
the double number line. Sometimes the students mistakenly placed the given
numbers not in the right order as in figure 5.13. Other students commented
that the numbers on the model should be in order. In general, the students
were able to determine the multiplicative comparison between numbers on
the double number line.
Based on the analysis, we can conclude that the students were able to
formulate the given information onto a double number line. In addition, the
students understood that equivalent ratios can be determined by using
Figure 5.13. The student ordered numbers inappropriately
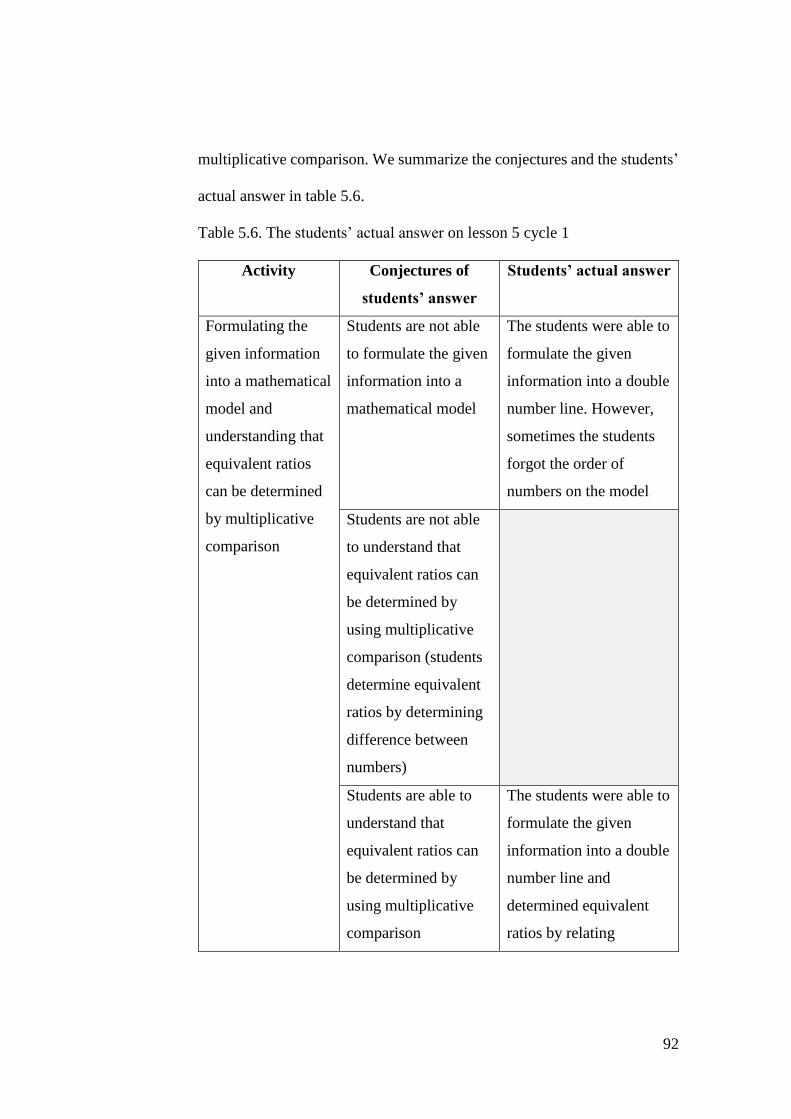
92
multiplicative comparison. We summarize the conjectures and the students’
actual answer in table 5.6.
Table 5.6. The students’ actual answer on lesson 5 cycle 1
Activity Conjectures of
students’ answer
Students’ actual answer
Formulating the
given information
into a mathematical
model and
understanding that
equivalent ratios
can be determined
by multiplicative
comparison
Students are not able
to formulate the given
information into a
mathematical model
The students were able to
formulate the given
information into a double
number line. However,
sometimes the students
forgot the order of
numbers on the model
Students are not able
to understand that
equivalent ratios can
be determined by
using multiplicative
comparison (students
determine equivalent
ratios by determining
difference between
numbers)
Students are able to
understand that
equivalent ratios can
be determined by
using multiplicative
comparison
The students were able to
formulate the given
information into a double
number line and
determined equivalent
ratios by relating

93
numbers using
multiplicative
comparison
7. Posttest
The problems in the posttest are the same as in the pretest. By
conducting a posttest, we want to find out and to clarify the students’
development in the learning. Therefore, we will not use the posttest to be
compared to the pretest.
For the first problem, the students defined ratio as a comparison
between two things. However, not all students were able to give an example
which illustrates ratio. The students who were able to give an example,
mentioned the shopping context which is related to ratio. It is possible that
the students were more familiar with the context and it is easier to recognize
the ratio on the context.
In the second problem, two students thought the statement which
contains the notion of difference as a ratio. The students used the term
“longer” to reason their statement. The other two students thought that the
two statements are the same while one student chose a statement which
contains the notion of comparison as a ratio. The student who chose
comparison statement tried to reason using double number line and the
context of grass consumption to illustrate the multiplicative comparison. In
the learning, we did not provide any problem which asks the students to

94
choose and to reason which statement contains the notion of ratio or
comparison. Therefore, the students were not able to reason which statement
contains the notion of ratio. To emerge the difference between difference
and comparison, we will provide a problem which asks about difference and
comparison in the next cycle.
The students were able to use the scale line in the third problem. They
also marked the picture on the problem to find out how many times the scale
line fits the line. Even though the students were able to use the scale line in
the second problem, some students still did not know on using the scale line
which contains a specific measurement. Two students did not use the scale
line to measure the distance on the picture. Three students used the scale
line to measure the distance on the picture. However, only two students
knew on how to use the scale line to measure and to determine the real
distance.
For the fifth problem, the students made a double number as their tool
to solve the problem. However, two students could not use the model
appropriately. One student did not perceive the given information as a ratio.
He used another information as the ratio. Another student did not how to
start to solve the problem using the double number line. As for three other
students, they were able to use the given ratio and another information to
help them to solve the problem. All of them used multiplicative comparison
to solve the problem.

95
8. Discussion
According to the analysis on the pilot study, the learning materials need
to be improved. Since there are not many difference between HLT and the
actual learning, we preserve the designed HLT. In general, the problems
should be structured into opening, given information, steps, and question.
We provide the general refinement of the learning material and the
additional HLT in table 5.7.
Table 5.7. Refinement of learning material and additional HLT
In Pilot Study Refinement for Teaching Experiment
Lesson 1
1. No exercise which points out the
difference between difference and
comparison.
Lesson 1
Activity 1
1. Problem 1
We provide one problem which
points out the difference between
difference and comparison
regarding to the students’ perception
that difference is comparison.
Dea compares the length of a laptop to the length of a table. She says that the length of the table is two units longer than the length of the laptop.
Question: Does Dea’s statement is a comparison? Give your reason.
HLT for the additional problem:
Students cannot recognize the
notion of difference.
Dea’s statement is ___________________. The reason is:

96
Activity 1
2. Problem 1a
We provided a studio plan
containing different objects as
references and many coloured
walls.
There was no leading sentence
on the answer box.
Students can recognize the
notion of difference but not able
to reason.
Students recognize the notion
of difference and able to reason
why the statement is not
comparison.
2. Problem 2
We revise the coloured walls and
provide three references from the
top view to ease students to
choose a reference.
We provide the answer box with
leading sentences.
a bed
a couch
a cupboard
I use _____________ as a reference. The length of the toilet is ____________. The width of the toilet is ____________. The length of the bedroom is ____________. The width of the bedroom is ____________.

97
3. Problem 1b
We used the studio plan and there is
an L-shape line.
4. Activity 2
There was no instruction to make
the scale line first.
3. Problem 3
We use a blank plan and provide
straight lines to support students in
using the scale line to measure the
walls.
4. Activity 2
We provide an instruction to make
the scale line first, then use the scale
line to draw a classroom plan.
Lesson 2
Activity 2
There was ratio information in the
form of double scale line and
sentence.
Remember: The shortest route between Gresik and Surabaya is 15 km.
The provided double scale line was
long and in colour.
Lesson 2
Activity 2
We omit the sentence which
provides ratio information.
Therefore, the students will focus
on using the double scale line.
We shorten the provided double
scale line and change the colour into
black and grey.
Lesson 3
Problem 1 and problem 2
There were five different destinations
after Denpasar.
Lesson 3
Problem 1 and problem 2
We reduce the number of destinations
into three destinations considering the
time limitation. However, we preserve
the route of the bus.

98
Lesson 4
1. Problem a
There were five different
destinations and five different
distances from Denpasar. It affects
the number of determined values on
the next problems.
2. Problem b
The given ratio is 45 km consumes
3 litres of fuel.
3. Problem c
The given ratio is 5 litres fuel costs
IDR 60.000.
Lesson 4
1. Problem a
We reduce the number of
destinations into three destinations
regarding to the time limitation. It
affects the number of determined
values on the next problems.
2. Problem b
We change the given ratio to easier
number. Thus, the students focus on
using the model not on the
calculation.
When the bus travels to Ubud which is 20 km away from Denpasar, it consumes 2 litres of fuel.
3. Problem c
We change the given ratio to easier
number. Thus, the students focus on
using the model not on the
calculation.
Mr. Nyoman informs all drivers that they have to pay IDR 60.000 for every 10 litres of fuel.

99
Lesson 5
1. Problem 1
There were five tourists
(including one tourist in
information) on the problem.
There was no name for each
tourist.
2. Problem 2
The students need to determine the
grass consumption of five farms.
Lesson 5
1. Problem 1
We reduce the number of tourists
into four tourists (including one
tourist in information).
We give name for each tourist to
avoid confusion.
2. Problem 2
We reduce the number of farms into
three farms.
D. Analysis of the Teaching Experiment
The teaching experiment was conducted in class 5C of SDIT At Taqwa.
One teacher and 34 students were involved in the teaching experiment. The
regular teacher named Ustadzah Kartika, who her background is mathematics
education, played the role as the teacher. The teacher carried out the improved
HLT from the pilot study. For the teaching experiment, the teacher
recommended four students named Diva, Ocha, Rizqi, and Sisi as the focus
group students. According to the teacher, these students were able to
communicate and their mathematics ability is on medium level. The
mathematical activities in the teaching experiment are provided in the
worksheets on appendix D.
1. Pretest
We conducted pretest before the teaching experiment was implemented.
The aim of conducting pretest is to find out the students’ prior knowledge

100
about ratio. The test contains five questions: (1) illustrating ratio by using
sentences, figures, or symbols, (2) choosing a sentence which contains the
notion of comparison, (3) working with a scale line, (4) working with a scale
line with specific measurement, and (5) determining equivalent ratios.
There were only four students who answered the first problem. They
mentioned words “difference”, “comparing different things”, and “longer
than” to express ratio. As for the second problem, all students chose one of
statements randomly. In addition, they were not able to reason why a
statement has the notion of ratio. From 28 students who answered the third
problem, only five students used the scale line and marked the figure on the
problem to determine how many times the scale line fits the figure. The
others only wrote numbers such as 4 cm and 6 cm without using the scale
line to measure the figure.
None of students were able to determine real distances on the fourth
problem. There were only five students who used the scale line to measure
and to mark the route on the problem. For the fifth problem, none of students
drew an illustration and most of them did not perceived the given
information as a ratio. Even though 27 students answered the problem, only
one student was able to solve the problem correctly using formal method.
The other 26 students added the given information or multiplied the given
information with a certain number.

101
2. Lesson 1
There are two activities in the first lesson. The context is about a room
plan. The first activity consists of three problems while the second activity
consists of one problem. The general aim of the first lesson is to enable
students to use the scale line. Students worked and discussed the problems
in groups.
Activity 1
Problem 1
The aim of the problem is to enable students to distinguish difference
and comparison. A girl named Dea, compares the length of a laptop to the
length of a table. She says that the length of a table is two units longer than
the length of a laptop. The students were asked to decide whether Dea’s
statement is a comparison or not. In addition, they had to reason about their
answer.
The teacher gave students time to discuss the problem in groups. The
focus group students started to discuss the problem. Transcript 5.1 illustrates
their discussion.
Transcript 5.1
1
2
3
4
5
Ocha
Diva
Ocha
: What do you think? (talking to her group) I think the
sentences “two units” is… This is laptop (expressing two
laptops using her hands)
: Yea, two (laptops).
: It means 1:2.
The short transcript informs us that the students perceived “two units longer
than” as ratio. In our interpretation, the students had no idea that difference

102
and comparison are different. Rather than perceiving “two units longer than”
as difference, the students said that the ratio between the length of the table
and the length of the laptop is 1:2.
When the teacher asked the class, they thought that the statement on the
problem is comparison. The reason is because it compares two objects.
Similar to the focus group students, other students did not pay attention on
the word “longer than”. They did not realize that “longer than” contains the
notion of difference. Therefore, the teacher supported students by giving an
example.
Given, a laptop with the length of 30 cm and a table with the length of
90 cm. The teacher asked students to choose one of two statements which
has the notion of comparison. The first sentence states “the length of a table
is 60 cm longer than the length of a laptop”. The second statement is “the
length of a table is three times the length of a laptop”. Students knew that
the length difference between two object is 60 cm. They also understood
that difference is related to subtraction as in figure 5.14. For the second
statement, students were able to state the length comparison between a
laptop and a table by using fractional form.
Figure 5.14. The teacher writings about difference and comparison

103
However, when the teacher asked students which statement is
comparison, none of them answered. The teacher reminded students about
stating comparison using fractional form but students still did not answer.
Even though there was an example, it seems not all students had understood
that the statement is not about comparison. The teacher continued to
problem 2.
Problem 2
The aim of the problem is to use the length of a reference to describe
the length coloured walls on a plan. There are three references to measure
the coloured walls on a plan. The students were asked to choose one of
references as a ruler to determine the length of the coloured walls.
Students were eager to have an exact measurement of the given
references and the coloured walls. Since the problem does not ask for an
exact measurement, the teacher forbade students to use a ruler to measure.
Later, the teacher asked what kind of tools they can use to measure if there
is no ruler. However, none of students answered the question. To help, the
teacher demonstrated to measure the length of a table using the length of a
pencil case and a pencil. Next, the teacher instructed students to discuss
problem 2 with their groups. From the demonstration, students had an idea
to measure the length of the reference using fingers, an ice stick and a paper
strip.
The focus group students used the cover of an eraser to measure the bed

104
as the reference, and used it to measure the coloured walls. Interestingly,
since the picture of the bed have a width and a length, the students used both
dimensions to measure. When the students measured the horizontal red and
horizontal blue line, they used the width of the bed. However, when the
students measured the vertical red and vertical blue line, they used the length
of the bed. Figure 5.15 illustrates how the students measured the coloured
walls.
(a) (b)
The students also had a discussion about estimating the part of the lines
which is less than one unit of reference. Transcript 5.2 illustrates the
discussion between the students in the focus group.
Transcript 5.2
1
2
3
4
5
6
7
8
9
10
11
12
13
Ocha
Diva
Ocha
Ocha
…
Ocha
Rizqi
Diva
Rizqi
Ocha
Diva
: If we put it like this (putting the eraser on the bed’s width),
we can measure it can’t we? (the cover of the eraser fits the
width of the bed)
: Oh yeah, we can.
: (putting the eraser on the coloured walls. Marking the red
line to find out how many times the reference fits the red line)
: So, it is 2 and a half.
…
: Is it 2 and a half?
: Wait. (observing the reference on the red line) No, it is not.
: One over three, I think.
: Yea, over three.
: So, two and?
: Two and one over three.
From the transcript we found out that the students used fraction to express
Figure 5.15. Using the width and the length to measure the coloured lines

105
the part which is less or more than one unit of reference. Students in other
groups also used fraction to express the measurement of the coloured walls.
Moreover, students struggled in estimating the part, whether it is closer to a
half or a third. In general, students were able to use the reference to measure
the coloured walls and they were also able to describe the length of the
coloured walls using the length of the reference.
Problem 3
The aim of the problem is to use the scale line to describe the length of
cables. The problem contains an illustration of installed cables in the studio
and a scale line. The students had to measure the length of the cables and to
determine the real length of both cables. In the end, the students were asked
to draw an illustration as a form of comparison between the length of a scale
line and the cables.
Before students started to work on the problem, the teacher gave an
example. She demonstrated to use the scale line to measure the cable on the
plan and drew an illustration as a form of comparison. The focus group
students used an ice stick to determine how long the scale line is (see figure
5.16). As expected, they used it to determine how many times the scale line
fits the orange and green lines.
Figure 5.16. The students used an ice stick to measure the scale line and
the other lines

106
Even though the teacher had given students an example of making the
illustration, the students still struggled. Ocha used the length of the scale
line on the stick to draw the illustration. She drew the scale line on the upper
side and the green line on the lower side as in figure 5.17. In general,
students were able to use the scale line to determine the real length of two
cables. Moreover, students were able to illustrate the comparison between
the scale line and the cables.
Activity 2
The aim of the activity is to enable students to make and to use a scale
line in a plan. Students were asked to draw a classroom plan using a scale
line and to determine the real measurement of the classroom. They had to
choose a large object in the classroom as a reference and to represent the
reference into a scale line.
As expected, the focus group students drew the plan first rather than
drew the scale line. The students did not read the steps on making the plan
on the worksheet, they only read the instruction. Even though the researcher
asked them to read the steps, they did not revise their drawing. It happens in
Below is my drawing. The length of the orange line is 2x the blue line. Thus, the real length of the orange cable is 2m.
Figure 5.17. The student’s drawing in comparing a scale line to the orange
line

107
other groups as well. When students drew the plan first rather than drew the
scale line, they will get confuse especially when they have to determine the
real measurement of the plan. Moreover, the estimation of the real
dimension of the classroom would be too far. Figure 5.18 shows the drawing
of the students in focus group.
Students did not get to discuss the second activity in a big discussion
because the limited time. Even though students were able to use a scale line
to measure, they struggled in drawing and using a scale line to draw a
classroom plan. In addition, they did not realize the different result from
making the plan first and in deciding the scale line first.
Based on the analysis, we can conclude that students were able to use a
reference as a scale line to measure other objects. In addition, students were
able to describe the length of an object using the length of a reference in
multiplicative comparison. Students struggled in illustrating the length
comparison between a scale line and an object on the plan.
We summarize the conjectures and the students’ actual answer in table
Figure 5.18. The students drew the plan first

108
5.8.
Table 5.8. The students’ actual answer on lesson 1 cycle 2
Activity Conjectures of
students’ answer
Students’ actual
answer
Distinguishing
difference and
comparison
Students cannot
recognize the notion of
difference
Students did not
realize the word
“longer than” as
difference
Students can recognize
the notion of
difference but not able
to reason
Students recognize the
notion of difference
and able to reason why
the statement is not
comparison
Making and using a
scale line to determine
the length of walls
Students are not able
to use the length of a
reference as a scale
line
Students are able to
use the length of a
reference as a scale
line and determine the
length of walls
Students used
different tools which
have the same length
as the reference to
determine the length
of walls
Using the scale line to Students are not able Students were able to

109
describe the length of
cables and drawing an
illustration as a form
of comparison
between the length of
a scale line and the
cables
to use the scale line
and not able to draw
an illustration to
compare the length of
a scale line and the
cables
use the scale line but
some of them were
not able to draw an
illustration to
compare the length of
a scale line and the
cables
Students are able to
use the scale line and
able to draw an
illustration to compare
the length of a scale
line and the cables
Some students were
able to draw an
illustration to
compare the length of
a scale line and the
cables
Using a scale line to
draw a classroom plan
and to determine the
real dimension of the
classroom
Students are not able
to use a scale line to
draw a classroom plan
and to determine the
real dimension of the
classroom
Students are able to
use a scale line to
draw a classroom plan
and to determine the
real dimension of the
classroom
Rather than making a
scale line first, the
students drawing the
plan, then deciding
what the scale line
will be
3. Lesson 2
There are two activities in the second lesson. The first activity consists
of two problems and the second activity consists of one problem. The

110
context in this lesson is about map. Students worked in groups for the first
activity. For the second activity, they worked individually but they were
allowed to discuss the problem with their friends. In general, the activities
and problems in the second lesson aim to enable students in working with
double scale line.
Activity 1
Problem 1
The aim of the problem is to use information about the real distance and
the distance on the map. Students were asked to decide which map fits the
provided double scale line if the distance between Gresik and Surabaya is
15 km. Before students started to work, the teacher informed students that
the use of scale is to shrink the drawing of the earth. In introducing the
double scale line, the teacher told students that the scale has two
measurements, the measurement on the map and the real measurement. To
continue, the teacher asked students to find out whether the distances
between Gresik and Surabaya on all provided maps are the same. Figure
5.19 and transcript 5.3 illustrates students’ struggle in determining which
map fits the double scale line.
Figure 5.19. Students comparing the double scale line and the distance on
maps

111
Transcript 5.3
1
2
3
4
5
6
7
8
9
10
11
12
13
14
15
16
17
18
19
20
21
22
Diva
Ocha
Ocha
Rizqi
Ocha
Diva
Ocha
Researcher
Ocha
Diva
Ocha
Diva
Researcher
: (helping Ocha measured the upper scale line) 1,5.
: (back and forth measuring the upper scale line and the
distance between Gresik and Surabaya on map B)
: (measuring the distance between Gresik and Surabaya
on map C)
: That’s 1. (looking at the measurement on map C)
: (measuring the distance between Gresik and Surabaya
on map C)
: Where is 15 km exactly (on the double scale line)? B
is closer. (the distance on the map B is almost the same
as the upper scale line when it is 15 km)
: It seems the answer is B.
: Why B?
: Because…
: There is information 15 km.
: Because there is information that the distance between
Gresik and Surabaya is 15 km.
: (measuring the upper scale line and the distance
between Gresik and Surabaya on map B)
: Don’t forget to write the reason. And what happen if
map A and map C use the provided scale line? Discuss
it together.
From the transcript we knew how the students struggled to determine
which map fits the provided double scale line. The students compared the
double scale line to the distance between Gresik and Surabaya on all maps.
They thought the distance between Gresik and Surabaya on map B is almost
the same as the length of 15 km on the double scale line. Even though the
students were able to determine which map fits the double scale line, they
did not have a further discussion about what will happen if other maps use
the provided double scale line.
Once students had finished the group discussion, the teacher explained
to students on how to determine which map fits the double scale line. She

112
divided the lower scale line into six same parts. Students were asked to
determine the position of 1 cm and 2 cm if there are six smaller parts and
the total length is 3 cm. One student showed the position of 1 cm and 2 cm
on the board. Later, the teacher asked students the sum of three smaller parts
on the lower scale line. Some students were able to answer her question but
some were not. To help students, the teacher explained again about dividing
the scale line into several same parts as in figure 5.20.
Figure 5.18. The teacher divided the lower scale line and asked a student
to write information for every 1 cm
There should have been discussion about what happen if other maps
used the provided double scale line. However, there was no further class
discussion. It affects students’ answer on the worksheet. They only
answered which map fits the double scale line without knowing the impact
of using inappropriate double scale line on a map.
Problem 2
The aim of the problem is to enable students to illustrate the relationship
between distance on the map and real distance into a double scale line. The
teacher instructed students to draw the double scale line for map A and map
C. Some students were able to draw the double number line for other maps.
Figure 5.20. The teacher divided the lower scale line and asked a student
to write information for every 1 cm

113
However, other students struggled in drawing the double scale line.
Especially in dividing the double scale line. Transcript 5.4 illustrates the
conversation between the students about dividing the double scale line for
map A. Figure 5.21 shows the student’s double scale line for map A.
Figure 5.19. Tegar’s double scale line for map A
Transcript 5.4
1
2
3
4
5
6
7
8
9
10
11
12
13
Tegar
Dinda and Danis
Tegar
…
Tegar
Tegar
: (talking to Dinda) Two parts. Each part is 1 cm.
And the middle (of 1 cm) is a half.
: (inaudible) (Dinda told Danis Tegar’s
explanation)
: (adding his explanation) 2 cm. Because 2 cm
equals to 15 km.
…
: (explaining to Dinda) You divide it into four.
This is one, a half, and two. We know the real
distance is 15 km. So, what is 2 cm?
: So, it represents 15 km. If we divide it (the lower
line), 1 cm represents 7,5 km. What is the result
of 7,5 + 7,5? 15 isn’t it? So, here is 15 km.
(pointing the end of upper scale line)
From figure 5.21 and transcript 5.4, we understood that Tegar divided
2 cm into four parts. Tegar could be following how the teacher divided the
lower line for each part on the previous problem. Therefore, the length of
each part on the lower line is 0,5 cm. Since 2 cm represents 15 km, he knew
1 cm represents 7,5. It is possible that Tegar divided 15 km and 2 cm by 2.
When students were discussing with their groups, the teacher walked
Figure 5.21. Tegar’s double scale line for map A

114
around the class to find out students’ struggles. The teacher had discussion
with two students who also struggled in dividing the lower line. Realized
that not only the two students who struggled in dividing the lower line, the
teacher told the class to determine the real distance for each cm. Students
were free to divide the lower line into several parts. However, the teacher
did not continue the class discussion. She gave students more time to finish
the double scale line and continued to the next activity.
Activity 2
The aim of the activity is to enable students to use the double scale line
to determine real distances. The teacher narrated the problem and gave
students instruction to use the double scale line on the map and to measure
the travelled distance for each day. Students wrote every cm on the double
scale line. Some of them also tried to determine the distance for 0,5 cm.
Transcript 5.5 illustrates how Diva determine the real distance for travelling
in the first day and figure 5.22 shows Diva’s work on the double scale line.
Figure 5.20. Information on Diva’s double scale line
Transcript 5.5
1
2
3
4
5
6
7
Researcher
Diva
Researcher
Diva
Researcher
Diva
Researcher
: Where is 1 cm on this line?
: Here. (pointing at 1 cm)
: So, how many (km)?
: 20.
: How do you get 20?
: From… I don’t know.
: How long is it? (pointing on the middle part of 1 cm
Figure 5.22. Information on Diva’s double scale line

115
8
9
10
11
12
13
Diva
Researcher
Diva
Researcher
Diva
on the upper line)
: 10.
: How do you know it is 10?
: Because the difference is 10. Uhm, 10, 10, 10 km.
: What do you mean?
: From 1 cm to another 1 cm is 10.
If we observe Diva’s writing on the double scale line, he marked the half of
1 cm. Moreover, Diva said that he determined the difference for a certain
measurement although he mistakenly said from 1 cm to another is 10 km. It
should be from 0,5 cm to another is 10 km. From the transcript and the
figure, we interpret that Diva used repeated addition to determine the real
distance. Diva’s method will not be efficient if the difference between
numbers is large. By finding difference between numbers, he might answer
the problem incorrectly if he asked to determine only one travelled distance.
In addition, Diva did not pay attention on putting information. He wrote the
distance on the map on the upper line while the real distance on the lower
line.
The teacher walked around the class and talked to some groups.
However, the class did not have a discussion for this problem. If there was
a class discussion, the teacher could point out students’ struggles, for
example in determining the relationship between given numbers and writing
appropriate information on the double scale line. Therefore, students can
discuss and support each other to learn about working with the double scale
line.

116
Based on the analysis, we can conclude that students were struggling in
working with double scale line, especially in illustrating the relationship
between the real distance and the distance on the map to a double scale line.
Students struggled on dividing the double scale line into several same parts.
Instead of determining the relationship between numbers, students used
difference between numbers and found a pattern in working with the double
scale line. The pattern is similar to repeated addition.
We summarize the conjectures and the students’ actual answer in table
5.9.
Table 5.9. The students’ actual answer on lesson 2 cycle 2
Activity Conjectures of
students’ answer
Students’ actual
answer
Determining a map
which fits the double
scale line and
reasoning
Students have no idea
on working with the
double scale line
Students are able to
determine which map
fits the double scale
line but they are not
able to reason for
other maps
Students did not give
reason what will
happen if other maps
use the provided
double scale line
Students are able to
determine which map
fits the double scale
line and able to reason
for other maps

117
Making double scale
lines for other maps
Students draw
inappropriate double
scale lines
Some students forgot
to write information
on the double scale
line and did not draw
a precise double scale
line
Students draw
appropriate double
scale lines
Students drew the
double scale line
using precise
measurement and
wrote information on
the double scale line
Using the double
scale line to
determine real
distances
Students do not use
the model to determine
real distances
Students use the model
to determine the
relationship between
numbers to find out
real distances
Students used the
model by dividing the
double scale line for
every 0,5 cm. Most
students used division
to divide the lower
line and addition to
determine the real
distance for every 0,5
cm
4. Lesson 3
There are three problems in the third lesson. The context of the third
lesson is about map and travelling. In this lesson, students will not only work

118
with problems which ask about distances. Therefore, students should have
ignored the exact measurement between numbers as long as they were able
to order given numbers on the model. Students worked individually but they
were allowed to discuss problems with their friends.
Problem 1a
The aim of the problem is to represent the relationship between the
distance on the map and the real distance into an illustration. The students
were asked to draw the double scale line of a Bali map as a form of
comparison between the real distance and the distance on the map. Before
students worked on the problem, the teacher asked students what they have
learned during two lessons. Students answered they learned about
comparison and double scale line. The teacher proceed to narrate the first
problem and asked students to draw the double scale line for a map, given 4
cm on the map represents 80 km.
While walked around the class, the teacher was busy arranging the
students who did not behave well to switch seats. The teacher also reminded
students to write information on the double scale line. Students who had
finished their work approached the teacher to ask her to confirm their work.
In line with the HLT, some students did not use a ruler to measure and
to draw the double scale line. The researcher asked students whether their
drawing represents the information and students changed their drawing.
Transcript 5.6 illustrates conversation between students in drawing the

119
double scale line. We provide figure 5.23 as an illustration of the student in
drawing the double scale line. Her drawing was incorrect because the
measurement is not exact and precise.
Transcript 5.6
1
2
3
4
5
6
7
8
9
10
11
12
13
14
Researcher
Sisi
Researcher
Ocha
Researcher
Ocha
Sisi
Ocha
: How is it Sisi? Where is 4 cm, Sisi?
: (pointing the lower scale line).
: Where is 4 cm? Measure it using a ruler.
: Is it correct? Is it 4 cm?
: Please help Sisi, Ocha.
: Is it 4 cm? (measuring the line using a ruler)
: Yes 4 cm.
: Wrong. (the line is not precisely 4 cm) 4 cm means…
Mr. Nyoman knows that 4 cm on the map shows 80…
4 cm shows 80 km. It means… It has to be… (showing
the measurement using a ruler) It supposed to be from
here (0 cm) to here (the middle of the double scale line)
is 4 cm. It has to be on the same vertical line, 80. 80 is
4 cm.
From the transcript, we may interpret that Ocha understood the
measurement on a double scale line should be precise. Ocha kept asking Sisi
whether the double scale line has a precise measurement. Moreover, Ocha
knew that she had to align 4 cm and 80 km because 4 cm represents 80 km.
It is possible that Ocha perceived the given information as a composed unit.
For Sisi, it seems she still struggled in drawing the double scale line. She
knew that 4 cm is on the lower line but she did not know where exactly 4
cm is. In the end, Sisi was able to draw a precise double scale line for the
0 cm
0 km 80 km 160 km
Figure 5.23. An illustration of Sisi’s drawing

120
map as shown in figure 5.24.
Figure 5.22. Sisi’s double scale line becomes more precise compared to
the previous
Even though some students were able to draw the double scale line, not
all of them understood the importance of precise measurement on it. Some
students did not measure the line precisely in drawing the double scale line.
They got confuse in writing information about the relationship between the
distance on the map and the real distance on the double scale line.
Furthermore, instead of asking students how they drew the double scale line,
the teacher asked students whether they were able to draw the double scale
line and whether they had finished drawing it. It would be a good
opportunity for the teacher and students if they discussed how to draw a
double scale line by pointing out the ratio information. Moreover, a
discussion about the importance of being precise in drawing a double scale
line is also needed. However, there was no discussion for the problem and
the teacher proceeded to the next problem.
Problem 1b
The aim of the problem is to order the given numbers on the stretched
route. The students were asked to use the stretched route to determine the
real distance of each destination from Denpasar. Before the teacher read the
problem for students, she was busy in disciplining and asking students to be
Figure 5.24. Sisi’s double scale line becomes more precise compared to
the previous

121
quiet. She also asked students who did not pay attention on the lesson to
switch seats.
Once the teacher had finished reading the problem and steps for
students, she asked them to solve and discuss the problem with their friends.
Students struggled in placing numbers on the stretched route, especially in
dividing the route into several parts. Since the teacher did not inform
students in the beginning that they were allowed to not have a precise
measurement between numbers, students thought that they had to use the
model as they use the double scale line. To help students, the teacher decided
to tell the class that the model is similar to a number line in which the
numbers must be well ordered.
Students had the same method in ordering the given numbers. They
measured the stretched route and put information for every cm rather than
writing only the given numbers. Figure 5.25 illustrates students’ writing in
completing the stretched route and determining the real distances.
Figure 5.23. Students determined the real distance for every 0,5 cm
In our interpretation, students determined the real distances by doing
repeated addition. There is a pattern between numbers, on the lower line the
Figure 5.25. Students determined the real distance for every 0,5 cm

122
difference is 0,5 cm and on the upper line the difference is 10 km. Students
add 0,5 cm on the lower line and add 10 km on the upper line. Students’
method is not efficient because they were determining numbers which are
not asked.
Students also used their double scale line on the previous problem to
help them in determining every 1 cm to solve the problem. Transcript 5.7
illustrates the discussion between Diva and other students about determining
the real distance using the previous problem and repeated addition for the
distance on map 2,5 cm.
Transcript 5.7
1
2
3
4
5
6
7
8
9
10
Diva
Rafi
Diva
Rafi
Diva
Rafi
Diva
Tegar
: See the previous problem. (referring to the double scale line)
: 35, 35. (guessing the answer)
: 2,5 is here isn’t it? (showing where 2,5 is using the double
scale line)
: 45, 45. (guessing)
: Why is it 45? You add 5 to the ratio, how many is it?
: 50.
: So that’s it.
: It’s 0,5 (cm). For 0,5, you add 10 (km). (writing on the
stretched route)
As students worked on the problem, the teacher walked around the class
and had a discussion with a student about dividing the stretched route. The
student thought the stretched route a as a double scale line and the student
was confused in dividing the route. Transcript 5.8 illustrates the
conversation between the teacher and the student.
Transcript 5.8
1
2
3
Teacher
: The important thing in dividing is it has to be equal. If you
divide, 10 in here, then where is 5? Does 5 in here have the
same spaces? Are these two parts equal?
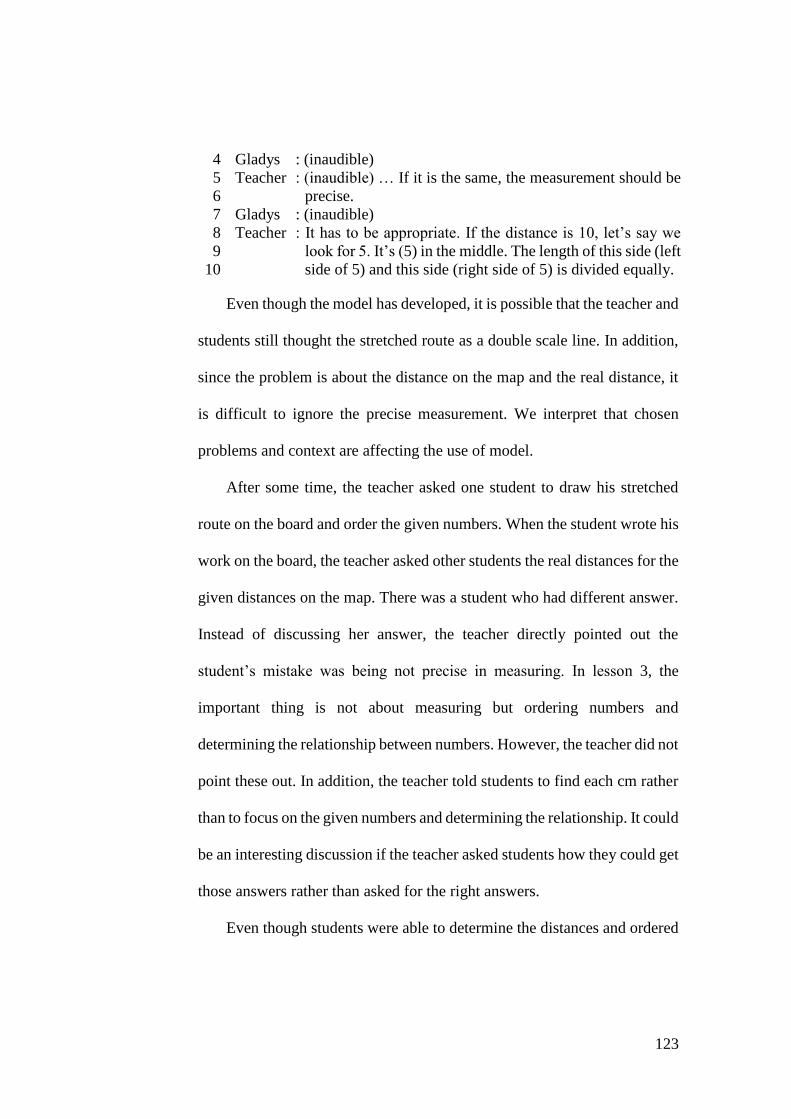
123
4
5
6
7
8
9
10
Gladys
Teacher
Gladys
Teacher
: (inaudible)
: (inaudible) … If it is the same, the measurement should be
precise.
: (inaudible)
: It has to be appropriate. If the distance is 10, let’s say we
look for 5. It’s (5) in the middle. The length of this side (left
side of 5) and this side (right side of 5) is divided equally.
Even though the model has developed, it is possible that the teacher and
students still thought the stretched route as a double scale line. In addition,
since the problem is about the distance on the map and the real distance, it
is difficult to ignore the precise measurement. We interpret that chosen
problems and context are affecting the use of model.
After some time, the teacher asked one student to draw his stretched
route on the board and order the given numbers. When the student wrote his
work on the board, the teacher asked other students the real distances for the
given distances on the map. There was a student who had different answer.
Instead of discussing her answer, the teacher directly pointed out the
student’s mistake was being not precise in measuring. In lesson 3, the
important thing is not about measuring but ordering numbers and
determining the relationship between numbers. However, the teacher did not
point these out. In addition, the teacher told students to find each cm rather
than to focus on the given numbers and determining the relationship. It could
be an interesting discussion if the teacher asked students how they could get
those answers rather than asked for the right answers.
Even though students were able to determine the distances and ordered

124
the numbers on the stretched route, students still depended on non-given
numbers to order. The model has developed but students’ ability in ordering
given numbers did not go as expected because they still thought the model
as a double scale line. In the end, the work of the student on the board was
not being discussed in depth. The teacher and the class only checked
whether the answer is correct. Later, the teacher proceed to the next
problem.
Problem 2
The aim of the problem is to use the stretched route to show the
relationship between numbers. The teacher read the problem for students
and they were asked to draw an illustration similar to the stretched route and
to use it to determine the fuel consumption to each destination. Given, 2
litres of gas are used to travel 25 km. Using the stretched route on the board
from the previous problem, the teacher asked one student to show where 25
km is. The teacher allowed students to join the stretched route on previous
problem to this problem. In formal, the model is triple number line. In
addition, since the determined distances on the previous problem become
the given numbers on this problem, the teacher instructed students to have
the same measurement as the previous problem and to divide the lines on
the model precisely.
As in the previous problem, the students in the focus group directly
drew a line and marked the line for every 1 cm. However, there was an
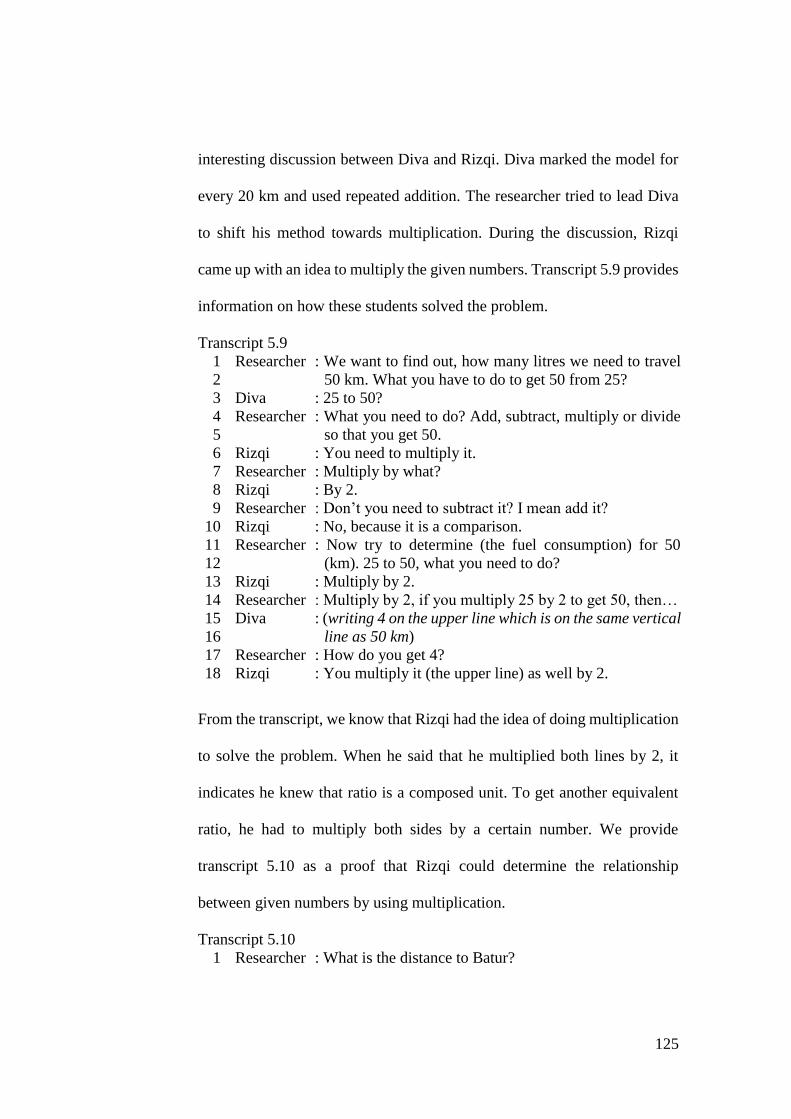
125
interesting discussion between Diva and Rizqi. Diva marked the model for
every 20 km and used repeated addition. The researcher tried to lead Diva
to shift his method towards multiplication. During the discussion, Rizqi
came up with an idea to multiply the given numbers. Transcript 5.9 provides
information on how these students solved the problem.
Transcript 5.9
1
2
3
4
5
6
7
8
9
10
11
12
13
14
15
16
17
18
Researcher
Diva
Researcher
Rizqi
Researcher
Rizqi
Researcher
Rizqi
Researcher
Rizqi
Researcher
Diva
Researcher
Rizqi
: We want to find out, how many litres we need to travel
50 km. What you have to do to get 50 from 25?
: 25 to 50?
: What you need to do? Add, subtract, multiply or divide
so that you get 50.
: You need to multiply it.
: Multiply by what?
: By 2.
: Don’t you need to subtract it? I mean add it?
: No, because it is a comparison.
: Now try to determine (the fuel consumption) for 50
(km). 25 to 50, what you need to do?
: Multiply by 2.
: Multiply by 2, if you multiply 25 by 2 to get 50, then…
: (writing 4 on the upper line which is on the same vertical
line as 50 km)
: How do you get 4?
: You multiply it (the upper line) as well by 2.
From the transcript, we know that Rizqi had the idea of doing multiplication
to solve the problem. When he said that he multiplied both lines by 2, it
indicates he knew that ratio is a composed unit. To get another equivalent
ratio, he had to multiply both sides by a certain number. We provide
transcript 5.10 as a proof that Rizqi could determine the relationship
between given numbers by using multiplication.
Transcript 5.10
1 Researcher : What is the distance to Batur?

126
2
3
4
5
6
7
8
9
10
11
12
13
14
15
16
17
Rizqi
Researcher
Rizqi
Researcher
Rizqi
Diva
Rizqi
Diva
Researcher
Rizqi
Diva
Rizqi
: To Batur is 100 (km).
: Where is 100 (on the model)?
: Use this (multiplication), it is simpler.
: How is it simple?
: (talking to Diva) 100 is what times what? Eh, 25 is what
times what to get 100?
: 4. (showing 4 using his fingers)
: Yes, times 4. You also multiply 2 by 4. (2 in the upper
line)
: 2 times 4 is 8.
: Is there another way to get 100? We have determine 50,
can we use it?
: We can.
: 25 times 2.
: Hey! 50 times 2 is 100. So, we need to multiply the upper
by 2. That’s another way.
Rizqi kept on saying that he had to multiply lower and upper line with the
same number. In addition, Rizqi was able to use determined value to relate
the given numbers using multiplication. In this case, Rizqi’s method is more
sophisticated than Diva’s method, in which Diva had to determine the fuel
consumption for every 20 km.
The researched moved to another group to find out whether students
also still used repeated addition. The researcher interviewed one student
named Danis. Danis has the same idea as Rizqi, using multiplication. Even
though Danis and Rizqi shared the same idea, they drew different
representation. Figure 5.26 shows illustrations for both students.
(a) (b)
Figure 5.24. Rizqi’s (a) and Danis’ (b) illustration Figure 5.26. Rizqi’s (a) and Danis’ (b) illustration
127
From the illustrations, Rizqi did not directly order the given numbers on the
line. He ordered every 20 and inserted the given numbers in between.
However, Danis directly ordered the given numbers on the line without
using help of other numbers. In this case, we perceive that Danis’ illustration
is more sophisticated and suit the model.
In general, most students still perceived the stretched route as a double
scale line. It influences students to draw and to mark for every 1 cm rather
than directly order the given numbers on the line. Even though most students
used repeated addition, there were students who shift their method by using
multiplication. The different methods could be pointed out in the class
discussion. However, there was no class discussion for the problem. To
close the lesson, the teacher asked students to hand in their worksheet.
Based on the analysis, we can conclude that students were able to order
the given numbers on the model. However, students had not ignore the exact
measurement between numbers. In other words, students used the more
formal model as a double scale line. Even though at first they used repeated
addition to determine relationship between numbers, some students had
shifted their method by perceiving the relationship as multiplicative
comparison.
We summarize the conjectures and the students’ actual answer in table
5.10.

128
Table 5.10. The students’ actual answer on lesson 3 cycle 2
Activity Conjectures of
students’ answer
Students’ actual
answer
Representing the
relationship between
the distance on the
map and the real
distance into an
illustration
Students draw
inappropriate double
scale lines
Some students did not
write information on
the double scale line.
Some others did not
draw a precise double
scale line
Students draw
appropriate double
scale lines
Some students drew a
precise double scale
line
Ordering the given
numbers on the
stretched route and
using the model to
determine real
distances
Students are not able
to order the given
numbers on the
stretched route
Students determine
real distances using
subtraction and
addition
Some students still
thought the model as a
double scale line.
They determined real
distances for every 0,5
cm
Students determine
real distances using
multiplication and
division
Drawing a model,
ordering the given
numbers, and using
Students are able to
draw the model but
not able to order the

129
the model to show the
relationship between
numbers
given numbers
Students are able to
draw the model and
order the numbers.
Students determine the
relationship between
numbers using
addition and
subtraction
Some students drew
the model as in double
scale line. Some
students used addition
to determine fuel
consumption for every
20 km
Students are able to
draw the model and
order the numbers.
Students determine the
relationship between
numbers using
multiplication and
division
Some students were
able to determine
relationship between
numbers using
multiplication
5. Lesson 4
There are three problems for this lesson. These three problems are
related, the determined value on the problem becomes the given information
for the next problem. The context of problems is travelling. The general aim
of problems is to enable students to understand that numbers on the model
must be well ordered. Moreover, students must be able to express the
multiplicative comparison to determine equivalent ratios.
Problem a
Before the teacher read the problem for students, she asked what

130
students know about double scale line. However, the discussion did not go
well as most students did not answer the question. The teacher proceed to
read the problem and drew a double number line on the board. As an
example for the next problems, the teacher showed students how to use the
double number line. The teacher involved students to compare and to
arrange given numbers on the double number line. Transcript 5.11 illustrates
their discussion.
Transcript 5.11
1
2
3
4
5
6
7
8
9
10
11
12
13
14
15
16
Teacher
Teacher
Students
Teacher
: We spend 36 minutes to travel 24 km. I estimate the
location of 24 km (on the model). Let’s say 24 is here
(drawing a vertical line on the model). So, this is 24 km
and the upper line is 36.
: Can you do it from 24 km to Singaraja which is 80 km?
Where is 80 km? (pointing on the model)
: On the (right) corner. (some students pointing the right
side of model)
: Let’s say 80 is here. How many minutes it represents? We
don’t know yet. Let’s name it, Singaraja. Then, Batur 60
km. Where is 60? Around here, okay? (drawing a vertical
line before 80 km) 60 is Batur. You don’t need to use a
ruler to determine the distance, just use an estimation.
Last, Klungkung is here isn’t it? (pointing location before
60). It’s impossible to be here (pointing location after 60).
It has to be ordered.
Even though we involve distance in the problem, the teacher shifted her
method to place numbers on the model. Rather than started from 1 km and
divided the line on the model into several same parts as in previous lessons,
the teacher directly asked students to arrange the given numbers on the
model. Moreover, students were able to arrange the given numbers on the
model in order.

131
To support students in determining the travelled time for each
destination, the teacher related the ratio information to fraction, 24 km:36
minutes to 24
36. The teacher also led students to observe the relationship
between numbers. Since it would be difficult for students to do 40 from 24,
the teacher told students to simplify the fraction and they got 2
3. We provide
figure 5.27 as an illustration of the teacher’s drawing.
From the simplified fraction, the teacher asked students to point out the
relationship between numbers on the lower line. Students answered the
relationship using multiplication. Since they multiplied a number on the
lower line with a scale factor, they had to multiply the number on the upper
line with the scale factor as well. The teacher also asked students whether
all ratio have the same value. However, students were in doubt. To show
that all pairs have the same value, the teacher reminded students to use
fractional form and to simplify the fractions. In the end, they got 2
3 for the
pairs. Hence, students were sure that all pairs on the model have the same
value. The teacher also told students that those pairs are called equivalent
0 km 2 24 40 60 80
0
Batur Denpasar
mins 36 3 60 90 120
Singaraja Klungkung
x40
x20 x30 x2
x20 x30 x40
x2
Figure 5.27. An illustration of the teacher’s drawing on the board

132
ratios. Later, the teacher told students to work on the next problems.
Problem b
Given, the ratio information is to travel 20 km, the car consumes 2 litres
of fuel. Using the determined time on the previous problem, students were
asked to determine the fuel consumption for each destination. The teacher
provided an empty double number line on the board in which the lower line
should be for the distance and the upper line for the fuel consumption.
The focus group students directly drew the model and listed the given
information. Once they finished drawing the model, they observed the given
numbers for the lower line and arranged the order of the given numbers. To
relate one number to another, they used multiplication. We provide an
example of the students’ answer as in figure 5.28.
From the figure above, the students did not simplify the given ratio. She
directly related one number to another using multiplication. The students
did not only relate the number from the given ratio. The students used
Figure 5.28. The students used multiplication to express the relationship
between numbers

133
another number to relate. For example, from 20 km, the students were able
to determine the fuel consumption for 80 km. However, the students already
figured out the fuel consumption of 40 km. Thus, the students started from
40 km to determine the fuel consumption. In addition, the students used a
line with an arrow. It benefits other students and the teacher to follow the
students’ steps. By using multiplication to express the relationship between
numbers, we interpret that the students have the notion of multiplicative
comparison. Furthermore, the students multiplied the pair with a scale
factor. It is possible that the students also have the notion of ratio as a
composed unit to determine another equivalent ratio.
For some time, the teacher did not walk around the class. Since the
students of focus group did not struggle as previous lessons, the researcher
moved to another group to find out how they solve the problem. The
researcher approached a student named Tegar who usually used repeated
addition to solve ratio problem in previous lessons (see transcript 5.7). The
researcher asked the student how he solved the problem since the model has
developed into a double number line. Transcript 5.12 illustrates the
discussion. We also provide figure 5.29 which shows Tegar’s work to
illustrate how Tegar worked with the double number line. The taken figure
is Tegar’s work after the discussion. In his work, Tegar simplified the given
ratio first. Therefore, there is a pair of ratio 10 km:1 litre on the double
number line.

134
Figure 5.27. Tegar was using the double number line to solve the problem
Transcript 5.12
1
2
3
4
5
6
7
8
9
10
11
12
13
Researcher
Tegar
Researcher
Tegar
Researcher
Tegar
Researcher
Tegar
: How did you get that, Tegar?
: 20 km equals 2 litres doesn’t it? Then, 10 km equals 1
litre.
: Then?
: Then, we need to determine (the fuel consumption for)
40 km. It means, you multiply. Just multiply.
: From what? From what to what?
: This one is 30 (drawing an additional vertical line
between 20 km and 40 km).
: If it is from here, from here (20 km) to there (40 km),
can we do that? What do you think?
: You continue it. Add. Every kilo… Every 10 km, add 1
litre, 1 litre.
From the transcript, we interpret that Tegar still used repeated addition to
explain how he solved the problem. The researcher wanted to find out
whether Tegar was able to shift his strategy and whether he was able to
relate the numbers using multiplicative comparison. The researcher asked
questions as in transcript 5.13.
Transcript 5.13
1
2
3
4
5
6
Researcher
Tegar
Researcher
Tegar
: For example, we don’t know it yet. (covering numbers on
the middle part of the model) You want to find out 60 km.
Can you find it from here (10 km) to here (60 km)?
: Multiply it.
: Multiply by what?
: By 6.
Figure 5.29. Tegar was using the double number line to solve the problem

135
7
8
9
Researcher
Tegar
: If the number on the lower line is multiplied by 6, what
will you do for the pair on the upper line?
: You multiply it by 6 as well.
From the following transcript, Tegar was able to relate numbers using
multiplicative comparison after the researcher covered the middle numbers
on the double number line. It is possible that the numbers on the problem
lead Tegar to determine and to explain his work using repeated addition.
Observing the given distance on the problem, the numbers on the lower line
are multiples of 10. It makes sense if Tegar tried to explain his method using
repeated addition. When the difference between numbers on the lower line
is big, it pushes the student to relate the numbers using multiplicative
comparison. From this case we can say that the numbers string influences
students in solving the problem. It will be better if the numbers have a large
difference and the multiples are not a landmark number such as 2, 5, and 10.
In the class discussion, the teacher asked a student to write his work on
the board. We provide figure 5.30 as an illustration of the student’s work.
From the student’s work, we know that the student only used 10 to relate to
0 km 10 20 40 60 80
0
Batur
litre 2 1 4 6 8
Singaraja Klungkung
x8 x4 x6
x4 x6 x8
10 km:1 litres
Figure 5.30. The student only related the numbers from 10

136
other numbers. Even though the student was able to arrange the numbers
and to use multiplicative comparison on the model, the student’s ability in
determining relationship between numbers is limited. In addition, the
student simplified the given ratio. It is unnecessary for the student to use
fraction and to simplify it if he observed the numbers.
The teacher told students that it is allowed to not simplify the given
ratio. Some students did not simplified the given ratio. Students who did not
simplify the given ratio were able to observe the relationship between
numbers better than students who simplified. As in the analysis of figure
5.28, students were able to relate numbers with more combination.
Problem c
Given, the ratio information is 6 litres of fuel cost IDR 60.000. Using
the determined fuel consumption on the previous problem, students were
asked to determine the price of the fuel consumption for each destination.
Figure 5.31 shows the focus group students’ work.
Figure 5.29. The students simplified the given ratio
From the figure, the students inserted 2 on the lower line as information
from the previous problem. In fact, the problem does not contain a car
consumption of 2 litres. The students mistakenly used 2 as a problem. From
Figure 5.31. The students simplified the given ratio

137
the students’ work, we know that they transformed the given ratio into a
fractional form and simplified it. In this case, the students tend to choose
integer rather than to have a decimal or a fraction as the scale factor. Our
interpretation according to the students’ work is that the students were
attached to multiplication and integer as the scale factor. Therefore, rather
than observing and determining the relationship between given numbers, the
students tend to simplify the fraction and started to determine the
relationship between numbers using multiplication and integer scale factors.
To find out other students’ struggle, the researcher moved on another
group. In another group, the students struggled in starting to solve the
problem. The researcher asked the students to order the given information
on the model. Once the students ordered the numbers, the researcher asked
them to determine the relationship between the given numbers on the lower
line. However, the students struggled to determine the multiplicative
relationship. In fact, the students should have been able to relate that 10 is
2,5 times 4. Yet, they simplified the ratio to determine the multiplicative
comparison.
As we mentioned before, the students wanted to obtain a whole number
as the relationship between numbers. If the students were flexible in
working with numbers, they would not have a problem in having decimal as
the scale factor. The students struggled in using decimals not only in this
lesson. In the second lesson, in which students had to determine the division

138
which resulted in decimals, they tend to do rounding to get integers. In this
problem, rather than simplifying the given ratio, students may relate 10 with
4. The relation between two numbers is decimal. However, it turned out that
most students did not try to determine the relationship between 10 and 4
directly.
The teacher decided to discuss the problem by asking one student to
write his work on the board. Figure 5.32 shows the student’s work.
Using the student’s work, the teacher emphasized on simplifying the given
ratio regarding to students’ struggle in perceiving the relationship between
numbers on the lower line. The teacher did not discuss what if they did not
have to simplify the fraction. Students might come up with an idea to use
decimals as the scale factor if the teacher asks. The student’s work on the
board is similar to figure 5.31, which becomes the representation of general
students’ answer.
Based on the analysis, we can conclude that students were able to
0 km 1 4 6 8 10
0
Batur
litre 24.000 6.000 36.000 48.000 60.000
Singaraja Klungkung
x2 x4 x6
x4 x6
x2
1 km:IDR 6.000
Figure 5.32. The student used multiplication to express relationship
between numbers

139
understand that numbers on the model should be well ordered. Moreover,
they were able to determine the multiplicative comparison between
numbers. Students used fractional form and simplified the fraction when the
numbers are difficult. However, students tend to use multiplication in
determining the relationship between numbers rather than using division. In
addition, instead of involving decimals as the scale factor, students tried to
involve only integers as the scale factor.
We summarize the conjectures and the students’ actual answer in table
5.11.
Table 5.11. The students’ actual answer on lesson 4 cycle 2
Activity Conjectures of
students’ answer
Students’ actual
answer
Understanding that
numbers on the model
must be well ordered
and expressing
multiplicative
comparison on the
model
Students do not
understand that
numbers on the model
must be well ordered
Students are not able
to express
multiplicative
comparison to
determine equivalent
ratios
(students use
subtraction and
addition to determine
equivalent ratios)

140
Students are able to
express multiplicative
comparison on the
model to determine
equivalent ratios
Students were able to
determine equivalent
ratios by relating
numbers using
fractional form,
multiplication, and
division
6. Lesson 5
There are three problems in the fifth lesson. The first two problems are
related. The contexts of problems are shopping and food consumption. The
general aim of the problems are to enable students to formulate the given
information into a mathematical model and to enable students to understand
that equivalent ratios can be determined by using multiplicative comparison.
Problem 1a
The problem is about buying milk pie, a famous snack in Bali. Given,
Adam bought 36 pies and he has to pay IDR 135.000. Adam’s friends also
buy pies with different amounts. Students were asked to determine how
much many each person should pay. Before students started to work, the
teacher read the problem and drew the model on the board as in figure 5.32.

141
According to the previous lesson, the class agreed to put the given
information on the lower line while the determined value on the upper line.
Once the teacher had ordered the given numbers, the teacher asked students
whether they were able to determine relationship between numbers. It turned
out that students struggled in finding relationship between the given
numbers. Instead of asking students to relate 36 to other given numbers, the
teacher led students to transform the given ratio into a fractional form and
simplified it. Students also struggled in multiplying and dividing in which
large numbers are involved. To continue, the teacher instructed students to
do the problems.
The students in the focus group directly listed the given information and
formulated the given information into a double number line. In addition,
they were able to order the given numbers on the model. Some of the
students transformed the given ratio into a fractional form and simplified it.
The researcher talked to Rizqi who had not transform the ratio into a
fractional form, to determine the relationship between numbers without
simplifying the ratio. Transcript 5.13 illustrates the discussion and figure
5.34 shows the student’s work.
Figure 5.33. The teacher used fractional form and simplified it

142
Figure 5.32. Rizqi determined the relationship between numbers
Transcript 5.14
1
2
3
4
5
6
7
8
9
10
11
12
Researcher
Rizqi
Researcher
Rizqi
Researcher
Rizqi
Researcher
Rizqi
Researcher
Rizqi
Researcher
: Can we not simplify it? Are there any related numbers?
: 12 and 36.
: What?
: 12 and 36.
: 12 and 36. What is the relationship?
: 12 times 3 equals 36.
: What about 36 to 12?
: Times 3.
: Well, yea 12 to 36 you need to multiply it by 3. What if
36 to 12?
: Divided by 3.
: Okay, now try it.
The transcript reveals that the student was able to determine the relationship
between given numbers without simplifying the given ratio first. The student
struggled when he wanted to relate 12 to 20 and to 44. The researcher
suggested the student to simplify the given ratio. From the student’s work,
we know that instead of simplifying the fraction into the simplest form, the
student used small factor as a divisor that is 3. From the new equivalent
ratio, 4 pies:IDR 15.000, the student related 4 to 20 and 4 to 44. In our
interpretation, Rizqi has a better ability in determining the relationship
between numbers because he did not simplify the given ratio at first.
Similar to Rizqi, most of students did not simplify the fraction into the
Figure 5.34. Rizqi determined the relationship between numbers

143
simplest form. Their smallest fraction is 4
15.000. However, there was a
difference between how they determined the relationship between numbers.
Even though they used multiplicative comparison, Rizqi’s work shows that
he has a better sense in determining the relationship between numbers
compared to other students. Figure 5.35 represents the general students’
work.
Figure 5.33.
From the figure of students’ work we may interpret that this answer is less
sophisticated than Rizqi’s. The reason is that students tend to do
simplification at first rather than observing the numbers and trying to
determine the relationship. In general, students were able to use the model
and to express the multiplicative comparison on the model. However, it
seems they did not pay attention at the numbers first. They directly
simplified the given ratio.
When students were struggling to solve the problem, the teacher did not
walk around the class. Students approached the teacher and the teacher told
them to discuss the problem with their friends. However, among students,
Figure 5.35. Students directly simplified the given ratio and started from 4

144
they did not really discuss about the problem. Some of students had
discussion but some others tend to look at their friends’ work. Furthermore,
there was no class discussion about the problem until the class ended.
Problem 1b
Using the determined value on the previous problem, students started
to work on the problem. Most of students were able to formulate the given
information into a model. In addition, they ordered the given numbers as in
the previous problem order. However, some students struggled to
understand the problem and to formulate the information into a model. One
of the focus group students tried to help her friends in working on the
problem. Transcript 5.15 illustrates the discussion between Sisi and her
friends.
Transcript 5.15
1
2
3
4
5
6
7
8
9
10
11
12
13
Sisi
Aura
Sisi
Aura
Sisi
Aura
Sisi
Talitha
Sisi
Talitha
: What (information) do you know from the problem?
: 9 portions.
: Write it.
: (writing the given ratio)
: How much money do you need to buy 9 portions of nasi
bali?
: IDR 135.000.
: Then write it.
: Do we have to write it (the determined value in previous
problem) here? Do we need to make lines? (drawing lines)
: Now, make like this (a double number line). You need to
make for the price.
: (ordering the given numbers on the line)
The transcript reveals that students were unsure to formulate the given
information into a model since the problem did not ask them to make a
representation. Sisi helped her friends by asking questions about

145
information they had from the problem. Sisi also led her friends to do the
problem using the model. She told her friends to make an illustration as in
the previous problem even though the problem did not ask students to make
a representation. We provide Sisi’s work as in figure 5.36.
As expected, the figure shows that Sisi used multiplicative comparison to
solve the problem. Sisi simplified the given ratio to the simplest form of
fraction and related numbers mostly using multiplication. Even though Sisi
was able to solve the problem, she struggled in working with large numbers.
It did not happen to Sisi solely. Most students struggled to determine the
number of nasi bali portion according to the large amount of money.
Even though it had been the fifth lesson for students, some students still
used a model which pays attention to the spaces between numbers as in
figure 5.37.
Figure 5.36. Sisi used multiplicative comparison to solve the problem

146
The student rejected to be recorded while working on the problem.
Therefore, we could not find out the student’s thinking. Observing the
model, it is possible that the student used repeated addition to solve the
problem. In addition, below the model, the student wrote an addition of
90.000 and 15.000. From the model, we know that every time we add 15.000
on the lower line, we also add 1 on the upper line. From the figure, the
student determined not only the asked value but also the number of portion
for every IDR 15.000. However, looking at the student’s doodle, he
simplified the given ratio. It is possible that the student tried to determine 3
portions and 1 portions using multiplicative comparison. However, in
determining the asked value, the student did not show the notion of
multiplicative comparison on his model.
In general, students were able to formulate the information into a double
number line and to determine the number of nasi bali portion. Nevertheless,
since the problem involves large numbers, students struggled in counting.
Students were also able to express the multiplicative comparison. However,
some students had not shift their method from repeated addition to
multiplicative comparison. The teacher could have brought the topic in the
Figure 5.37. An example of the student’s work
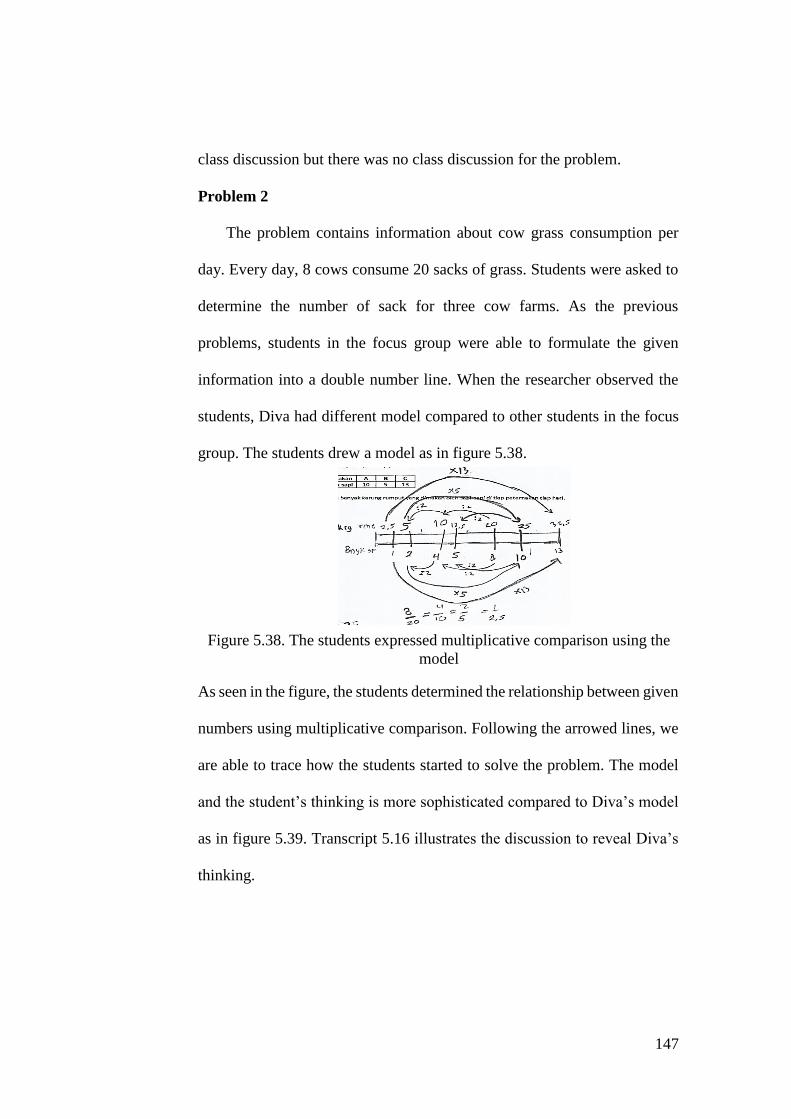
147
class discussion but there was no class discussion for the problem.
Problem 2
The problem contains information about cow grass consumption per
day. Every day, 8 cows consume 20 sacks of grass. Students were asked to
determine the number of sack for three cow farms. As the previous
problems, students in the focus group were able to formulate the given
information into a double number line. When the researcher observed the
students, Diva had different model compared to other students in the focus
group. The students drew a model as in figure 5.38.
Figure 5.
model
As seen in the figure, the students determined the relationship between given
numbers using multiplicative comparison. Following the arrowed lines, we
are able to trace how the students started to solve the problem. The model
and the student’s thinking is more sophisticated compared to Diva’s model
as in figure 5.39. Transcript 5.16 illustrates the discussion to reveal Diva’s
thinking.
Figure 5.38. The students expressed multiplicative comparison using the
model

148
(a) (b)
Transcript 5.16
1
2
3
4
5
6
7
8
9
Researcher
Diva
Researcher
Diva
Rizqi
Researcher
Diva
: Diva, I want to ask. For 1, 2, 3, 4, how do you determine
the value?
: (thinking)
: 1 you got 2,5. 2 you got 5. 3 you got 7,5. 4 you got 10.
How do you get that?
: Hmm. (thinking) I just do it.
: You just do it?
: How is it Diva? I still do not get.
: I also don’t know. (drawing more lines for every 1 cow)
From figure 5.39(a), Diva related 8 cows to 4 cows using multiplicative
comparison. Based on the transcript, when the researcher asked him how he
determined the value for every 1 cow, he could not explain. It is possible
that Diva determined the number of sack for 1 cow using division. Later, to
determine another sacks for 1 more cow, Diva added 2,5. Observing the
video registration, it is possible that Diva determined the grass consumption
for every number of cows. Once he had determined, he attempted to relate
the numbers using multiplicative comparison. In our interpretation, even
though Diva was able to determine the multiplicative comparison between
Figure 5.39. Diva drew the model as in using a double scale line

149
numbers, he started using repeated addition.
Similar to Diva, another student also struggled in relating the numbers
using multiplicative comparison rather than addition. We obtain data in the
form of students’ written work as in figure 5.40.
Figure 5.38. An example of students’ work
Observing the figure, we know that the student only formulate the asked
value into a model. The student did not write the given ratio on the model.
Moreover, he was not able to order the numbers on the lower line well.
Furthermore, since the student did not write the given ratio, he struggled to
determine the number of sack. To determine the number of sack, the student
paid attention on numbers on the lower line. The student struggled in
determining the relationship between numbers on the lower line. There was
an inconsistency, where the student used division and addition to determine
the number of sack. The student was able to determine the multiplicative
comparison between 10 and 5. Yet, he could not determine the number of
sack for farm B since he did not know the grass consumption for farm A.
To determine the number of sack for farm C, the student used addition.
It is possible that the student could not get an integer if he used
multiplicative comparison in determining the relationship between B and C.
Figure 5.40. An example of students’ work

150
As mentioned before, students struggled in working with non-integer. Thus,
the student chose to determine the difference between numbers, which
produces integer. It was not clear how the student could get 200 sacks for
farm A, 50 sacks for farm B, and 260 sacks for farm C.
Some students still struggled to shift their thinking, from using addition
to using multiplicative comparison in determining the relationship between
numbers. The teacher could have used students’ work to discuss the key
concepts of ratio. In addition, the teacher could have discussed the benefit
of using multiplicative comparison and the drawback of using repeated
addition or difference in determining the relationship between numbers.
Similar to the previous problem, there was no class discussion for this
problem as well. The teacher closed the lesson by asking students to hand
in their worksheets.
Based on the analysis, we can conclude that students were able to
formulate the given information into a double number line. However, some
students still struggled in ordering the given numbers on the lower line. Not
all students understood that they had to use multiplicative comparison to
determine equivalent ratios.
We summarize the conjectures and the students’ actual answer in table
5.12.

151
Table 5.12. The students’ actual answer on lesson 5 cycle 2
Activity Conjectures of
students’ answer
Students’ actual
answer
Formulating the given
information into a
mathematical model
and understanding
that equivalent ratios
can be determined by
multiplicative
comparison
Students are not able
to formulate the given
information into a
mathematical model
Students are not able
to understand that
equivalent ratios can
be determined by
using multiplicative
comparison (students
determine equivalent
ratios by determining
difference between
numbers)
Some students made a
model which seems
like they were using
difference and
addition to determine
equivalent ratios
Students are able to
understand that
equivalent ratios can
be determined by
using multiplicative
comparison
Some students
determined equivalent
ratios by relating
numbers using
multiplicative
comparison
7. Posttest
We carried out the posttest after carrying out five lessons. Problems in
the posttest are the same as in the pretest. By carrying out the posttest, we
want to find out and to clarify students’ development in the learning.

152
In the first problem, some students mentioned words which have the
notion of difference such as “difference”, “shorter than”, and “longer than”.
Other students also mentioned words which have the notion of comparison
for instance “comparing two things”, “double number line”, “double scale
line”, “multiplication and division”, and “fraction”. In the second problem,
four students were able to choose which statement contains the notion of
comparison and to reason correctly. These students reasoned that
comparison is related to multiplication and division. One student was able
to write the ratio of the two ribbons.
For the third problem, there are two kinds of students’ answers in
measuring the figure. The first is some students used a ruler to determine
the length of the figure. The students did not mark the figure and wrote cm
on the paper. The second is some students used a scale line and marked the
figure to determine how many times the scale line fits the figure. In problem
four, 16 students were able to measure the route using the scale line.
However, only nine students were able to determine real distances between
ports by using the scale information.
There are two types of answer for problem five. Students used
illustration namely double number line and no illustration to solve the
problem. From 13 students who drew double number line, only four were
able to use the model correctly (see figure 5.41(c)).
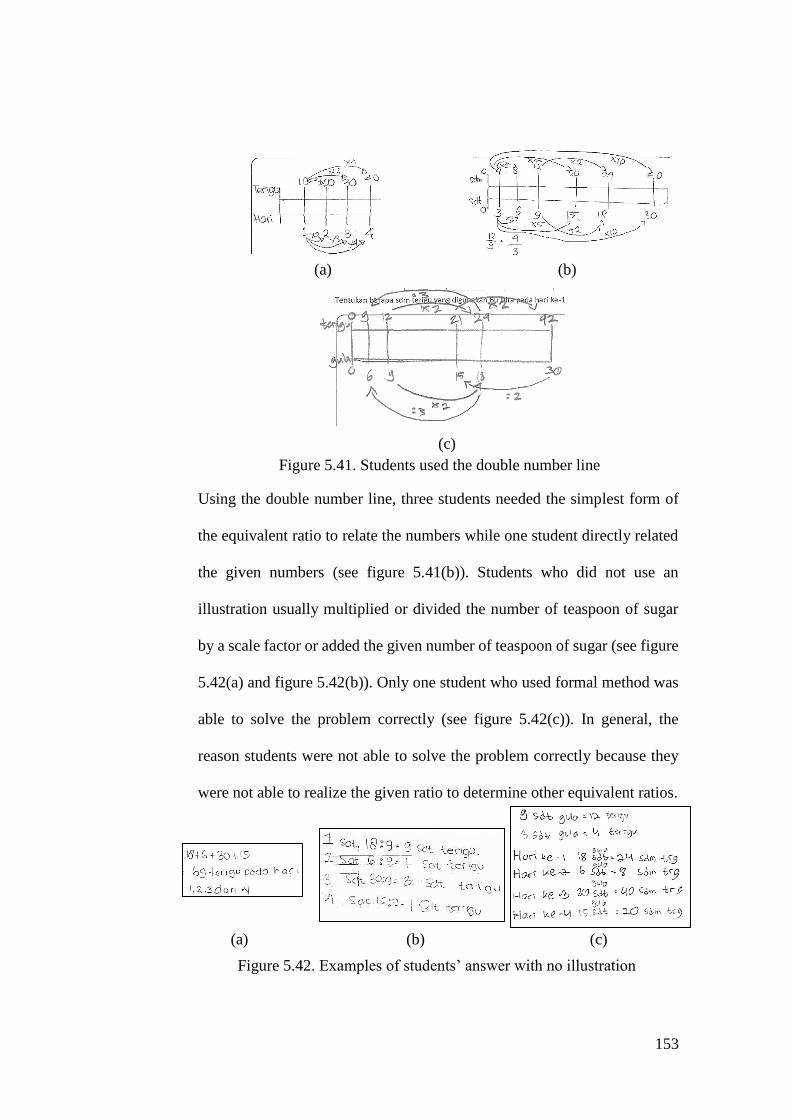
153
(a) (b)
(c)
Using the double number line, three students needed the simplest form of
the equivalent ratio to relate the numbers while one student directly related
the given numbers (see figure 5.41(b)). Students who did not use an
illustration usually multiplied or divided the number of teaspoon of sugar
by a scale factor or added the given number of teaspoon of sugar (see figure
5.42(a) and figure 5.42(b)). Only one student who used formal method was
able to solve the problem correctly (see figure 5.42(c)). In general, the
reason students were not able to solve the problem correctly because they
were not able to realize the given ratio to determine other equivalent ratios.
(a) (b) (c)
Figure 5.41. Students used the double number line
Figure 5.42. Examples of students’ answer with no illustration

154
8. Discussion
After analyzing the teaching experiment, we recognize the influence of
context and numbers string on students’ strategies to solve problems. For
example, in the third lesson the teacher and students still used the model as
using double scale line because the problem is about distance on the map
and real distance. Other than that, students still used repeated addition
because the numbers are multiples of landmark numbers (2, 5, 10).
Similar to the students in the pilot study, students in the teaching
experiment were struggling in working with fractions and decimals.
Moreover, students avoided working with non-integer numbers such as
decimal. When students tried to determine relationship between numbers
using multiplicative comparison and they could not obtain an integer as the
relationship, they used addition and subtraction. It indicates that students
were not flexible in working with numbers. Since the finding reveals that
students in the fifth grade struggle in working with fraction in the topic of
ratio, the next study may bridge the gap between using integer and fraction
to support students in learning ratio using non-integer numbers.
The learning sequences in this study enable students up to general level.
However, in the posttest, some students attempted to use formal method to
solve the problem. One of students who used the formal method could solve
the problem correctly. The student was able to underline the given ratio of
the problem. Moreover, he simplified the given ratio and multiplied the

155
simplest ratio to solve the problem. In simplifying and multiplying, the
student used division and multiplication, that is the multiplicative
comparison in solving ratio problem.
The whole study was conducted in a short time. In addition, the
researcher did not have much time to revise the learning instructions for the
teaching experiment enormously. As a reflection, the researcher proposes
major changes on the learning sequences for another study. We provide
table 5.13 to illustrate the revision for the latter study.

156
Table 5.13. Reflection for the next study related to ratio
Activity Concepts Context Model Remark
Distinguishing
difference and
comparison
Ratio,
multiplication,
division
Comparing
different
lengths
-
This activity aims at enabling students to distinguish the
notion of difference and comparison
Working with a
scale line
Ratio Using a
reference to
measure
objects
Students’
informal
model
This activity aims at enabling students to compare two
quantities and to understand multiplicative comparison
within ratio
Working with
double scale line
Scale,
proportion,
fraction
Maps
(distance on
map and real
distance)
Double scale
line
In this activity, provides two problems. For the first problem,
use two ratios which consist of numbers string to enable
students to understand multiplicative comparison within ratio
and between ratios. In the second problem, use numbers
string which allow students to determine missing value of
equivalent ratios using strategies: (1) determining difference
and using addition and (2) using multiplicative comparison
Working with
double number line
Ratio and
proportion
Travelling
(time and
distance, fuel
and price)
Double
number line
In this activity, provides two problems. For the first problem,
use numbers string which allow students to use two
strategies to determine equivalent ratios. In the second
problem, use numbers string which allow students to use
only multiplicative comparison to determine equivalent
ratios
Formulating the
given information
into formal method
Ratio and
proportion
Travelling
(distance and
fuel)
Formal
method
In this activity, provides a problem which does not instruct
students to draw a model. Support students to connect the
concept of multiplicative comparison using the formal
method

157
E. Validity and Reliability
In this section, we will discuss the validity and the reliability of the study.
For the validity of the study, we did data triangulation. Using the collected data,
the researcher triangulated the data in the analysis. The collected data were
obtained by using various methods for instance classroom observation,
students’ written work, and students’ interview. The researcher compared
obtained data from different methods to find out whether the data are
supporting each other in the analysis. The researcher also discussed how the
data are supporting each other or not to produce a theory.
To improve the external validity of the research, we provide the
hypothetical learning trajectory of the study. It allows the readers to follow the
flow of the study and other researchers to adjust the design according to their
own condition. In the real teaching experiment, we involved the regular
mathematics teacher and the learning process went as they usually have. It
contributes to the ecological validity of the study.
We provide the readers the thick description of the study which consists of
the students’ actual learning. We include the analysis of fragments from video
registrations and students’ written work to enable the readers to follow how we
derive our interpretation and conclusion.

158
CHAPTER 6
CONCLUSION AND DISCUSSION
A. Conclusion
The aim of the study is to contribute to the development of local instruction
theory on ratio. In addition, we involve double number line as a model to
support students in learning ratio. To answer the research question: “How can
the double number line support students in learning ratio and scale?”, we use
our findings in the analysis to derive conclusion.
Activities in the first meeting enable students to distinguish between
comparison and difference. Students were able to make their own model to
describe the length of an object. Students were able to understand
multiplicative comparison within ratio. Working with double scale line enables
students to draw and to use the double scale line to determine real distance.
Students used repeated addition and determined real distance for every 0,5 cm.
Mathematical activities in the third meeting cannot fully promote the sense
of ordering given numbers. Students ordered the number and marked for every
0,5 cm as in double scale line. Students used addition to solve problems. In the
fourth lesson, the mathematical activities enable students to understand the
order of numbers without writing numbers one by one. Moreover, students
were able to express multiplicative comparison within and between ratios using
the double number line.

159
Small numbers of students were not able to formulate information into an
appropriate double number line. Even though in the previous lesson students
were able to express multiplicative comparison to show the relationship
between numbers in ratios, some students used repeated addition and an
incorrect strategy. It happen because students were not flexible in
understanding relationship between numbers, especially using multiplicative
comparison. Furthermore, students were not fluent in working with non-integer
number such as decimals. They tried to obtain a whole number as the product
of relationship between numbers.
Some students were able to develop their understanding about
multiplicative comparison using a double number line, some others were not.
In the third lesson, the teacher should have led students to ignore the precise
measurement between numbers. However, the teacher thought the model as a
double scale line. In addition, instead of focusing on the relationship between
numbers, the teacher told students to divide lines on the model into several
same parts. Most of the time, there were no supporting class discussion. In the
discussion, the teacher should have been able to focus on the relationship
between numbers and to emerge the notion of multiplicative comparison in
ratio.
According to the analysis and referring to the aim of the research, we
provide table 6.1 about local instruction theory on ratio and scale.
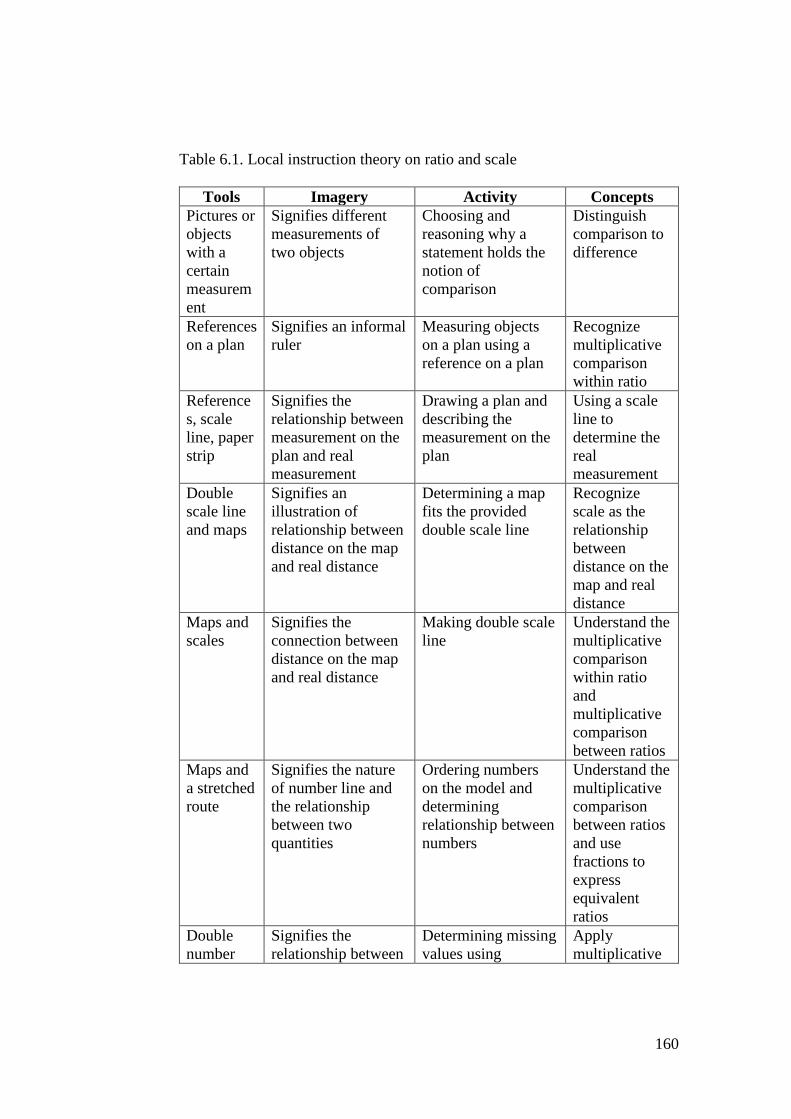
160
Table 6.1. Local instruction theory on ratio and scale
Tools Imagery Activity Concepts
Pictures or
objects
with a
certain
measurem
ent
Signifies different
measurements of
two objects
Choosing and
reasoning why a
statement holds the
notion of
comparison
Distinguish
comparison to
difference
References
on a plan
Signifies an informal
ruler
Measuring objects
on a plan using a
reference on a plan
Recognize
multiplicative
comparison
within ratio
Reference
s, scale
line, paper
strip
Signifies the
relationship between
measurement on the
plan and real
measurement
Drawing a plan and
describing the
measurement on the
plan
Using a scale
line to
determine the
real
measurement
Double
scale line
and maps
Signifies an
illustration of
relationship between
distance on the map
and real distance
Determining a map
fits the provided
double scale line
Recognize
scale as the
relationship
between
distance on the
map and real
distance
Maps and
scales
Signifies the
connection between
distance on the map
and real distance
Making double scale
line
Understand the
multiplicative
comparison
within ratio
and
multiplicative
comparison
between ratios
Maps and
a stretched
route
Signifies the nature
of number line and
the relationship
between two
quantities
Ordering numbers
on the model and
determining
relationship between
numbers
Understand the
multiplicative
comparison
between ratios
and use
fractions to
express
equivalent
ratios
Double
number
Signifies the
relationship between
Determining missing
values using
Apply
multiplicative

161
line two quantities multiplicative
comparison
comparison
between ratios
to determine
missing values
B. Discussion
1. The weakness of the study
There are constraints and obstacles during the study. Below, we describe the
weaknesses of the study.
a. Time limitation
The school gave the researcher two weeks for carrying out the study.
The study was conducted during final theme project and mid-semester
exam. Since we were given only two weeks, we did not have much time
to reflect on the pilot study. When students on the pilot study were having
posttest, students on the teaching experiment were having pretest.
Therefore, we could not make major revision of the design for the
teaching experiment.
The study was implemented every day for two weeks. The researcher
and the teacher reflected on the lesson after the class ended. We discussed
the next lesson one day before the implementation. Overall, the schedule
did not provide much time for the researcher to discuss the learning
instruction and learning materials with the teacher. Therefore, the teacher
looked at and carried the teacher guide most of the time during the
learning.

162
b. Role of the teacher
The researcher emphasized the role of the teacher during discussion
with the teacher. It is important for the teacher to hold and to orchestrate
class discussion. During the class discussion, the teacher can compare
students’ work and invite students about important concepts. Moreover,
discussing students’ strategy is also important to understand students’
thinking. The teacher can ask questions to support students in learning
ratio. However, the teacher did not hold a class discussion during three
lessons. The class discussion held only to confirm students’ work or to
give instruction.
Other than discussion, it is important for the teacher to walk around
the class to observe students’ struggles and to bring it up on the class
discussion. Rather than supporting students with questions, the teacher
told students what went wrong with their work and what they had to do.
It is possible that the teacher tried to finish all activities even though
students had not finish or understand considering the time limitation.
c. Socio norms and socio-mathematical norms
From the interview, the teacher said that the class is used to
discussion, especially to share opinions and to comment about one’s
work. However, it did not happen during the teaching experiment. In
addition, students usually look at their friends’ work rather than have a
discussion. During the learning, often students approached the teacher to

163
ask for confirmation of their work.
As mentioned by the teacher in the interview, students did not like
to read the problems first. They usually ask the teacher what the problem
is about and complain that it is difficult. When the researcher asked
whether students had read the problems, they answered ‘no’.
2. Suggestion
According to constraints and obstacles in the study, we propose several
points of suggestion. For researchers who want to carry out design research
study, it is important to have enough time to reflect and to improve the
design. We also can use the time to talk to the teacher about our design and
RME.
During the recent study, the teacher did not support students using
questions as in the teacher guide. Yet, the teacher plays important role in the
study. Researchers may approach and convince the teacher that supporting
questions from the teacher influences students’ thinking. Confirmation
questions will not trigger students to think.
Ratio can appear in different contexts. It is possible to use double
number line and another contexts and concepts such as fraction for future
research. Regarding to our finding that students in the fifth grade were not
flexible in working with non-integer numbers, further research can be done
to explore students’ flexibility in working with non-integer number.

164
REFERENCES
Abels, M., Wijers, M., Pligge, M. A., & Hedges, T. (2006). Models you can count
on. Chicago: Encyclopædia Britannica, Inc.
Bakker, A. (2004). Design research in statistics education on symbolizing and
computer tools. Utrecht: CD-β Press, Center for Science and Mathematics
Education.
Bakker, A., & van Eerde, H. A. (2015). An Introduction to Design-Based Research
with an Example From Statistics Education. In A. Bakker, & H. A. van Eerde,
Approaches to Qualitative Research in Mathematics Education (pp. 429-466).
Dordrecht: Springer Netherlands.
Ben-Chaim, D., Keret, Y., & Ilany, B.-S. (2012). Ratio and Proportion: Research
and Teaching in Mathematics Teachers’ Education (Pre- and In-Service
Mathematics Teachers of Elementary and Middle School Classes). Rotterdam:
Sense Publishers.
Ellis, A. (2013). Teaching Ratio and Proportion in the Middle Grades. Retrieved
from
http://www.nctm.org/uploadedFiles/Research_News_and_Advocacy/Researc
h/Clips_and_Briefs/research%20brief%2021%20-
%20Teaching%20Ratio%20and%20Proportion%20in%20the%20Middle%20
Grades_Final(1).pdf
Freudenthal, H. (1991). Revisiting Mathematics Education: China Lectures.
Dordrecht: Kluwer Academic Publishers.
Freudenthal, H. (1999). Didactical Phenomenology of Mathematical Structures.
New York: Kluwer Academic.
Gravemeijer, K. (1997). Mediating Between Concrete and Abstract. In T. Nunes,
& P. Bryant (Eds.), Learning and Teaching Mathematics: An International
Perspective (pp. 315-345). East Sussex: Psychology Press.
Gravemeijer, K. (1999). How Emergent Models May Foster the Constitution of
Formal Mathematics, Mathematical Thinking and Learning. Mathematical

165
Thinking and Learning, 1(2), 155-177. doi:10.1207/s15327833mtl0102_4
Gravemeijer, K. (2004). Local Instruction Theories as Means of Support for
Teachers in Reform Mathematics Education. Mathematical Thinking and
Learning, 6(2), 105-128. doi:10.1207/s15327833mtl0602_3
Gravemeijer, K., & Bakker, A. (2006). Design Research and Design Heuristics in
Statistics Education. ICOTS-7, (pp. 1-6). Retrieved from http://iase-
web.org/documents/papers/icots7/6F3_GRAV.pdf
Gravemeijer, K., & Cobb, P. (2006). Design Research From a Learning Design
Perspective. In J. van den Akker, K. Gravemeijer, S. McKenney, & N. Nieveen
(Eds.), Educational Design Research (pp. 45-85). Oxon: Routledge.
Hart, K. M. (1984). Ratio: Children's Strategies and Errors. Berkshire: NFER-
NELSON.
Karplus, R., Pulos, S., & Stage, E. K. (1983). Early Adolescents' Proportional
Reasoning on 'Rate' Problems. Educational Studies in Mathematics, 14, 219-
233.
Kemendikbud. (2013). Kurikulum 2013 [Curriculum 2013]. Jakarta:
Kemendikbud.
Küchemann, D., Hodgen, J., & Brown, M. (2014). The use of alternative double
number lines as models of ratio tasks and as models for ratio relations and
scaling. British Congress of Mathematics Education, (pp. 1-8). London.
Lamon, S. J. (2012). Teaching fractions and ratios for understanding: essential
content knowledge and instructional strategies for teachers (3rd ed.). New
York: Taylor & Francis.
NCTM. (2000). Principles and Standards for School Mathematics. NCTM.
Orrill, C. H., & Brown, R. E. (2012). Making sense of double number lines in
professional development: exploring teachers’ understandings of proportional
relationships. Journal of Mathematics Teacher Education, 15, 381-403.
doi:10.1007/s10857-012-9218-z
Rathouz, M., Cengiz, N., Krebs, A., & Rubenstein, R. N. (2014). Tasks to Develop
Language for Ratio Relationships. Mathematics Teaching in the Middle

166
School, 20(1), 38-44.
Riehl, S. M., & Steinthorsdottir, O. B. (2014, November). Revisiting Mr. Tall and
Mr. Short. Mathematics Teaching in the Middle School, 20(4), 220-228.
Roberge, M. C., & Cooper, L. L. (2010, April). Map Scale, Proportion, and Google
Earth. Mathematics Teaching in the Middle School, 15(8), 448-457.
Simon, M. A. (1995, March). Reconstructing Mathematics Pedagogy from a
Constructivist Perspective. Journal for Research in Mathematics Education,
26(2), 114-145.
Singh, P. (2000). Understanding the concept of proportion and ratio constructed by
two grade six students. Educational Studies in Mathematics, 271-292.
Steinthorsdottir, O. B. (2006). Proportional reasoning: Variable influencing the
problems difficulty level and one's use of problem solving strategies.
Proceedings 30th Conference of the International Group for the Psychology of
Mathematics Education (pp. 169-176). Prague: PME.
Streefland, L. (1984). Search for the Roots of Ratio: Some Thoughts on the Long
Term Learning Process (Towards ... a Theory). Educational Studies in
Mathematics, 15, 327-348.
Streefland, L. (1991). Fractions In Realistic Mathematics Education. Dordrecht:
Kluwer Academic Publisher.
Tatsis, K., & Koleza, E. (2008, February). Social and socio-mathematical norms in
collaborative problem-solving. European Journal of Teacher Education, 31(1),
89-100. doi:10.1080/02619760701845057
Tourniare, F., & Pulos, S. (1985). Proportional reasoning: A review of the literature.
Educational Studies in Mathematics, 16, 181-204.
van den Heuvel-Panhuizen, M., & Drijvers, P. (n.d.). Realistic Mathematics
Education. (S. Lerman, Ed.) Encyclopedia of Mathematics Education.
Retrieved from https://uu.blackboard.com/bbcswebdav/pid-1791587-dt-
content-rid-4339278_2/courses/BETA-2013-4-AS-SEC412-
V/DSEC%208%20ENCYCLOPEDIA-
Realistic%20Mathematics%20Education_ref.pdf

167
van Eerde, D. (2013). Design Research: Looking Into the Heart of Mathematics
Education. The First South East Asia Design/Development Research (SEA-DR)
International Conference, (pp. 1-11). Palembang. Retrieved from
http://dspace.library.uu.nl/bitstream/handle/1874/289586/k1_dolly_10.pdf?se
quence=1
Yackel, E., & Cobb, P. (1996). Sociomathematical Norms, Argumentation, and
Autonomy in Mathematics. Journal for Research in Mathematics Education,
27(4), 458-477.

168
Working with a scale line
LESSON 1
Using the stretched route to
show the relationship
between numbers
LESSON 3
Working with a double scale line
LESSON 2
Referential
General
Formal
Situational
Expressing multiplicative
comparison to determine
equivalent ratios
LESSON 4
Formulating the given
ratio into a model and
understanding
multiplicative
LESSON 5 Learning Trajectory on Ratio and Scale

169
APPENDIX A
The Classroom Observation Scheme
Classroom environment
Does the teacher wait students to be quiet before opening the lesson?
How the seat arrangement in the classroom?
Where the teacher positions him/herself in the teaching and learning process?
How the teacher handles unwanted behaviour from students?
How does the teaching and learning condition? (too quite or too noisy)
Teaching and learning process
How does the teacher open the lesson?
What kind of contexts the teacher uses in the lesson?
Does the teacher encourage students to take part in the teaching and learning
process? In what way?
How is students’ participation in the classroom?
Does the teacher give students some time to think or discuss with their
neighbours?
Does the teacher instruct students to make groups to discuss?
Does the teacher give students a chance to ask, clarify, or speak about their
opinion in solving problems?
How the teacher reacts to students answers or questions?
How the teacher scaffolds students in discussion?
Does the teacher lead students to use only one strategy?
Does the teacher encourage students to reason with their answers/strategies?
Does the teacher pinpoints and differs which answer is more efficient and
sophisticated? Does she/he asks students why it is more efficient or
sophisticated?
How the teacher encourages students to conclude the lesson?
How the teacher manages the time?
How does the teacher end the lesson?

170
APPENDIX B
The Teacher’s Interview Scheme
Background
How long you have been teaching?
From the first time you are teaching, are you only teaching grade five?
Why do you choose this grade?
What is your favourite topic in teaching mathematics?
Teaching and learning process
How do you usually introduce ratio and scale?
What preliminary knowledge students must have to learn ratio and scale?
How many meetings do you need to finish the topic of ratio and scale?
What kind of contexts you usually used to introduce the topic?
What difficulties students usually have in learning ratio and scale?
What difficulties you usually have in delivering the topic?
What kind of books you usually use to support students learning ratio and
scale?
Are you always stick to the curriculum or sometimes expand the learning?
How do you asses students’ work?
How to engage students in learning ratio and scale?
Have you heard about mathematics models?
Do you think it is important to use a model to bridge students’ informal and
formal knowledge?
Classroom norms
How the teaching and learning usually go?
How students participate in your class?
Do you usually have discussion in the classroom?
Do you give students a chance to speak or to ask?
Do you compare students’ solutions?
Do you let students to comment other students’ work and reflect on their work?
RME or PMRI
Have you heard about RME or PMRI?
Do you have any experience with PMRI?
What is your opinion about implementing PMRI in a classroom?

171
APPENDIX C
PRETEST AND EXAMPLES OF EXPECTED ANSWER
Waktu mengerjakan 30 menit
Kerjakan sendiri
Gunakan bagian yang masih kosong sebagai tempat untuk menghitung
1. Apa yang kamu ketahui tentang rasio? Gunakan gambar, kalimat, bagan, dll untuk
menjelaskan.
2.
Manakah di antara dua pernyataan berikut yang merupakan rasio? Jelaskan alasanmu.
a. Panjang tali biru 3 meter lebih panjang dari tali merah.
b. Panjang tali biru 4 kali panjang tali merah.
3. Bantu tukang bangunan untuk mengukur panjang dan lebar suatu ruangan (persegi
panjang biru) dengan menggunakan tali hitam pada gambar.
tali
Dengan uang Rp 1.000,00, saya bisa membeli 3 permen
4 m 1 m
b. Panjang tali biru 4 kali panjang tali merah
Pernyataan kedua membandingkan dua ukuran dan menyatakannya dengan
“kali”. Sedangkan pernyataan pertama merupakan selisih.

172
4. Sebuah kapal berangkat dari Pelabuhan A untuk mengirimkan barang ke Pelabuhan B,
C, D, lalu kembali ke Pelabuhan A. Garis putus-putus hitam adalah rute kapal tersebut.
Panjang garis skala di bawah mewakili 5 km jarak sebenarnya.
Petunjuk:
a. ukur panjang rute satu per satu.
b. bandingkan panjang rute dengan garis skala yang tersedia.
Soal: Tentukan seberapa jauh kapal tersebut berlayar dari satu pelabuhan ke
pelabuhan yang lain.
= 5 km
(menggunakan tali pada gambar untuk mengukur dan memberi tanda pada
ruangan pada gambar)
Panjang ruangan pada gambar 4 kali panjang tali. Lebar ruangan pada gambar 3 kali panjang tali.
(menggunakan garis skala untuk mengukur dan memberi tanda pada setiap rute)
A ke B = 2,5 kali garis skala = 2,5 x 5 km = 12,5 km B ke C = 1,5 kali garis skala = 1,5 x 5 km = 7,5 km C ke D = 2 kali garis skala = 2 x 5 km = 10 km D ke A = 3 kali garis skala 3 x 5 km = 15 km

173
5. Untuk membuat biskuit yang lezat, takaran yang pas adalah 6 sdt (sendok teh) gula
untuk setiap 9 sdm (sendok makan) terigu. Dalam empat hari berturut-turut, Bu Dita
membuat biskuit dengan takaran gula yang berbeda.
Hari ke- Takaran gula (sdt)
1 12
2 3
3 18
4 9
Tentukan berapa sdm terigu yang digunakan Bu Dita pada hari ke-1, 2, 3, dan 4.
6 sdt gula untuk 9 sdm terigu

174
POSTTEST AND EXAMPLES OF EXPECTED ANSWER
Waktu mengerjakan 30 menit
Kerjakan sendiri
Tulis jawaban pada kotak yang telah disediakan
Gunakan bagian yang masih kosong sebagai tempat untuk menghitung
1. Apa yang kamu ketahui tentang perbandingan? Gunakan gambar, kalimat, simbol, dll
untuk menjelaskan.
2.
Manakah di antara dua pernyataan berikut yang merupakan perbandingan? Jelaskan
alasanmu.
Pernyataan A: Panjang pita abu-abu 3 meter lebih panjang dari pita hitam.
Pernyataan B: Panjang pita abu-abu 2 kali panjang pita hitam.
Dengan uang Rp 1.000,00, saya bisa membeli 3 permen
Pernyataan B: Panjang tali biru 4 kali panjang tali merah
Pernyataan kedua membandingkan dua ukuran dan menyatakannya dengan
“kali”. Sedangkan pernyataan pertama merupakan selisih.
6 m 3 m

175
3. Bantu tukang bangunan untuk mengukur panjang dan lebar suatu ruangan (persegi
panjang hitam) dengan menggunakan tali pada gambar.
4. Sebuah kapal berangkat dari Pelabuhan A untuk mengirimkan barang ke Pelabuhan B,
Pelabuhan C, Pelabuhan D, dan kembali ke Pelabuhan A. Garis hitam adalah rute kapal
tersebut. Panjang garis skala di bawah mewakili 10 km jarak sebenarnya.
Soal: Tentukan jarak sebenarnya ketika kapal berlayar dari satu pelabuhan ke
pelabuhan yang lain.
= 10 km
(menggunakan tali pada gambar untuk mengukur dan memberi tanda pada
ruangan pada gambar)
Panjang ruangan pada gambar 6 kali panjang tali. Lebar ruangan pada gambar 4 kali panjang tali.
RUANG tali
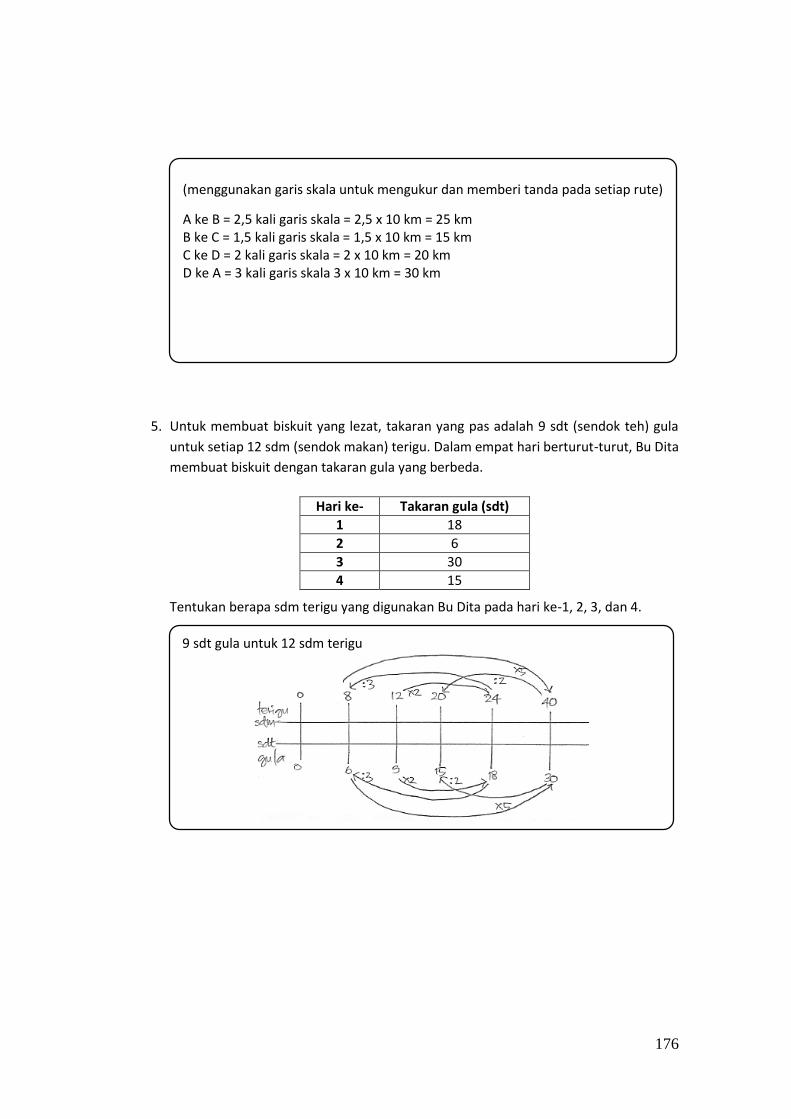
176
5. Untuk membuat biskuit yang lezat, takaran yang pas adalah 9 sdt (sendok teh) gula
untuk setiap 12 sdm (sendok makan) terigu. Dalam empat hari berturut-turut, Bu Dita
membuat biskuit dengan takaran gula yang berbeda.
Hari ke- Takaran gula (sdt)
1 18
2 6
3 30
4 15
Tentukan berapa sdm terigu yang digunakan Bu Dita pada hari ke-1, 2, 3, dan 4.
(menggunakan garis skala untuk mengukur dan memberi tanda pada setiap rute)
A ke B = 2,5 kali garis skala = 2,5 x 10 km = 25 km B ke C = 1,5 kali garis skala = 1,5 x 10 km = 15 km C ke D = 2 kali garis skala = 2 x 10 km = 20 km D ke A = 3 kali garis skala 3 x 10 km = 30 km
9 sdt gula untuk 12 sdm terigu
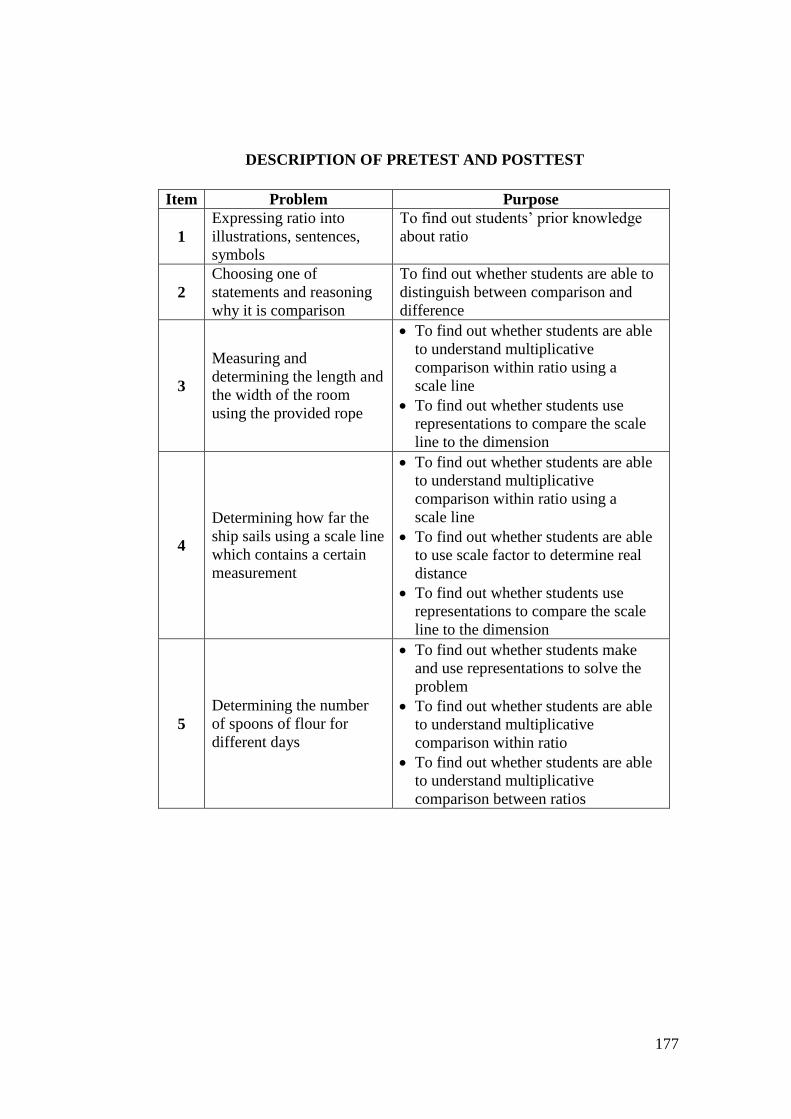
177
DESCRIPTION OF PRETEST AND POSTTEST
Item Problem Purpose
1
Expressing ratio into
illustrations, sentences,
symbols
To find out students’ prior knowledge
about ratio
2
Choosing one of
statements and reasoning
why it is comparison
To find out whether students are able to
distinguish between comparison and
difference
3
Measuring and
determining the length and
the width of the room
using the provided rope
To find out whether students are able
to understand multiplicative
comparison within ratio using a
scale line
To find out whether students use
representations to compare the scale
line to the dimension
4
Determining how far the
ship sails using a scale line
which contains a certain
measurement
To find out whether students are able
to understand multiplicative
comparison within ratio using a
scale line
To find out whether students are able
to use scale factor to determine real
distance
To find out whether students use
representations to compare the scale
line to the dimension
5
Determining the number
of spoons of flour for
different days
To find out whether students make
and use representations to solve the
problem
To find out whether students are able
to understand multiplicative
comparison within ratio
To find out whether students are able
to understand multiplicative
comparison between ratios

178
APPENDIX D
KELAS 5
Perbandingan
dan Skala
Panduan Guru Bahan Ajar dan Catatan untuk Guru
Perbandingan dan Skala

32
29
26
22
18
i
DAFTAR ISI
Fokus Unit ................................................................................................................ ii
Konsep Dasar yang Dimiliki ...................................................................................... ii
Tentang Model ......................................................................................................... ii
Perkembangan Model ............................................................................................. iii
Peran Guru .............................................................................................................. iv
Perencanaan............................................................................................................ iv
Istilah Penting ........................................................................................................... v
Konsep Penting ........................................................................................................ v
PERTEMUAN 1 ......................................................................................................... 1
PERTEMUAN 2 ......................................................................................................... 6
PERTEMUAN 3 ....................................................................................................... 10
PERTEMUAN 4 ....................................................................................................... 14
PERTEMUAN 5 ....................................................................................................... 16
LKS 1 ......................................................................................................................
LKS 2 ......................................................................................................................
LKS 3 ......................................................................................................................
LKS 4 ......................................................................................................................
LKS 5 ......................................................................................................................

ii
Fokus Unit
Siswa menginvestigasi konsep yang berhubungan dengan perbandingan dan skala pada
konteks peta dan liburan. Fokus unit ini adalah untuk:
Menggunakan garis skala untuk memahami hubungan perkalian antar bilangan dalam
suatu perbandingan
Menggunakan garis bilangan ganda untuk memahami hubungan perkalian antar
bilangan dalam suatu perbandingan dan antar perbandingan
Mengenal perbandingan sebagai unit komposit
Menggunakan model untuk menyelesaikan soal
Konsep Dasar yang Dimiliki
Pada unit ini, siswa diasumsikan telah memahami konsep sebagai berikut:
Estimasi
Perbandingan
Bentuk pecahan dan desimal
Perkalian dan pembagian
Tentang Model
Garis bilangan ganda adalah model yang digunakan untuk membantu siswa
menyelesaikan permasalahan mengenai perbandingan. Bilangan pada garis bilangan
ganda terurut, sehingga memudahkan siswa untuk mengetahui hubungan antar bilangan.
Dengan menggunakan garis bilangan ganda, siswa diharapkan dapat menyadari hubungan
perkalian antar bilangan dalam suatu perbandingan maupun antar perbandingan. Model
garis bilangan ganda berupa ilustrasi yang tidak hanya dapat membantu siswa dalam
memahami perbandingan, tetapi juga guru. Dengan menggunakan garis bilangan ganda,
guru dapat membantu siswa dalam memahami dan menunjukkan hubungan perkalian
antar bilangan pada suatu perbandingan maupun antar perbandingan.

iii
Perkembangan Model
Pertemuan 1
Siswa membuat garis skala mereka sendiri untuk
memahami hubungan perkalian antara panjang
referensi dengan panjang benda
Pertemuan 2
Siswa bekerja dengan garis skala ganda yang memuat
ukuran pasti jarak dalam peta (cm). Dalam pertemuan
ini, siswa menggunakan model untuk memahami
hubungan bilangan dalam suatu perbandingan dan
antar perbandingan
Pertemuan 3
Siswa dapat mengurutkan bilangan pada rute yang
dibentangkan sebagai model. Pada pertemuan ini,
ukuran dalam membuat model dapat diabaikan. Fokus
permasalahan adalah mencari hubungan antar
bilangan.
Pertemuan 4 dan 5
Siswa dapat memahami bahwa bilangan pada model
harus terurut. Selain itu, siswa menggunakan garis
bilangan ganda untuk memahami dan menunjukkan
hubungan perkalian antar perbandingan. Siswa juga
dapat mempelajari perbandingan senilai dengan
menggunakan model.
50 km 0
0 1 2 3
25
4 cm

iv
Peran Guru
Diskusi antar siswa dan diskusi kelas menjadi perhatian pada pembelajaran ini.
Untuk memancing terjadinya diskusi, peran guru sangat dibutuhkan. Guru diharapkan
dapat memberikan pertanyaan yang memancing siswa untuk berpikir dan berdiskusi.
Penting bagi guru untuk menarasikan soal pada LKS dan memberikan siswa waktu untuk
berpikir dan berdiskusi dengan siswa yang lain.
Ketika siswa mengerjakan permasalahan pada LKS, guru dapat berkeliling untuk
mengetahui kesulitan siswa. Selain itu, guru juga mempunyai kesempatan untuk memilih
jawaban siswa yang menarik yang dapat dibahas ketika diskusi kelas. Dalam diskusi kelas,
guru dapat mengundang siswa untuk membandingkan dan memberikan komentar
pekerjaan siswa. Penting bagi guru dalam diskusi untuk mengajak siswa melihat hubungan
antar bilangan dalam suatu rasio maupun antar rasio dengan menggunakan hubungan
perkalian.
Perencanaan
Hari
ke-
Alokasi
Waktu Konteks Tujuan
1
2 x 35
menit
Denah Siswa dapat menggunakan garis skala untuk memahami hubungan perkalian dalam suatu perbandingan
2 Peta
Siswa dapat menggunakan garis skala ganda untuk memahami hubungan dalam suatu perbandingan dan antar perbandingan
3 Peta dan perjalanan Siswa dapat mengurutkan bilangan pada rute yang dibentangkan untuk memahami hubungan antar perbandingan
4 Liburan
Siswa dapat memahami bahwa bilangan pada garis bilangan ganda terurut dan dapat menyatakan hubungan perkalian antar perbandingan
5 Berbelanja
Siswa dapat merumuskan informasi pada permasalahan dalam model dan memahami bahwa perkalian dan pembagian digunakan untuk menentukan perbandingan senilai

v
Istilah Penting
garis skala (pertemuan 1) garis yang memuat skala tertentu
garis skala ganda (pertemuan 2) garis yang memuat dua skala berbeda namun kedua skala
tersebut berhubungan. Garis skala ganda digunakan untuk membandingkan jarak pada
peta dan jarak sebenarnya
garis bilangan ganda (pertemuan 4) garis bilangan yang memuat dua besaran dan
menyatakan perbandingan tertentu
Konsep Penting
rasio perbandingan dua besaran
skala perbandingan antara jarak pada peta dengan jarak sebenarnya
perbandingan senilai beberapa perbandingan yang mempunyai nilai yang sama
unit komposit perbandingan A:B, untuk setiap A unit terdapat B unit dan untuk setiap B
unit terdapat A unit
hubungan perkalian dua bilangan dapat dinyatakan sebagai perkalian satu sama lain

1
PERTEMUAN 1
Alokasi waktu: 2 x 35 menit
Tujuan pembelajaran: Siswa dapat menggunakan garis skala.
Siswa dapat menggunakan panjang referensi untuk mendeskripsikan panjang
suatu benda
Siswa dapat menggunakan garis skala untuk mendeskripsikan panjang
sebenarnya suatu benda
Siswa dapat membuat dan menggunakan garis skala pada denah
Alat dan bahan:
Secarik kertas
LKS 1
Aktivitas 1
Soal 1 (15 menit)
1. Untuk membuka pertemuan, guru dapat menarasikan pertanyaan soal nomor
1 kepada siswa. Beri siswa waktu untuk berpikir dan berdiskusi dengan siswa
lain. Minta siswa untuk memberikan alasan dalam memilih satu di antara dua
pernyataan.
2. Bagi siswa yang bingung untuk memberikan alasan atau menyatakan bahwa
pernyataan tersebut merupakan perbandingan, ajukan pertanyaan mengenai
ukuran unit laptop dan meja. Lalu minta siswa untuk membandingkan ukuran
kedua unit.
3. Dalam diskusi kelas, bantu siswa untuk melihat pernyataan tersebut sebagai
selisih. Jelaskan bahwa selisih dan perbandingan berbeda. Selisih menyatakan
perbedaan. Guru dapat memberikan contoh, misalnya:
“Panjang laptop 30 cm dan panjang meja 90 cm. Selisih panjang kedua benda
tersebut adalah 60 cm. Jadi, panjang meja 60 cm lebih panjang dari panjang
laptop.”

2
Bantu siswa untuk memahami hubungan perkalian dalam suatu perbandingan
dengan memberikan contoh.
“Panjang laptop 30 cm dan panjang meja 90 cm. Perbandingan panjang kedua
benda tersebut adalah 30 cm:90 cm atau 1:3. Jadi, panjang meja adalah 3 kali
panjang laptop.”
Contoh jawaban siswa:
Soal 2 (15 menit)
1. Guru membuka pembelajaran dengan menunjukkan gambar denah suatu
ruangan yang bertujuan untuk memancing siswa berpikir tentang garis skala.
Untuk membantu siswa, guru dapat bertanya beberapa pertanyaan pada siswa:
“Apa yang kamu ketahui tentang skala?”
“Dimana kamu menemukan skala selain pada denah?”
“Bagaimana mengilustrasikan skala menjadi gambar?”
Guru dapat memberi tahu siswa bahwa skala dapat digambarkan dalam
berbagai cara. Misalnya pada denah, skala dapat dituliskan dengan
menggunakan bilangan atau digambarkan menjadi garis skala. Jika siswa tidak
familiar dengan istilah garis skala, guru dapat memberi tahu bahwa garis skala
adalah garis yang memuat ukuran tertentu.
2. Guru dapat bertanya bagaimana siswa dapat mengukur panjang dan lebar
ruang tidur pada denah. Jika siswa mengajukan mengukur dengan
menggunakan penggaris, guru dapat mengarahkan siswa untuk menggunakan
perabot pada denah. Setelah siswa dapat menggunakan salah satu perabot
pada denah untuk mengukur ruang tidur, guru dapat menarasikan soal 2.
3. Dalam diskusi kelas, guru dapat mengajak siswa untuk mendiskusikan bahwa
perbandingan yang didapat berbeda karena menggunakan referensi yang
Pernyataan Dea bukan perbandingan. Alasannya: pernyataan tersebut menyatakan selisih. Dalam menyatakan perbandingan, seharusnya pernyatan Dea adalah “ukuran meja x kali panjang laptop”.

3
berbeda. Selain itu, guru juga dapat mengaitkan soal 1 dengan soal 2 jika siswa
menyatakan panjang tembok dengan selisih.
Contoh jawaban siswa:
Soal 3 (15 menit)
1. Beri siswa waktu untuk membaca dan memahami soal. Guru dapat meminta
siswa untuk berdiskusi tentang cara menggunakan garis skala untuk mengukur
panjang kabel pada denah. Jika ada siswa yang menggunakan penggaris untuk
mengukur garis skala dan kabel pada denah, minta siswa untuk menggunakan
kertas dan menandai kertas tersebut dengan panjang yang sesuai dengan garis
skala. Lalu, minta siswa untuk mengukur kabel pada denah dan menentukan
panjang kabel sebenarnya.
2. Dalam diskusi kelas, guru dapat membahas bagaimana menggambar
perbandingan garis skala dengan panjang kabel. Selain itu, guru dapat
mengajukan pertanyaan sebagai berikut:
“Apa yang kamu ketahui tentang garis biru?”
“Garis skala menyatakan apa?”
“Mengapa kita memerlukan garis skala?”
“Bagaimana kamu dapat menggunakan garis skala?”
Saya menggunakan panjang tempat tidur untuk mengukur.
Panjang kamar mandi adalah 1 kali panjang tempat tidur.
Lebar kamar mandi adalah ¾ panjang tempat tidur.
Panjang kamar tidur adalah 1¼ panjang tempat tidur.
Lebar kamar tidur adalah 1½ panjang tempat tidur.

4
Contoh jawaban siswa:
Aktivitas 2 (25 menit)
1. Guru dapat membimbing siswa untuk memilih benda yang berukuran besar
sebagai referensi, misal papan tulis, penggaris papan tulis, jendela, pintu, dll
dan minta siswa untuk memperkirakan panjangnya. Guru dapat mengarahkan
siswa untuk menentukan referensi terdahulu, memperkirakan ukurannya, dan
menggambar garis skala.
2. Dalam diskusi kelas, guru dapat membahas mengapa denah yang digambar
siswa berbeda meskipun menggunakan referensi yang sama. Selain itu, apabila
pekerjaan siswa yang menggambar denah terlebih dahulu dapat didiskusikan
bersama. Apakah denah yang digambar siswa masuk akal jika dibandingkan
dengan ukuran kelas sebenarnya.
3. Untuk menutup pertemuan, guru dapat memberikan pertanyaan terkait
dengan pertanyaan pada kolom refleksi. Selain itu, guru dapat mengajak siswa
untuk menyimpulkan perbedaan antara perbandingan dengan selisih. Guru
dapat membantu siswa memahami hubungan perkalian dalam suatu
perbandingan.
1. Berikut adalah gambarku.
Panjang garis oranye adalah 2x garis skala. Jadi, panjang kabel oranye sebenarnya adalah 2m.
2. Berikut adalah gambarku.
Panjang garis hijau adalah 3x garis skala. Jadi, panjang kabel hijau sebenarnya adalah 3m.
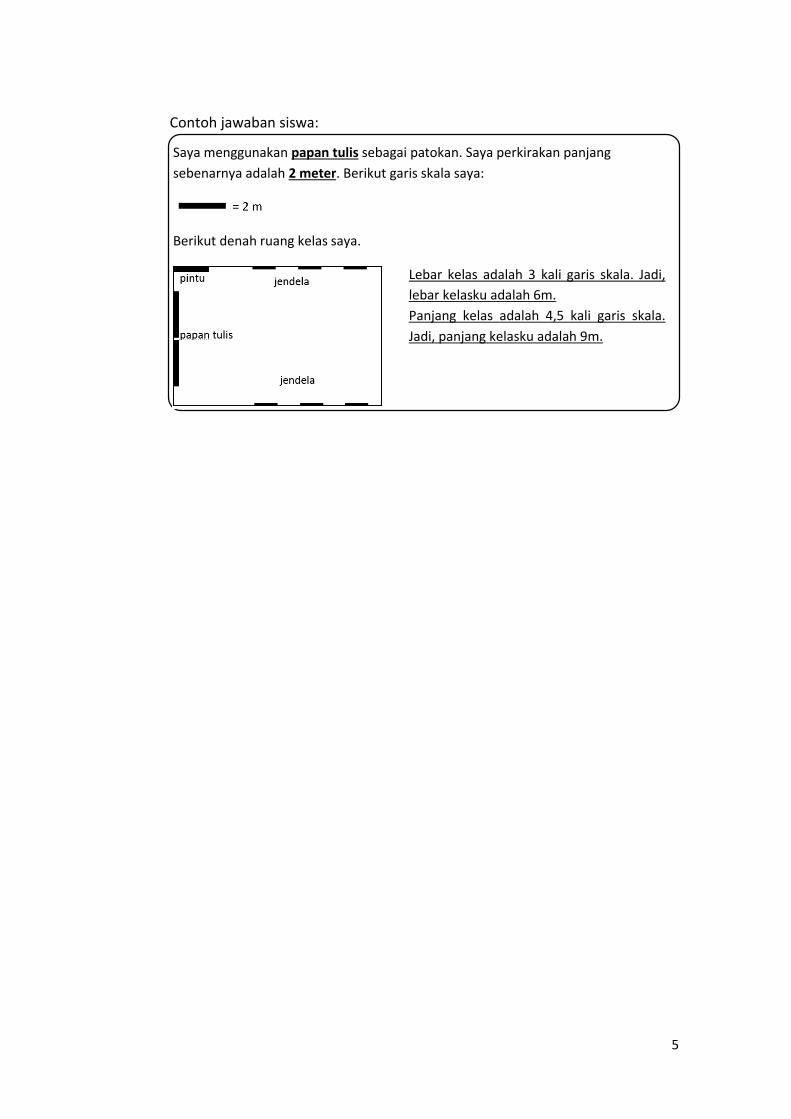
5
Contoh jawaban siswa:
Saya menggunakan papan tulis sebagai patokan. Saya perkirakan panjang
sebenarnya adalah 2 meter. Berikut garis skala saya:
Berikut denah ruang kelas saya.
Lebar kelas adalah 3 kali garis skala. Jadi,
lebar kelasku adalah 6m.
Panjang kelas adalah 4,5 kali garis skala.
Jadi, panjang kelasku adalah 9m.

6
PERTEMUAN 2
Alokasi waktu: 2 x 35 menit
Tujuan pembelajaran: Siswa dapat menggunakan garis skala ganda
Siswa dapat menggunakan informasi mengenai jarak sebenarnya dan jarak
pada peta untuk menentukan peta mana yang sesuai dengan garis skala ganda
yang ada
Siswa dapat menggambarkan hubungan antara jarak pada peta dan jarak
sebenarnya dengan menggunakan garis skala ganda
Siswa dapat menggunakan garis skala ganda untuk menentukan jarak
sebenarnya
Alat dan bahan:
Penggaris
LKS 2
Aktivitas 1
Soal 1 (20 menit)
1. Untuk membuka pertemuan, guru dapat memberikan pertanyaan terkait
dengan peta dan mendiskusikan pertanyaan berikut dengan siswa:
“Informasi apa yang kalian dapat dari peta?”
“Pernah kah kalian melihat garis skala ganda pada peta?”
“Mengapa namanya garis skala ganda?”
“Menurut kalian, apa hubungan garis skala dengan garis skala ganda?”
Bagi siswa, istilah “garis skala ganda” mungkin adalah hal baru. Guru dapat
menulis istilah tersebut di papan tulis. Dari diskusi pada pembukaan, guru
dapat membantu siswa untuk menyimpulkan mengenai garis skala ganda.
2. Setelah mendiskusikan pertanyaan tersebut, guru dapat menarasikan soal 1
pada siswa. Guru dapat meminta siswa untuk saling berdiskusi dalam
menyelesaikan soal.
3. Dalam diskusi kelas, guru dapat bertanya bagaimana siswa dapat menentukan

7
peta yang sesuai dengan garis skala ganda yang tersedia. Selain itu, guru dapat
mengaitkan dengan bertanya mengenai perbandingan pada peta:
“Apa yang kamu ketahui tentang perbandingan?”
“Apakah menurutmu skala adalah perbandingan? Mengapa?”
Dalam diskusi kelas ini, guru dapat membantu siswa untuk memahami
hubungan perkalian dalam suatu perbandingan dengan menggunakan garis
skala ganda. Selain itu, penting bagi guru untuk membahas apa yang terjadi jika
peta yang lain menggunakan garis skala ganda yang tersedia.
Contoh jawaban siswa:
Soal 2 (20 menit)
1. Soal 2 merupakan lanjutan soal 1. Guru meminta siswa untuk berdiskusi
menggambar garis skala ganda untuk kedua peta yang lain. Guru perlu
mengingatkan siswa mengenai informasi yang terkandung pada garis skala
ganda, yaitu jarak pada peta dan jarak sebenarnya. Dengan menggunakan dua
informasi ini, siswa dapat menggambar garis skala ganda. Dalam menggambar
garis skala ganda, guru perlu menekankan kepada siswa untuk menggunakan
penggaris. Garis skala ganda berhubungan dengan gambaran jarak. Oleh
karena itu, dalam menggambarkan garis skala ganda, siswa harus melakukan
pengukuran dengan tepat. Guru perlu mengingatkan siswa bahwa garis skala
ganda harus memuat informasi yang sesuai. Jika tidak ada informasi pada garis
skala ganda, maka garis skala ganda tidak akan bermakna.
2. Pada diskusi kelas, guru membahas hubungan perkalian dalam suatu
Yang sesuai dengan garis skala ganda adalah peta B.
Jika kita ukur jarak antara kedua kota pada peta dan menggunakan garis skala
ganda untuk menentukan jarak sebenarnya, peta B mendekati perkiraan.
Jika garis skala ganda digunakan pada peta A, maka jarak sebenarnya antara Gresik
dan Surabaya akan lebih dari 15 km.
Jika garis skala ganda digunakan pada peta C, maka jarak sebenarnya antara Gresik
dan Surabaya akan kurang dari 15 km.

8
perbandingan dengan menggunakan garis skala ganda. Pada garis skala ganda,
garis bagian bawah bisa dibagi menjadi beberapa bagian yang sama. Hal ini
memudahkan siswa untuk membagi garis menjadi beberapa bagian yang sama
besar. Guru dapat menggunakan garis skala ganda untuk mengenalkan
hubungan perkalian antara perbandingan sebagai pengantar ke soal
berikutnya.
Contoh jawaban siswa:
Aktivitas 2 (30 menit)
1. Guru dapat menarasikan konteks pada soal aktivitas 2. Jika perlu, guru dapat
bertanya kepada siswa mengenai informasi yang terkait untuk menentukan
jarak yang ditempuh oleh Edi dan keluarga tiap harinya. Dengan menggunakan
persoalan sebelumnya, guru dapat bertanya apa yang siswa ketahui dari garis
skala ganda. Selanjutnya, guru dapat meminta siswa untuk berdiskusi
menggunakan garis skala ganda untuk menentukan jarak yang ditempuh Edi
dan keluarganya.
2. Dalam diskusi kelas, guru dapat bertanya mengenai hubungan perkalian dalam
suatu perbandingan dan hubungan bilangan yang menunjukkan jarak pada
peta. Selain itu, guru dapat meminta siswa untuk menunjukkan hubungan
tersebut pada garis skala ganda.
3. Sebelum guru menutup pertemuan kedua, guru dapat mengajukan pertanyaan
sebagai berikut sebagai bahan refleksi:
“Apa perbedaan antara garis skala dengan garis skala ganda?”
“Apa kesamaan antara garis skala dengan garis skala ganda?”
Peta A Peta C
30 km 0
0 1 2 3
15
4 cm
30 km 0
0 1 2 cm
15

9
Contoh jawaban siswa:

10
PERTEMUAN 3
Alokasi waktu: 2 x 35 menit
Tujuan pembelajaran:
Siswa dapat merepresentasikan hubungan antara jarak pada peta dan jarak
sebenarnya
Siswa dapat mengurutkan bilangan yang diketahui pada model untuk
menentukan jarak sebenarnya
Siswa dapat menggunakan model untuk menunjukkan hubungan antar
bilangan
Alat dan bahan:
LKS 3
Soal 1a (15 menit)
1. Untuk membuka pertemuan, guru dapat menarasikan soal dan mengingatkan
siswa mengenai garis skala ganda.
2. Apabila siswa kesulitan merepresentasikan hubungan antara jarak pada peta
dan jarak sebenarnya, guru dapat mengingatkan siswa tentang menggambar
garis skala ganda pada pertemuan sebelumnya. Selain itu, ingatkan siswa untuk
menggambar dan menuliskan informasi yang sesuai.
3. Dalam diskusi kelas, guru dapat membahas kesulitan siswa dalam menggambar
garis skala ganda.
Contoh jawaban siswa:
Soal 1b (25 menit)
1. Pada soal ini, guru memberitahu siswa untuk tidak menghiraukan jarak antar
bilangan seperti ketika menggunakan garis skala ganda. Selain itu, meskipun

11
siswa berhadapan dengan soal yang melibatkan jarak pada peta dan jarak
sebenarnya, model yang digunakan lebih formal dari garis skala ganda.
2. Apabila siswa tidak dapat mengurutkan bilangan yang diketahui pada model,
guru dapat mengingatkan siswa akan garis bilangan ganda.
3. Siswa mungkin mencari selisih dan menggunakan penjumlahan untuk
menentukan jarak sebenarnya. Guru dapat mendorong siswa untuk mengamati
hubungan antar bilangan dengan menggunakan perkalian dan pembagian.
4. Dalam diskusi kelas, guru dapat mendiskusikan jawaban siswa yang
menggunakan penjumlahan dan hubungan perkalian. Misalnya, guru dapat
bertanya apa kelemahan dan keuntungan menggunakan cara tersebut. Guru
dapat mengingatkan siswa bahwa perbandingan berkaitan dengan perkalian
dan pembagian sedangkan selisih berkaitan dengan penjumlahan dan
pengurangan.
5. Berikan siswa kesempatan untuk berpartisipasi dalam diskusi kelas. Guru dapat
mengatur alur diskusi dengan memberikan tanggapan atas pemikiran siswa.
Ajukan pertanyaan berikut:
“Bagaimana menurutmu tentang penjelasannya?”
“Bagaimana solusinya berbeda dengan solusimu?”
“Dapatkah kamu jelaskan apa yang telah ia katakan?”
Contoh jawaban siswa:
km
cm 0 10
200
2,5
20
5
100
4
80
K B N
: 2 x 2,5
: 2

12
Soal 2 (30 menit)
1. Pada soal ini, siswa menggambar model. Guru dapat memberikan petunjuk
bahwa garis bawah pada model digunakan untuk menuliskan besaran yang
diketahui sedangkan garis atas digunakan untuk menuliskan besaran yang
ditanyakan.
2. Apabila siswa tidak dapat mengurutkan bilangan yang diketahui pada model,
guru dapat mengingatkan siswa akan garis bilangan ganda.
3. Siswa mungkin mencari selisih dan menggunakan penjumlahan untuk
menentukan jarak sebenarnya. Guru dapat mendorong siswa untuk mengamati
hubungan antar bilangan dengan menggunakan perkalian dan pembagian.
4. Dalam diskusi kelas, guru dapat mendiskusikan jawaban siswa yang
menggunakan penjumlahan dan hubungan perkalian. Misalnya, guru dapat
bertanya apa kelemahan dan keuntungan menggunakan cara tersebut. Guru
dapat mengingatkan siswa bahwa perbandingan berkaitan dengan perkalian
dan pembagian sedangkan selisih berkaitan dengan penjumlahan dan
pengurangan.
5. Guru dapat mengarahkan siswa untuk menggunakan panah dan keterangan
dalam menghubungkan dua bilangan. Dengan menggunakan panah dan
keterangan, siswa akan lebih mudah mengamati hubungan antar bilangan.
6. Untuk menutup pertemuan, guru dapat menegaskan bahwa perbandingan dua
besaran yang berbeda juga merukapan rasio. Selain itu, penting bagi siswa
untuk tidak memperhatikan jarak antar bilangan karena model yang digunakan
berbeda dengan garis skala ganda.
7. Untuk memperkenalkan istilah “garis bilangan ganda” pada pertemuan
selanjutnya, guru dapat bertanya mengenai perbedaan dan kesamaan model
yang digunakan pada pertemuan 3 dengan garis skala ganda.

13
Contoh jawaban siswa:
l
km 0
16 2
200 25
0
50
8
100
4
K B N
x 2 x 2 x 2

14
PERTEMUAN 4
Alokasi waktu: 2 x 35 menit
Tujuan pembelajaran:
Siswa memahami bahwa bilangan pada model harus terurut
Siswa dapat menyatakan hubungan perkalian pada model untuk menentukan
rasio senilai
Alat dan bahan:
LKS 4
Pembelajaran
1. Untuk membuka pertemuan, guru dapat mengajukan pertanyaan mengenai
model pada pertemuan sebelumnya. Selain itu, kenalkan garis bilangan ganda
pada siswa. Berikut pertanyaan yang dapat diajukan:
“Pada pertemuan sebelumnya, ilustrasi apa yang biasa kalian buat?”
“Apa saja informasi yang kalian dapat dari ilustrasi tersebut?”
“Mengapa ilustrasi tersebut dinamakan garis bilangan ganda?”
“Apa kesamaan dan perbedaan antara garis bilangan ganda dan garis skala
ganda?”
2. Ketika siswa berdiskusi dan menyelesaikan permasalahan pada LKS, guru dapat
berkeliling untuk mengetahui kesulitan siswa. Kesulitan yang dihadapi siswa
dapat dibahas dalam diskusi kelas.
3. Apabila siswa tidak paham bahwa bilangan pada model harus terurut, guru
dapat mengingatkan siswa mengenai istilah garis bilangan.
4. Apabila siswa tidak menggunakan hubungan perkalian untuk menentukan
rasio senilai, guru dapat mengingatkan bahwa rasio atau perbandingan terkait
dengan perkalian dan pembagian.
5. Apabila kesulitan menentukan hubungan perkalian antar bilangan, guru dapat
menggunakan pecahan untuk membantu siswa.

15
6. Dalam diskusi kelas, penting bagi guru untuk menekankan bahwa dalam
menggunakan model, siswa tidak perlu memperhatikan jarak antar bilangan
selama bilangan tersebut terurut. Selain itu, guru dapat bertanya apakah
semua perbandingan pada model memiliki nilai yang sama. Pada diskusi ini,
penting bagi guru untuk menggali kemampuan siswa dalam menentukan
hubungan antar bilangan dengan menggunakan hubungan perkalian. Berikut
pertanyaan yang dapat diajukan:
“Bagaimana pekerjaan yang menggunakan penjumlahan dengan pekerjaan
yang menggunakan perkalian berbeda?”
“Di antara dua pekerjaan tersebut, manakah yang merupakan
perbandingan? Mengapa?”
“Dapat kah kalian menghubungkan bilangan satu dengan bilangan yang lain
selain seperti pekerjaan ini?”
Contoh jawaban siswa:
Soal a
Soal b
Soal c

16
PERTEMUAN 5
Alokasi waktu: 2 x 35 menit
Tujuan pembelajaran:
Siswa dapat memformulasikan informasi menjadi model matematika
Siswa memahami bahwa rasio senilai dapat ditentukan dengan menggunakan
hubungan perkalian
Alat dan bahan:
LKS 5
Pembelajaran
1. Ketika siswa berdiskusi dan menyelesaikan permasalahan pada LKS, guru dapat
berkeliling untuk mengetahui kesulitan siswa. Kesulitan yang dihadapi siswa
dapat dibahas dalam diskusi kelas.
2. Apabila siswa tidak tahu model yang harus digunakan, guru dapat
mengingatkan siswa tentang garis bilangan ganda.
3. Apabila siswa kesulitan dalam memahami informasi yang diberikan sebagai
perbandingan, guru dapat langsung menunjukkan perbandingan tersebut dan
meminta siswa untuk memformulasikan informasi yang tersedia ke dalam garis
skala ganda.
4. Apabila siswa tidak dapat memahami bahwa hubungan perkalian digunakan
untuk menentukan rasio senilai, guru dapat mengingatkan bahwa rasio atau
perbandingan terkait dengan perkalian dan pembagian.
5. Apabila kesulitan menentukan hubungan perkalian antar bilangan, guru dapat
menggunakan pecahan untuk membantu siswa.
6. Dalam diskusi kelas, penting bagi guru untuk menggali kemampuan siswa
dalam menentukan hubungan antar bilangan dengan menggunakan hubungan
perkalian. Berikut beberapa pertanyaan yang dapat diajukan:
“Apa yang kalian ketahui tentang perbandingan?”

17
“Dalam menggunakan garis bilangan ganda, hubungan perbandingan seperti
apa yang dapat kalian ketahui?”
“Bagaimana pekerjaan yang menggunakan penjumlahan dengan pekerjaan
yang menggunakan perkalian berbeda?”
“Di antara dua pekerjaan tersebut, manakah yang merupakan
perbandingan? Mengapa?”
“Dapat kah kalian menghubungkan bilangan satu dengan bilangan yang lain
selain seperti pekerjaan ini?”
Contoh jawaban siswa:
0 4 12 20
pie
Rp
36 44
135 45 15 75 165 0
:3 :3
x5
x11
0 1 3 5 porsi
Rp
9 11
135 45 15 75 165 0
:3
x5
:3
x11
Soal 1a
Soal 1b
Soal 2

18
Aktivitas 1
1. Dea membandingkan panjang laptop dengan panjang meja. Menurut Dea, ukuran meja dua satuan lebih panjang dari panjang laptop. Soal: Apakah pernyataan Dea merupakan perbandingan? Beri alasan.
2. Seorang arsitek membuat denah suatu apartemen namun ia tidak mencantumkan ukurannya. Soal: Bantu arsitek untuk mengukur panjang garis merah dan biru yang merupakan panjang dan lebar kamar mandi dan kamar tidur.
Petunjuk: ● pilih salah satu perabot rumah tangga di bawah ini Petunjuk: ● gunakan panjang atau lebar perabot untuk mengukur
KAMAR MANDI
KAMAR TIDUR
tempat tidur
sofa
lemari
Pernyataan Dea _______________________________________. Alasannya:
LKS 1 NAMA:

19
Lengkapi pernyataan berikut.
3. Garis oranye dan hijau menunjukkan letak kabel dalam kamar. Garis biru (garis skala) menunjukkan bahwa panjang sebenarnya adalah 1 m. Soal: Tentukan panjang kabel sebenarnya. Petunjuk: ● buat gambar yang membandingkan panjang garis biru (garis skala)
dengan kabel pada gambar Petunjuk: ● tentukan berapa kali garis biru sehingga panjangnya sama dengan
panjang kabel pada gambar
Lengkapi pernyataan berikut.
Saya menggunakan _______________________________ untuk mengukur. Panjang kamar mandi adalah ____________________________________.
Lebar kamar mandi adalah _______________________________________. Panjang kamar tidur adalah ______________________________________. Lebar kamar tidur adalah _____________________________________.
1. Berikut adalah gambarku.
Panjang garis oranye adalah ______________________. Jadi, panjang kabel oranye sebenarnya adalah _________.
2. Berikut adalah gambarku.
Panjang garis hijau adalah _______________________. Jadi, panjang kabel hijau sebenarnya adalah _________.
= 1 m
DAPUR &
RUANG
TAMU
KAMAR
TIDUR

20
Aktivitas 2
Buat denah ruang kelasmu dan lengkapi pernyataan yang tersedia.
Petunjuk: ● pilih satu benda di kelas yang dapat dijadikan patokan
● perkirakan ukuran sebenarnya
● buat garis skala yang mewakili ukuran patokan pada denah
● jelaskan ukuran ruang kelasmu
Saya menggunakan ______________________ sebagai patokan. Saya perkirakan panjang sebenarnya adalah ___________. Berikut garis skala saya: Berikut denah ruang kelas saya.

21
Gunakan kata-kata, gambar, simbol, dan lain-lain untuk menjelaskan apa yang
kamu ketahui tentang garis skala.
Jelaskan dengan menggunakan kata-kata, gambar, simbol, dan lain-lain
Hal baru dan hal penting yang saya pelajari:

22
Aktivitas 1
1. Berikut adalah tiga peta dengan ukuran yang berbeda.
LKS 2 NAMA:
GRESIK
SURABAYA
Peta A
GRESIK
SURABAYA
Peta B
GRESIK
SURABAYA
Peta C

23
Suatu peta biasanya mempunyai garis skala ganda. Di bawah ini adalah garis
skala ganda.
Diketahui: Jarak terpendek dari Gresik ke Surabaya adalah 15 km
Soal: Tentukan peta mana yang sesuai dengan garis skala ganda. Apa yang
terjadi pada peta yang lain jika menggunakan garis skala ganda tersebut?
2. Buat garis skala ganda untuk peta yang lain.
15 30 km 0
0 1 2 3 cm

24
Aktivitas 2
Perhatikan peta di bawah.
Edi dan keluarga tinggal di Madiun. Mereka akan melakukan perjalanan ke
beberapa kota dengan menggunakan mobil ketika liburan. Tiap hari, mereka akan
pergi ke kota yang berbeda.
Edi ingin tahu berapa jarak yang akan mereka tempuh setiap harinya. Gunakan
garis skala ganda di bawah untuk membantu Edi mengetahui jarak sebenarnya
yang akan ditempuh tiap harinya.
0
0 cm
km
3
60
MADIUN
NGAWI
BOJONEGORO
MALANG
Hari 1
Hari 2
Hari 3
30 60 km 0
0 1 2 3 cm

25
Apa yang kamu ketahui tentang garis skala ganda?
Jelaskan dengan menggunakan kata-kata, gambar, simbol, dan lain-lain
Hal baru dan hal penting yang saya pelajari:

26
1. Pak Nyoman punya bisnis tur di Denpasar. Ia menyusun jadwal tur untuk para
turis ke 3 tempat berbeda. Berikut rutenya.
Diketahui: Pak Nyoman tahu bahwa 4 cm pada peta menunjukkan 80 km pada
jarak sebenarnya.
a. Buat garis skala ganda untuk peta tersebut.
b. Pak Nyoman mengukur panjang rute tiap tujuan dari Denpasar di peta.
Berikut hasilnya.
Tujuan Panjang rute pada peta (cm)
Klungkung 2,5
Batur 5
Negara 10
Jika rutenya dibentangkan menjadi suatu garis, maka akan menjadi seperti
gambar di halaman selanjutnya.
Soal: Tentukan panjang rute sebenarnya dari Denpasar ke tiap tujuan.
Berikut garis skala ganda peta tersebut:
DENPASAR
KLUNGKUNG
BATUR
NEGARA
LKS 3 NAMA:

27
Petunjuk: ● Tulis panjang rute pada peta untuk setiap tujuan pada garis yang
tersedia di halaman selanjutnya
Petunjuk: ● Tunjukkan perhitunganmu dengan menggunakan garis tersebut
Petunjuk: ● Beri keterangan nama daerah pada garis tersebut
2. Pak Nyoman ingin memberi tahu sopir bus mengenai konsumsi bahan bakar
untuk mencapai tujuan. Ia tahu bahwa 2 liter bahan bakar dapat digunakan
untuk bepergian sejauh 25 km.
Soal: Buat dan gunakan gambar seperti nomor 1b untuk mengetahui konsumsi
bahan bakar ke setiap tujuan.
Denpasar
km
cm
0
0

28
Beri contoh lain tentang perbandingan dua hal berbeda dalam topik perjalanan.
Jelaskan dengan menggunakan kata-kata, gambar, simbol, dan lain-lain
Hal baru dan hal penting yang saya pelajari:

29
Pak Nyoman menyediakan 3 bus untuk 3 daerah wisata yang berbeda. Berikut rute
tujuan wisata yang disusun Pak Nyoman dari Denpasar.
a. Jika tidak ada kemacetan di Bali, dibutuhkan 36 menit untuk bepergian sejauh
24 km. Tentukan waktu yang dibutuhkan untuk melakukan perjalanan dari
Denpasar ke setiap daerah tujuan.
Petunjuk: Lengkapi dan gunakan garis bilangan ganda di bawah untuk
menunjukkan perhitungan.
km
menit 0
0
36
24
Denpasar
DENPASAR
KLUNGKUNG
BATUR
SINGARAJA
60 km
40 km
80 km
LKS 4 NAMA:

30
b. Ketika bepergian ke Ubud yang jaraknya 20 km dari Denpasar, bus
menghabiskan 2 liter solar. Tentukan konsumsi solar yang diperlukan untuk
menuju setiap daerah tujuan dengan menggunakan garis bilangan ganda.
c. Pak Nyoman memberi tahu semua sopir bahwa ia membayar Rp 60.000,00 tiap
kali membeli 10 liter solar. Bantu sopir untuk menghitung uang yang akan
dibayar untuk mengisi solar ke setiap daerah tujuan.

31
Beri contoh perbandingan pada topik selain peta dan perjalanan.
Berikan pendapatmu ketika menggunakan garis bilangan ganda untuk
menyelesaikan soal perbandingan.
Jelaskan dengan menggunakan kata-kata, gambar, simbol, dan lain-lain
Hal baru dan hal penting yang saya pelajari:

32
1. Saat berlibur ke Bali, Adam dan teman-teman membeli pie susu. Berikut keterangan mesin kasir ketika Adam akan membayar pie susu yang dia beli.
a. Elsa membeli 20 pie, Doni membeli 44 pie, dan Rita membeli 12 pie. Tentukan uang yang harus dibayar tiap orang.
b. Setelah berbelanja, Adam dan teman-teman menuju warung makan. Setelah melihat menu, Adam yang menghabiskan Rp 135.000,00 untuk membeli pie susu mengetahui bahwa uang tersebut sama dengan harga 9 porsi nasi bali.
Tentukan berapa porsi nasi bali masing-masing yang dapat dibeli Elsa, Doni,
dan Rita dengan menggunakan uang yang mereka bayar ketika membeli pie
susu.
135.000
36 pie
LKS 5 NAMA:

33
2. Desta berjalan-jalan di desa peternakan sapi dan bertemu dengan peternak sapi. Peternak sapi bercerita bahwa 8 sapi dapat menghabiskan 20 karung rumput tiap hari. Lalu Desta melanjutkan perjalanan dan menemukan tiga peternakan lain. Berikut daftar peternakan beserta banyak sapi di tiap peternakan:
Peternakan A B C
Banyak sapi 10 5 13
Tentukan banyak karung rumput yang dimakan oleh sapi-sapi di tiap
peternakan tiap hari.