developing a benchmarking model for construction projects ... · their construction projects to...
TRANSCRIPT

Journal of Construction Engineering and Management (JCEM), ASCE
(Final Accepted Manuscript), Volume 139, Issue 6, June 2013, Pages 705-716
1
Developing a Benchmarking Model for Construction
Projects in Hong Kong
John F.Y. Yeung1; Albert P.C. Chan2; Daniel W.M. Chan, M.ASCE3;
Y.H. Chiang4; and Huan Yang5
1 Lecturer I, College of International Education, School of Continuing Education,
Hong Kong Baptist University, Hong Kong; formerly Postdoctoral Fellow,
Department of Building and Real Estate, The Hong Kong Polytechnic University,
Hung Hom, Kowloon, Hong Kong, China (corresponding author). E-mail
address: [email protected]
2 Professor and Associate Dean, Faculty of Construction and Environment, The
Hong Kong Polytechnic University, Hung Hom, Kowloon, Hong Kong, China.
3 Associate Professor, Department of Building and Real Estate, The Hong Kong
Polytechnic University, Hung Hom, Kowloon, Hong Kong, China.
4 Professor, Department of Building and Real Estate, The Hong Kong
Polytechnic University, Hung Hom, Kowloon, Hong Kong, China.
5 Lecturer, Institute of Finance and Economics Research, Shanghai University of
Finance and Economics, Shanghai, China.
Abstract: This paper attempts to incorporate both leading and lagging KPIs and
apply the reliability interval method (RIM) to formulate a benchmarking model
to assess project success in Hong Kong. A list of leading and lagging KPIs was
complied based on a comprehensive literature review. This list of KPIs was used
to develop a survey questionnaire and RIM was subsequently used to analyze
the survey results and determine the relative importance and rankings of
various leading and lagging KPIs. The results reveal that the top 10 KPIs to
evaluate the success of construction projects in Hong Kong (in descending order)
were: (1) safety performance; (2) cost performance; (3) time performance; (4)
quality performance; (5) client’s satisfaction; (6) effectiveness of communication;
(7) end user’s satisfaction; (8) effectiveness of planning; (9) functionality; and (10)
environmental performance. Finally, a composite performance index (CPI) was
derived by means of RIM to provide a comprehensive assessment of
construction project success in Hong Kong. Different construction projects can
now be assessed on the same basis for benchmarking and project monitoring
This is the Pre-Published Version.
Journal of Construction Engineering and Management (JCEM), ASCE
(Final Accepted Manuscript), Volume 139, Issue 6, June 2013, Pages 705-716
2
purposes. Construction senior executives and project managers can thus use the
CPI to measure, evaluate and improve the performance of their construction
projects at various stages of the project life cycle (i.e. pre-planning phase,
planning phase, design phase, construction phase, and commissioning phase).
Although the CPI was developed locally in Hong Kong, the research methods
could be replicated elsewhere to produce similar indices for international
comparisons. Such an extension would enhance the understanding of managing
construction projects across different places.
CE Database subject headings: Benchmark; Construction management;
Hong Kong.
Author keywords: Benchmarking; Key performance indicators (KPIs);
Composite performance index (CPI); Reliability interval
method (RIM); Hong Kong.
Introduction
Over the past decade, many researchers have applied the concept of Key
Performance Indicators (KPIs) to conduct benchmarking studies in the
construction management discipline (Cox et al. 2003; Chan and Chan 2004; Lee
et al. 2005; Costa et al. 2006; Yeung et al. 2007, 2009). However, Beatham et al.
(2004) and Costa et al. (2006) criticized that the most significant problem with
the KPIs in their current format is that they do not offer the opportunity for
organizational change. They are designed to be used as ex-post “lagging”
KPIs, which are used to assess performance results of completed projects.
They do not offer the opportunity to change performance or alter the result of
associated performance of on-going projects. They are used only as a historic
review. Therefore, the use of leading KPIs was advocated to provide early
warnings, identify potential problems, and highlight any needs for further
investigation or actions. Leading KPIs do offer the opportunity to change.
They are measures of performance whose results are used to predict future
performance of the activity being measured and present the opportunity to
change practice accordingly, or to enable future decisions to be made on future
associated activities based on the outcome of previous activities. In fact, few, if
any, researchers have tried to incorporate both leading and lagging KPIs to
compile a Composite Performance Index (CPI) for measuring the overall
performance of construction projects, thus making benchmarking and project
monitoring ineffective. In addition, they seldom consider the impact of the
fuzziness of an individual KPI on the evaluation of the performance of a
Journal of Construction Engineering and Management (JCEM), ASCE
(Final Accepted Manuscript), Volume 139, Issue 6, June 2013, Pages 705-716
3
construction project. This paper, therefore, aims to incorporate both leading
and lagging KPIs and apply RIM to compile a CPI to assess the performance of
construction projects in Hong Kong. By doing so, different construction
projects can be evaluated on the same basis for benchmarking and project
monitoring purposes. Construction senior practitioners and project managers
can thus adopt the CPI to measure, evaluate and improve the performance of
their construction projects to achieve excellence at different stages of the project
life cycle.
Background of Study
Many researchers have conducted research on project performance evaluation
and benchmarking in the construction management discipline. Cox et al. (2003)
stated that there is a great need in the construction industry for identifying a set
of common indicators to be used by construction executives and project
managers in measuring construction performance at the project level. The
focus of the research was to collect management perceptions of the KPIs
currently utilized in the construction industry. They concluded that six
indicators, including (1) quality control; (2) on-time completion; (3) cost; (4)
safety; (5) $/unit; and (6) units/MHR were reported as being most useful by
every segment of the construction industry. Chan and Chan (2004) developed
a framework for measuring success of construction projects. The framework is
composed of a set of KPIs, which are measured both objectively and subjectively.
The validity of the proposed KPIs was also tested by three case studies. Lam et
al. (2007) developed a project success index (PSI) to benchmark the performance
of design-build projects from a number of KPIs. The findings showed that
time, cost, quality, and functionality should be the principal success criteria for
D&B projects. Yeung et al. (2007) developed a model using the Delphi survey
technique to objectively measure the performance of partnering projects in
Hong Kong. The results indicated that the top-7 weighted KPIs to evaluate the
success of partnering projects in Hong Kong were: (1) time performance; (2) cost
performance; (3) top management commitment; (4) trust and respect; (5) quality
performance; (6) effective communications; and (7) innovation and
improvement. Finally, a composite Partnering Performance Index (PPI) for
partnering projects in Hong Kong was derived to provide an all-round
assessment of partnering performance. Later, Yeung et al. (2009) applied the
same Delphi survey technique to formulate a model to assess the success of
relationship-based construction projects in Australia. The Delphi survey
selected eight KPIs to evaluate the success of relationship-based projects in
Australia. These KPIs included: (1) client’s satisfaction; (2) cost performance;
(3) quality performance; (4) time performance; (5) effective communication; (6)
Journal of Construction Engineering and Management (JCEM), ASCE
(Final Accepted Manuscript), Volume 139, Issue 6, June 2013, Pages 705-716
4
safety performance; (7) trust and respect; and (8) innovation and improvement.
An equation for calculating a performance index for relationship-based projects
in Australia has been finally derived. It should be highlighted that these
developed indices were composed of a set of lagging KPIs and they could be
used to measure, monitor, and improve the performance of their completed
construction partnering and relationship-based projects. This paper provides
an objective basis for measuring and predicting project performance at different
stages of the project life cycle by means of both leading and lagging KPIs.
Research Methodology
The research methods employed included: (1) a comprehensive and critical
literature review; (2) empirical questionnaire survey; and (3) weighting
assessment relating to the empirical questionnaire survey results by means of
RIM.
Literature Review
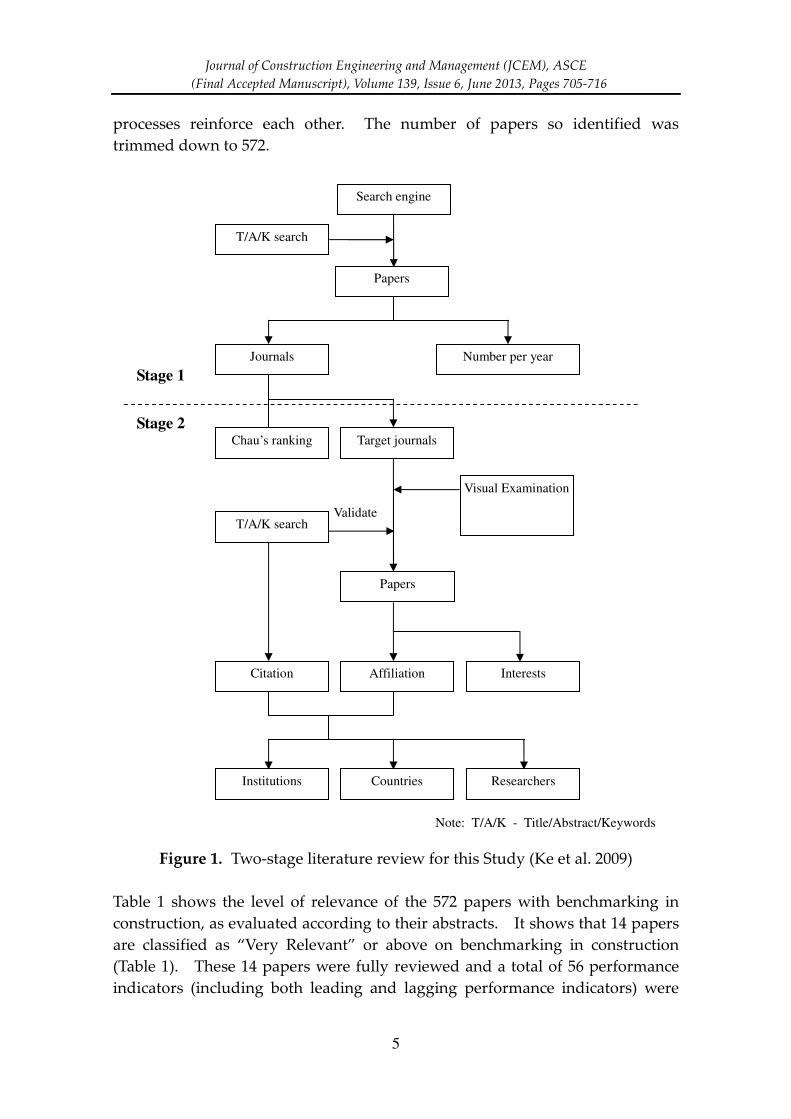
In order to acquire a clear understanding of benchmarking related research, this
study carried out a two-stage literature review to conduct a content analysis of
benchmarking related articles from 1998 to April of 2009, which is presented in
Figure 1.
In stage 1, the search engine “Scopus” was used to conduct the literature search
under the “Title/Abstract/Keyword” field. Search keywords included “Key
Performance Indicators”, “KPIs”, “Benchmark”, “Benchmarking”, “Project
Success”, “Performance Measurement”, “Performance Measure”, “Critical
Success Factors”, “CSFs”, “Critical Success Factor”, “CSF”, “Best Practice”,
“Best Practices”, and “Continuous Improvement”. Over thirty thousand
(30,766) articles were so identified on 14 April 2009. The search included many
irrelevant publications. To narrow down the search, only the construction
journals that have published the most benchmarking papers were chosen. The
results in stage 1 revealed that International Journal of Project Management,
Construction Management and Economics, Journal of Construction Engineering and
Management, Journal of Management in Engineering, and Engineering, Construction
and Architectural Management have published the most benchmarking related
papers in construction, and were thus selected as target journals in stage 2. As
Benchmarking: An International Journal has published the largest number of
benchmarking related studies, of which most are related to construction, it is
also included as a target journal in stage 2. It should be noted that these
journals were also ranked high in the ranking of Chau (1997). These selection
Journal of Construction Engineering and Management (JCEM), ASCE
(Final Accepted Manuscript), Volume 139, Issue 6, June 2013, Pages 705-716
5
processes reinforce each other. The number of papers so identified was
trimmed down to 572.
Figure 1. Two-stage literature review for this Study (Ke et al. 2009)
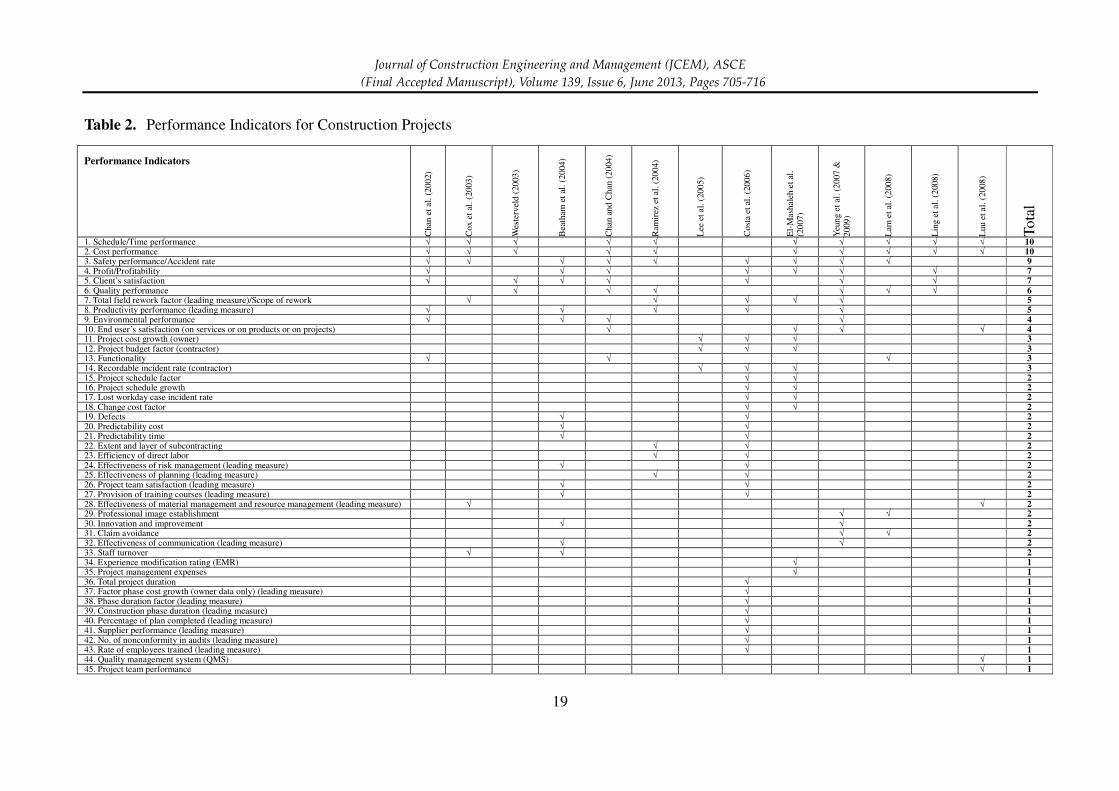
Table 1 shows the level of relevance of the 572 papers with benchmarking in
construction, as evaluated according to their abstracts. It shows that 14 papers
are classified as “Very Relevant” or above on benchmarking in construction
(Table 1). These 14 papers were fully reviewed and a total of 56 performance
indicators (including both leading and lagging performance indicators) were
Search engine
T/A/K search
Papers
Number per year Journals
Chau’s ranking
Stage 1
Stage 2 Target journals
Visual Examination
Affiliation
Institutions Countries
Papers
Interests Citation
T/A/K search
Researchers
Validate
Note: T/A/K - Title/Abstract/Keywords

Journal of Construction Engineering and Management (JCEM), ASCE
(Final Accepted Manuscript), Volume 139, Issue 6, June 2013, Pages 705-716
6
identified (Table 2). Since the meanings of some performance indicators are
similar in nature, they were combined together. For example, the meanings of
“cost performance”, “project cost growth (owner)”, “project budget factor
(contractor)”, “change cost factor”, “predictability cost”, “factor phase cost
growth (owner data only)”, and “phase cost factor (owner)” are similar in
nature, they are combined together as “cost performance”. Other performance
indicators, such as time performance, safety performance, and quality
performance, are combined in a similar way. By using this method, a total of
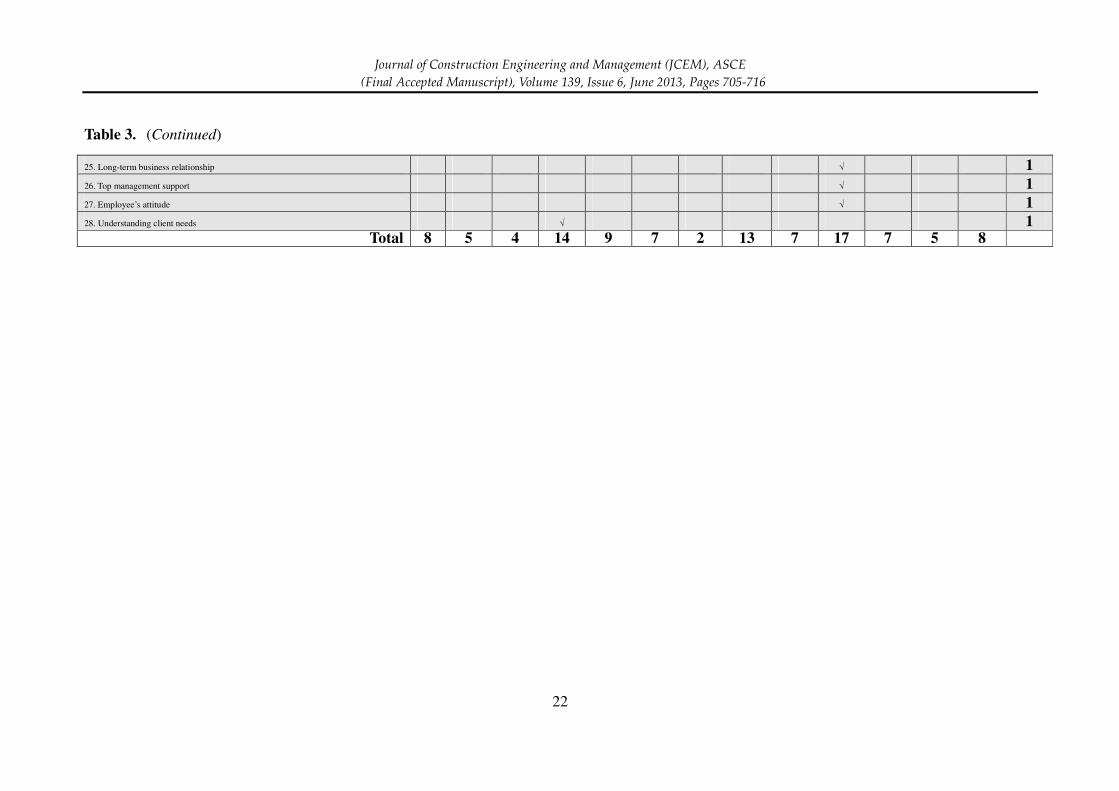
28 performance indicators were thus derived (Table 3). Furthermore, 8 of them
were cited for one time only, they were regarded as less important so they are
not chosen for further analysis. Finally, a total of 20 KPIs were selected for the
development of the survey questionnaire. It should be noted that 7 out of the
20 KPIs, including (1) productivity performance; (2) project team satisfaction; (3)
effectiveness of risk management; (4) effectiveness of planning; (5) provision of
training courses; (6) effectiveness of material management and resource
management; and (7) effectiveness of communication, are leading measures
because they offer the opportunity to change performance or alter the result of
associated performance of on-going construction projects.
Questionnaire Survey
The questionnaire was then developed based on the KPIs identified from the
comprehensive and critical literature review. The results of the survey would
be used to develop appropriate weightings for different KPIs. There were two
major sections in the questionnaire, encompassing: (1) background information
of survey respondents; and (2) evaluation of appropriate weightings for a list of
KPIs to assess the project success in Hong Kong. These two parts were to be
answered by survey respondents with interval grading so that RIM can be
facilitated. A total of 1,200 self-administered blank questionnaires were sent to
target industrial practitioners via postal mail and 233 completed questionnaires
were returned, representing an acceptable response rate of 19.42%. The
professional affiliation for the 233 survey respondents included architect (7.7%),
building surveyor (6.4%), quantity surveyor (7.3%), project manager (10.7%),
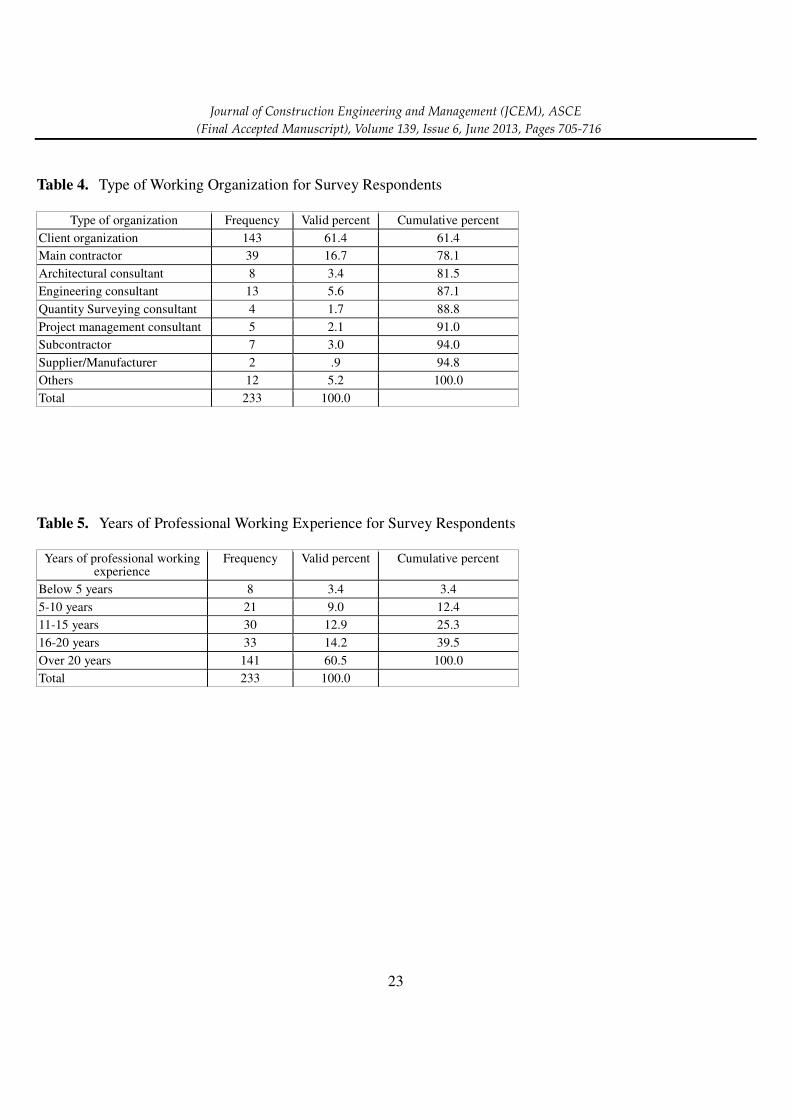
engineer (51.1%), builder (4.7%), and others (12%). Most of them worked in
either client organizations or main contractors (Table 4). A majority of them had
more than 10 years of professional working experience (Table 5). It is believed
that they possessed adequate knowledge and rich hands-on experience to
evaluate the importance of each KPI on construction projects in Hong Kong.
In order to assess the weighting for each KPI, the proper weighting assessment
method must take into account the fuzzy nature of its perceived importance.
The following section presents two possible weighting assessment methods.
Journal of Construction Engineering and Management (JCEM), ASCE
(Final Accepted Manuscript), Volume 139, Issue 6, June 2013, Pages 705-716
7
Weighting Assessment Methods
It is important to choose the appropriate weighting assessment method since
this directly affects the accuracy of evaluating the success of a construction
project. Two weighting assessment methods were considered in this study.
They are: (1) the Analytical Hierarchy Process (AHP); and (2) RIM.
AHP is a theory of measurement adopting pair-wise comparisons. It relies
much on the judgments of experts to derive priority scales. It is these scales
that measure the intangibles in relative terms. The comparisons are made
using a scale of absolute judgments that represent the extent to which one
element dominates another with respect to a given attribute (Saaty 2008). Yiu et
al. (2005) reported that there are two major limitations of AHP. First, it is
difficult to avoid inconsistency between pair-wise comparisons even if assessors
have comprehensive explanations of the factors and sub-factors. Second,
assessors may find it difficult to determine an exact weighting for some factors
because they are vague in nature. In other words, the use of AHP is not able to
cope with fuzziness satisfactorily and assessors may not be able to provide
appropriate weightings when they find it difficult to weigh these vague criteria.
These limitations make AHP not suitable in this study.
Reliability Interval Method (RIM)
With reference to Moore’s (1979) research work, Lo et al. (2001) developed RIM
to assess fire risk for high-rise buildings. RIM is particularly useful in
handling imprecise information. It requires assessors to weigh a factor using a
fuzzy range of numbers. For example, assessors can weigh a factor as a range
of 3 to 5, [3, 5], instead of an exact value of [4]. The influence of a KPI on the
performance of a project is greater if the weighting is higher. Since pair-wise
comparisons are not needed in this assessment method, the problem of
inconsistency arising from pair-wise comparison is removed. This method can
also determine the degree of reliability, center variance (CV), and interval
variance (IV). According to Lo et al. (2005), the degree of reliability is the
proportion of the ranges weighted by the assessors which falls within the
average range. CV and IV indicate the consistency of opinions amongst survey
respondents. Yiu et al. (2005) used RIM to develop weightings for different
decision criteria and their sub-criteria in evaluating cost estimator’s
performance. Lo et al. (2005) stated that this method is particularly practical
when the number of factors and sub-factors are large because the use of
pair-wise comparisons in AHP may lead to a lengthy questionnaire. RIM was
therefore chosen for this research as an appropriate weighting assessment
method for determining the weightings of each KPI. This method mitigates the

Journal of Construction Engineering and Management (JCEM), ASCE
(Final Accepted Manuscript), Volume 139, Issue 6, June 2013, Pages 705-716
8
problem of fuzziness during the evaluation of appropriate weightings for a list
of KPIs.
Two assumptions are made for the development of RIM:
(1) The probability distribution function within the interval is linear;
(2) Equal weighting is given to the opinions of the different experts.
To allow statistical analysis of the results, RIM provides three parameters with
the fuzzy assessment of weightings, namely, reliability, center variance (CV) and
interval variance (IV). The reliability illustrates the proportion of the ranges
weighted by the experts that falls within the average range. The value of CV
reflects the difference between the grade eigenvalue ( jζ ) and the average of
interval grades (lij and rij) for a particular KPI. The value of IV reflects the
difference between the grade eigenvalue ( jζ ) and the interval value lij or rij
(which has a larger difference with the grade eigenvalue). The consistency of
opinions among experts can be reflected with the use of these two variances.
The smaller the values of center variance (CV) and interval variance (IV) are, the
more consistent are the opinions of the respondents (Lo et al. 2001, 2005; Yiu et
al. 2005).
Research Findings and Discussions
Table 6 indicates the results of the average interval grades for each KPI obtained
from the 233 completed and valid questionnaires. Table 7 shows the survey
results of the respondents’ weightings of each KPI. Since RIM has only been
recently applied to the construction management discipline, the following
principles should be noted. Lo et al. (2001) stated that when the weightings of
two factors are nearly the same, the one with the higher reliability and the vice
versa is actually more reliable. They further stated that a low value of variance
indicates that a higher level of consistency exists amongst survey respondents,
and vice versa. Yiu et al. (2005) conducted questionnaires on performance
evaluation for cost estimators and suggested that when adopting RIM, an
achievement of 65% in reliability could be regarded as “reasonably good”.
They also took the view that only minor inconsistencies in opinions exist
amongst clients if the values of average center and interval variances are lower
than 0.65 and 2.10 respectively. Accordingly, cut-off values of 0.65, 0.65 and
2.10 for reliability, center variance (CV) and interval variance (IV) respectively
were used in selecting appropriate KPIs in this study. In total, 18 KPIs met
these requirements and the top-10 weighted KPIs were selected for compiling
the CPI to assess the success of a construction project in Hong Kong. The

Journal of Construction Engineering and Management (JCEM), ASCE
(Final Accepted Manuscript), Volume 139, Issue 6, June 2013, Pages 705-716
9
top-10 weighted KPIs were selected because all of their weightings are larger
than 0.05. The rationale for choosing 0.05 as the cut-off value is mainly
because 0.05 is the average value of all the KPIs’ weightings. Since the
weightings of top-10 weighted KPIs are larger than 0.05, they were selected to
form the CPI.
Table 7 portrays the results of rankings and weightings of the 20 identified KPIs
in descending order. The results reflect that “Safety Performance” is
considered as the most important KPI for construction projects in Hong Kong.
Its reliability nearly reaches 82%, which is satisfactory. The center variance
(CV) and interval variance (IV) of this KPI are small (0.32490 and 0.85009
respectively) and this implies that the opinions of the survey respondents are
very consistent. With high reliability and small variances, the top rank of this
KPI is justified. In fact, “Safety” becomes the most core value in many
contracting firms. Zero Harm Target was advocated by a leading contractor in
Hong Kong since 2010 (Gammon Construction 2010). PASS scores administered
by the Hong Kong Housing Authority (HKHA) are composed of a major
component on safety issues. If a contractor scores low in PASS (Performance
Assessment Scoring System), its tendering right might be jeopardized which is
an effective means to ensure safety compliance from the contractor (Chan et al.
2006). Similar policies apply in other public works projects administered by
the Hong Kong SAR Government. If a contractor achieves a poor safety record,
its senior management needs to be interviewed by the Contractors Registration
Committee (CRC) under the Buildings Ordinance before its registration can be
renewed. The second and the third most important KPIs are “Cost
Performance” and “Time Performance”, with weightings of 0.05763 and 0.05762
respectively. These two KPIs achieve a reliability of nearly 93% and 95%
respectively and their CV (0.28111 and 0.24727, respectively) and IV (0.93499
and 0.91820, respectively) are also small, which show that the opinions of
survey respondents are consistent.
It is commonly accepted that project success is measured by project
performance in terms of cost, time, and quality (Chan et al. 2002). Our
research findings are consistent with this traditional wisdom because cost
performance, time performance, and quality performance take the second, third,
and fourth positions respectively in this study. In addition, the findings also
emphasize the importance of safety performance and client’s satisfaction. This
implies that industrial practitioners in Hong Kong take safety seriously. In fact,
the accident rate per 1000 workers has decreased from 247.9 in 1998 to 60.0 in
2007 (Hong Kong Labor Department 2009). In order to compile a composite
indicator to evaluate the performance of construction projects in Hong Kong, a
Journal of Construction Engineering and Management (JCEM), ASCE
(Final Accepted Manuscript), Volume 139, Issue 6, June 2013, Pages 705-716
10
Composite Performance Index (CPI) is developed which can be represented by
the following formula:
CPI = 0.1086 x safety performance + 0.1058 x cost performance
+ 0.1058 x time performance + 0.1018 x quality performance
+ 0.0991 x client’s satisfaction + 0.0969 x effectiveness of communication
+ 0.0968 x end user’s satisfaction + 0.0959 x effectiveness of planning
+ 0.0955 x functionality + 0.0937 x environmental performance
Note: Italic fonts refer to “leading” KPIs
The coefficients are the “normalized” individual weightings of the top-10
weighted KPIs, which are calculated by dividing their individual weightings by
the total weightings of top-10 weighted KPIs. For example, the coefficient of
safety performance is calculated by 0.05914 ÷ (0.05914 + 0.05763 + 0.05762 +
0.05541 + 0.05396 + 0.05274 + 0.05270 + 0.05226 + 0.05202 + 0.05100), which is
equal to 0.1086. The CPI is derived based on the assumption that this is a
linear and additive model (Frisch et al. 1992; Curtin 1982; Nielsen 2001;
Ramaswami and Roe 2004; Yeung et al. 2007 & 2009; Xu et al. 2010). It is
logical and valid to derive this linear and additive model because the
correlation matrix as shown in Table 8 reveals that most of the top-10 weighted
KPIs are not highly correlated with each other at 1% significance level. In fact,
the linear and additive model has been widely applied in many different areas.
Frisch et al. (1992) developed the Quality of Life Inventory (QOLI), a measure of
life satisfaction, which was based on an empirically validated, linear, and
additive model. Nielsen (2001) introduced semi-parametric unmixing, which
was based on a linear and additive model with a non-linear smooth function to
represent end-member spectra. Ramaswami and Roe (2004) stated that a linear
additive model can be useful in any kind of risk analysis where it is vital to
distinguish between systemic and non-systemic risks. Yeung et al (2007 &
2009a) developed a Partnering Performance Index (PPI) for measuring the
partnering performance of construction projects in Hong Kong by using a linear
and additive model. Similarly, Yeung et al. (2009b), which was based on a
linear and additive model, developed a Performance Index (PI) for measuring
the performance of relationship-based construction projects in Australia. Xu et
al. (2010) developed a fuzzy risk allocation model for PPP projects in Mainland
China. By using a linear and additive model, the Risk Carrying Capability
Index (RCCI) was developed to evaluate the acceptable risk level of each project
participant. Supporting evidences concerning the appropriateness of applying
a linear and additive model in this research study were provided because
acceptable levels of model accuracy have been achieved in these studies (please
Journal of Construction Engineering and Management (JCEM), ASCE
(Final Accepted Manuscript), Volume 139, Issue 6, June 2013, Pages 705-716
11
refer to the table in Appendix 1). Practically speaking, it is simpler and easier
to use this model to measure the performance of construction projects in the
Hong Kong construction industry (Nielsen 2001; Xu et al. 2010) because the
procedures involved in the calculations are much simpler and easier when
compared with a non-linear and multiplicative model.
In order to provide a greater flexibility to assessors to objectively, reliably and
practically use the model, it is more appropriate to define reasonable
quantitative ranges (QRs) for each KPI. In this research, a construction project
with “good” time performance would be one between 4.5 scores and 5.5 scores
(based on a 7-point Likert scale where 1 = Worst; 2 = Very Bad; 3 = Bad; 4 =
Average; 5 = Good; 6 = Very Good; and 7 = Excellent). In this example, the
lower boundary for the “good” time performance was simply taken as the
average value of the “average” time performance and “good” time performance,
whereas, the upper boundary for the “good” time performance was taken as the
average value of the “good” time performance and the “very good” time
performance. Similar approaches were adopted by Chow and Ng (2007) and
Yeung et al. (2008). It is recognized that applying fuzzy membership functions
to derive QRs for each KPI is an appropriate means for measurements involving
fuzziness. However, to achieve this, another empirical questionnaire survey
needs to be conducted which has not yet been executed in the current study
because of time and cost constraints. An equally useful, valid, and scientific
method as adopted by Chow and Ng (2007) in taking the average value of the
lower and upper limits of each two consecutive performance levels to derive the
QRs was adopted in the current study.
Case Studies – Application of KPIs and CPI
A set of KPIs and the CPI have been developed in the previous section. In
order to demonstrate the application of KPIs and CPI to measure the
performance of construction projects in Hong Kong, three case studies were
examined. The scope of analysis under each case study covers the project
performance of safety, cost, time, quality, client’s satisfaction, effectiveness of
communication, end user’s satisfaction, effectiveness of planning, functionality,
together with environmental performance. Table 9 shows the summary of the
background information and the results of different KPIs and CPI of these three
case studies in Hong Kong. The details of each case study are discussed in the
following subsections.

Journal of Construction Engineering and Management (JCEM), ASCE
(Final Accepted Manuscript), Volume 139, Issue 6, June 2013, Pages 705-716
12
Case 1 – Civil Engineering Project
It is a civil engineering work, with total contract duration of 92 months and a
total contract sum of US$192.3077 million (HK$1,500 million). The project was
procured with sequential traditional method with tendering open to listed
contractors and the payment mechanism was lump sum with bills of
provisional quantities (re-measurement). The survey respondent perceived
that 8 out of 10 weighted KPIs were constructed with “excellent” performance.
The 8 weighted KPIs included: (1) safety performance; (2) time performance; (3)
quality performance; (4) client’s satisfaction; (5) effectiveness of communications;
(6) end user’s satisfaction; (7) functionality; and (8) environmental performance.
The other 2 weighted KPIs, including cost performance and effectiveness of
planning, were perceived to have “very good” performance. As a whole, a CPI
score of 6.80 out of a total of 7 was computed which suggests a project with
“excellent” performance.
Case 2 – Building Project
It is a building work, with total contract duration of 30 months and a total
contract sum of US$58.98 million (HK$460 million). The project was tendered
with restricted tendering method and the payment mechanism was lump sum
with bills of quantities. It was procured with management contracting. The
survey respondent perceived that 9 out of 10 weighted KPIs were constructed
with “good” performance. The 9 weighted KPIs were: (1) safety performance;
(2) cost performance; (3) time performance; (4) quality performance; (5) client’s
satisfaction; (6) effectiveness of communications; (7) end user’s satisfaction; (8)
functionality; and (9) environmental performance. The remaining weighted
KPI, effectiveness of planning, was perceived to have “average” performance.
As a whole, the CPI was found to be 4.90 (out of a total of 7), suggesting a
project with “good” performance.
Case 3 – Building Project
It is a building work, with total contract duration of 48 months and a total
contract sum of US$192.31 million (HK$1,500 million). The project was
procured with sequential traditional method with tendering open to listed
contractors and the payment mechanism was lump sum with bills of quantities.
The survey respondent perceived that 5 out of 10 weighted KPIs were
constructed with “very bad” performance. These included: (1) safety
performance; (2) cost performance; (3) time performance; (4) quality
performance; and (5) client’s satisfaction. Four of 10 weighted KPIs were
Journal of Construction Engineering and Management (JCEM), ASCE
(Final Accepted Manuscript), Volume 139, Issue 6, June 2013, Pages 705-716
13
perceived to have “average” performance, which included: (1) effectiveness of
communications; (2) end user’s satisfaction; (3) functionality; and (4)
environmental performance. The remaining weighted KPI, effectiveness of
planning, was perceived to have “bad” performance. As a whole, the CPI
stood at 2.86 (out of a total of 7), implying a project with “bad” performance.
Significance and Limitations of the Research
The development of a series of both weighted leading and lagging KPIs is very
important. Otherwise, without an ex-ante evaluation of the performance level of
construction projects, project managers would find it difficult to allocate their
limited resources in the most efficient and effective way. Their decisions are
often made by perceived intuition, and they cannot ensure whether their actions
are correct or not. The proposed model provides an objective basis for not
only measuring but indeed predicting the performance of an on-going
construction project. The prediction of project performance may be conducted
on an on-going project once in a month (i.e. at the end of each month). The
model can be applied to measure, evaluate, and monitor the performance of
their individual construction project at different stages of the project life cycle
and right up to completion. The CPI not only enhances the understanding of
clients, contractors, and consultants to run a successful construction project, but
also it sets a solid base for industrial practitioners to measure, evaluate, and
monitor the performance of their individual construction projects right up to
completion. In addition, the CPI helps set a benchmark for measuring the
performance of a portfolio of construction projects within an organization, so
that this can help improve the overall performance of the firm through proper
monitoring and control of its projects. It also provides valuable insights into
developing a strong and comprehensive base for future research, for instance,
identifying critical success factors for current construction projects and then
developing a best practice framework for them. A similar research method can
also be extended to develop a benchmarking model for construction projects
internationally.
However, it is worth noting that it is likely for different evaluators to have their
own semantic interpretation of each KPI. For instance, an evaluator may use
“Percentage of conformance to the specifications” to measure quality
performance while another assessor may adopt “Number of non-conformance
reports generated per month” to measure it. Even though a mutually agreed
set of linguistic interpretations exists, its qualitative nature could lead to
subjective judgment instead of evidence-based consideration. Thus it is
desirable to identify appropriate quantitative interpretations/indicators (QIs) for
Journal of Construction Engineering and Management (JCEM), ASCE
(Final Accepted Manuscript), Volume 139, Issue 6, June 2013, Pages 705-716
14
each KPI in order to avoid any possible discrepancies in interpreting the
meaning of each KPI and provide objective evaluation results based on
quantitative evidence. By incorporating these quantitative indicators into the
evaluation process, evaluators could perform their evaluation based on
quantitative evidence.
Conclusions
KPIs in construction have been discussed for many years, but there are not
many comprehensive and systematic studies on both leading and lagging KPIs.
This study has applied RIM to develop a model to objectively measure and
forecast the performance of construction projects in the Hong Kong
construction industry. The descending order of the top-10 weighted KPIs
identified were found to be: (1) safety performance, with the normalized
weighting of 0.1086; (2) cost performance, with the normalized weighting of
0.1058; (3) time performance, with the normalized weighting of 0.1058; (4)
quality performance, with the normalized weighting of 0.1018; (5) client’s
satisfaction, with the normalized weighting of 0.0991; (6) effectiveness of
communication, with the normalized value of 0.0969; (7) end user’s satisfaction,
with the normalized value of 0.0968; (8) effectiveness of planning, with the
normalized value of 0.0959; (9) functionality, with the normalized value of
0.0955; and (10) environmental performance, with the normalized value of
0.0937. The KPIs’ framework for construction projects helps develop a CPI and
sets a benchmark for measuring the performance of construction projects in
Hong Kong. Different construction projects can then be evaluated and
compared objectively based on this CPI established. As a result, construction
senior executives and project managers can use the CPI to measure, monitor,
and upgrade the performance of their construction projects at different stages of
the project life cycle. It also deepens the current body of knowledge and
understanding of both academics and practitioners in the construction industry
to achieve outstanding construction project performance.
Acknowledgement
The authors gratefully acknowledge the Department of Building and Real
Estate of The Hong Kong Polytechnic University for providing funding to
support this research study via the Departmental Postdoctoral Fellowship
Scheme (Project Account Code: BRE-1-ZV97).

Journal of Construction Engineering and Management (JCEM), ASCE
(Final Accepted Manuscript), Volume 139, Issue 6, June 2013, Pages 705-716
15
References
Beatham, S., Anumba, C., Thorpe, T., and Hedges, I. (2004). “KPIs: a critical
appraisal of their use in construction.” Benchmarking: An International
Journal, 11(1), 93-117.
Chan, A.P.C., Wong, F.K.W., and Lam, P.T.I. (2006). “Assessing quality
relationships in public housing: an empirical study.” International Journal
of Quality and Reliability Management, 23(8), 909-927.
Chan, A.P.C., and Chan, A.P.L. (2004). “Key performance indicators for
measuring construction success.” Benchmarking: An International Journal,
11(2), 203-221.
Chan, A.P.C., Scott, D., and Lam, E.W.M. (2002). “Framework of success criteria
for design/build projects.” Journal of Management in Engineering, ASCE,
18(3), 120-128.
Chau, K.W. (1997). “The ranking of construction management journals.”
Construction Management and Economics, 15(4), 387-398.
Chow, L.K., and Ng, S.T. (2007). “Expectation of performance levels pertinent to
consultant performance evaluation.” International Journal of Project
Management, 25(1), 90-103.
Costa, D.B., Formoso, C.T., Kagioglou, M., Alarcón, L.F., and Caldas, C.H. (2006).
“Benchmarking initiatives in the construction industry: lessons learned
and improvement opportunities.” Journal of Management in Engineering,
ASCE, 22(4), 158-167.
Cox, R.F., Issa, R.R.A., and Ahrens, D. (2003). “Management’s perception of key
performance indicators for construction.” Journal of Construction
Engineering and Management, ASCE, 129(2), 142-151.
Curtin, R.T. (1982). “Indicators of consumer behavior: The University of
Michigan Surveys of Consumers.” Public Opinion Quarterly, 46(3),
340-352.
El-Mashaleh, M.S., Minchin, R.E., and O’Brien, W.J. (2007). “Management of
construction firm performance using benchmarking.” Journal of
Management in Engineering, ASCE, 23(1), 10-17.
Frisch, M.B., Cornell, J., and Villanueva, M. (1992). “Clinical validation of the
quality of life inventory: a measure of life satisfaction for use in treatment
planning and outcome assessment.” Psychological Assessment, 4(1), 92-101.
Gammon Construction. (2010).
(http://www.gammonconstruction.com/html/about-us/values.html) (May
2010).
Hong Kong Labor Department (2009).Occupational safety and health statistics
bulletin Issue No. 7 2009. Hong Kong Special Administrative Region:
Government Printer, 2009.
Journal of Construction Engineering and Management (JCEM), ASCE
(Final Accepted Manuscript), Volume 139, Issue 6, June 2013, Pages 705-716
16
Ke, Y.J., Wang, S.Q., Chan, A.P.C., and Cheung, E. (2009). “Research trend of
Public-Private Partnership (PPP) in construction journals.” Journal of
Construction Engineering and Management, ASCE, 135(10), 1076-1086.
Lam E.W.M., Chan, A.P.C., and Chan, D.W.M. (2007). “Benchmarking the
performance of design-build projects: development of project success
index.” Benchmarking: An International Journal, 14(5), 624-638.
Lam E.W.M., Chan, A.P.C., and Chan, D.W.M. (2008). “Determinants of
successful design-build projects.” Journal of Construction Engineering and
Management, ASCE, 134(5), 333-341.
Lee, S.H., Thomas, S.R., and Tucker, R.L. (2005). “Web-based benchmarking
system for the construction industry.” Journal of Construction Engineering
and Management, ASCE, 131(7), 790-798.
Ling, F.Y.Y., Low, S.P., Wang, S.Q., and Egbelakin, T. (2008). “Models for
predicting project performance in China using project management
practices adopted by foreign AEC firms.” Journal of Construction
Engineering and Management, ASCE, 134(12), 983-990.
Lo, S.M., Hu, B.Q., Liu, M., and Yuen, K.K. (2005). “On the use of reliability
interval method and grey relational model for fire safety ranking of
existing buildings.” Fire Technology, 41(4), 255-270.
Lo, S.M., Lu, J.A., Hu, Y.Q., and Fang, Z. (2001). “Incorporating reliability and
variance into weighting function of fire risk assessment for high-rise
buildings.” China Safety Science Journal, 11(5), 11-13 (Chinese).
Luu, V.T., Kim, S.Y., and Huynh, T.A. (2008). “Improving project management
performance of large contractors using benchmarking approach.”
International Journal of Project Management, 26(7), 758-769.
Moore, R.E. (1979). “Methods and applications of interval analysis.” Philadelphia:
SIAM.
Nielsen, A.A. (2001). “Spectral mixture analysis: linear and semi-parametric full
and iterated partial unmixing in multi-and hyperspectral image data.”
Journal of Mathematical Imaging and Vision, 15(1-2), 17-37.
Ramaswami, B., and Roe, T.L. (2004). “Aggregation in area-yield crop insurance:
the linear additive model.” American Journal of Agricultural Economics,
86(2), 420-431.
Ramirez, R.R, Alarcón, L.F.C., and Knights, P. (2004). “Benchmarking system for
evaluating management practices in the construction industry.” Journal of
Management in Engineering, ASCE, 20(3), 110-117.
Satty, T.L. (1980). “The analytic hierarchy process.” New York: McGraw Hill.
Saaty, T.L. (2008). “Decision making with the analytic hierarchy process.”
International Journal of Services Sciences, 1(1), 83-98.
Journal of Construction Engineering and Management (JCEM), ASCE
(Final Accepted Manuscript), Volume 139, Issue 6, June 2013, Pages 705-716
17
Shields, J., and Silcock, G. (1986). “An application of the hierarchical approach to
fire safety.” Fire Safety Journal, 11(3), 235-242.
Westerveld, E. (2003). “The project excellence model: linking success criteria and
critical success factors.” International Journal of Project Management, 21(6),
411-418.
Xu, Y.L., Chan, A.P.C., and Yeung, J.F.Y. (2010). “Developing a fuzzy risk
allocation model for PPP projects in China.” Journal of Construction
Engineering and Management, ASCE, 136(8), 894-903.
Yeung, J.F.Y., Chan, A.P.C., and Chan, D.W.M. (2008). “Establishing quantitative
indicators for measuring the partnering performance of construction
projects in Hong Kong.” Construction Management and Economics, 26(3),
277-301.
Yeung, J.F.Y., Chan, A.P.C., and Chan, D.W.M. (2009a). “A computerized model
for measuring and benchmarking the partnering performance of
construction projects.” Automation in Construction, 18(8), 1099-1113.
Yeung, J.F.Y., Chan, A.P.C., and Chan, D.W.M. (2009b). “Developing a
performance index for relationship-based construction projects in
Australia: Delphi study.” Journal of Management in Engineering, ASCE,
25(2), 59-68.
Yeung, J.F.Y., Chan, A.P.C., Chan, D.W.M., and Li, L.K. (2007). “Development
of a partnering performance index (PPI) for construction projects in
Hong Kong: a Delphi study.” Construction Management and Economics,
25(12), 1219-1237.
Yiu, C.Y., Ho, H.K., Lo, S.M., Hu, B.Q. (2005). “Performance evaluation for cost
estimators by reliability interval method.” Journal of Construction
Engineering and Management, ASCE, 131(1), 108-116.

Journal of Construction Engineering and Management (JCEM), ASCE
(Final Accepted Manuscript), Volume 139, Issue 6, June 2013, Pages 705-716
18
Table 1. Level of Relevance to Benchmarking Related Studies in Construction for Reviewed Journal Abstracts
Level of relevance to benchmarking studies in construction
Descriptor Total number of journal abstracts reviewed
Not relevant = 0 The aim of the paper is not relevant to benchmarking study in construction. The keywords selected for the Scopus database search are rarely mentioned in the abstract. In addition, the paper title and keywords do not reflect any relevance on benchmarking study.
379
Least relevant = 1 The aim of the paper is least relevant to benchmarking study in construction. The keywords selected for the Scopus database search are seldom mentioned in the abstract. Besides, the paper title and keywords only reflect a low level of relevance on benchmarking study.
70
Slightly relevant = 2 The aim of the paper is slightly relevant to benchmarking study in construction. The keywords selected for the Scopus database search are sometimes mentioned in the abstract. Moreover, the paper title and keywords reflect a moderate level of relevance on benchmarking study.
30
Relevant = 3 The aim of the paper is relevant to benchmarking study in construction. The keywords selected for the Scopus database search are mentioned in the abstract. In addition, the paper title and keywords reflect a high level of relevance on benchmarking study.
79
Very relevant = 4 The aim of the paper is very relevant to benchmarking study in construction. The keywords selected for the Scopus database search are frequently mentioned in the abstract. In addition, the paper title and keywords reflect a very high level of relevance on benchmarking study.
12
Most relevant = 5 The aim of the paper is extremely relevant to benchmarking study in construction. The keywords selected for the Scopus database search are very frequently mentioned in the abstract. In addition, the paper title and keywords reflect an extremely high level of relevance on benchmarking study.
2
Total
572
Journal of Construction Engineering and Management (JCEM), ASCE
(Final Accepted Manuscript), Volume 139, Issue 6, June 2013, Pages 705-716
19
Table 2. Performance Indicators for Construction Projects Performance Indicators
Chan
et
al.
(200
2)
Cox e
t al
. (2
003
)
Wes
terv
eld
(2003
)
Bea
tham
et
al. (2
004
)
Chan
and
Chan
(20
04)
Ram
irez
et
al. (2
00
4)
Lee
et
al. (2
00
5)
Cost
a et
al.
(200
6)
El-
Mas
hal
eh e
t al
. (2
007)
Yeu
ng
et
al. (2
007
&
2009
)
Lam
et
al. (2
00
8)
Lin
g e
t al
. (2
008)
Luu e
t al
. (2
008
)
To
tal
1. Schedule/Time performance √ √ √ √ √ √ √ √ √ √ 10 2. Cost performance √ √ √ √ √ √ √ √ √ √ 10 3. Safety performance/Accident rate √ √ √ √ √ √ √ √ √ 9 4. Profit/Profitability √ √ √ √ √ √ √ 7 5. Client’s satisfaction √ √ √ √ √ √ √ 7 6. Quality performance √ √ √ √ √ √ 6 7. Total field rework factor (leading measure)/Scope of rework √ √ √ √ √ 5 8. Productivity performance (leading measure) √ √ √ √ √ 5 9. Environmental performance √ √ √ √ 4 10. End user’s satisfaction (on services or on products or on projects) √ √ √ √ 4 11. Project cost growth (owner) √ √ √ 3 12. Project budget factor (contractor) √ √ √ 3 13. Functionality √ √ √ 3 14. Recordable incident rate (contractor) √ √ √ 3 15. Project schedule factor √ √ 2 16. Project schedule growth √ √ 2 17. Lost workday case incident rate √ √ 2 18. Change cost factor √ √ 2 19. Defects √ √ 2 20. Predictability cost √ √ 2 21. Predictability time √ √ 2 22. Extent and layer of subcontracting √ √ 2 23. Efficiency of direct labor √ √ 2 24. Effectiveness of risk management (leading measure) √ √ 2 25. Effectiveness of planning (leading measure) √ √ 2 26. Project team satisfaction (leading measure) √ √ 2 27. Provision of training courses (leading measure) √ √ 2 28. Effectiveness of material management and resource management (leading measure) √ √ 2 29. Professional image establishment √ √ 2 30. Innovation and improvement √ √ 2 31. Claim avoidance √ √ 2 32. Effectiveness of communication (leading measure) √ √ 2 33. Staff turnover √ √ 2 34. Experience modification rating (EMR) √ 1 35. Project management expenses √ 1 36. Total project duration √ 1 37. Factor phase cost growth (owner data only) (leading measure) √ 1 38. Phase duration factor (leading measure) √ 1 39. Construction phase duration (leading measure) √ 1 40. Percentage of plan completed (leading measure) √ 1 41. Supplier performance (leading measure) √ 1 42. No. of nonconformity in audits (leading measure) √ 1 43. Rate of employees trained (leading measure) √ 1 44. Quality management system (QMS) √ 1 45. Project team performance √ 1

Journal of Construction Engineering and Management (JCEM), ASCE
(Final Accepted Manuscript), Volume 139, Issue 6, June 2013, Pages 705-716
20
Table 2. (Continued) 46. Change management √ 1 47. Labor safety management √ 1 48. Phase cost factor (owner) √ 1 49. Zero accident techniques practice use (owner) √ 1 50. Litigation avoidance √ 1 51. Dispute avoidance √ 1 52. Harmonious working relationships √ 1 53. Long-term business relationship √ 1 54. Top management support √ 1 55. Employee’s attitude √ 1 56. Understanding client needs √ 1
Total 8 6 4 15 9 10 5 30 15 20 7 5 8

Journal of Construction Engineering and Management (JCEM), ASCE
(Final Accepted Manuscript), Volume 139, Issue 6, June 2013, Pages 705-716
21
Table 3. Performance Indicators after Consolidation for Construction Projects Performance indicators
Ch
an e
t al
. (2
002
)
Co
x e
t al
. (2
003)
Wes
terv
eld
(2
003)
Bea
tham
et
al. (2
004)
Ch
an a
nd
Chan
(200
4)
Ram
irez
et
al. (2
004
)
Lee
et
al. (2
005
)
Co
sta
et a
l. (
200
6)
El-
Mas
hal
eh e
t al
. (2
007)
Yeu
ng e
t al
. (2
007
& 2
00
9)
Lam
et
al. (2
00
8)
Lin
g e
t al
. (2
008)
Lu
u e
t al
. (2
008)
To
tal
1. Cost performance √ √ √ √ √ √ √ √ √ √ √ √ √ 13
2. Schedule/Time performance √ √ √ √ √ √ √ √ √ √ √ √ 12
3. Safety performance/Accident rate √ √ √ √ √ √ √ √ √ √ √ 11
4. Quality performance √ √ √ √ √ √ √ √ √ √ √ 11
5. Profit/Profitability √ √ √ √ √ √ √ 7
6. Client’s satisfaction √ √ √ √ √ √ √ 7
7. Productivity performance (leading measure) √ √ √ √ √ 5
8. Environmental performance √ √ √ √ 4
9. End user’s satisfaction (on services or on products or on projects) √ √ √ √ 4
10. Functionality √ √ √ 3
11. Project team satisfaction (leading measure) √ √ √ 3
12. Extent and layer of subcontracting √ √ 2
13. Effectiveness of risk management (leading measure) √ √ 2
14. Effectiveness of planning (leading measure) √ √ 2
15. Provision of training courses (leading measure) √ √ 2
16. Effectiveness of material management and resource management (leading measure) √ √ 2
17. Professional image establishment √ √ 2
18. Innovation and improvement √ √ 2
19. Claim avoidance √ √ 2
20. Effectiveness of communication (leading measure) √ √ 2
21. Project management expenses √ 1
22. Supplier performance (leading measure) √ 1
23. Change management √ 1
24. Harmonious working relationships √ 1
Journal of Construction Engineering and Management (JCEM), ASCE
(Final Accepted Manuscript), Volume 139, Issue 6, June 2013, Pages 705-716
22
Table 3. (Continued) 25. Long-term business relationship √ 1
26. Top management support √ 1
27. Employee’s attitude √ 1
28. Understanding client needs √ 1 Total 8 5 4 14 9 7 2 13 7 17 7 5 8
Journal of Construction Engineering and Management (JCEM), ASCE
(Final Accepted Manuscript), Volume 139, Issue 6, June 2013, Pages 705-716
23
Table 4. Type of Working Organization for Survey Respondents
Type of organization Frequency Valid percent Cumulative percent
Client organization 143 61.4 61.4
Main contractor 39 16.7 78.1
Architectural consultant 8 3.4 81.5
Engineering consultant 13 5.6 87.1
Quantity Surveying consultant 4 1.7 88.8
Project management consultant 5 2.1 91.0
Subcontractor 7 3.0 94.0
Supplier/Manufacturer 2 .9 94.8
Others 12 5.2 100.0
Total 233 100.0
Table 5. Years of Professional Working Experience for Survey Respondents
Years of professional working experience
Frequency Valid percent Cumulative percent
Below 5 years 8 3.4 3.4
5-10 years 21 9.0 12.4
11-15 years 30 12.9 25.3
16-20 years 33 14.2 39.5
Over 20 years 141 60.5 100.0
Total 233 100.0

Journal of Construction Engineering and Management (JCEM), ASCE
(Final Accepted Manuscript), Volume 139, Issue 6, June 2013, Pages 705-716
24
Table 6. Average Interval Grades for 20 KPIs for Construction Projects in Hong Kong
KPIs for construction projects in Hong Kong Average interval grades 1. Time performance [3.174, 4.680] 2. Cost performance [3.740, 4.656] 3. Safety performance [3.916, 4.700] 4. Profit/Profitability [2.987, 3.923] 5. Client’s satisfaction [3.479, 4.382] 6. Quality performance [3.561, 4.512] 7. Productivity performance [3.054, 3.976] 8. Environmental performance [3.251, 4.179] 9. End user’s satisfaction [3.394, 4.284] 10. Functionality [3.324, 4.255] 11. Extent and layer of subcontracting [2.528, 3.465] 12. Effectiveness of risk management [3.119, 4.031] 13. Effectiveness of planning [3.341, 4.273] 14. Project team satisfaction [2.866, 3.833] 15. Provision of training courses [2.439, 3.395] 16. Effectiveness of material and resource management [2.958, 3.879] 17. Professional image establishment [2.907, 3.799] 18. Innovation and improvement [2.788, 3.709] 19. Dispute avoidance [2.867, 3.835] 20. Effectiveness of communication [3.395, 4.288]
Table 7. Results of Reliability Interval Method (RIM) for KPIs Related to Construction Projects in Hong Kong
KPIs for construction projects in Hong Kong Weighting Reliability Centre variance (CV)
Interval variance (IV)
1. Safety performance 0.05914 0.81974 0.32490 0.85009 2. Cost performance 0.05763 0.92704 0.28111 0.93499 3. Time performance 0.05762 0.95279 0.24727 0.91820 4. Quality performance 0.05541 0.92704 0.30568 1.02566 5. Client’s satisfaction 0.05396 0.87983 0.39514 1.12176 6. Effectiveness of communication 0.05274 0.85837 0.47722 1.23273 7. End user’s satisfaction 0.05270 0.85408 0.42093 1.14217 8. Effectiveness of planning 0.05226 0.87554 0.39412 1.14699 9. Functionality 0.05202 0.90558 0.36175 1.08857 10. Environmental performance 0.05100 0.84979 0.47001 1.20828 11. Effectiveness of risk management 0.04908 0.75966 0.51977 1.24782 12. Productivity performance 0.04826 0.84120 0.38984 0.99513 13. Profit/Profitability 0.04744 0.59307 0.85748 1.71176 14. Effectiveness of material and resource
management 0.04693 0.77682 0.47352 1.17108
15. Professional image establishment 0.04603 0.68240 0.73076 1.56802 16. Dispute avoidance 0.04601 0.75966 0.57985 1.40981 17. Project team satisfaction 0.04599 0.76395 0.56225 1.40423 18. Innovation and improvement 0.04460 0.74678 0.62209 1.42950 19. Extent and layer of subcontracting 0.04114 0.75862 0.66686 1.53460 20. Provision of training courses 0.04005 0.77682 0.61361 1.51269

Journal of Construction Engineering and Management (JCEM), ASCE
(Final Accepted Manuscript), Volume 139, Issue 6, June 2013, Pages 705-716
25
Table 8. Correlation Matrix among the Top Ten Weighted Leading and Lagging KPIs (Sample Size = 278)
Correlation matrix
Safety performance
Cost performance
Time performance
Quality performance
Client’s satisfaction
Effectiveness of communication
End user’s satisfaction
Effectiveness of planning
Functionality
Environmental performance
Safety performance
1 0.414** 0.402** 0.504** 0.506** 0.468** 0.351** 0.345** 0.385** 0.444**
Cost performance
1 0.495** 0.488** 0.573** 0.461** 0.412** 0.456** 0.426** 0.359**
Time performance
1 0.513** 0.612** 0.482** 0.491** 0.538** 0.464** 0.408**
Quality performance
1 0.749** 0.656** 0.689** 0.526** 0.616** 0.540**
Client’s satisfaction
1 0.631** 0.687** 0.602** 0.589** 0.541**
Effectiveness of communication
1 0.629** 0.533** 0.560** 0.491**
End user’s satisfaction
1 0.552** 0.649** 0.457**
Effectiveness of planning
1 0.588** 0.504**
Functionality
1 0.618**
Environmental performance
1
**. Correlation is significant at the 0.01 level (two-tailed)

Journal of Construction Engineering and Management (JCEM), ASCE
(Final Accepted Manuscript), Volume 139, Issue 6, June 2013, Pages 705-716
26
Table 9. Case Studies: Application of KPIs and CPI
Case study Case 1 Case 2 Case 3 Background Nature of project Civil work Building work Building work Procurement method Sequential traditional Management contracting Sequential traditional Tendering method Tendering open to listed contractors Restricted tendering Tendering open to listed
contractors Payment mechanism Lump sum with bills of provisional
quantities (re-measurement) Lump sum with bills of
quantities Lump sum with bills of
quantities Total contract duration 92 months 30 months 48 months Total contract sum US$192.31 million
(HK$1500 million) US$58.98 million (HK$460 million)
US$192.31 million (HK$1500 million)
KPIs survey result Safety Performance Excellent
(7 out of 7 scores) Good
(5 out of 7 scores) Very Bad
(2 out of 7 scores) Cost Performance Very Good
(6 out of 7 scores) Good
(5 out of 7 scores) Very Bad
(2 out of 7 scores) Time Performance Excellent
(7 out of 7 scores) Good
(5 out of 7 scores) Very Bad
(2 out of 7 scores) Quality Performance Excellent
(7 out of 7 scores) Good
(5 out of 7 scores) Very Bad
(2 out of 7 scores) Client’s Satisfaction Excellent
(7 out of 7 scores) Good
(5 out of 7 scores) Very Bad
(2 out of 7 scores) Effectiveness of Communications
Excellent (7 out of 7 scores)
Good (5 out of 7 scores)
Average (4 out of 7 scores)
End User’s Satisfaction Excellent (7 out of 7 scores)
Good (5 out of 7 scores)
Average (4 out of 7 scores)
Effectiveness of Planning Very Good (6 out of 7 scores)
Average (4 out of 7 scores)
Bad (3 out of 7 scores)
Functionality Excellent (7 out of 7 scores)
Good (5 out of 7 scores)
Average (4 out of 7 scores)
Environmental Performance
Excellent (7 out of 7 scores)
Good (5 out of 7 scores)
Average (4 out of 7 scores)
Composite Performance Index (CPI)
6.7976 (out of a total of 7) 4.9034 (out of a total of 7) 2.8615 (out of a total of 7)

Journal of Construction Engineering and Management (JCEM), ASCE
(Final Accepted Manuscript), Volume 139, Issue 6, June 2013, Pages 705-716
27
Appendix. Comparisons of Levels of Model Accuracy between the Results of Former
Studies and the Current Study
Study Model
1. Frisch et al. (1992) Frisch et al. (1992) developed the Quality of Life Inventory (QOLI), a measure of life satisfaction, which
was based on an empirically validated, linear, and additive model. Test-retest coefficients for the QQLI
ranged from 0.80 to 0.91, and internal consistency coefficients ranged from 0.77 to 0.89 across 3 clinical
and 3 non-clinical samples.
2. Nielsen (2001) Nielsen (2001) introduced semi-parametric unmixing, which was based on a linear and additive model
with a non-linear smooth function to represent end-member spectra. An example with two generated
bands shows that both full unmixing, the Constrained Energy Minimization (CIM), the Iterated CEM and
Target Constrained Interference Minimized Filter (TCIMF) methods perform well. A case study with a
30 bands subset of AVIRIS data shows the utility of full unmixing, Spectral Angle Mapping (SAM), CEM
and Iterated CEM to more realistic data.
3. Ramaswami and
Roe (2004)
Ramaswami and Roe (2004) stated that a linear additive model can be useful in any kind of risk analysis
where it is vital to distinguish between systemic and non-systemic risks. The authors have
mathematically derived the linear additive model (LAM) from aggregation of micro-production functions.
4. Yeung et al. (2007,
2009a).
Yeung et al (2007 and 2009a) developed a Partnering Performance Index (PPI) for measuring the
partnering performance of construction projects in Hong Kong by using a linear and additive model.
Three case studies were used to validate the usefulness of the model. In fact, the model has also been
validated by seven independent experts who had not previously been involved in the Delphi questionnaire
surveys for proper validation.
5. Yeung et al.
(2009b)
Yeung et al. (2009b), based on a linear and additive model, developed a Performance Index (PI) for
measuring the performance of relationship-based construction projects in Australia. Three case studies
were used to validate the usefulness of the model. In addition, it was noted that the Delphi survey
technique by its inherent nature serves as a self-validating mechanism because each expert was given a
chance to re-evaluate their scores with reference to the consolidated mean scores as assessed by other
experts.
6. Xu et al. (2010)
Xu et al. (2010) developed a fuzzy risk allocation model for PPP projects in Mainland China. By using a
linear and additive model, the Risk Carrying Capability Index (RCCI) was developed to evaluate the
acceptable risk level of each project participant. An illustrative example was used to demonstrate the
usefulness of the model.
7. Current study
Yeung et al. (2013), based on a linear and additive model, developed a benchmarking model for
construction project in Hong Kong by incorporating both leading and lagging KPIs and applying the
Reliability Interval Method (RIM). Three case studies were used to validate the usefulness of the model.