deutz investor presentation august 2016 · pdf filedeutz engine portfolio will satisfy the...
TRANSCRIPT

DEUTZ Investor PresentationAugust 2016

Agenda
2
� DEUTZ strategy & positioning
� Financials
� Outlook
DEUTZ at a glance
3
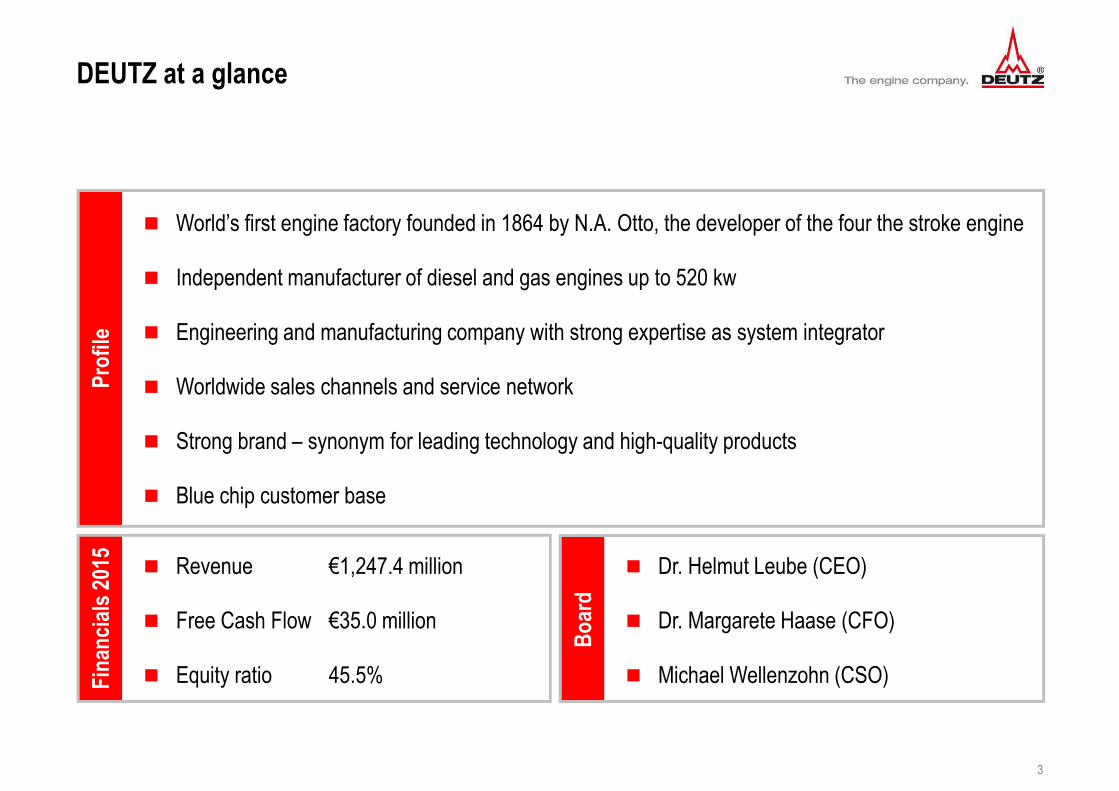
� Revenue €1,247.4 million
� Free Cash Flow €35.0 million
� Equity ratio 45.5%
� World’s first engine factory founded in 1864 by N.A. Otto, the developer of the four the stroke engine
� Independent manufacturer of diesel and gas engines up to 520 kw
� Engineering and manufacturing company with strong expertise as system integrator
� Worldwide sales channels and service network
� Strong brand – synonym for leading technology and high-quality products
� Blue chip customer base
� Dr. Helmut Leube (CEO)
� Dr. Margarete Haase (CFO)
� Michael Wellenzohn (CSO)
Prof
ileFi
nanc
ials
201
5
Boa
rd

Corporate structure
4
DEUTZ Group
DEUTZ Compact Engines DEUTZ Customised Solutions
� Air-cooled engines for on-road, off-
road and marine applications
� Liquid-cooled engines over 8 litres
for all applications
� Remanufactured (Xchange) engines
for all DEUTZ engine series
� Substantial service business based on existing population of approx.
1.6 million engines in the market
� Product portfolio mainly comprises genuine DEUTZ spare parts,
remanufactured engines and parts as well as oils and lubricants
� Liquid-cooled engines of up to 8
litres cubic capacity for on- and off-
road applications
� Large number of modular
approaches
� Joint Venture DEUTZ Dalian (China)
DEUTZ Services (common to both segments)

5
� Competitive product features: compact size, low fuel consumption, smart exhaust after-treatment
� DEUTZ engine portfolio will satisfy the next EU emissions standard announced for 2019 “Stage V ready”
� Expanding product range for Stage V: New three-cylinder TCD 2.2 engine will create a family platform with
four-cylinder TCD 2.9 engine. Both engines will be also available in a gas version (LPG). Engine project
TCD 5.0 scheduled to go into production in 2019 to gain market share in the 100-150kW output range
DEUTZ engines for EU Stage IV / US Tier 4 emissions standard
6
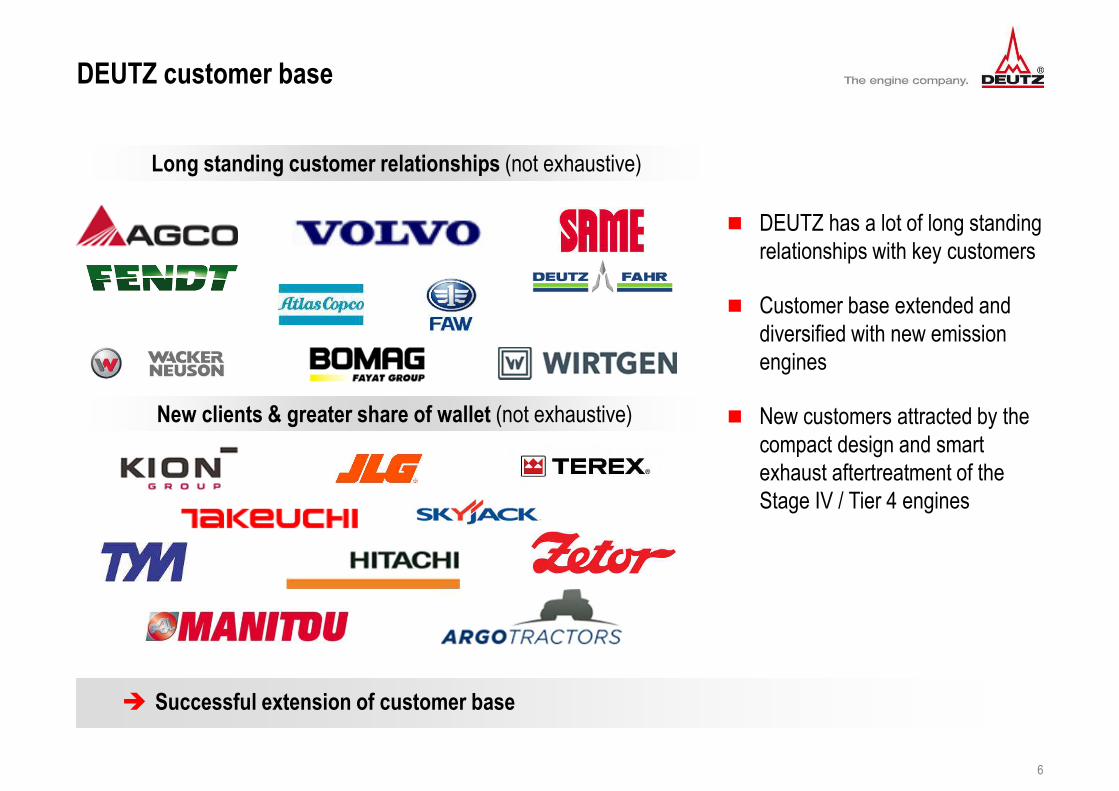
DEUTZ customer base
� DEUTZ has a lot of long standing
relationships with key customers
� Customer base extended and
diversified with new emission
engines
� New customers attracted by the
compact design and smart
exhaust aftertreatment of the
Stage IV / Tier 4 engines
� Cautious optimism for 2012� Successful extension of customer base
Long standing customer relationships (not exhaustive)
New clients & greater share of wallet (not exhaustive)
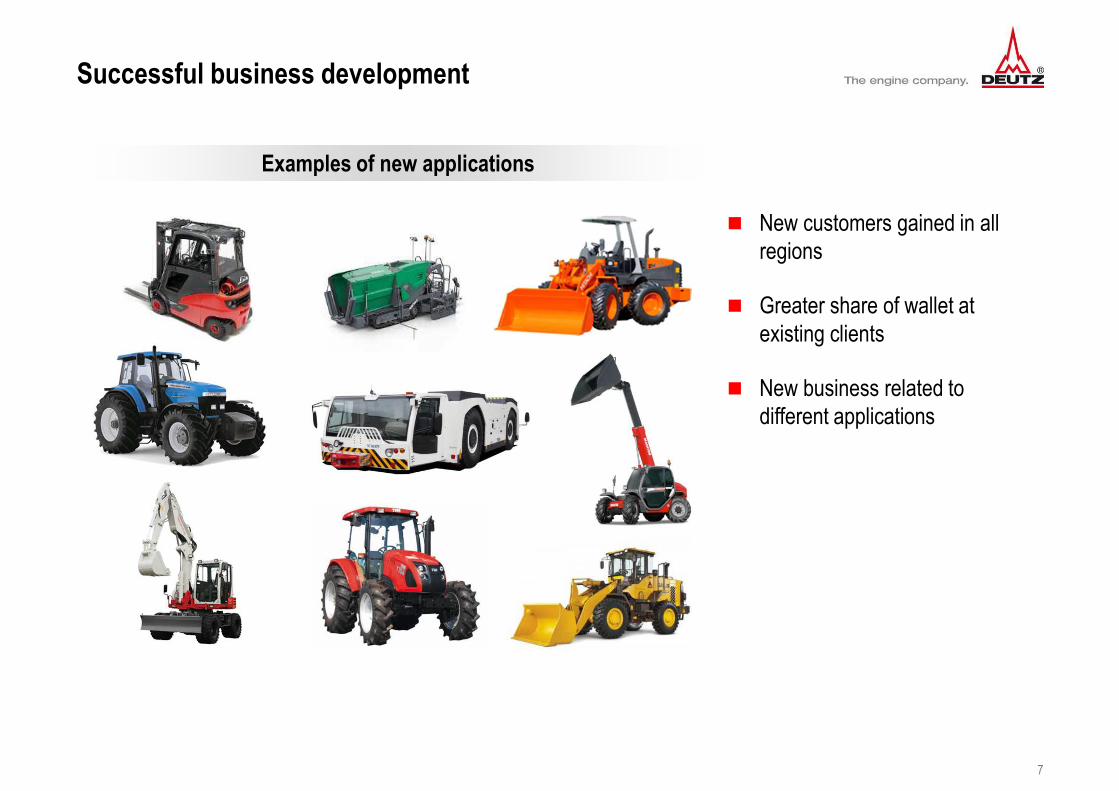
Successful business development
7
Examples of new applications
� New customers gained in all
regions
� Greater share of wallet at
existing clients
� New business related to
different applications
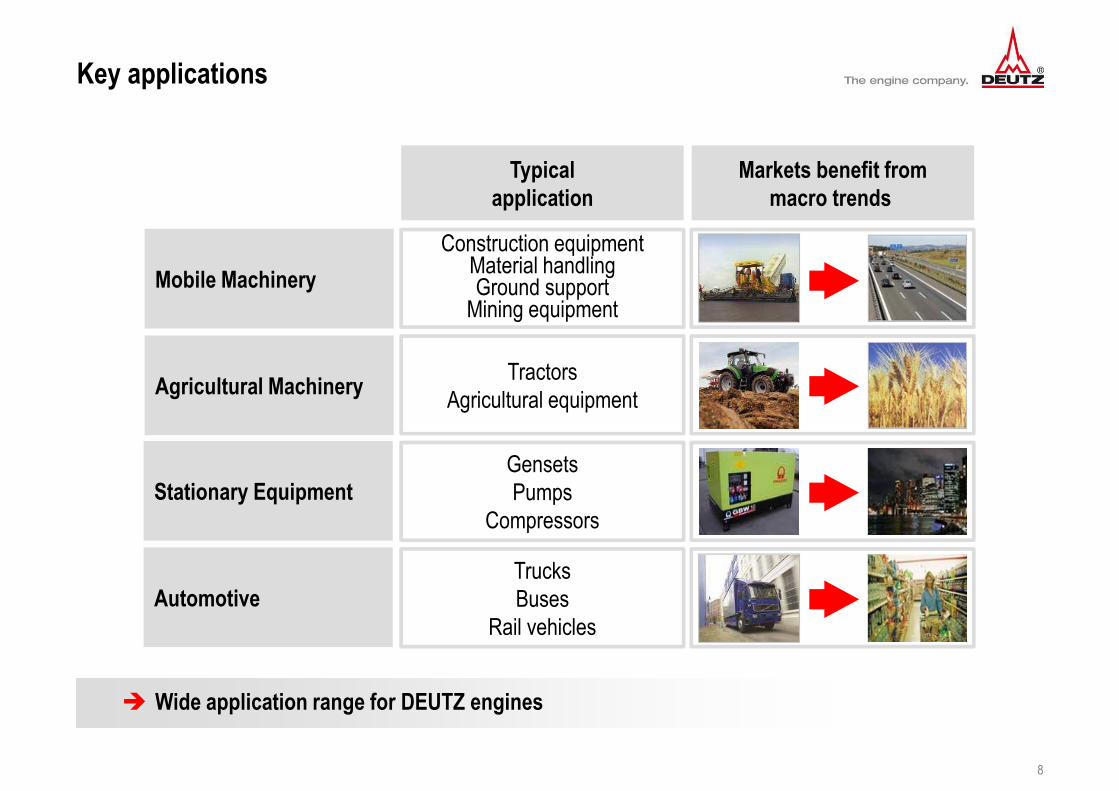
Key applications
8
� Wide application range for DEUTZ engines
Mobile Machinery
Agricultural Machinery
Stationary Equipment
Automotive
Typicalapplication
Markets benefit frommacro trends
Construction equipmentMaterial handlingGround support
Mining equipment
Tractors
Agricultural equipment
Gensets
Pumps
Compressors
Trucks
Buses
Rail vehicles

Revenue split by application
9
Other 3 %
€19.8 million (€9.8 million)
(H1 2015)
Automotive 7 %
€41.6 million(€46.6 million)
Mobile Machinery 42 %
€272.7 million(€291.4 million)
Service 22 %
€142.8 million(€140.7 million)
H1 2016
Stationary Equipment 12 %
€77.7 million(€99.7 million)
Agricultural Machinery 14 %
€89.8 million(€82.0 million)
€644.4 million(€670.2 million)
� Pro-forma Automotive revenue(1) incl. equity-accounted JV DEUTZ Dalian: €188.4 million (corresponding
revenue share amounts to 23%)
(1) Considering 100% of JV revenue
10
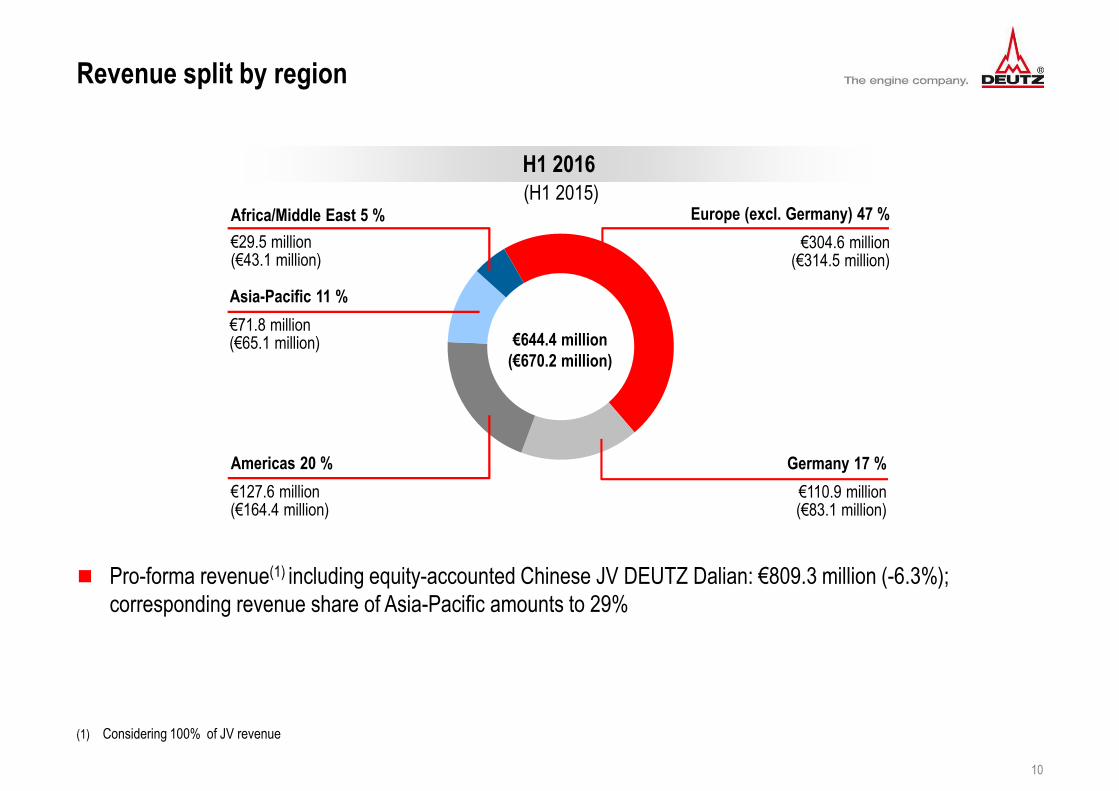
Revenue split by region
� Pro-forma revenue(1) including equity-accounted Chinese JV DEUTZ Dalian: €809.3 million (-6.3%);
corresponding revenue share of Asia-Pacific amounts to 29%
(H1 2015)
H1 2016
Germany 17 %
€110.9 million(€83.1 million)
Europe (excl. Germany) 47 %
€304.6 million(€314.5 million)
Asia-Pacific 11 %
€71.8 million(€65.1 million)
Americas 20 %
€127.6 million(€164.4 million)
Africa/Middle East 5 %
€29.5 million (€43.1 million)
€644.4 million(€670.2 million)
(1) Considering 100% of JV revenue

11
100 104117 116
126 129
2011 2012 2013 2014 2015 2016
� EU Stage IV / US Tier 4 engines
require exhaust after-treatment
devices
� Growing share of new emission
engines drives revenue growth
� Positive structural price mix
effects are expected to continue
in the years to come
� Structural growth due to tighter emissions standards
Average sales price per engine(indexed; FY 2011 = 100)
Emissions standards drive revenue growth
(1) H1 figures annualised
(1)

12
Service business
� Further solid service revenue
growth
� Strong resilience of profitable
service business through
different economic cycles
241.6 250.3 253.7 259.3278.4 285.6
2011 2012 2013 2014 2015 2016
� Continued growth of service revenue
€ million
(1) H1 figures annualised
(1)

DEUTZ activities in China
13
� Consolidation of Chinese production activities at DEUTZ Dalian
� Challenging capital goods market
conditions in China
� Strategic decision to focus our
production in China on our JV
DEUTZ Dalian (DDE) which has
sufficient capacities
� DDE is a 50:50 JV with FAW
producing diesel engines for
local customer demand
� Countrywide sales and service
network
JV DEUTZ Dalian
273.5245.7
319.1359.8
339.5 329.8
100 89107 106
75 74
2011 2012 2013 2014 2015 2016
Revenue (€ million) Unit sales (thousand)(2)
(1) H1 figures annualised
(2) At-equity consolidated; not reflected in the revenue of DEUTZ Group
(1)
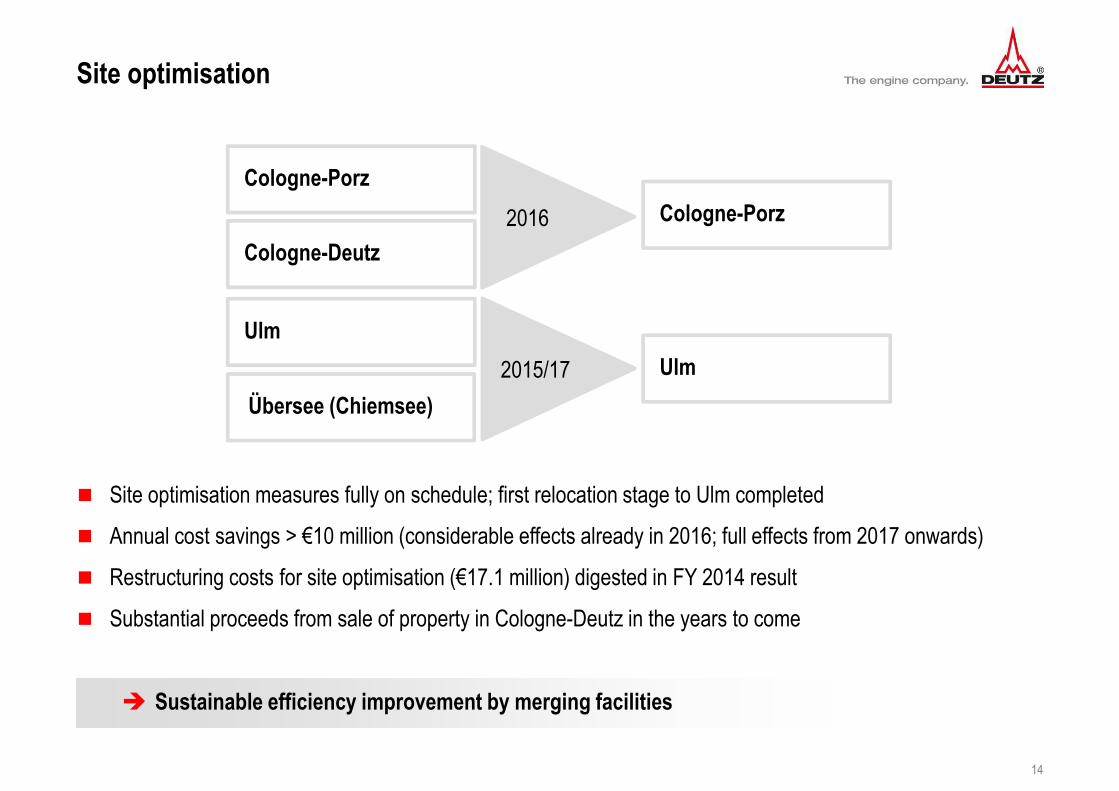
Site optimisation
14
� Site optimisation measures fully on schedule; first relocation stage to Ulm completed
� Annual cost savings > €10 million (considerable effects already in 2016; full effects from 2017 onwards)
� Restructuring costs for site optimisation (€17.1 million) digested in FY 2014 result
� Substantial proceeds from sale of property in Cologne-Deutz in the years to come
Cologne-Porz
Cologne-Deutz
Ulm
Übersee (Chiemsee)
Cologne-Porz
Ulm
� Sustainable efficiency improvement by merging facilities
2016
2015/17

R&D expenditure
15
� R&D expenditure will remain on a moderate level
€ million
84.6
62.1
52.6 53.1
40.845.4
5.5 4.83.6 3.5 3.3 3.5
2011 2012 2013 2014 2015 2016
Net R&D expenditure Net R&D expenditure ratio (%)
� Spending on R&D has been
scaled back due to successful
market launch of new engine
generation
� Ongoing R&D spending in
continuous product innovation
(1) H1 figures annualised
(1)
16
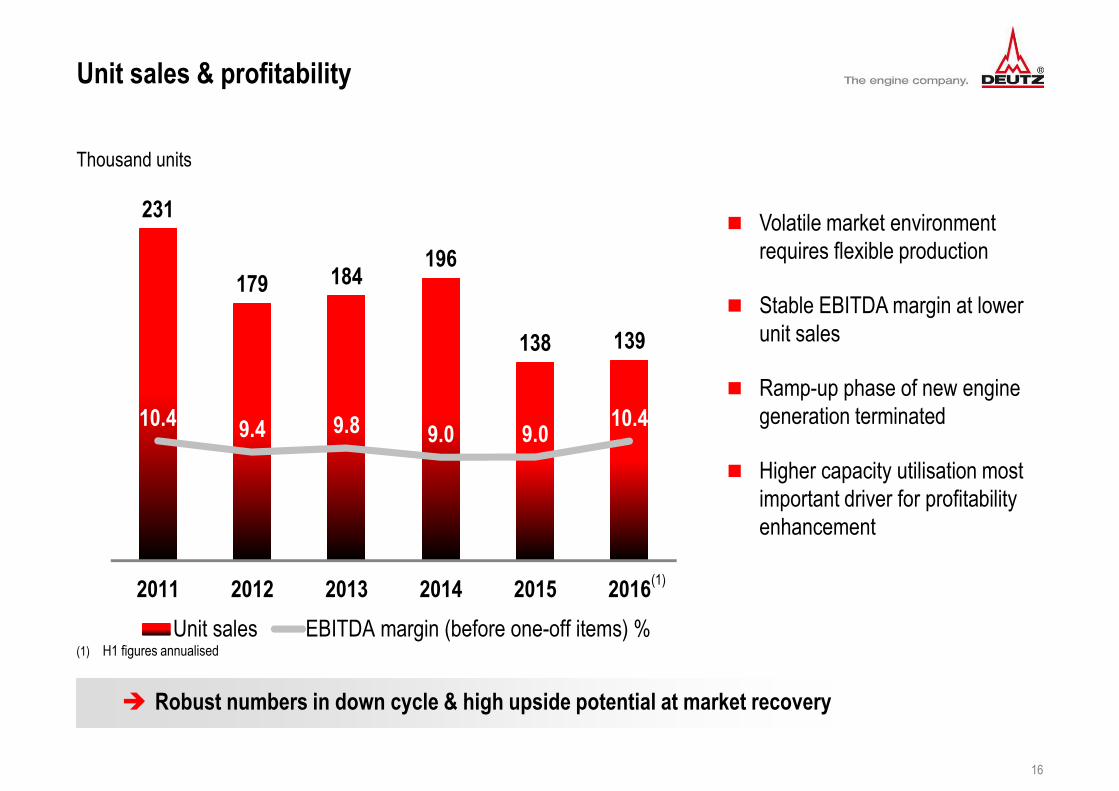
Unit sales & profitability
231
179 184196
138 139
10.4 9.4 9.8 9.0 9.010.4
2011 2012 2013 2014 2015 2016
Unit sales EBITDA margin (before one-off items) %
� Robust numbers in down cycle & high upside potential at market recovery
� Volatile market environment
requires flexible production
� Stable EBITDA margin at lower
unit sales
� Ramp-up phase of new engine
generation terminated
� Higher capacity utilisation most
important driver for profitability
enhancement
(1) H1 figures annualised
(1)
Thousand units

Cash deployment & dividend policy
17
� Stable or growing dividend
Financial strength� Keep equity ratio above 40%
� Robust financial framework in volatile markets
Internal funding� Invest in profitable organic growth projects and service
� Continuous product innovation
Dividend policy� Stable or growing dividend per share
� Dividend payout ~30% of earnings over multi year period

18
Summary: DEUTZ key investment highlights
Successful extension of customer base
Structural growth due to tighter emissions standards
Continued growth of service revenue
Sustainable efficiency improvement by merging facilities
Robust numbers in down cycle
High upside potential at market recovery
Stable or growing dividend

Agenda
19
� DEUTZ strategy & positioning
� Financials
� Outlook

Key figures
20
� Significant operating profit improvement in Q2
New orders
H1 2016
Revenue
EBITDA
EBIT
Net income
yoy
677.2
644.4
66.9
20.7
20.0
+1.0%
-3.8%
-5.0%
+2.0%
+19.8%
€ millionQ2 2016
349.9
344.2
35.6
13.4
11.3
Free cash flow -17.2 -€43.4 million 11.7
qoq
+6.9%
+14.7%
+13.7%
+83.6%
+29.9%
+€40.6 million
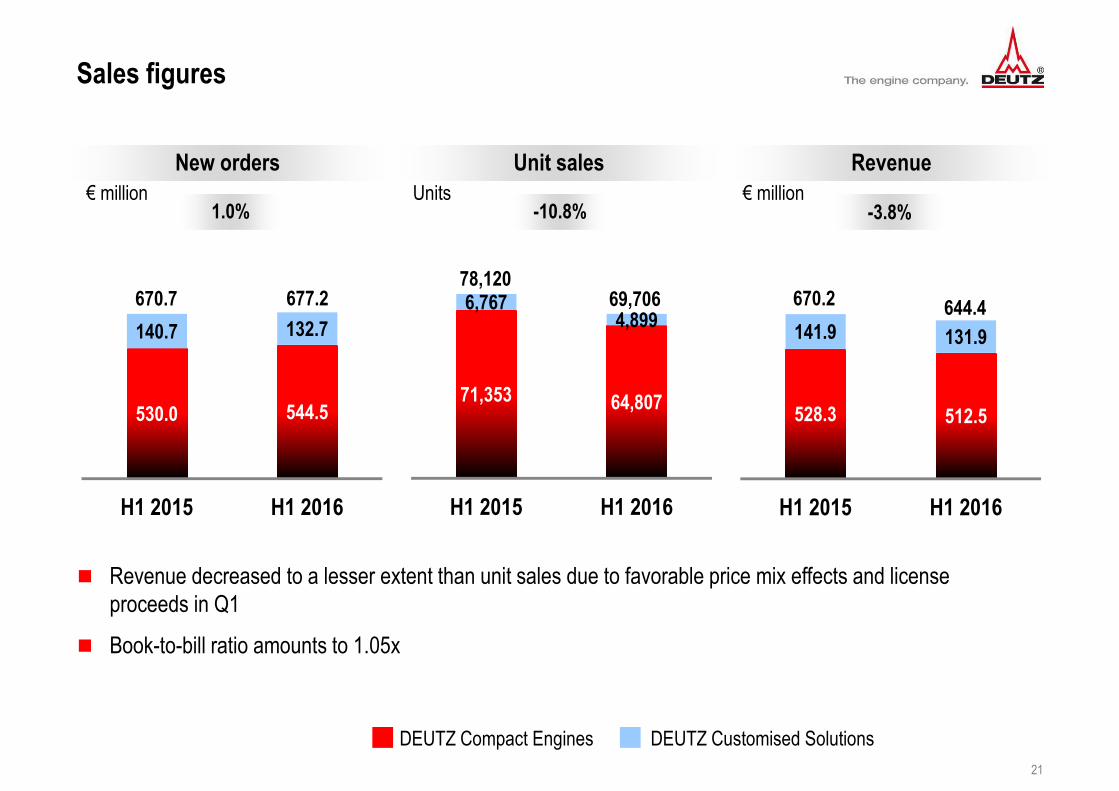
Sales figures
21
€ million
New orders Unit sales RevenueUnits € million
1.0% -10.8% -3.8%
530.0 544.5
140.7 132.7
H1 2015 H1 2016
71,353 64,807
6,7674,899
H1 2015 H1 2016
528.3 512.5
141.9 131.9
H1 2015 H1 2016
644.4677.278,120
69,706670.7 670.2
� Revenue decreased to a lesser extent than unit sales due to favorable price mix effects and license
proceeds in Q1
� Book-to-bill ratio amounts to 1.05x
DEUTZ Compact Engines DEUTZ Customised Solutions
22
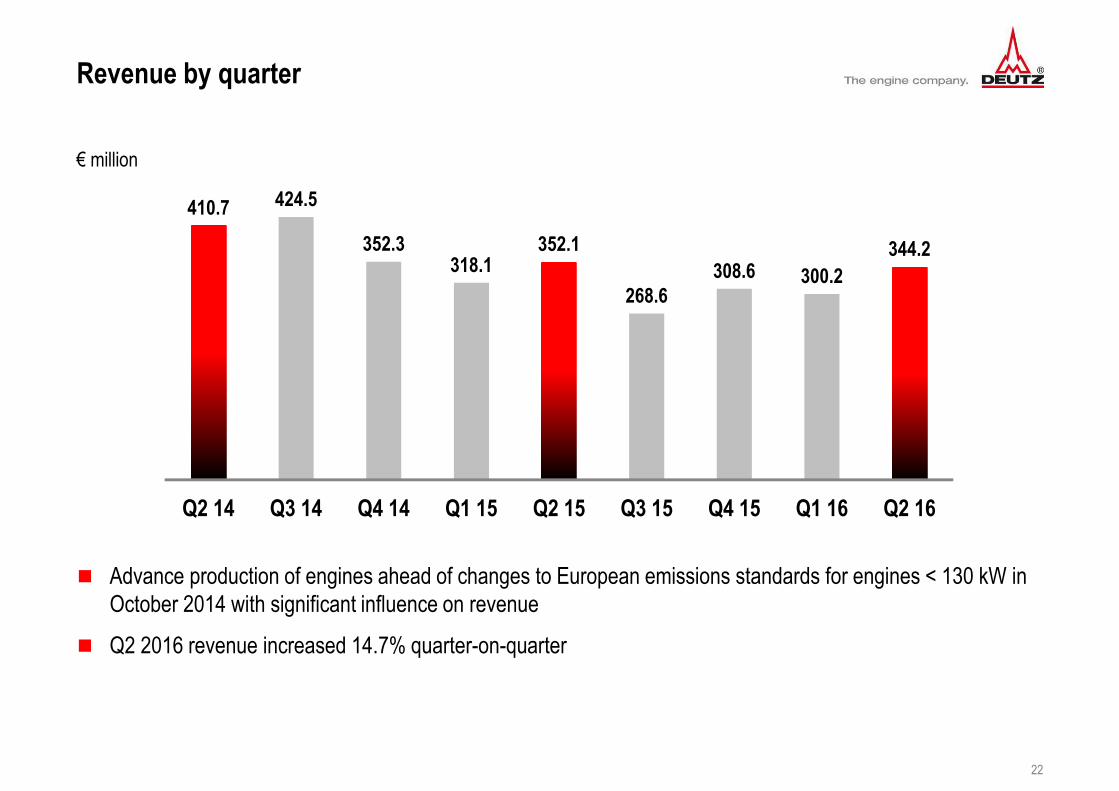
Revenue by quarter
410.7 424.5
352.3318.1
352.1
268.6308.6 300.2
344.2
Q2 14 Q3 14 Q4 14 Q1 15 Q2 15 Q3 15 Q4 15 Q1 16 Q2 16
� Advance production of engines ahead of changes to European emissions standards for engines < 130 kW in
October 2014 with significant influence on revenue
� Q2 2016 revenue increased 14.7% quarter-on-quarter
€ million
23
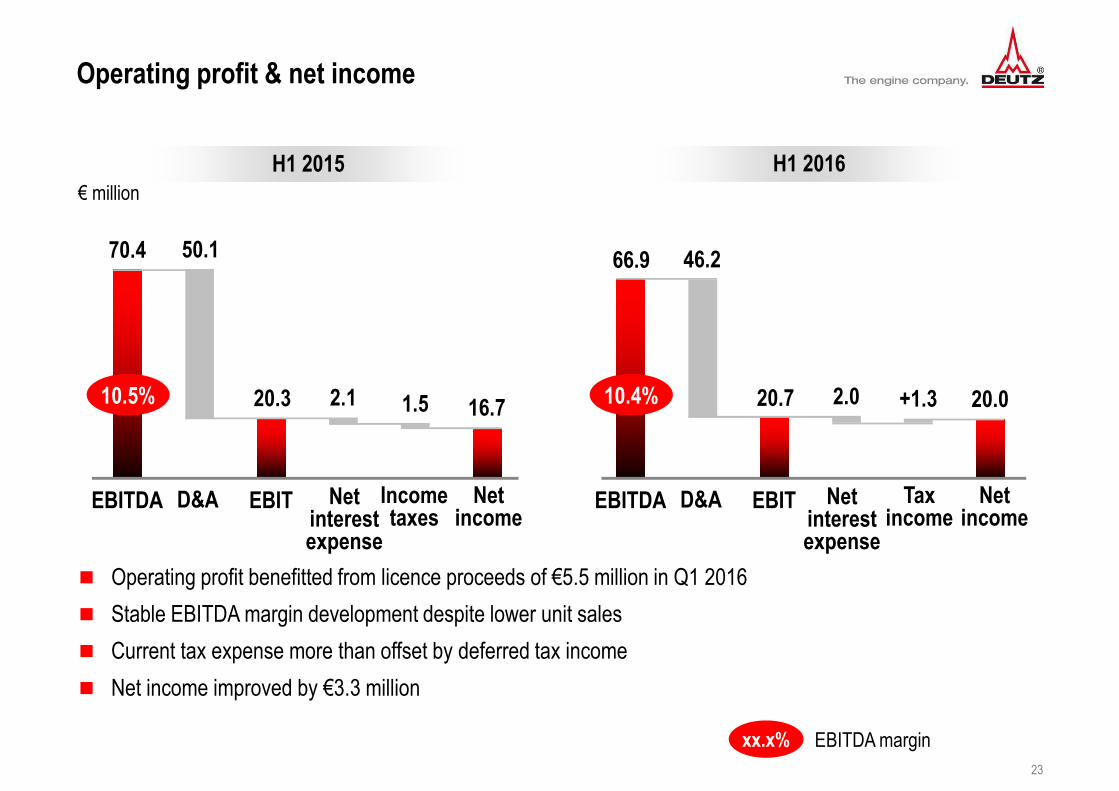
Operating profit & net income
EBITDA margin
H1 2015 H1 2016
� Operating profit benefitted from licence proceeds of €5.5 million in Q1 2016
� Stable EBITDA margin development despite lower unit sales
� Current tax expense more than offset by deferred tax income
� Net income improved by €3.3 million
20.3 20.716.7
70.4 66.9
20.0
50.1
2.1 1.5 2.0 +1.3
46.2
€ million
EBITDA EBIT Netincome
D&A Netinterestexpense
Incometaxes
10.4%
EBITDA EBIT Netincome
D&A Netinterestexpense
Taxincome
10.5%
xx.x%

EBIT
24
-4.6 +4.1+0.9
H1 2015 H1 2016
� Slight EBIT margin increase attributable to cost improvements and lower depreciation
� Operating profit decline at DEUTZ Compact Engines due to lower unit sales and higher R&D costs
� Licence proceeds at DEUTZ Customised Solutions overcompensated decrease in business volume
EBIT margin 3.0% 3.2%
20.3 20.7
DEUTZ Compact Engines
€ million
DEUTZ Customised Solutions Other

Segment: DEUTZ Compact Engines
25
� New orders increased 2.7% year-on-year and 9.9% quarter-on quarter
� Revenue increased 17.6% quarter-on quarter
� Operating profit increase in Q2 on the back of higher production volume and cost improvements
€ million
H12016
H1
2015
Change
in %
New orders 544.5 530.0 2.7
Unit sales 64,807 71,353 -9.2
Revenue 512.5 528.3 -3.0
EBIT 1.9 6.5 -70.8
€ million
Q22016
Q1
2016
Change
in %
New orders 285.1 259.4 9.9
Unit sales 35,037 29,770 17.7
Revenue 277.0 235.5 17.6
EBIT 4.2 -2.3 --

Segment: DEUTZ Customised Solutions
26
� Unit sales declined year-on-year mainly due to Mobile Machinery (-32.6%) and Stationary Equipment (-32.7%)
� Revenue share of service business amounts to 44.6%
� Q1 operating profit benefitted from licence proceeds of €5.5 million
� EBIT in Q2 increased quarter-on-quarter due to higher production volume, cost improvements and positive
mix effects
€ million
H12016
H1
2015
Change
in %
New orders 132.7 140.7 -5.7
Unit sales 4,899 6,767 -27.6
Revenue 131.9 141.9 -7.0
EBIT 21.4 17.3 23.7
€ million
Q22016
Q1
2016
Change
in %
New orders 64.8 67.9 -4.6
Unit sales 2,557 2,342 9.2
Revenue 67.2 64.7 3.9
EBIT 11.2 10.2 9.8
27
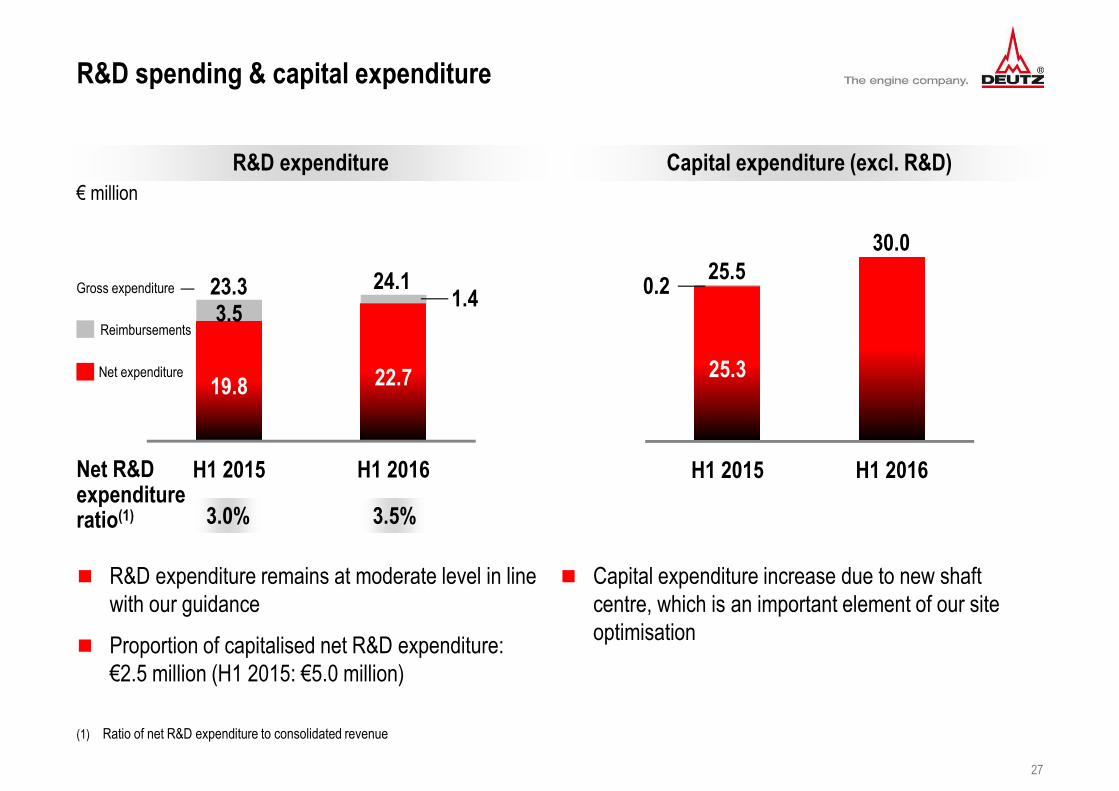
R&D spending & capital expenditure
(1) Ratio of net R&D expenditure to consolidated revenue
3.0%
Capital expenditure (excl. R&D)R&D expenditure
� R&D expenditure remains at moderate level in line
with our guidance
� Proportion of capitalised net R&D expenditure:
€2.5 million (H1 2015: €5.0 million)
� Capital expenditure increase due to new shaft
centre, which is an important element of our site
optimisation
Net R&Dexpenditure ratio(1)
19.8 22.7
3.5
H1 2015 H1 2016
23.3
3.5%
25.3
H1 2015 H1 2016
25.530.0
Net expenditure
Reimbursements
Gross expenditure 0.224.1
€ million
1.4
28
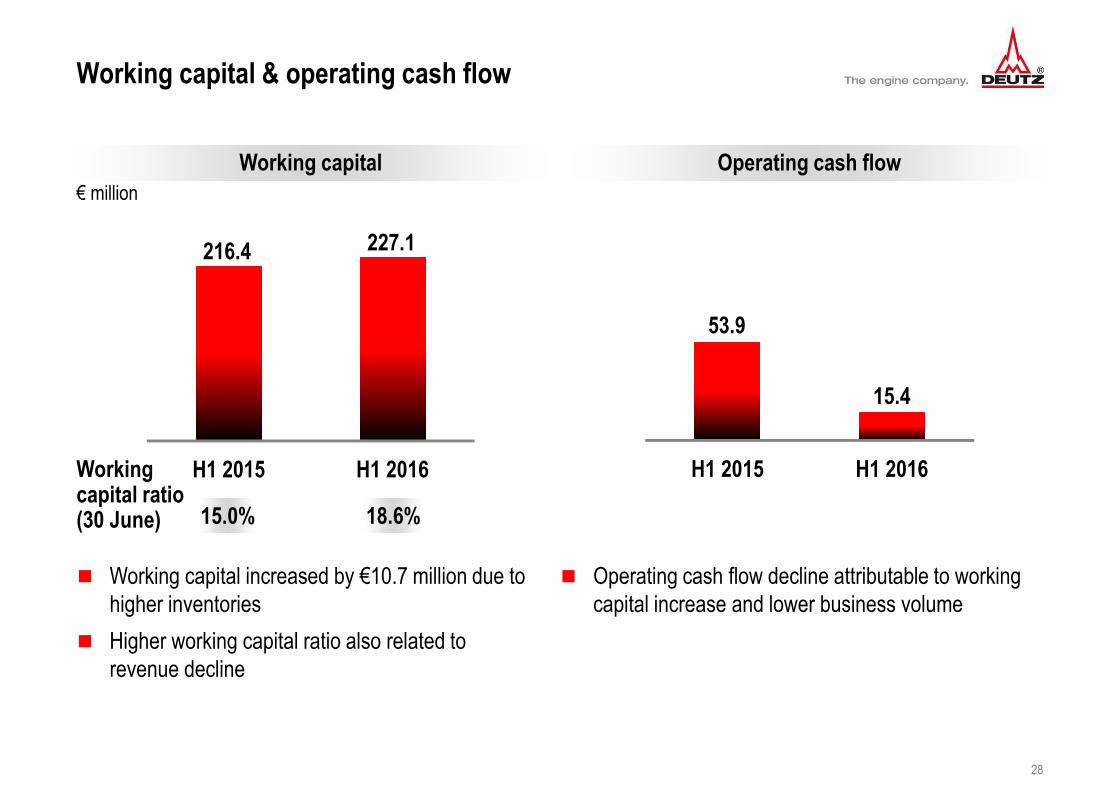
Working capital & operating cash flow
Operating cash flow
H1 2015 H1 2016
15.4
53.9
Working capital
� Working capital increased by €10.7 million due to
higher inventories
� Higher working capital ratio also related to
revenue decline
H1 2015 H1 2016
216.4
Working capital ratio (30 June) 15.0% 18.6%
227.1
€ million
� Operating cash flow decline attributable to working
capital increase and lower business volume

29
Free cash flow generation & net financial position
� Net financial position remains in positive territory
2015 H1 2016 (LTM)
35.0
� Free cash flow in Q2 2016 amounted to +€11.7
million
Net financial positionFree cash flow(1)
€ million
-8.4
H1 2015 H1 2016
13.1
33.2
(1) Free cash flow: cash flow from operating and investing activities less net interest expense

30
Equity ratio & funding
� Strong balance sheet
� Medium- to long-term financing with undrawn facilities available:
• Duration of €160 million credit line until May 2020
• Loan from European Investment Bank repayable until July 2020
1,088.1 1,103.8
16 15 35 1
495.6 494.5
160
2015 H1 2016 up to1 year
up to2 years
up to5 years
up to10 years
45.5% 44.8%
€ million
Total assets Equity Equity ratio Repayment schedule Duration of credit lines xx.x%
Agenda
31
� DEUTZ strategy & positioning
� Financials
� Outlook

32
Market assessment
Construction equipment Europe
2016
Construction equipment North America
Construction equipment China
Agricultural Machinery Europe
Automotive China
-5% to +5%
-5% to 0%(previous: -5% to +5%)
� Recovery of key application markets not yet visible
� US rental companies reluctant to invest in new equipment
� Chinese construction equipment market expected to remain challenging
-20% to -10%
-5% to 0%
-5% to +5%
Unit sales (equipment)(1)
(1) Numbers refer to end markets. DEUTZ business may differ due advance production of engines
33
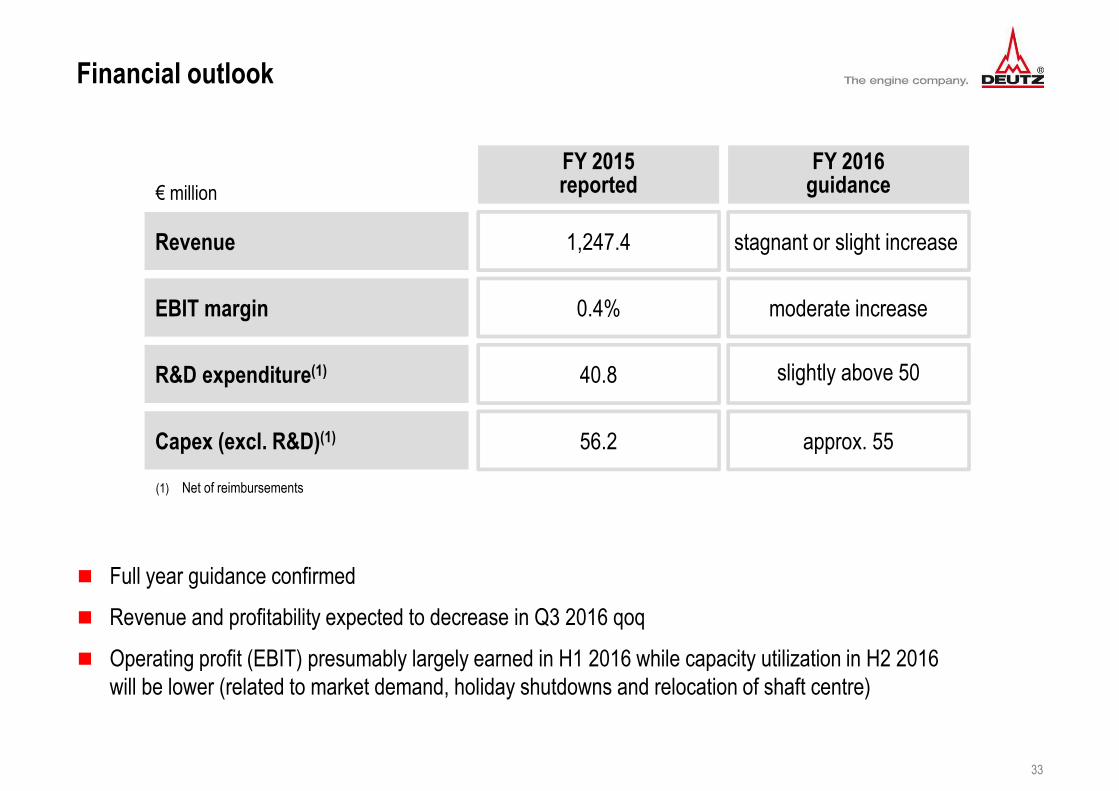
Financial outlook
Revenue
EBIT margin
R&D expenditure(1)
Capex (excl. R&D)(1)
FY 2015reported
FY 2016guidance
1,247.4
0.4%
40.8
56.2
stagnant or slight increase
moderate increase
slightly above 50
approx. 55
€ million
(1) Net of reimbursements
� Full year guidance confirmed
� Revenue and profitability expected to decrease in Q3 2016 qoq
� Operating profit (EBIT) presumably largely earned in H1 2016 while capacity utilization in H2 2016
will be lower (related to market demand, holiday shutdowns and relocation of shaft centre)

34
Financial calendar & contact details
� Interim management statement 1st to 3rd quarter 2016 8 November 2016
� Annual report FY 2016 16 March 2017
� Annual general meeting 4 May 2017
� Contact details
� Christian Krupp Tel:+49 (0) 221 822 5400
� SVP Finance, Public and Investor Relations Fax:+49 (0) 221 822 15 5400
� Ottostrasse 1 Email: [email protected]
� 51149 Cologne (Porz-Eil), Germany www.deutz.com

Disclaimer
35
Unless stated otherwise, all the figures given in this presentation refer to continuing operations.
The details given in this document are based on the information available at the time it was prepared. This
presents the risk that actual figures may differ from forward-looking statements. Such discrepancies may be
caused by changes in political, economic or business conditions, a decrease in the technological lead of
DEUTZ's products, changes in competition, the effects of movements in interest rates or exchange rates, the
pricing of parts supplied and other risks and uncertainties not identified at the time this document was prepared.
The forward-looking statements made in this document will not be updated.