deutsche bank’s ama model)
TRANSCRIPT

Deutsche Bank’s AMA Model
Michael KalkbrenerLRC, Risk Analytics & Instruments
Challenges for Operational Risk Measurement and ManagementFederal Reserve Bank of Boston, May 14, 2008
Deutsche Bank’s AMA Model · page 2
Risk Analytics & Instruments
Agenda
AMA at DB1.
Main components of an LDA model2.
Appendix: model validation 3.
For more information:
F. Aue and M. Kalkbrener (2006). LDA at work: Deutsche Bank’s approach to quantifying operational risk. J. Operational Risk, 1(4), 49-93.

Deutsche Bank’s AMA Model · page 3
Risk Analytics & Instruments
AMA Model Development at Deutsche Bank
Timeline1999 Systematic collection of loss data2000 Economic capital with LDA
- Top-down model: loss distribution at Group level, capital allocation with risk indicators
- Internal and external loss data- Qualitative adjustment with Incentive Scheme
2001 AMA project2002 Development of AMA model2003 Implementation of prototype 2004 EC test calculations with AMA model2005 Official EC calculation with AMA model (starting Q2 05)2006 Implementation of production engine
AMA application submitted in September2007 Regulatory approval
Deutsche Bank’s AMA Model · page 4
Risk Analytics & Instruments
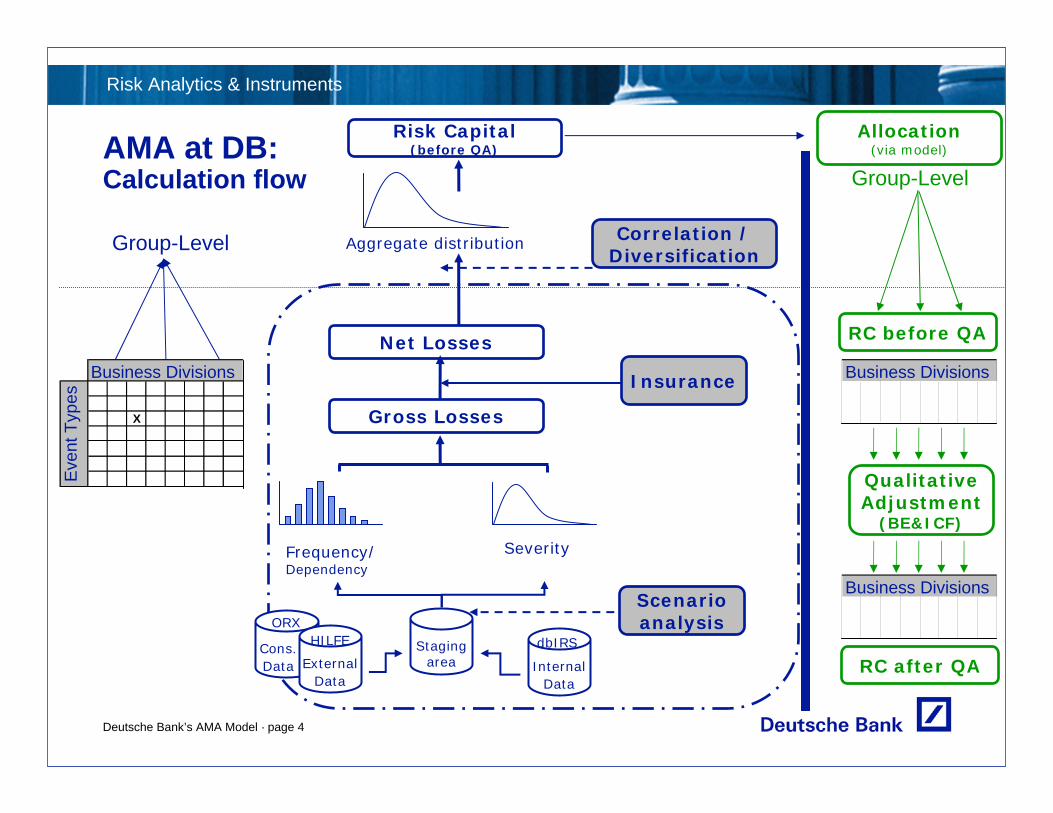
AMA at DB: Calculation flow
Group-Level
X
Business Divisions
Eve
ntTy
pes
Allocation(via model)
Risk Capital (before QA)
Group-Level
Qualitative Adjustment
(BE&ICF)
Business Divisions
RC after QA
RC before QA
Business Divisions
Cons.Data
Frequency/ Dependency
ORX
ExternalData
InternalData
Stagingarea
dbIRS
Gross Losses
Net Losses
Severity
Aggregate distribution
Scenario analysis
Insurance
Correlation / Diversification
HILFE

Deutsche Bank’s AMA Model · page 5
Risk Analytics & Instruments
DB’s Business Line / Event Type Matrix
BL1 BL2 BL3 BL4 BL5 BL6 GroupInternal FraudExternal FraudDamage to physical assetsBusiness disruption …Clients, Products, Business Practices
Clients, Products, Business Practices
Execution, delivery, process management
Execution, delivery, process management
Employment practices, workplace safety
Employment practices, workplace safety
Business LinesBasel Level 1 Internal Event Types
Infrastructure
Fraud
Design criteria– comparable loss profile– same insurance type– same management responsibilities– availability of data – relative importance of cells
Treatment of losses that cannot be assigned to a single cell– Group losses– Split losses

Deutsche Bank’s AMA Model · page 6
Risk Analytics & Instruments
Agenda
AMA at DB1.
Main components of an LDA model2.
Appendix: model validation3.

Deutsche Bank’s AMA Model · page 7
Risk Analytics & Instruments
Data RC before QA
Business Division
Eve
ntTy
pe
Cons.Data External
DataInternal
Data
Stagingarea
dbIRS
Gross Losses
Net Losses
Severity
Aggregate distribution
Frequency
Scenario analysis
Insurance
Group-Level
X
Correlation / Diversification
ORXHILFE

Deutsche Bank’s AMA Model · page 8
Risk Analytics & Instruments
Data for Modelling Loss DistributionsData sources
Internal loss data Consortium dataCommercial loss database Scenarios
Internal loss data is the most important data sourceEach firm’s operational losses are a reflection of its underlying operational risk exposureInternal losses are used for– modelling frequencies (exclusively)– modelling severities– estimating correlations
Motivation for using external data and scenariosAdditional information on severity profile, in particular on risk of unexpected losses (tails of severity distributions)

Deutsche Bank’s AMA Model · page 9
Risk Analytics & Instruments
Creating a Relevant Loss Data Set
Public
Consortium
Exclude non-fin. inst. and
insurance data
DB Access Database
To be used for scenario analysis
Map all OR losses to BLET Matrix
Exclude DB losses
Exclude Loan Fraud data
BL review and approval of external points
RC Engine
Scenarios are added as individual data points to relevant external losses

Deutsche Bank’s AMA Model · page 10
Risk Analytics & Instruments
Scenario Analysis Process and Methodology
RC
OpVardata
Enriched scenario
data
RelevantOpVardata
Existing RLD process for OpVar events is integral part of scenario analysisEach relevant OpVar data point is considered a scenario
OpVar data is enriched to close gaps through following processes:Divisional Expert driven processControl function driven process (e.g. BCM, Outsourcing)Regions for region specific events
Same treatment of scenarios and OpVar data points in RC calculation
Deutsche Bank’s AMA Model · page 11
Risk Analytics & Instruments
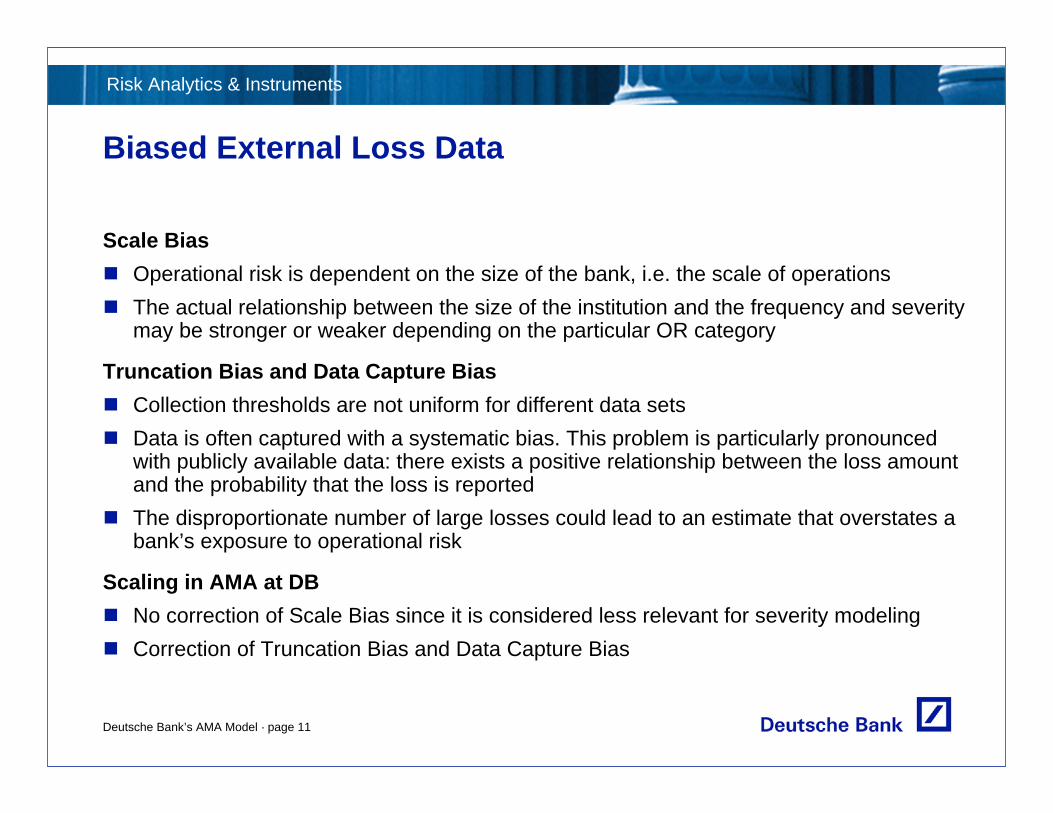
Biased External Loss Data
Scale BiasOperational risk is dependent on the size of the bank, i.e. the scale of operationsThe actual relationship between the size of the institution and the frequency and severity may be stronger or weaker depending on the particular OR category
Truncation Bias and Data Capture Bias Collection thresholds are not uniform for different data setsData is often captured with a systematic bias. This problem is particularly pronounced with publicly available data: there exists a positive relationship between the loss amount and the probability that the loss is reportedThe disproportionate number of large losses could lead to an estimate that overstates a bank’s exposure to operational risk
Scaling in AMA at DBNo correction of Scale Bias since it is considered less relevant for severity modelingCorrection of Truncation Bias and Data Capture Bias

Deutsche Bank’s AMA Model · page 12
Risk Analytics & Instruments
Frequency Modelling
Business Division
Eve
ntTy
pe
Cons.Data External
DataInternal
Data
Stagingarea
dbIRS
Gross Losses
Net Losses
RC before QA
Severity
Aggregate distribution
Frequency
Scenario analysis
Insurance
Group-Level
X
Correlation / Diversification
ORXHILFE

Deutsche Bank’s AMA Model · page 13
Risk Analytics & Instruments
Frequencies in AMA at DB
DataOnly internal loss data is used for calibrating frequency distributions:
Internal loss data reflects DB’s loss profile most accuratelyDifficult to ensure completeness of external data (essential for application in frequency calibration)Lower data requirements in frequency modeling (compared to severity modeling)
Implemented distributionsPoisson (no dependence between occurrence of events in a cell)Negative Binomial (positive dependence)Selection algorithm based on statistical tests
Frequency distributions in official capital calculationsPoisson in all cells Reason: negligible difference to combination of Poisson and Negative Binomial cells

Deutsche Bank’s AMA Model · page 14
Risk Analytics & Instruments
Severity Modelling
Business Division
Eve
ntTy
pe
Cons.Data External
DataInternal
Data
Stagingarea
dbIRS
Gross Losses
Net Losses
RC before QA
Severity
Aggregate distribution
Frequency
Scenario analysis
Insurance
Group-Level
X
Correlation / Diversification
ORXHILFE

Deutsche Bank’s AMA Model · page 15
Risk Analytics & Instruments
Modelling Decisions
Range of distributionOne distribution for the entire severity range or different distributions for small, medium and high losses?
Choice of distribution family Two-parametric distributions like lognormal, GPD or more flexible distribution families, i.e. three- or four-parametric, or even empirical distributions?One distribution family for all cells or selection of “best” distribution based on quality of fit?
Mixing internal and external dataHow much weight is given to internal and external data?How to combine internal and external data?

Deutsche Bank’s AMA Model · page 16
Risk Analytics & Instruments
Severities in AMA at DB
Range of distribution and choice of distribution familyIn many cells, data characteristics are different for small and big losses
Different distributions for body and tail– Body: non-parametric (empirical) distribution – Tail: modified technique from Extreme Value Theory for tail modelling
Empirical and parametric distributions are combined via a weighted sum applied to the cumulative distribution functions
Mixing internal and external dataInternal data for calibrating body of distribution
Internal and external data for calibrating tail

Deutsche Bank’s AMA Model · page 17
Risk Analytics & Instruments
Core Idea: Piecewise Defined Severity Distributions
0
0.2
0.4
0.6
0.8
1
1.2
10,000 100,000 1,000,000 10,000,000 100,000,000 1,000,000,000 10,000,000,000
x (log scale)
P( L
oss
>= x
)
First section: given by empiric distribution of cell specific internal dataMid section: given by weighted average of
empiric distribution of cell specific internal dataempiric distribution of cell specific external and scenario data
Tail section: given by weighted average ofempiric distribution of cell specific internal dataempiric distribution of cell specific external and scenario dataparametric distribution calibrated on all data >= 50mn

Deutsche Bank’s AMA Model · page 18
Risk Analytics & Instruments
Modelling Insurance
Business Division
Eve
ntTy
pe
Cons.Data External
DataInternal
Data
Stagingarea
dbIRS
Gross Losses
Net Losses
RC before QA
Severity
Aggregate distribution
Frequency
Scenario analysis
Insurance
Group-Level
X
Correlation / Diversification
ORXHILFE

Deutsche Bank’s AMA Model · page 19
Risk Analytics & Instruments
Insurance in AMA at DB
Gross Losses
Net Losses
Simulated gross losses
Net losses
Mapping Policies
Insurance
Insurance calculation processOR event types are mapped to insurance policiesInsurance policies are modelled individually, e.g. by specifying deductible, limits and haircutInsurance payment is calculated for each of the simulated gross losses separately

Deutsche Bank’s AMA Model · page 20
Risk Analytics & Instruments
Insurance Mapping
Fraud
Infrastructure
Execution, Delivery & Process Management
Clients, Products & Business Practices
Property Damage
General Liability
Professional Liability
Employers Practice Liability
Not insured
Service & Elec. Break-Down
Fidelity
Burglary, Theft, Robbery
OR event types Insurance policies
Employment Practices & Workplace Safety
80%
10%10%

Deutsche Bank’s AMA Model · page 21
Risk Analytics & Instruments
Deductible: amount the bank has to cover by itself
Cap: maximum amount compensated by the insurer
Modelling Insurance Contracts
Aggregate caps
Haircuts (regulatory requirements)
Additional features
Compensation,Net loss
Compensation
Gross loss (x)
Deductible (d) Cap (c)
Net loss
Deductible + Cap
Cap (c)
Deductible (d)
))0,max(,min( dxc −
Deutsche Bank’s AMA Model · page 22
Risk Analytics & Instruments
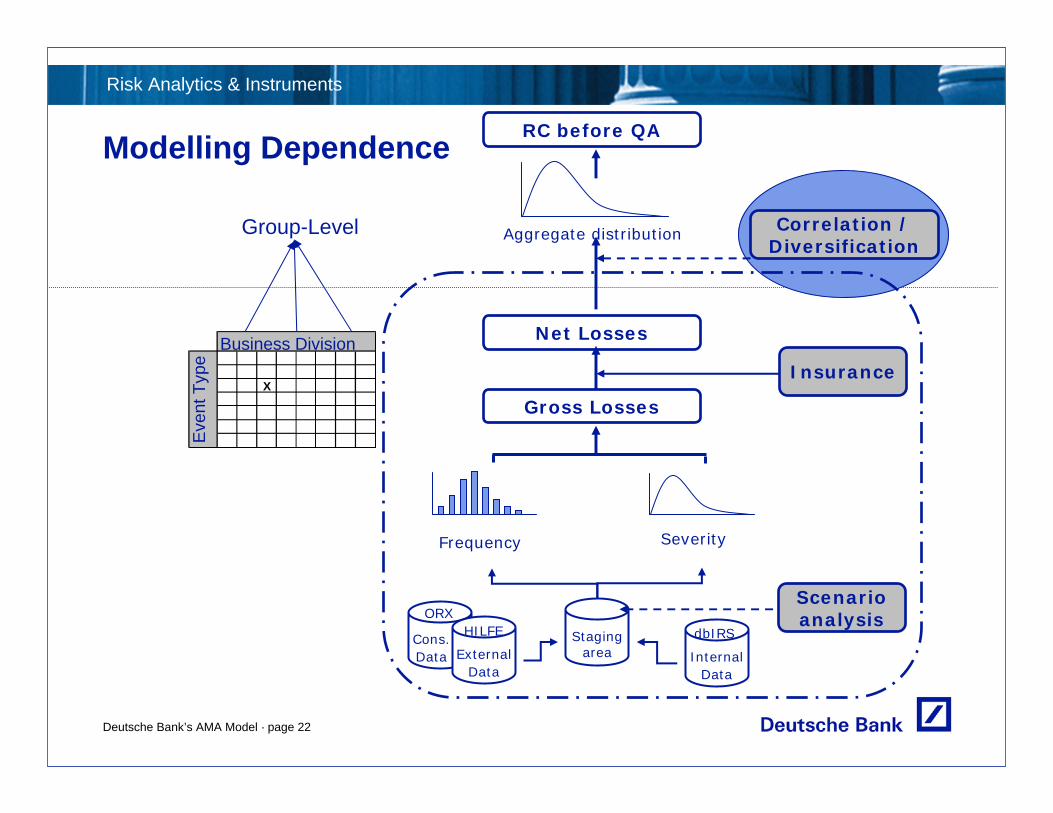
Modelling Dependence
Business Division
Eve
ntTy
pe
Cons.Data External
DataInternal
Data
Stagingarea
dbIRS
Gross Losses
Net Losses
RC before QA
Severity
Aggregate distribution
Frequency
Scenario analysis
Insurance
Group-Level
X
Correlation / Diversification
ORXHILFE

Deutsche Bank’s AMA Model · page 23
Risk Analytics & Instruments
Analyzing Dependence
Dependence in a bottom-up LDAWithin cells– Dependence between the occurrence of loss events – Dependence between the frequency distribution and the severity distribution– Dependence between the severity samples
Between cells– Dependence between the frequency distributions– Dependence between the severity distributions
Statistical analyses performed at Deutsche BankBased on internal loss data
Identification of dependence between– occurrence of loss events within a cell => Frequency distribution not Poisson– frequency distributions in different cells => Copula applied to frequencies

Deutsche Bank’s AMA Model · page 24
Risk Analytics & Instruments
Dependence in AMA at DB
FrequenciesGaussian copula applied to frequency distributions
Severities Sum of split losses
Severities of different loss events are independent
Example: Gaussian copula applied to a Poisson and a Negative Binomial distribution
uncorrelated Correlation factor in Gaussian copula
5.0

Deutsche Bank’s AMA Model · page 25
Risk Analytics & Instruments
Calculation of Capital
Business Division
Eve
ntTy
pe
Cons.Data External
DataInternal
Data
Stagingarea
dbIRS
Gross Losses
Net Losses
RC before QA
Severity
Aggregate distribution
Frequency
Scenario analysis
Insurance
Group-Level
X
Correlation / Diversification
ORXHILFE

Deutsche Bank’s AMA Model · page 26
Risk Analytics & Instruments
Aggregate Loss Distribution
Risk Capital
Expected Shortfall
Unexpected Loss
Expected Loss Loss
Thr
esho
ld
Qua
ntile
Prob
abili
ty
Average
Calculation and Allocation of Risk Capital
Aggregate loss distribution: Monte Carlo simulation
Economic Capital: 99.98% Quantile minus Expected LossRegulatory Capital: 99.9% Quantile minus Expected Loss
Capital allocationCell level: Expected Shortfall allocationDivisional level: Aggregation of EC in divisional cells plus
proportional contributions of Group cells

Deutsche Bank’s AMA Model · page 27
Risk Analytics & Instruments
RC before QA
Scenario analysis
Cons.Data External
DataInternal
Data
Stagingarea
dbIRSORX
HILFE
Aggregate distributionCorrelation
Gross Losses
Net Losses
SeverityFrequency/ Dependency
Insurance
KRIData
LossData
Qualitative Adjustment (BE&ICF)
RC after QA
Business Divisions
SATData
Allocation(by model)
Group-Level
Business Divisions
RC before QA
Qualitative Adjustment
Deutsche Bank’s AMA Model · page 28
Risk Analytics & Instruments
Qualitative Adjustment in DB’s OR Model
Qualitative adjustment applied to contributory capital of business lines– QA is separated from the quantitative capital calculation– Simple and transparent but difficult to justify with statistical means
Main facts on QA– Risk indicators and self assessment are main components– QA score (applied on BL /ET level) plus penalty component (inappropriate loss
data collection, KRI/SAT minimum standards, etc.)– Insurance OR capital may be adjusted by +40% to -40% – Measurement of risk sensitivity and coverage determines range
Key risk indicators– Global KRIs: HR, BCM, open issues (Audit, SOX, db-Track), NPA, Technology
Risk– Business specific KRIs, e.g. nostro reconciliations, outstanding confirmations,
average processing time of customer complaints

Deutsche Bank’s AMA Model · page 29
Risk Analytics & Instruments
Agenda
AMA at DB1.
Main components of an LDA model2.
Appendix: model validation3.

Deutsche Bank’s AMA Model · page 30
Risk Analytics & Instruments
Validation
Basic properties of LDA modelVariance analysisLoss distributions for heavy-tailed severities
Sensitivity analysis of basic components of LDA modelsFrequenciesSeveritiesDependenceInsurance
Impact analysis of stress scenariosBacktesting and benchmarking
Benchmarking the tail of the aggregate loss distribution against individual data points

Deutsche Bank’s AMA Model · page 31
Risk Analytics & Instruments
Variance AnalysisCell level
2)()()()( SEFVarSVarFE ⋅+⋅
Variance analysis– does not provide information on quantiles of loss distribution – but: quantifies impact of frequencies and severities on volatility of aggregate losses– is independent of specific distribution assumptions
Variance of aggregate losses (F and S: frequency and severity distribution):
ConclusionImportance of frequency distribution depends on relationship of Var(F)/E(F)(frequency vol) and Var(S)/E(S)2 (severity vol)
In high impact cells, the volatility of severities dominates and the actual form of the frequency distribution is of minor importance:
2)()()()( SEFVarSVarFE ⋅+⋅

Deutsche Bank’s AMA Model · page 32
Risk Analytics & Instruments
Variance AnalysisGroup level
∑ ∑= ≠=
⋅⋅+⋅+⋅m
j
m
kjkjkjkjjjjj SESEFFCovSEFVarSVarFE
1 ,1,
2 )()(),()()()()(
Frequency correlationsVariance of loss distribution at Group level
Variance in the homogeneous model (c: homogeneous correlation coefficient)
Impact of frequency correlations depends onnumber of (relevant) cells m and
relationship of Var(F)/E(F) (frequency vol) and Var(S)/E(S)2 (severity vol)
In general, the impact of frequency correlations is rather limited and less significant than the impact of correlations of severities or loss distributions
))1)1(()()()()(( 2 +−⋅⋅⋅+⋅⋅ mcSEFVarSVarFEm

Deutsche Bank’s AMA Model · page 33
Risk Analytics & Instruments
Loss Distributions for Heavy-Tailed Severities
1)),...,(max(
)...(lim1
1 =>
>++∞→ xXXP
xXXP
n
nx
Subexponential distributionsHeavy-tailed: tail decays to 0 slower than any exponential Exp[a*x], a<0
Tail of the sum of subexponential variables has the same order of magnitude as tail of the maximum:
Aggregate loss distributions of subexponential severitiesLet F be a frequency distribution
S the distribution function of a subexponential severity
G the distribution function of the aggregate loss distribution
Under general conditions on F (satisfied by Poisson and Negative Binomial):
)(1:)( ere wh),()()(lim xSxSFE
xSxG
x−==
∞→

Deutsche Bank’s AMA Model · page 34
Risk Analytics & Instruments
Sensitivity Analysis of Basic LDA Components
Based on theoretical results and experience with Deutsche Bank’s LDA model
Frequency distributions– Mean of frequency distribution is important– Shape has limited impact on capital in cells with fat-tailed severities– Shape has limited impact on Group capital
Severity distributions– Weights and techniques for combining different data sources are important– Significant impact of distribution assumptions for severity tails and tail probabilities
Dependence– Impact depends on the level where dependence is modelled, e.g. frequencies,
severities or aggregate losses– Limited impact of frequency correlations

Deutsche Bank’s AMA Model · page 35
Risk Analytics & Instruments
Sensitivity Analysis of Insurance Model
Clients, Products & Business Practices consumes most of the capital– Impact of mapping percentages to insurance contracts– Most severe losses fall under Professional Liability: single limit of PL is particularly
important
Higher reduction (in percentage) for median (EL) than for high quantiles (EC and RC)
Insurance may cause reallocation of capital between different event types
Fraud
Infrastructure
Execution, Delivery & Process Management
Clients, Products & Business Practices
Property Damage
General Liability
Professional Liability
Employers Practice Liability
Not insured
Service & Elec. Break-Down
Fidelity
Burglary, Theft, Robbery
OR event types Insurance policies
Employment Practices & Workplace Safety

Deutsche Bank’s AMA Model · page 36
Risk Analytics & Instruments
Stressing Loss Data
Impact on cell capital
-20.00
-10.00
-
10.00
20.00
30.00
40.00
50.00
60.00
Total
Fraud / BL 4
Impact on divisional capital
BL 1BL 2 BL 3
BL 4
BL 5
BL 6-10,00-5,00
-5,00
10,0015,0020,0025,0030,0035,0040,00
Methodology: Add (remove) internal and/or external losses and analyze impact on capital
Stress ScenarioAdd 200mn loss in a Fraud cell
Impact on capitalFraud / BL 4: +50mnBL 4: +35mnGroup: +15mn

Deutsche Bank’s AMA Model · page 37
Risk Analytics & Instruments
Backtesting and Benchmarking
Backtesting– Sequential testing of a model against reality to check the accuracy of the
predictions– Backtesting is frequently used for the validation of market risk models– In credit and operational risk, the inherent shortage of loss data severely
restricts the application of backtesting techniques to capital models
Benchmarking– Comparison of a bank's operational risk capital charge against a bank's
close peers– Comparison of the AMA capital charge against the BIA or TSA capital
charges– Comparison of the LDA model outputs against adverse extreme, but
realistic, scenarios
These tests help to provide assurance over the appropriateness of the level of capital but there are obvious limitations

Deutsche Bank’s AMA Model · page 38
Risk Analytics & Instruments
BenchmarkingTail of aggregate loss distribution versus individual data points
Based on assumption that these tails have the same order of magnitude:– Tail of aggregate loss distribution calculated in a bottom-up LDA model– Tail of loss distribution directly specified at Group level
Loss distribution specified at Group level:– Take all losses (across business lines and event types) above a high
threshold, say 1m, for the specification of a severity distribution S– Calculate the bank's average annual loss frequency n above 1m
Under the assumption that S is subexponential, identify
SquantilesnSSquantiles
SSquantiles
n
n
on distributiseverity theof )/)1((1 with),...,max(on distributi maximum theof
with...on distributi loss theof
1
1
−−−−
++−
ααα

Deutsche Bank’s AMA Model · page 39
Risk Analytics & Instruments
Benchmarking Result1-((1-alpha)/n) – quantiles of the severity distribution correspond to individual losses for appropriate alpha and n
The amount of loss data provides a limit for the confidence level that can be derived directly from the data
Application of this method to DB's LDA model