deterministic processes guide long-term synchronised ... · synchronised population dynamics in...
TRANSCRIPT

ORIGINAL ARTICLE
Deterministic processes guide long-termsynchronised population dynamics in replicateanaerobic digesters
Inka Vanwonterghem1,2, Paul D Jensen1, Paul G Dennis1,2,3, Philip Hugenholtz2,Korneel Rabaey1,4 and Gene W Tyson1,2
1Advanced Water Management Centre (AWMC), University of Queensland, St Lucia, Queensland, Australia;2Australian Centre for Ecogenomics (ACE), School of Chemistry and Molecular Biosciences, University ofQueensland, St Lucia, Queensland, Australia; 3School of Agriculture and Food Sciences, University ofQueensland, St Lucia, Queensland, Australia and 4Laboratory for Microbial Ecology and Technology(LabMET), Ghent University, Ghent, Belgium
A replicate long-term experiment was conducted using anaerobic digestion (AD) as a model processto determine the relative role of niche and neutral theory on microbial community assembly, and tolink community dynamics to system performance. AD is performed by a complex network ofmicroorganisms and process stability relies entirely on the synergistic interactions betweenpopulations belonging to different functional guilds. In this study, three independent replicateanaerobic digesters were seeded with the same diverse inoculum, supplied with a model substrate,a-cellulose, and operated for 362 days at a 10-day hydraulic residence time under mesophilicconditions. Selective pressure imposed by the operational conditions and model substrate causedlarge reproducible changes in community composition including an overall decrease in richness inthe first month of operation, followed by synchronised population dynamics that correlated withchanges in reactor performance. This included the synchronised emergence and decline of distinctRuminococcus phylotypes at day 148, and emergence of a Clostridium and Methanosaeta phylotypeat day 178, when performance became stable in all reactors. These data suggest that many dynamicfunctional niches are predictably filled by phylogenetically coherent populations over long timescales. Neutral theory would predict that a complex community with a high degree of recognisedfunctional redundancy would lead to stochastic changes in populations and community divergenceover time. We conclude that deterministic processes may play a larger role in microbial communitydynamics than currently appreciated, and under controlled conditions it may be possible to reliablypredict community structural and functional changes over time.The ISME Journal advance online publication, 17 April 2014; doi:10.1038/ismej.2014.50Subject Category: Microbial population and community ecologyKeywords: anaerobic digestion; deterministic; neutral theory; niche specialisation; synchronised dynamics
Introduction
A number of ecological theories have been used toexplain observed patterns in microbial communityassembly and dynamics (Sloan et al., 2006; Falket al., 2009; Ofiteru et al., 2010; Wang et al., 2013).Historically, community composition is thought tobe governed by deterministic factors such as inter-species interactions (for example, competition,syntrophy and predation) and niche differentiation(Pholchan et al., 2013; Zhou et al., 2013). According
to this traditional niche-based theory, there is astrong relationship between taxon traits and theenvironment. More recently, an alternative theorythat disregards competition between populations,neutral theory, has emerged that only considersstochastic processes such as birth, death, coloni-sation, immigration, speciation and dispersallimitations (Sloan et al., 2006; Ofiteru et al., 2010;Harpole, 2012). Recent studies suggest that bothdeterministic and stochastic processes play a role instructuring microbial communities (Ofiteru et al.,2010; Caruso et al., 2011); however, because of thecomplexity of many natural ecosystems, and asso-ciated lack of controlled conditions and replicatedexperimental design, the mechanisms and factorsthat affect microbial diversity and communityassembly remain poorly understood (Zhou et al.,2013).
Correspondence: GW Tyson, Australian Centre for Ecogenomics(ACE), School of Chemistry and Molecular Biosciences,University of Queensland, St Lucia, Queensland 4072, Australia.E-mail: [email protected] 11 November 2013; revised 26 February 2014; accepted1 March 2014
The ISME Journal (2014), 1–14& 2014 International Society for Microbial Ecology All rights reserved 1751-7362/14
www.nature.com/ismej

Engineered systems offer a controlled environmentin which to study complex microbial communities,and together with modern culture-independenttechniques that provide an objective view ofcommunity composition, bioreactors are gainingpopularity as environments for testing ecologicaltheories (Falk et al., 2009; Zhou et al., 2013). Thereis also a growing appreciation of understandingmicrobial ecology to improve the efficiency androbustness of engineered systems (Briones andRaskin, 2003; Rittmann et al., 2006; Gentile et al.,2007; Pholchan et al., 2013).
Anaerobic digestion (AD) is a microbiallymediated technology for the degradation andstabilisation of organic matter, resulting in theproduction of energy-rich compounds such asalcohols, volatile fatty acids (VFAs) and methane.This process involves four sequential steps:hydrolysis, fermentation (acidogenesis), acetogenesis(dehydrogenation) and methanogenesis (acetoclasticor hydrogenotrophic), that depend on the synergisticinteractions of microorganisms, forming a complexmetabolic network. During hydrolysis and fermenta-tion, a diverse range of bacteria degrade complexpolymers (carbohydrates, lipids and proteins),yielding soluble organic molecules (sugars, fattyacids and amino acids) that are fermented intoshort-chain VFAs, alcohols, CO2, H2 and otherby-products. Some of these fermentation products(acetate, CO2 and H2) can directly be used assubstrates for methanogenesis, whereas others arefirst oxidised to CO2 and H2 by acetogenic bacteriathat typically form a syntrophic relationship withhydrogenotrophic methanogens (Schluter et al.,2008; Amani et al., 2010).
Culture-independent molecular techniques havebeen used to characterise AD-associated microbialcommunities under a range of process configura-tions, conditions, feedstocks and using differentinocula (Jaenicke et al., 2010; Werner et al., 2010;Nelson et al., 2011; Pervin et al., 2013). Thesestudies have provided substantial insight into themethanogenic populations (Lee et al., 2008b;Steinberg and Regan, 2011), but the interactionsbetween and within functional guilds and their linkto reactor performance remain poorly understood.Functional redundancy is thought to be at the coreof stable reactor performance, as it ensures thepresence of a reservoir of populations able toperform the same ecological function (Briones andRaskin, 2003; Rittmann et al., 2006; Allison andMartiny, 2008; Falk et al., 2009). However, fewstudies have examined the relationship betweencommunity dynamics and functional stability inreplicated lab-scale bioreactors, and the existingstudies provide conflicting results (Fernandez et al.,1999; LaPara et al., 2001; McGuinness et al., 2006;Gentile et al., 2007). This lack of consensus is likelybecause of a combination of variables, includingcommunity complexity, reactor design and opera-tion (Falk et al., 2009).
In this study, a replicate time series experimentwas performed using AD as a model process todetermine the relative role of deterministic andstochastic processes on microbial communityassembly and dynamics. The replicate reactorswere seeded with the same diverse inoculumand were supplied with a sterile model substrate(a-cellulose). The microbial community composi-tion was monitored over time and correlated withreactor performance parameters to developa better understanding of the relationship betweencommunity dynamics and functional stability. Wedemonstrate that population dynamics in thesecomplex communities are largely synchronisedover long periods, suggesting that deterministicrather than stochastic processes drive populationsuccession when environmental conditions arenormalised.
Materials and methods
InoculumThree replicate anaerobic digesters were set up inparallel and seeded with the same diverse inoculum(20% v/v) that consisted of a mixture of samples(equal volatile suspended solids ratios) taken fromeight different anaerobic locations: six well-function-ing engineered systems (three mesophilic ADs,thermophilic AD, Upflow Anaerobic Sludge Bioreac-tor and anaerobic lagoon), and two natural environ-ments (rumen and lake sediment) (SupplementaryFigure S1 and Supplementary Table S1).
Reactor set-up and operationThe replicate anaerobic digesters (2 l workingvolume) were run as semi-continuous completelymixed reactors with a hydraulic and sludge reten-tion time of 10 days. This is the minimum retentiontime needed to prevent washout of slow-growingmethanogens (Amani et al., 2010) and allows us tohighlight differences in hydrolysis rate by runningthe process at an active point on the first orderoperating curve (Jensen et al., 2009; based on acellulose hydrolysis rate of 0.2 per day; Jensen et al.,2011). The triplicate reactors were designated AD1,AD2 and AD3. The temperature was held at 37 1C(±1 1C) and a pH of 7 was maintained by adding 1 M
NaOH solution. A sterile model substrate was usedas a feedstock to reduce the substrate complexityand minimise influence of microorganismsotherwise entering the system through a nonsterilefeed. a-Cellulose (Sigma Aldrich, Castle Hill, NSW,Australia) was selected because it is the purest andmost polymerised form of cellulose. The sterilemedium consisted of 3 g l� 1 Na2HPO4, 1 g l� 1 NH4Cl,0.5 g l�1 NaCl, 0.2465 g l�1 MgSO4.7 H2O, 1.5 g l�1
KH2PO4, 14.7 mg l� 1 CaCl2, 2.6 g l�1 NaHCO3,0.5 g l�1 C3H7NO2S, 0.25 g l� 1 Na2S.9 H2O and 1 mlof trace solution containing 1.5 g l�1 FeSO4.7 H2O,0.15 g l�1 H3BO3, 0.03 g l�1 CuSO4.5 H2O, 0.18 g l�1
KI, 0.12 g l� 1 MnCl2.4 H2O, 0.06 g l� 1 Na2Mo4.2 H2O,
Deterministic factors shape bioreactor communitiesI Vanwonterghem et al
2
The ISME Journal

0.12 g l� 1 ZnSO4.7 H2O, 0.15 g l�1 CoCl2.6 H2O,10 g l� 1 EDTA and 23 mg l�1 NiCl2.6 H2O (Rabaeyet al., 2005). The medium was sparged with N2 andthen autoclaved at 121 1C for 60 min for oxygenremoval and sterilisation, respectively. The pH wasadjusted to B7.2 by addition of HCl (37 vol%).The reactors were fed semi-continuously witha-cellulose (5 g cellulose per l medium) four timesdaily at 6 hour intervals. During these feed events,B50 ml of feed was pumped in the systems andan equal amount of reactor sludge was wastedsimultaneously using multi-head peristaltic pumps(John Morris Scientific, Brisbane, QLD, Australia).This resulted in an organic loading rate of 0.5 ga-cellulose per l reactor volume per day. During thestart-up phase, feeding and wasting was switchedoff from day 12 to day 24 (until a sufficient decreasein VFA concentration was observed) in order tominimise washout of slow-growing microorganismsand to allow the biomass in the reactors to increase.After day 24, the reactors were again fed and wastedsemi-continuously.
Digester performance monitoringBiogas production was measured continuously fromeach digester using tipping bucket gas metres, andlogged daily. Gas composition (CH4, CO2, H2) wasdetermined by gas chromatography with thermalconductivity detector (GC-TCD) (Gopalan et al.,2013). Slurry samples were collected from eachreactor twice per week and analysed for totalchemical oxygen demand (COD), soluble COD(sCOD) and VFA concentration. Sample preparationand analyses were performed as described pre-viously (Ge et al., 2011) and according to standardmethods (APHA, 2005). The extent of cellulosesolubilisation was calculated using the total CODconcentration in the feed and the particulate COD(pCOD) concentration in the reactor as a proxy forthe residual cellulose concentration.
Sample fixation and fluorescence in situ hybridisationSamples for fluorescence in situ hybridisation(FISH) were collected on a weekly basis.These samples were immediately fixed in 4%
paraformaldehyde for 4 h and washed twice with1% phosphate-buffered saline solution beforebeing stored at � 20 1C in a 50:50 mixture of 1%phosphate-buffered saline and 100% ethanol(Amann et al., 1995). Cells were hybridised withuniversal bacterial and archaeal probes (Amannet al., 1995) in combination with population-specific probes targeting Bacteroidales, Clostridialesand Fibrobacterales populations (Table 1). FISHpreparations were visualised using a Zeiss LSM512confocal laser scanning microscope (Zeiss, Oberko-chen, Germany). Brightness, contrast and registra-tion were modified using Adobe Photoshop 6.0(Sydney, NSW, Australia).
DNA extraction and 16S rRNA gene ampliconsequencingSamples for DNA extraction were taken twice perweek, snap-frozen in liquid nitrogen and stored at� 80 1C. DNA extractions were performed usingFastDNA Spin kits for Soil (MP BiomedicalsAustralasia, Seven Hills, NSW, Australia) accordingto the manufacturer’s instructions. DNA quality wasassessed using gel electrophoresis (1% agarose) andDNA concentrations were measured using Quant-iTdsDNA BR Assay kits and a Qubit fluorometer (LifeTechnologies, Mulgrave, VIC, Australia).
Genomic DNA was extracted from samples takenfrom each reactor at 14 time points (days 27, 70, 88,95, 113, 130, 148, 178, 209, 243, 276, 305, 325 and362) and 16S rRNA genes were amplified asdescribed previously (Cayford et al., 2012; Denniset al., 2013). Briefly, PCR reactions (50 ml) wereprepared with 20 ng of template DNA, 5ml 10�buffer, 1 ml dNTP mix (10 mM each), 4 ml 25 mM MgCl,1ml forward primer (10 mM), 1ml reverse primer(10 mM), 0.2 ml Taq polymerase and 1.5 ml BSA(Life Technologies) and 1 ml (10 mM) of each of theuniversal primers targeting the V6-V8 region ofthe bacterial and archaeal 16S rRNA gene(Engelbrektson et al., 2010): 926F (50-AAACTYAAAKGAATTGRCGG-30) and 1392R (50-ACGGGCGGTGTGTRC-30) modified on the 50 end to contain454 sequencing adaptor sequences. The reverseprimer also contained a 5–6 base sample-specific
Table 1 Oligonucleotide probes used in fluorescence in situ hybridisation (FISH), their sequences, formamide percentage (FA) andspecificity
Probe Sequence (50–30) FA Specificity Reference
ARC951 FITC GTGCTCCCCCGCCAATTCCT 20 Archaea Stahl and Amann, 1991EUB338 Cy5 GCTGCCTCCCGTAGGAGT 20 BacteriaEUB338þ Cy5 GCWGCCACCCGTAGGTGT 20 Daims et al., 1999Bac1080 Cy3 GCACTTAAGCCGACACCT 20 Bacteroidales Kong et al., 2012CF319a Cy3 TGGTCCGTGTCTCAGTAC 20Clo549 Cy3 CAATCATTCCGGACAACG 30 Clostridiales Kong et al., 2012Ace731 Cy3 TACTGTCCAGATAGCCGC 30Rum831 Cy3 GGTCAGTCCCCCCACA 30Fibr225 FITC AATCGGACGCAAGCTCATCCC 20 Fibrobacterales Kong et al., 2012
Deterministic factors shape bioreactor communitiesI Vanwonterghem et al
3
The ISME Journal

barcode sequence. The PCR program included onecycle at 95 1C for 3 min, followed by 30 cycles at95 1C for 30 s, 55 1C for 30 s and 75 1C for 30 s, andthen a final extension at 74 1C for 10 min. Postamplification, amplicons were pooled andsequenced using the Roche 454 GS-FLX Titaniumplatform (Roche Diagnostics, Castle Hill, NSW,Australia) at the Australian Centre for Ecogenomics.Sequences were submitted to the National Centrefor Biotechnology Information (NCBI) Short ReadArchive with the following accession numbers:SRR1175890, SRR1175892, SRR1175894 andSRR1175897.
Amplicon sequences were quality filtered,trimmed to 250 base pairs and dereplicated usingthe QIIME pipeline (Caporaso et al., 2010). Chimericsequences were removed using UCHIME (Edgaret al., 2011) and Acacia (Bragg et al., 2012) wasused to correct for homopolymer errors. Sequenceswere clustered at 97% identity using CD-Hit OTU(Wu et al., 2011) and cluster representatives wereselected. Sequences were also clustered at 100%identity with uclust (Edgar, 2010) to compare thecommunity profiles at a higher phylogenetic resolu-tion. BLASTn (Altschul et al., 1990) was used toassign a GreenGenes taxonomy (DeSantis et al.,2006) to each cluster representative. The 97%operational taxonomic unit (OTU) data set wasnormalised to 1100 sequences per sample and the100% OTU data set was normalised to 2400sequences to allow comparison of diversity withoutbias from unequal sampling effort. The librarieswere repeatedly subsampled and the number ofOTUs observed at equal number of sequencesbetween samples (richness) and Simpson’s diversityindices (evenness) were calculated. A table withthe OTUs corresponding to distinct populationsand their taxonomic assignments (to the lowestpossible level of classification) in each sample wasgenerated.
Real-time quantitative PCRTotal bacterial and archaeal biomass was estimatedusing real-time PCR for the three reactors at the same14 time points subjected to 16S rRNA gene ampliconsequencing. The primers 1406F (50-GYACWCACCGCCCGT-30) and 1525R (50-AAGGAGGTGWTCCARCC-30) were used to amplify bacterial andarchaeal 16S rRNA genes. For inhibition control,the rpsL F (50-GTAAAGTATGCCGTGTTCGT-30) andrpsL R (50-AGCCTGCTTACGGTCTTTA-30) primerset was used that is specific for Escherichia coliDH10B rRNA. Two dilutions (1/100, 1/1000) weremade of the microbial template DNA and run inparallel with an inhibition control test usingEscherichia coli DH10B genomic DNA. The PCRreaction was set up using 5 ml 2� SYBRGreen/AmpliTaq Gold DNA Polymerase mix (LifeTechnologies), 4ml template DNA and 1 mM primermix (0.4 mM 1406F/1525R, 0.2 mM rpsL F/R) and each
sample was run in triplicate. The PCR programincluded one cycle at 95 1C for 10 min, followed by40 cycles of 95 1C for 15 s and 60 1C for 1 min. A meltcurve was produced by running one cycle at 95 1Cfor 2 min and a final cycle at 60 1C for 15 s. The cyclethreshold (Ct) values were recorded and analysedusing ABI SDS 2.4.1 software.
Statistical analysesAll statistical analyses were performed in R Studio(version 2.15.0) using the R CRAN packages: vegan(Oksanen et al., 2012), RColowBrewer (Neuwirth,2011) and shapes (Dryden, 2013). A heatmapshowing relative abundances was generated basedon the OTU table. Hellinger-transformed OTUabundances (Legendre and Gallagher, 2001), rich-ness, evenness and performance parameters werecompared between reactors over time usingTukey’s Honestly Significant Differences tests.Differences in community composition were furtherexplored and visualised using complete linkagehierarchal clustering and principle componentanalysis (PCA). Procrustes plots and metrics werecalculated to compare the PCA results for eachreplicate. Correlations between microbial commu-nity composition and performance parameters werecalculated using environmental parameter fitting.
Results
Anaerobic digester performanceThree replicate anaerobic digesters were seededwith the same inoculum mixture and operated for362 days with a-cellulose as the sole carbon andenergy source. Based on the pCOD, sCOD and VFAprofiles, three performance phases could be identi-fied: phase 1—start-up (days 0–81), phase 2—stablehydrolysis (days 82–160) and phase 3—steady-statedigestion performance (days 161–362) (Figure 1).
After an initial variable start-up phase (phase 1),the residual pCOD profiles stabilised in the threereactors (Figure 1a and Table 2), indicating stablehydrolysis (phase 2). During this phase, the cellu-lose degradation efficiency was 78±5% and did notdiffer between reactors (P40.984). Phase 2 wascharacterised by variable sCOD and VFA profiles(Figures 1c and d) which indicated instabilityin fermentation, acetogenesis and/or methanogen-esis. Also, the sCOD concentrations, VFA profilesand methane production rate of AD1 differedsignificantly (Po0.02, Po0.005 and Po0.001,respectively) from those of AD2 and AD3 (Figures1b and f and Table 2). VFA concentrations decrea-sed with time and ranged between 290and 1390 mg CODVFA per l for AD1, between 25 and760 mg CODVFA per l for AD2 and between 40 and710 mg CODVFA per l for AD3. Total VFA concentra-tions were tightly linked to the sCOD concentration,indicating that the majority of soluble products
Deterministic factors shape bioreactor communitiesI Vanwonterghem et al
4
The ISME Journal

(on average 50–75%) were fermented to VFAs. Themain VFA constituents were acetate and propionate,contributing B92% (0.8:1 acetate to propionaterespectively) of the total VFAs for AD1,B90% (1.8:1) for AD2 and B91% (1.8:1) for AD3(Figures 1e and f).
During phase 3, the three reactors converged on aperformance level with no significant differencesin pCOD (P¼ 1.00), sCOD (P40.92) and VFA
concentrations (P¼ 1.00), or methane productionrates (P40.75). The cellulose degradation efficiencywas 78±8% during phase 3. Residual VFA concen-trations further decreased during phase 3 andranged between 8 and 240 mg CODVFA per l for AD1,between 5 and 90 mg CODVFA per l for AD2 andbetween 2 and 80 mg CODVFA per l for AD3(Figure 1d). The methane production rate in AD1increased significantly compared to phase 2
Table 2 Operational performance parameters
Reactor Cellulose degradation pCOD sCOD VFA CH4 production rate(%) (mg COD per l) (mg COD per l) (mg CODVFA per l) (mg CODCH4 per l per day)
Phase 2 Phase 3 Phase 2 Phase 3 Phase 2 Phase 3 Phase 2 Phase 3 Phase 2 Phase 3
AD1 77±5 76±7 1200±240 1300±310 990±370 410±90 750±340 70±70 250±48 450±132AD2 80±4 81±10 1100±190 1000±510 550±260 390±120 290±220 40±20 360±83 420±137AD3 76±7 78±8 1300±350 1200±400 520±230 310±80 320±160 30±20 410±68 380±124
Abbreviations: AD, anaerobic digestion; pCOD, particulate chemical oxygen demand; sCOD, soluble chemical oxygen demand; VFA, volatilefatty acids.The average values of all performance parameters are given for AD1, AD2 and AD3 during stable hydrolysis and steady-state performance (averagevalues and s.d. for phases 2 and 3): cellulose degradation, pCOD, sCOD and VFA concentrations and methane production rate.
Figure 1 Reactor performance parameters over time for reactors AD1 (J grey), AD2 (& light grey) and AD3 (B black). Three distinctphases can be identified (phase 1—start-up, phase 2—stable hydrolysis and phase 3—steady state) showing differences in pCODconcentration (a), methane production rate (b), sCOD concentration (c), total VFA concentration (d), acetate concentration (e) andpropionate concentration (f). Methane production was measured daily and average methane production rates were calculated on aweekly basis (error bars represent s.d.).
Deterministic factors shape bioreactor communitiesI Vanwonterghem et al
5
The ISME Journal
(Po0.001) and is consistent with improved conver-sion of VFA to methane in this reactor. Methaneproduction also increased for AD2 and decreased forAD3 (Table 2), but this change was not significant(P40.65). During all phases, the CH4 content of thebiogas was 63% (±5%) on a volume basis and no H2
was detected.
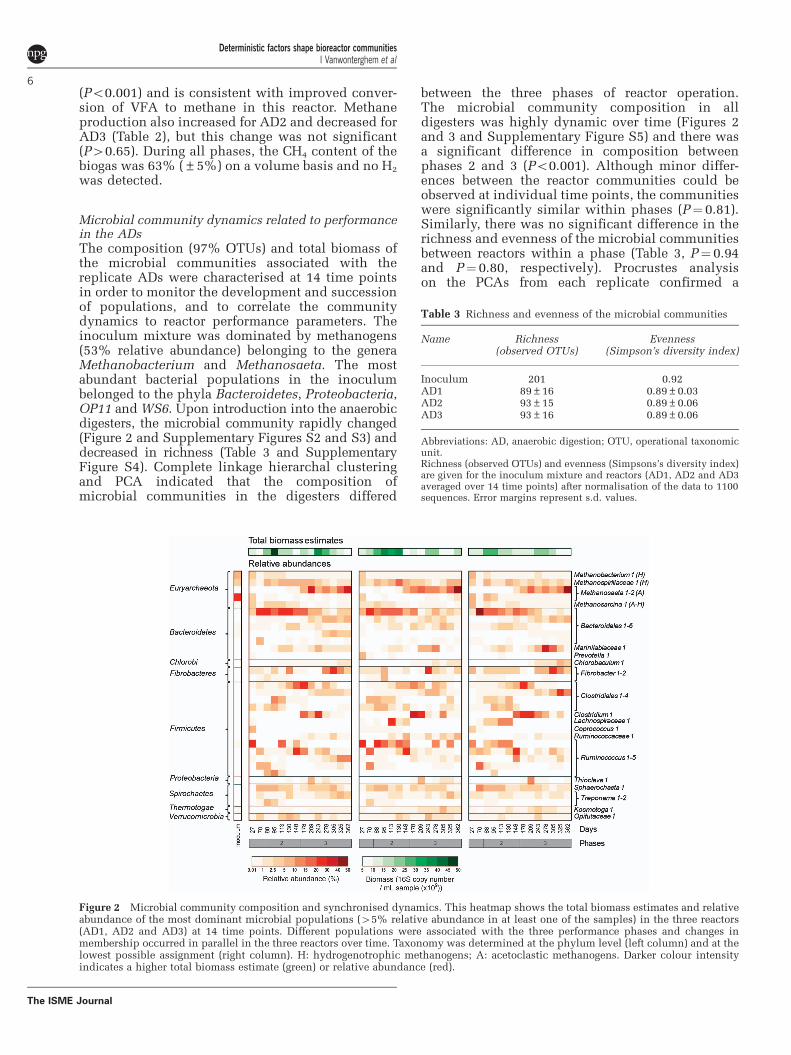
Microbial community dynamics related to performancein the ADsThe composition (97% OTUs) and total biomass ofthe microbial communities associated with thereplicate ADs were characterised at 14 time pointsin order to monitor the development and successionof populations, and to correlate the communitydynamics to reactor performance parameters. Theinoculum mixture was dominated by methanogens(53% relative abundance) belonging to the generaMethanobacterium and Methanosaeta. The mostabundant bacterial populations in the inoculumbelonged to the phyla Bacteroidetes, Proteobacteria,OP11 and WS6. Upon introduction into the anaerobicdigesters, the microbial community rapidly changed(Figure 2 and Supplementary Figures S2 and S3) anddecreased in richness (Table 3 and SupplementaryFigure S4). Complete linkage hierarchal clusteringand PCA indicated that the composition ofmicrobial communities in the digesters differed
between the three phases of reactor operation.The microbial community composition in alldigesters was highly dynamic over time (Figures 2and 3 and Supplementary Figure S5) and there wasa significant difference in composition betweenphases 2 and 3 (Po0.001). Although minor differ-ences between the reactor communities could beobserved at individual time points, the communitieswere significantly similar within phases (P¼ 0.81).Similarly, there was no significant difference in therichness and evenness of the microbial communitiesbetween reactors within a phase (Table 3, P¼ 0.94and P¼ 0.80, respectively). Procrustes analysison the PCAs from each replicate confirmed a
Figure 2 Microbial community composition and synchronised dynamics. This heatmap shows the total biomass estimates and relativeabundance of the most dominant microbial populations (45% relative abundance in at least one of the samples) in the three reactors(AD1, AD2 and AD3) at 14 time points. Different populations were associated with the three performance phases and changes inmembership occurred in parallel in the three reactors over time. Taxonomy was determined at the phylum level (left column) and at thelowest possible assignment (right column). H: hydrogenotrophic methanogens; A: acetoclastic methanogens. Darker colour intensityindicates a higher total biomass estimate (green) or relative abundance (red).
Table 3 Richness and evenness of the microbial communities
Name Richness(observed OTUs)
Evenness(Simpson’s diversity index)
Inoculum 201 0.92AD1 89±16 0.89±0.03AD2 93±15 0.89±0.06AD3 93±16 0.89±0.06
Abbreviations: AD, anaerobic digestion; OTU, operational taxonomicunit.Richness (observed OTUs) and evenness (Simpsons’s diversity index)are given for the inoculum mixture and reactors (AD1, AD2 and AD3averaged over 14 time points) after normalisation of the data to 1100sequences. Error margins represent s.d. values.
Deterministic factors shape bioreactor communitiesI Vanwonterghem et al
6
The ISME Journal

high correlation (40.8, P¼ 0.001) between thecommunity compositions (Supplementary FigureS6 and Supplementary Table S2). Minor differencesin community composition between reactors arelikely explained by operational variability and therelatively long time between sampling events(B3 residence times). The estimated biomass inthe reactors fluctuated over time between 6.0� 109
and 4.9� 1010 cells per ml of reactor sample, andtrends in biomass concentration tracked one anotherin the three reactors (Figure 2).
The most abundant populations in all reactors(average relative abundance 44%) belonged tothe bacterial orders Bacteroidales, Clostridiales,Fibrobacterales and Sphaerochaetales, and the archaealorders Methanomicrobiales and Methanosarcinales.Despite being independent systems, the relative
abundance profiles of these populations weresimilar in the three reactors and tracked one anotherover time (Figures 2 and 3b and SupplementaryFigure 5S). These synchronised dynamics were alsoobserved when the community was analysed withincreased resolution (100% OTUs) (SupplementaryFigure S7). Synchronised shifts in populationrelative abundance were especially prominent atthe transition between phases 2 and 3 (days148–178), when reactor performance reached steadystate. Different members of the order Clostridialeswere present at high relative abundance (35±14%)in the three digesters at all time points andcorrelated with higher sCOD and VFA concentra-tions, and methane production rates (Figure 3a andSupplementary Figure S8). During phase 2, themicrobial communities dominated by Bacteroidales,
Figure 3 Microbial community dynamics linked to reactor performance. The PCA shows the microbial community composition at theOTU level (Hellinger transformed) for the three reactors (AD1, AD2 and AD3) at 14 time points. (a) Each sample is symbolised by a singlecircle coloured by reactor. The size of the circle increases with time. Individual OTUs are represented as black crosses and the taxonomyof those contributing most to the variability between community profiles is provided. Environmental parameter fitting was performed tocorrelate reactor performance parameters to the community composition and significant correlations are presented by the arrows.(b) Tracking of the microbial community composition in the three reactors over time, starting from day 88. Each line represents thetrajectory in the PCA plot (based on community structure) of each reactor over time.
Deterministic factors shape bioreactor communitiesI Vanwonterghem et al
7
The ISME Journal

Ruminococcus (a member of the order Clostridiales)and Sphaerochaetales populations were significantlycorrelated with higher sCOD and VFA concentrations(P¼ 0.001; Figure 3a and Supplementary Figure S8a).The relative abundance of these populationsdecreased between day 88 (phase 2) and day 362(phase 3) from 25±4.9% to 13±6.4% for Bacteroidales,19±9.5% to 8±6.4% for Ruminococcus and9±3.0% to 1±0.9% for Sphaerochaetales. Therelative abundance of a Fibrobacter populationpeaked between days 243 and 276 in all reactors,and was inversely correlated to higher pCODconcentrations. The relative abundance of methano-gens increased over time from 14±6.2% at day88 (phase 2) to 53±11.0% at day 362 (phase 3).This coincided with a shift in dominance froma Methanomicrobiales to a Methanosarcinalespopulation around day 178, and was significantlycorrelated to higher methane production rates(Figures 2 and 3a; P¼ 0.026). Populations belongingto the orders Desulfobacterales, Desulfovibrionalesand Syntrophobacterales were typically found inlow abundance (0–1.1%), but their relative abun-dance increased between phases 2 and 3.
Spatial distribution of bacterial and archaealcommunity membersFISH probes broadly targeting bacteria and archaeawere used in combination with specific probes todetermine the morphology and spatial distributionof phylogenetic groups identified in the commu-nities through 16S rRNA gene amplicon sequencing(Table 1 and Figure 4). The Bacteroidales-specificprobes (Bac1080 and CF319a) revealed two morpho-types, straight rods (length 2–4mm) and filaments(length up to 10 mm), that were more abundant in theplanktonic phase, but were occasionally foundattached to a-cellulose particles. Clostridiales-(Clo549 and Ace731), Ruminococcus- (Rum831)and Fibrobacter-specific probes (Fibr225) revealedlarge rods (3–5mm), chain-forming cocci (diametero1 mm) and short rods (1–2 mm), respectively, thatwere predominantly attached to cellulose particles(Figure 4). In most cases, a-cellulose particles
appeared to be colonised by multiple populations.Archaeal cells (ARC951) were mainly seen in theplanktonic phase and did not appear to be asso-ciated with cellulose. Three archaeal morphotypescould be distinguished, including cocci (single cellswith a diameter of 1–2 mm), clusters of cocci(diameter 3–7 mm) and rods (3–10 mm). Rod-shapedarchaeal cells also formed large filaments (15–100mm)or were arranged as a chain within a common sheath(up to B100mm; Figure 4).
Discussion
Community composition and dynamics linked toreactor performanceIn this study, triplicate anaerobic digesters were runfor 362 days under identical operating conditionswith the same complex inoculum and modelcellulosic feedstock. A diverse community waspresent in each reactor with multiple populationscapable of hydrolysing cellulose, fermenting solubleintermediates and producing methane (Figure 5). Bymonitoring the microbial community dynamics andperformance parameters in replicate digesters,strong correlations between composition andfunction were observed.
The reactor communities rapidly shifted awayfrom the inoculum community profile and con-verged to a highly similar composition under theselective pressures imposed by the operating condi-tions (Figure 2 and Supplementary Figure S2). Thehydraulic residence time was shorter than that of thesource environments of the inocula that initiallycaused partial washout of slow-growing microorgan-isms including methanogens and resulted in reactorcommunities dominated by bacteria. The dominantbacterial phylotypes were present at very lowabundance or were below detection in the inocu-lum, suggesting that the shorter hydraulic residencetime, mesophilic temperature and simple cellulosicsubstrate created specific niches different to thenative inoculum environments. As anticipated,these selective pressures not only influenced thecommunity composition but also led to a decrease inphylotype richness (Table 3).
Figure 4 Morphology and spatial distribution of dominant populations. FISH micrographs are shown of the microbial community fromAD3 on (a) day 88, (b) day 178 and (c) day 362. Universal probes targeting archaea (ARC951, green) and bacteria (EUB338 and EUB338þ ,blue) were used in combination with population-specific probes targeting Bacteroidales (Bac1080 and CF319a, red), Clostridiales (Clo549and Ace731, magenta) and Fibrobacterales (Fibr225, cyan). The arrows point to possibly hydrolytic populations attached to celluloseparticles (a, b), and clustering of archaeal rod-shaped cells into a sheathed filament (c).
Deterministic factors shape bioreactor communitiesI Vanwonterghem et al
8
The ISME Journal

The microbial communities in this experimentwere dominated by bacterial populations belongingto the orders Bacteroidales, Clostridiales, Fibrobacteralesand Sphaerochaetales (Figure 2). The most abun-dant archaeal populations belonged to the ordersMethanomicrobiales and Methanosarcinales that areoften found separately or together as the dominantmethanogens in anaerobic digesters (Ariesyadaet al., 2007; Jaenicke et al., 2010; Nelson et al.,2011). Recently, characterisation of the microbialcommunity composition of 21 full-scale ADshighlighted dominant populations belonging to thephyla Firmicutes, Bacteroidetes, Actinobacteria,Proteobacteria, Chloroflexi and Spirochaetes(Sundberg et al., 2013). Similarly, a meta-analysisof all publicly available 16S rRNA gene sequencesfrom AD-associated microbial communities sup-plied a variety of feedstocks showed that manydominant populations belong to the phyla Chloro-flexi and Proteobacteria (Nelson et al., 2011).Several representatives of these phyla were detectedin the inoculum (45%), but they were only presentat low relative abundance in the reactors (o1%).
This is likely related to the use of a-cellulose asmodel feedstock in this study that reduces thenumber of metabolic niches that can be occupiedby hydrolytic and fermentative microorganisms.Consistent with this finding, it has previously beenobserved that the type of substrate strongly influ-ences the composition of AD microbial communities(Merlino et al., 2012; Regueiro et al., 2012; Sundberget al., 2013; Ziganshin et al., 2013).
HydrolysisPopulations belonging to the order Bacteroidalesand the genus Ruminococcus were likely the initialmain cellulose degraders, and contributed to stablehydrolysis during phase 2. As the relative abun-dance of these populations decreased, members ofthe genus Clostridium increased in all reactors,followed by a shift in dominance to a populationbelonging to the genus Fibrobacter. Members of eachof these orders/genera have previously been impli-cated in cellulose hydrolysis (Bayer et al., 2004;Jacob-Lopes et al., 2009; Magnuson et al., 2009;
Figure 5 Schematic of the proposed populations involved in the different steps of anaerobic digestion. The circle size represents theaverage relative abundance of the populations during phase 2 (blue) and phase 3 (green). During steady-state performance, the functionalguilds are more evenly distributed. The dotted circles represent populations belonging to the genus Clostridium and the ordersDesulfovibrionales, Desulfuromonadales and Synergistales that may be capable of syntrophic metabolism (McDonald et al., 2008). Thearrows indicate the flow of carbon through the system.
Deterministic factors shape bioreactor communitiesI Vanwonterghem et al
9
The ISME Journal

Nelson et al., 2011; Sundberg et al., 2013). FISHconfirmed that these populations were attached toor in close proximity to cellulose particles(Figure 4), strengthening the likelihood that thesemicroorganisms were major cellulose hydrolysers.As some of these populations were also present inthe planktonic phase, it is hypothesised thatdifferent mechanisms of cellulose degradation maybe used, that is, via extracellular enzymes or by acell-attached cellulosome complex which haspreviously been observed for Clostridiumcellulovorans (Matano et al., 1994). SeveralBacteroidales and Ruminococcus populations weresignificantly correlated to higher VFA concentra-tions (Figure 3a), consistent with their potential rolein cellulose hydrolysis yielding soluble substratesfor VFA production.
FermentationMembers of the orders Bacteroidales, Clostridialesand Sphaerochaetales are known as saccharolyticchemoorganotrophic heterotrophs (Magnuson et al.,2009; Jaenicke et al., 2010; Sundberg et al., 2013).Our results suggest that these populations are thedominant fermenters in the digesters, supported bya significant correlation with higher VFA concentra-tions and high relative abundance of these popula-tions in the planktonic phase. Clostridialespopulations were also significantly correlated withhigher methane production (Figure 3). Althoughmembers of this order are not capable of producingmethane, they do have diverse metabolic capabil-ities that yield substrates for methanogenesis,including cellulose degradation, polysaccharidefermentation to VFAs, alcohols and hydrogen,homoacetogenesis and syntrophic acetate oxidation(Stieb and Schink, 1985; Schnurer et al., 1996; Leeet al., 2008a; Sundberg et al., 2013). Our resultssuggest a possible syntrophic interaction betweenspecific Clostridiales and methanogenic populationsas they both increased in relative abundance duringsteady-state performance, although additional func-tional data are required to further support thishypothesis. During phase 3, VFA concentrationsdecreased (Figure 1) as the relative abundance ofpopulations capable of utilising VFAs increased,such as potentially syntrophic acetogens belongingto the order Syntrophobacterales that are known tooxidise acetate and propionate to H2 and CO2
(Muller et al., 2010; Muller et al., 2013).
MethanogenesisIn contrast to hydrolytic and fermentative popula-tions that have relatively high growth rates (Griffinet al., 1997), methanogens tend to respond poorly toa change in operational conditions and shorthydraulic residence time. Stress and partial washoutof methanogenic populations led to an imbalancebetween functional guilds during start-up, resulting
in increased VFA concentrations and a correspondingdrop in pH (B6). The latter may have furtherinhibited methanogenesis as optimal pH for methaneproduction varies between pH 7 and 8 (Weiland,2010). Methanogenesis remained the rate-limitingstep during phase 2, as indicated by high residualVFA concentrations (Figure 1). During this phase,the most abundant methanogenic populationbelonged to the hydrogenotrophic family Methanos-pirillaceae. Members of the genus Methanosarcinawere the second most dominant methanogen, likelyexplained by their low acetate substrate affinityand preference for high acetate concentrations(460 mg l�1; Liu and Whitman, 2008) comparableto the reactors in phase 2 (average 4200 mg l� 1;(Figures 1e and 2). FISH confirmed the presence ofthis population as the characteristic tetrad clusters.During phase 3, the methanogens increased inrelative abundance and this was correlated withhigher methane production and lower VFA concen-trations (Figures 1 and 2). Members of the genusMethanosaeta thrive at low acetate concentrations(as low as 0.3–1.2 mg l� 1; Liu and Whitman, 2008)because of their high acetate substrate affinity,potentially explaining why they became the mostdominant methanogenic population when acetateconcentrations were low during phase 3 (averageo40 mg l� 1; Figures 1e and 2). Methanosaeta cellshave previously been observed together in a com-mon sheath (Kamagata and Mikami, 1991, Ma et al.,2006) and FISH confirmed clustering of thesefilaments in the reactors during steady state. Thechange in dominant methanogen likely corre-sponded to a shift in primary methanogenic path-way in the reactors from hydrogenotrophic toacetoclastic methanogenesis. The increase in abun-dance of Methanosaeta correlated with changes inthe bacterial community composition and transitionto steady-state performance; however, the causalityof this relationship is not yet fully understood.Interestingly, the decrease in the relative abundanceof populations known to be capable of hydro-genotrophic methanogenesis coincided with anincreased abundance of potentially syntrophicacetogens. As H2 was not detected, other H2-scavenging microorganisms may have functionedas sinks within the reactors. Consistent with thisfinding, the relative abundance of sulphate-reducingbacteria, belonging to the orders Desulfobacteralesand Desulfovibrionales, increased during phase 3.These bacteria can use the available acetate and H2
(Griffin et al., 1997); however, the low levels ofsulphate present in the medium may have restrictedtheir abundance and ability to out-compete themethanogens (Dar et al., 2008).
The increase in functional stability during phase 3was correlated with a major shift in communitycomposition on all functional levels and an increasedabundance of possible syntrophic acetogens andmethanogens (Figure 5), suggesting strong microbialinteractions. Despite this functional stability, the
Deterministic factors shape bioreactor communitiesI Vanwonterghem et al
10
The ISME Journal

communities did not increase in similarity over time(Supplementary Figure S9) and remained dynamic(Figure 2 and Supplementary Figure S10). It has beenhypothesised that processes and interactions thatpromote functional stability result from greater func-tional redundancy and niche complementation byensuring a reservoir of species using parallel pathwaysfor substrate conversion (Briones and Raskin, 2003).Based on the composition of the community in thereactors over time, it is clear that many phylogeneti-cally diverse populations are capable of fulfilling thesame functional guild within these systems (Figure 5).
Deterministic processes drive microbial communitystructure in replicate anaerobic digestersA major goal of this study was to test the relativeinfluence of deterministic and stochastic processeson community assembly and dynamics over thecourse of a year using a highly controlled replicatedmodel system. A complex inoculum of eight naturaland engineered anoxic environments was used toprovide a biologically diverse starting point fromwhich to monitor convergence or divergence ofcommunities between reactors over time.
The composition and diversity of the microbialcommunities were statistically similar within thethree distinct performance phases. The commu-nities were dynamic and changes in relative abun-dance of many phylotypes were synchronisedbetween reactors over long time scales (Figures 2and 3). Although the microbial communities in thereplicates showed minor differences at individualtime points, the communities followed equivalenttrajectories in terms of performance and composi-tion (Figure 3b). Given that the reactors were closedsystems run under identical conditions, the largelysynchronised phylotype dynamics indicate thatreproducible changes in synergistic and competitiveinteractions within the community are occurringunder the controlled conditions. Neutral theory, as anull hypothesis, predicts random drift of popula-tions under identical conditions because it assumesthat all individuals are ecologically identical(Harpole, 2012). In this study, we endeavoured toreplicate the bioreactor operating conditions asclosely as possible to identify bona fide randomdrift. Our results suggest that multiple populationscapable of fulfilling the same functional niche donot randomly become dominant in the system;instead, their abundance appears to be highlycontrolled by deterministic processes such asmicrobial interactions, substrate availability andoperational conditions. For example, many hydro-genotrophic methanogens were present in theinoculum that could have independently come todominance in the parallel reactors over the course ofthe experiment. Instead, population synchronisa-tion was observed among this functionally redun-dant guild (Figure 2 and Supplementary Figure S5).Our results reject the neutral theory null hypothesis
and suggest that niche differences between popula-tions have a critical influence on communityassembly and dynamics.
Previous studies have observed reproducibletemporal community dynamics in replicate denitri-fying reactors (McGuinness et al., 2006), ammonia-oxidising membrane bioreactors (Falk et al., 2009)and activated sludge bioreactors (Valentin-Vargaset al., 2012), suggesting that these systems are notdriven by stochastic processes, but are highlyreproducible and predictable. In contrast, Zhouet al. (2013) concluded that stochastic assembly ofcommunities dominated in replicate microbialelectrolysis cell reactors, invoking neutral theoryas the underlying model. The authors suggest thatinitial stochastic colonisation of the anodes wascritical to random community drift and allowedconsiderable site-to-site variation in communitycomposition. It was likely that deterministic pro-cesses influenced subsequent dynamics as there wasa strong link between community structure andfunction (Zhou et al., 2013). The populationdynamics in waste water treatment plants have alsobeen studied and were consistent with neutraltheory which the authors attributed to the opendesign and continuous influx of microorganismsand protozoa (Ofiteru et al., 2010). Our resultssuggest that microbial community assembly anddynamics in highly controlled anaerobic digesters isprimarily driven by deterministic rather thanstochastic processes. This observation also indicatesthe importance of high-resolution monitoring ofmicrobial communities over long time periods todetermine the relative influence of niche andneutral theory on population dynamics.
Conclusion
In this study, we identified multiple phylogeneti-cally diverse populations associated with each ofthe main steps in AD (hydrolysis, fermentation andmethanogenesis) that appear to have at least somefunctional redundancy. However, communitydynamics were strongly linked with reactor perfor-mance and numerous populations were synchro-nised over long time periods, suggesting nichespecialisation. This rejects the null hypothesis ofneutral theory and highlights the importance ofdeterministic factors such as operational conditions,substrate availability and interspecies interactions.It should be noted that 16S amplicon sequencingonly allows community member resolution down toapproximately genus (97% OTU)/species (100%OTU) level, and it is possible therefore thatundetected stochastic changes occur at the strainlevel. Recovery of population genomes from meta-genomic data (Tyson et al., 2004; Albertsen et al.,2013) will provide the resolution needed to confirmthe major role for deterministic processes withinthese highly controlled, closed replicated systems.
Deterministic factors shape bioreactor communitiesI Vanwonterghem et al
11
The ISME Journal

Conflict of Interest
The authors declare no conflict of interest.
Acknowledgements
This study was supported by the Commonwealth Scien-tific & Industrial Research Organisation (CSIRO) FlagshipCluster ‘Biotechnological solutions to Australia’s trans-port, energy and greenhouse gas challenges’. IV acknowl-edges support by the University of QueenslandInternational Scholarship, and GWT is supported by anARC Queen Elizabeth II fellowship (DP1093175). KRacknowledges support by the European Research Council(Starter Grant Electrotalk). We thank Fiona May at theAustralian Centre for Ecogenomics for the 16S rRNA geneamplicon pyrosequencing, Adam Skarshewski for hisassistance with the pyrotag data analysis and NancyLachner and Serene Low for their help with the RT-PCR.Beatrice Keller and Nathan Clayton from the ASL analysislab are acknowledged for the VFA analyses. We alsoacknowledge Dr Michael Imelfort for his contribution tothe project.
References
Albertsen M, Hugenholtz P, Skarshewski A, Nielsen KA,Tyson GW, Nielsen PH. (2013). Genome sequences ofrare, uncultured bacteria obtained by differentialcoverage binning of multiple metagenomes. NatBiotechnol 31: 533–538.
Allison SD, Martiny JBH. (2008). Resistance, resilience,and redundancy in microbial communities. Proc NatlAcad Sci USA 105: 11512–11519.
Altschul SF, Gish W, Miller W, Myers EW, Lipma DJ.(1990). Basic local alignment search tool. J Mol Biol215: 403–410.
Amani T, Nosrati M, Sreekrishnan TR. (2010). Anaerobicdigestion from the viewpoint of microbiological,chemical and operational aspects - a review. EnvironRev 18: 255–278.
Amann RI, Ludwig W, Schleifer KH. (1995). Phylogeneticidentification and in situ detection of individualmicrobial cells without cultivation. Microbiol Rev 59:143–169.
APHA (2005). Standard Methods for the Examination ofWater and Wastewater, 21st edn. American PublicHealth Association: Washington DC.
Ariesyada HD, Ito T, Okabe S. (2007). Functional bacterialand archaeal community structures of major trophicgroups in a full-scale anaerobic sludge digester. WaterRes 41: 1554–1568S.
Bayer EA, Belaich J-P, Shoham Y, Lamed R. (2004).The cellulosome: multienzyme machines for degrada-tion of plant cell wall polysaccharides. Annu RevMicrobiol 58: 521–554.
Bragg L, Stone G, Imelfort M, Hugenholtz P, Tyson G.(2012). Fast, accurate error-correction of ampliconpyrosequences using Acacia. Nat Methods 9:425–426.
Briones A, Raskin L. (2003). Diversity and dynamics ofmicrobial communities in engineered environmentsand their implications for process stability. Curr OpinBiotechnol 14: 270–276.
Caporaso JG, Kuczynski J, Stombaugh J, Bittinger K,Bushman FD, Costello EK et al. (2010). QIIME allowsanalysis of high-throughput community sequencingdata. Nat Methods 7: 335–336.
Caruso T, Chan Y, Lacap DC, Lau MCY, McKay CP,Pointing SB. (2011). Stochastic and deterministicprocesses interact in the assembly of desert microbialcommunities on a global scale. ISME J 5: 1406–1413.
Cayford BI, Dennis PG, Keller J, Tyson GW, Bond PL.(2012). High-throughput amplicon sequencingreveals distinct communities within a corrodingconcrete sewer system. Appl Environ Microbiol 78:7160–7162.
Daims H, Bruhl A, Amann R, Schleifer KH, Wagner M.(1999). The domain-specific probe EUB338 is insuffi-cient for the detection of all bacteria: development andevaluation of a more comprehensive probe set. SystAppl Microbiol 22: 434–444.
Dar SA, Kleerebezem R, Stams AJM, Kuenen JG,Muyzer G. (2008). Competition and coexistence ofsulfate-reducing bacteria, acetogens and methanogensin a lab-scale anaerobic bioreactor as affected bychanging substrate to sulfate ratio. Appl MicrobBiotechnol 78: 1045–1055.
Dennis PD, Guo K, Imelfort M, Jensen PD, Tyson GW,Rabaey K. (2013). Spatial uniformity of microbialdiversity in a continuous bioelectrochemical system.Bioresour Technol 129: 599–605.
DeSantis TZ, Hugenholtz P, Larsen N, Rojas M, Brodie EL,Keller K et al. (2006). Greengenes, a chimera-checked16S rRNA gene database and workbench compatiblewith ARB. Appl Environ Microbiol 72: 5069–5072.
Dryden IL. (2013). Shapes: Statistical Shape Analysis. Rpackage version 1.1-9. http://CRAN.R-project.org/package=shapes.
Edgar RC. (2010). Search and clustering orders of magni-tude faster than BLAST. Bioinformatics 26: 2460–2461.
Edgar RC, Haas BJ, Clemente JC, Quince C, Knight R.(2011). UCHIME improves sensitivity and speed ofchimera detection. Bioinformatics 27: 2194–2200.
Engelbrektson A, Kunin V, Wrighton KC, Zvenigorodsky N,Chen F, Ochman H et al. (2010). Experimental factorsaffecting PCR-based estimates of microbial speciesrichness and evenness. ISME J 4: 642–647.
Falk MW, Song K-G, NMatiasek MG, Wuertz S. (2009).Microbial community dynamics in replicate mem-brane bioreactors - natural reproducible fluctuations.Water Res 43: 842–852.
Fernandez A, Huang S, Xing J, Hickey R, Criddle C,Tiedje J. (1999). How stable is stable? Function versuscommunity composition. Appl Environ Microbiol 65:3697–3704.
Ge H, Jensen PD, Batstone DJ. (2011). Temperature phasedanaerobic digestion increases apparent hydrolysis ratefor waste activated sludge. Water Res 45: 1597–1606.
Gentile ME, Nyman JL, Criddle CS. (2007). Correlation ofpatterns of denitrification instability in replicatedbioreactor communities with shifts in the relativeabundance and denitrification patterns of specificpopulations. ISME J 1: 714–728.
Gopalan P, Jensen PD, Batstone DJ. (2013). Anaerobicdigestion of swine effluent: impact of productionstages. Biomass Bioenergy 48: 121–129.
Griffin ME, McMahon KD, Mackie RI, Raskin L. (1997).Methanogenic population dynamics during start-up ofanaerobic digesters treating municipal solid waste andbiosolids. Biotechnol Bioeng 57: 342–355.
Deterministic factors shape bioreactor communitiesI Vanwonterghem et al
12
The ISME Journal

Harpole WS. (2012). Neutral theory of species diversity.Nat Educ Knowledge 3: 60.
Jacob-Lopes E, Scoparo CHG, Lacerda L, Franco TT.(2009). Effect of light cycles (night/day) on CO2
fixation and biomass production by microalgae inphotobioreactors. Chem Eng Proc 48: 306–310.
Jaenicke S, Ander C, Bekel T, Bisdorf R, Droge M,Gartemann K-H et al. (2010). Comparative and jointanalysis of two metagenomic datasets from a biogsfermenter obtained by 454-pyrosequencing. PLoS One6: 1–15.
Jensen PD, Hardin MT, Clarke WP. (2009). Effect ofbiomass concentration and inoculum source in therate of anaerobic cellulose solubilization. BioresTechnol 2009: 5219–5225.
Jensen PD, Ge H, Batstone DJ. (2011). Assessing the role ofbiochemical methane potential tests in determininganaerobic degradability rate and extent. Water SciTechnol 64: 880–886.
Kamagata Y, Mikami E. (1991). Isolation and characteriza-tion of a novel thermophilic Methanosaeta strain.Int J Syst Bacteriol 41: 191–196.
Kong Y, Xia Y, Seviour R, He M, McAllister T, Forster R.(2012). In situ identification of carboxymethylcellulose–digesting bacteria in the rumen of cattlefed alfalfa or triticale. FEMS Microbiol Ecol 80:159–167.
LaPara TM, Nakatsu CH, Pantea LM, Alleman JE. (2001).Stability of the bacterial communities supported by aseven-stage biological process treating pharmaceuticalwastewater as revealed by PCR-DGGE. Water Res 36:638–646S.
Lee C, Kim J, Shin SG, Hwang S. (2008a). Monitoringbacterial and archaeal community shifts in amesophilic anaerobic batch reactor treating ahigh-strength organic wastewater. FEMS MicrobiolEcol 65: 544–554.
Lee C, Kim JY, Hwang K, O’Flaherty V, Hwang S. (2008b).Quantitative analysis of methanogenic communitydynamics in three anaerobic batch digesters treatingdifferent wastewaters. Water Res 43: 157–165.
Legendre P, Gallagher ED. (2001). Ecologically meaningfultransformations for ordination of species data.Oecologia 129: 271–280.
Liu Y, Whitman WB. (2008). Metabolic, phylogenetic, andecological diversity of the methanogenic archaea. AnnNY Acad Sci 1125: 171–189.
Ma K, Liu X, Dong X. (2006). Methanosaeta harundinaceasp. nov., a novel acetate-scavenging methanogenisolated from a UASB reactor. Int J Syst Evol Microbiol56: 127–131.
Magnuson A, Anderlund M, Johansson O, Lindblad P,Lomoth R, Polivka T et al. (2009). Biomimetic andmicrobial approaches to solar fuel generation. AccChem Res 42: 1899–1909.
Matano Y, Park JS, Goldstein MA, Hoi RH. (1994).Cellulose promotes extracellular assembly of Clostri-dium cellulovorans cellulosomes. J Bacteriol 176:6952–6956.
McDonald IR, Bodrossy L, Chen Y, Murrell JC. (2008).Molecular ecology techniques for the study ofaerobic methanotrophs. Appl Environ Microbiol 74:1305–1315.
McGuinness LM, Salganik M, Vega L, Pickering KD,Kerkhof LJ. (2006). Replicability of bacterial commu-nities in denitrifying bioreactors as measured by PCR/T-RFLP analysis. Environ Sci Technol 40: 509–515.
Merlino G, Rizzi A, Villa F, Sorlini C, Brambilla M,Navarotto P et al. (2012). Shifts of microbial commu-nity structure during anaerobic digestion of agro-industrial energy crops and food industry byproducts.J Chem Technol Biotechnol 87: 1302–1311.
Muller B, Sun L, Schnurer A. (2013). First insight into thesyntrophic acetate-oxidizing bacteria - a genetic study.Microbiologyopen 2: 35–53.
Muller N, Worm P, Schink B, Stams AJM, Plugge CM.(2010). Syntrophic butyrate and propionate oxidationprocesses: from genomes to reaction mechanisms.Environ Microbiol Rep 2: 489–499.
Nelson MC, Morrison M, Yu Z. (2011). A meta-analysisof the microbial diversity observed in anaerobicdigesters. Bioresour Technol 102: 3730–3739.
Neuwirth E. (2011). RColorBrewer: ColorBrewer palettes.R package version 1.0-5. http://CRAN.R-project.org/package=RColorBrewer.
Ofiteru ID, Lunn M, Curtis TP, Wells GF, Criddle CS,Francis CA et al. (2010). Combined niche and neutraleffects in a microbial wastewater treatment commu-nity. Proc Natl Acad Sci USA 107: 15345–15350.
Oksanen J, Blanchet G, Kindt R, Legendre P, Minchin PR,O’Hara RB et al. (2012). Vegan: Community ecologypackage. R package version 2.0-1. http://CRAN.R-project.org/package=vegan.
Pervin HM, GDennis PG, Lim HJ, Tyson GW, Batstone DJ,Bond PL. (2013). Drivers of microbial communitycomposition in mesophilic and thermophilictemperature-phased anaerobic digestion pre-treatmentreactors. Water Res 47: 7098–7108.
Pholchan MK, Baptista JC, Davenport RJ, Sloan WT,Curtis TP. (2013). Microbial community assembly,theory and rare functions. Front Microbiol 4: 1–9.
Rabaey K, Ossieur W, Verhaege M, Verstraete W. (2005).Continuous microbial fuel cells convert carbohydratesto electricity. Water Sci Technol 52: 515–523.
Regueiro L, Veiga P, Figueroa M, Alonso-Gutierrez J,Stams AJM, Lema JM et al. (2012). Relationshipbetween microbial activity and microbial communitystructure in six full-scale anaerobic digesters.Microbiol Res 167: 581–589.
Rittmann BE, Hausner M, Loffler F, Love NG, Muyzer G,Okabe S et al. (2006). A vista for microbial ecology andenvironmental biotechnology. Environ Sci Technol 15:1096–1103.
Schluter A, Bekel T, Diaz NN, Dondrup M, Eichenlaub R,Gartemann K-H et al. (2008). The metagenome of abiogas-producing microbial community of a production-scale biogas plant fermenter analysed by the454-pyrosequencing technology. J Biotechnol 136: 77–90.
Schnurer A, Schink B, Svensson BH. (1996). Clostridiumultunense sp. nov., a mesophilic bacterium oxidizingacetate in syntrophic association with a hydrogeno-trophic methanogenic bacterium. Int J Syst Bacteriol46: 1145–1152.
Sloan WT, Lunn M, Woodcock S, Head IM, Nee S,Curtis TP. (2006). Quantifying the roles of immigrationand chance in shaping prokaryote communitystructure. Environ Microbiol 8: 732–740.
Stahl DA, Amann R. (1991). Development and applicationof nucleic acid probes. In: Stackebrandt E,Goodfellow M (eds). Nucleic Acid Techniques inBacterial Systematics. John Wiley & Sons Ltd.:Chichester, England, pp 205–249.
Steinberg LM, Regan JM. (2011). Response of lab-scalemethanogenic reactors inoculated from different
Deterministic factors shape bioreactor communitiesI Vanwonterghem et al
13
The ISME Journal

sources to organic loading rate shocks. BioresourTechnol 102: 8790–8798.
Stieb M, Schink B. (1985). Anaerobic oxidation of fattyacids by Clostridium bryantii sp. nov., a sporeforming,obligately syntrophic bacterium. Arch Microbiol 140:387–390.
Sundberg C, Al-Soud WA, Larsson M, Alm E, Yekta SS,Scvensson BH et al. (2013). 454 pyrosequencinganalyses of bacterial and archaeal richness in 21 full-scale biogas digesters. FEMS Microbiol Ecol 85: 612–626.
Tyson GW, Chapman J, Hugenholtz P, Allen EE, Ram RJ,Richardson PM et al. (2004). Community structureand metabolism through reconstruction of microbialgenomes from the environment. Nature 428: 37–43.
Valentin-Vargas A, Toro-Labrador G, Massol-Deya AA.(2012). Bacterial community dynamics in full-scaleactivated sludge bioreactors: Operation and ecologicalfactors driving community assembly and performance.PLoS One 7: 1–12.
Wang J, Shen J, Wu Y, Chen T, Soininen J, Stegen JC et al.(2013). Phylogenetic beta diversity in bacterial
assemblages across ecosystems: deterministic versusstochastic processes. ISME J 7: 1310–1321.
Weiland P. (2010). Biogas production: current state andperspectives. Appl Microbiol Biotechnol 85: 849–860.
Werner JJ, Knights D, Garcia ML, Scalfone NB, Smith S,Yarasheski K et al. (2010). Bacterial communitystructures are unique and resilient in full-scalebioenergy systems. Proc Natl Acad Sci USA 108:4158–4163.
Wu S, Zhu Z, Fu L, Niu B, Li W. (2011). WebMGA: acustomizable web server for fast metagenomicsequence analysis. BMC Genomics 12: 1–9.
Zhou J, Liu W, Deng Y, Jiang Y-H, ZXue K, He Z et al.(2013). Stochastic assembly leads to alternative com-munities with distinct functions in a bioreactormicrobial community. mBio 4: 1–8.
Ziganshin AM, Liebetrau J, Proter J, Kleinsteuber S.(2013). Microbial community structure and dynamicsduring anaerobic digestion of various agriculturalwaste materials. Appl Microbiol Biotechnol 97:5161–5174.
Supplementary Information accompanies this paper on The ISME Journal website (http://www.nature.com/ismej)
Deterministic factors shape bioreactor communitiesI Vanwonterghem et al
14
The ISME Journal