determining threshold conditions for extreme fire
TRANSCRIPT
DETERMINING THRESHOLD CONDITIONS FOR EXTREME FIRE BEHAVIOUR: INTERIM REPORT DESCRIBING OUTCOMES FROM PHASE 1 OF THE PROJECT Annual Project Report 2017-2018
from Phase 1 of the project
Alex Filkov, Tom Duff, Trent Penman
University of Melbourne & Bushfire and Natural Hazards CRC
DOCUMENT TITLE | REPORT NO. 460.2019
1
Version Release history Date
1.0 Initial draft 04/03/2019
This work is licensed under a Creative Commons Attribution-Non Commercial 4.0
International Licence.
Material not licensed under the Creative Commons licence:
• Department of Industry, Innovation and Science logo
• Cooperative Research Centres Programme logo
• Bushfire and Natural Hazards CRC logo
• Any other logos
• All photographs, graphics and figures
All content not licenced under the Creative Commons licence is all rights
reserved. Permission must be sought from the copyright owner to use this
material.
Disclaimer:
The University of Melbourne and the Bushfire and Natural Hazards CRC advise that
the information contained in this publication comprises general statements based
on scientific research. The reader is advised and needs to be aware that such
information may be incomplete or unable to be used in any specific situation. No
reliance or actions must therefore be made on that information without seeking
prior expert professional, scientific and technical advice. To the extent permitted
by law, the University of Melbourne and the Bushfire and Natural Hazards CRC
(including its employees and consultants) exclude all liability to any person for any
consequences, including but not limited to all losses, damages, costs, expenses
and any other compensation, arising directly or indirectly from using this
publication (in part or in whole) and any information or material contained in it.
Publisher:
Bushfire and Natural Hazards CRC
March 2019
Citation: Filkov, A, Duff, T, Penman, T (2019). Determining threshold conditions for
extreme fire behaviour: interim report describing outcomes from phase 1 of the
project Annual Report 2017-2018 submitted to the Bushfire and Natural Hazards
CRC, February 2019.
Cover: Prescribe fire (photo by Brett Cirulis 2018)
DOCUMENT TITLE | REPORT NO. 460.2019
2
TABLE OF CONTENTS
ACKNOWLEDGEMENTS 3
EXECUTIVE SUMMARY 4
END USER STATEMENT 5
INTRODUCTION 6
RESEARCH APPROACH 8
Standardising data obtained from bushfires 8
Frequency of extreme fire behaviours in forested environments 17
The determinants of crown fire runs during extreme wildfires 22
KEY MILESTONES 24
UTILISATION OUTPUTS 25
PUBLICATIONS LIST 27
CURRENT TEAM MEMBERS 28
REFERENCES 29
DOCUMENT TITLE | REPORT NO. 460.2019
3
ACKNOWLEDGEMENTS
This study was funded in-part by the Bushfire and Natural Hazard Cooperative
Research Centre ‘Determining threshold conditions for extreme fire behaviour’
project and the Victorian Department of Environment, Land Water and Planning
‘Integrated Forest and Ecosystem Research’(iFER) project.
DOCUMENT TITLE | REPORT NO. 460.2019
4
EXECUTIVE SUMMARY
Alex Filkov, Tom Duff, Trent Penman
Bushfire Behaviour and Management Group, School of Ecosystem and Forest Sciences,
University of Melbourne, VIC
Extreme fires cause disproportionate impacts on the environment and the
community. There are significant incentives to being able to predict their
occurrence and behaviour. Most existing fire behaviour models have been
developed based on data and observations of fires that were small to moderate
in size. Consequently, they are not able to emulate the dynamic bushfire
behaviour that can occur under extreme conditions.
The main aim of this project is to investigate the conditions and processes under
which bushfire behaviour undergoes major transitions, including fire convection
and plume dynamics, evaluating the consequences of eruptive fire behaviour
(spotting events, convection driven wind damage, rapid fire spread) and
determining the combination of conditions for such behaviours to occur (e.g.
unstable atmosphere, fuel properties and weather conditions). To do this the
project was separated into two phases. The first phase of the project was focused
on data collection about extreme fires, analysis the frequency of occurrence of
extreme fire phenomena and determination the potential of including them in
fire behaviour models.
Two major research projects have been conducted in the first phase. The first
project lead to the development of a recommended list of data for routine
collection during bushfires (Filkov et al. 2018). In this work, we have also proposed
standards for data collection from bushfire events to enhance the advancement
of fire behaviour research and make research findings more internationally
relevant. The second project was a survey of fire management staff to examine
the frequency of extreme fire behaviours. Analysis of the surveys showed that
further research should be focused on the most common phenomena; Spotting,
Crown fires, PyroCb, Eruptive fires and Conflagrations. Spotting, Crown Fires and
PyroCb are responsible for 68 % of all extreme fire behaviours observed, and
there is evidence that they interact with each other. These for fire simulation
models to be robust, understanding how to incorporate these phenomena is
likely to be important.
DOCUMENT TITLE | REPORT NO. 460.2019
5
END USER STATEMENT
Dr. Simon Heemstra, Manager Planning and Predictive Services, NSW Rural Fire
Service
The first phase of the project has delivered a number of achievements. It has
compiled a national dataset of significant fires; quantified the inconsistency
around data collection across the country; suggested a schema to be
considered for future data collection (to address that inconsistency); undertaken
an analysis of the frequency of fires with ‘eruptive fire behaviours’ (EFBs); and
identified the frequency of individual types of EFBs. This phase of the project has
also looked into the determinants of crown fire runs, with the results providing a
potential basis for predictive modelling – potentially, a spatial ‘crown fire risk
forecast’, which if developed would have a clear path to utilisation via
incorporation into existing fire-weather explorer tools.
DOCUMENT TITLE | REPORT NO. 460.2019
6
INTRODUCTION
Bushfires can result in substantial social, economic and environmental impacts
and recovery activities may take many years. Fires in Australia have resulted in
mass house loss in Victoria in 2009 (Cruz et al. 2012), Western Australia in 2011 and
New South Wales and Tasmania in 2013 (Kepert et al. 2013). The total annual
economic cost of bushfires in Victoria is estimated to be approximately 180
million Australian dollars (Hughes and Alexander 2017). These costs have been
forecast to double over the next 40 years (Deloitte Access Economics 2014).
Consequently, It is important to develop strategies that are able to reduce the
risk of loss and thereby decrease the economic and social impacts of bushfire.
Fire simulation systems have been developed as part of management decision
support systems and are vital tools for supporting decision makers to reduce risks
to people and property (Finney 2004; Garcia et al. 2008; Tolhurst et al. 2008; Miller
et al. 2015). However, most of these simulation tools are based on empirical fire
forward rate of spread (FROS) models and do not emulate physical processes.
Existing empirical FROS models were predominantly developed using
observations of experimental fires burning in conditions that allow the fires to be
safely managed. As a result, data representing the conditions under which
damaging bushfires occur were rarely included. Indeed, current operational fire
spread models assume that fires burn at an approximately constant (quasi-
steady) rate of spread under a specific set of environmental conditions (e.g.
Rothermel (Rothermel 1972), Canadian FBP system (Van Nest and Alexander
1999), VESTA (Gould et al. 2008), CSIRO Grassland fire behaviour model (Cruz and
Gould 2009)). However; under extreme weather conditions, there are emergent
forms of fire behaviour that can rapidly change fire progression and intensity,
including phenomena such as plume dominated spread and mass spotting
events (Viegas et al. 2009). Consequently, simulation tools that solely utilise FROS
models for their spread calculations are not able to emulate these dynamic
bushfire behaviours.
Fire behaviour and management research cannot develop fully without better
quantification of the various fire behaviour phenomena that occur under
moderate and extreme weather conditions. To do so requires comprehensive
and accurate data. Experimental research into intense fire behaviour cannot be
undertaken as these fires cannot be safely managed; as a result alternative
sources of data are required and the only opportunity to collect information
about fires under moderate and extreme conditions is to collect observations at
bushfires as they occur. Case-study fires are commonly used in research (Martin
et al. 2009; Tutsch et al. 2010; Cruz et al. 2012) however, the data is usually
collated from various sources post event, hence data availability and quality is
highly variable. There is currently no formal procedure for ensuring the data
collected during and post-fire is appropriate for meeting research requirements.
Moreover, there is no quantitative research describing the frequency of Extreme
Fire Behaviours (EFBs). The EFBs that are common and have substantial impacts
on fire behaviour should be prioritised for the development of models so that their
physical processes can be understood and they can be predicted for
operational fire management purposes. The factors that result in different EFBs
and the consequences of these cannot be statistically analysed without
DOCUMENT TITLE | REPORT NO. 460.2019
7
replications of observations from wildfires, as they will are likely to be a complex
functions of many parameters, such as weather, terrain and the fire itself. To
understand the importance of EFBs in fire behaviour, we initially need to
understand how frequently they occur in order to prioritise future research effort.
Without new data regarding bushfire behaviour, fire research, the future
development of fire simulation tools and the associated decision support systems
will be unable to improve significantly.
To do so, the first phase of the project was devoted to the development of data
collection methodology about extreme fires, analysis the frequency of
occurrence of extreme fire phenomena and determination the potential of
including them in fire behaviour models.
DOCUMENT TITLE | REPORT NO. 460.2019
8
RESEARCH APPROACH
STANDARDISING DATA OBTAINED FROM BUSHFIRES
This section is based on the paper prepared and published during the first phase
of the project: Alexander Filkov, Thomas J. Duff, Trent D. Penman Improving Fire
Behaviour Data Obtained from Wildfires (2018) Forests, 9, 81;
doi:10.3390/f9020081 (Q1, H22, Scimago Journal & Country Rank).
Data collection in Australia
Australia is a diverse continent with ecosystems ranging from tropical rainforests
through to desert environments. Fires occur at varying intervals and intensities
across the country (Murphy et al. 2013). Land and fire management is the
responsibility of state-level governments (which include are six states and two
territories). The industry body AFAC (The Australasian Fire and Emergency Service
Authorities Council) endeavours to bring together fire and land management
agencies across Australia and New Zealand to provide a co-ordinated response
to fire and emergency management. To date, there has been no national policy
developed focused on data collection and management during fires.
To understand what data are collected during bushfires, we approached
representatives from all fire and land management agencies in Australia (Table
1). Representatives of state agencies were contacted via email and telephone
and asked to complete a guided survey. There were multiple agencies from
each state as fire management responsibilities are typically divided by land
tenure. Specifically, we asked:
• What information is collected and stored during fires?;
• How frequently are the data is collected?; and
• Does this information collection vary between fires under different
conditions?
Responses were received from Australian Capital Territory (ACT), New South
Wales (NSW), Victoria (VIC), Queensland (QLD), South Australia (SA) and Western
Australia (WA) (Table 1). No responses were received from Tasmania (TAS) and
the Northern Territory (NT). Where multiple agencies responded from the same
state, if at least one of the agencies in the state collects a certain type of data
the attribute was considered ‘collected’ by the state.

DOCUMENT TITLE | REPORT NO. 460.2019
9
State or
Territory Agency
ACT Parks and Conservation Service
Rural Fire Service (RFS)
NSW National Parks and Wildlife Service
Rural Fire Service (RFS)
NT Darwin Centre for Bushfire Research
Bushfires NT
QLD Queensland Parks and Wildlife Service
Queensland Fire and Emergency Services (FES)
SA Department of Environment, Water and Natural Resources (DEWNR)
Country Fire Service (CFS)
TAS Forestry Tasmania
Tasmania Fire Service
VIC Country Fire Authority (CFA)
Department of Environment, Land, Water and Planning (DEWLP)
WA Department of Parks and Wildlife (DPAW)
TABLE 1. LIST OF FIRE MANAGEMENT AGENCIES IN AUSTRALIA THAT WERE APPROACHED IN RELATION TO THE COLLECTION OF DATA DURING FIRES
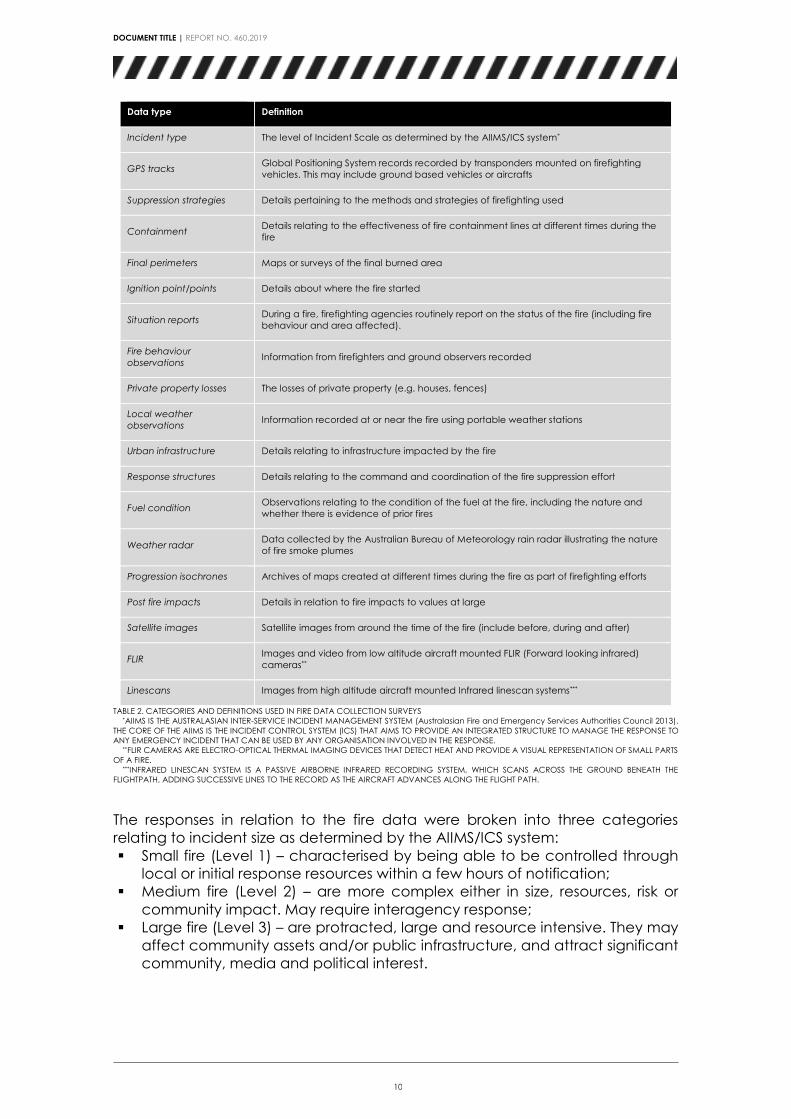
As fires are complex events and there are many sources of data, in the surveys
we classified fire data into broad groups (Table 2).
DOCUMENT TITLE | REPORT NO. 460.2019
10
Data type Definition
Incident type The level of Incident Scale as determined by the AIIMS/ICS system*
GPS tracks Global Positioning System records recorded by transponders mounted on firefighting
vehicles. This may include ground based vehicles or aircrafts
Suppression strategies Details pertaining to the methods and strategies of firefighting used
Containment Details relating to the effectiveness of fire containment lines at different times during the
fire
Final perimeters Maps or surveys of the final burned area
Ignition point/points Details about where the fire started
Situation reports During a fire, firefighting agencies routinely report on the status of the fire (including fire
behaviour and area affected).
Fire behaviour
observations Information from firefighters and ground observers recorded
Private property losses The losses of private property (e.g. houses, fences)
Local weather
observations Information recorded at or near the fire using portable weather stations
Urban infrastructure Details relating to infrastructure impacted by the fire
Response structures Details relating to the command and coordination of the fire suppression effort
Fuel condition Observations relating to the condition of the fuel at the fire, including the nature and
whether there is evidence of prior fires
Weather radar Data collected by the Australian Bureau of Meteorology rain radar illustrating the nature
of fire smoke plumes
Progression isochrones Archives of maps created at different times during the fire as part of firefighting efforts
Post fire impacts Details in relation to fire impacts to values at large
Satellite images Satellite images from around the time of the fire (include before, during and after)
FLIR Images and video from low altitude aircraft mounted FLIR (Forward looking infrared)
cameras**
Linescans Images from high altitude aircraft mounted Infrared linescan systems***
TABLE 2. CATEGORIES AND DEFINITIONS USED IN FIRE DATA COLLECTION SURVEYS
*AIIMS IS THE AUSTRALASIAN INTER-SERVICE INCIDENT MANAGEMENT SYSTEM (Australasian Fire and Emergency Services Authorities Council 2013).
THE CORE OF THE AIIMS IS THE INCIDENT CONTROL SYSTEM (ICS) THAT AIMS TO PROVIDE AN INTEGRATED STRUCTURE TO MANAGE THE RESPONSE TO
ANY EMERGENCY INCIDENT THAT CAN BE USED BY ANY ORGANISATION INVOLVED IN THE RESPONSE. **FLIR CAMERAS ARE ELECTRO-OPTICAL THERMAL IMAGING DEVICES THAT DETECT HEAT AND PROVIDE A VISUAL REPRESENTATION OF SMALL PARTS
OF A FIRE. ***INFRARED LINESCAN SYSTEM IS A PASSIVE AIRBORNE INFRARED RECORDING SYSTEM, WHICH SCANS ACROSS THE GROUND BENEATH THE
FLIGHTPATH, ADDING SUCCESSIVE LINES TO THE RECORD AS THE AIRCRAFT ADVANCES ALONG THE FLIGHT PATH.
The responses in relation to the fire data were broken into three categories
relating to incident size as determined by the AIIMS/ICS system:
▪ Small fire (Level 1) – characterised by being able to be controlled through
local or initial response resources within a few hours of notification;
▪ Medium fire (Level 2) – are more complex either in size, resources, risk or
community impact. May require interagency response;
▪ Large fire (Level 3) – are protracted, large and resource intensive. They may
affect community assets and/or public infrastructure, and attract significant
community, media and political interest.
DOCUMENT TITLE | REPORT NO. 460.2019
11
a
b
c
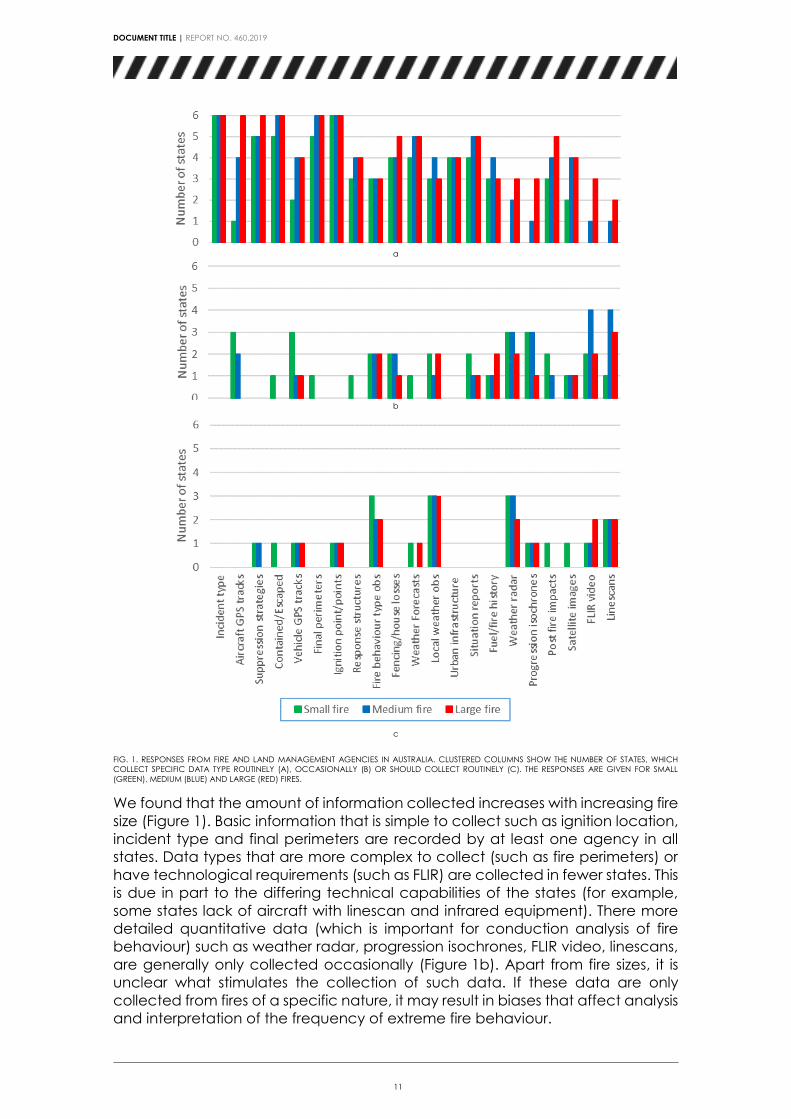
FIG. 1. RESPONSES FROM FIRE AND LAND MANAGEMENT AGENCIES IN AUSTRALIA. CLUSTERED COLUMNS SHOW THE NUMBER OF STATES, WHICH
COLLECT SPECIFIC DATA TYPE ROUTINELY (A), OCCASIONALLY (B) OR SHOULD COLLECT ROUTINELY (C). THE RESPONSES ARE GIVEN FOR SMALL
(GREEN), MEDIUM (BLUE) AND LARGE (RED) FIRES.
We found that the amount of information collected increases with increasing fire
size (Figure 1). Basic information that is simple to collect such as ignition location,
incident type and final perimeters are recorded by at least one agency in all
states. Data types that are more complex to collect (such as fire perimeters) or
have technological requirements (such as FLIR) are collected in fewer states. This
is due in part to the differing technical capabilities of the states (for example,
some states lack of aircraft with linescan and infrared equipment). There more
detailed quantitative data (which is important for conduction analysis of fire
behaviour) such as weather radar, progression isochrones, FLIR video, linescans,
are generally only collected occasionally (Figure 1b). Apart from fire sizes, it is
unclear what stimulates the collection of such data. If these data are only
collected from fires of a specific nature, it may result in biases that affect analysis
and interpretation of the frequency of extreme fire behaviour.
DOCUMENT TITLE | REPORT NO. 460.2019
12
When asked what kind of data should be collected routinely in the future, almost
all interviewees noted that for all groups of fires it would be ideal to start
recording fire behaviour type, weather radar and local weather (Figure 1c). From
our surveys, we also identified that there is a high degree of variation in the way
data is curated. While we were unable to conduct quantitative analysis, it is
evident that stored in a variety of ways (e.g. hard copies, local servers, online
data repositories). Databases are not shared between states and rarely between
agencies within the same state, and information storage is not centralised; i.e.
different categories of fire data may be stored in different systems or at different
physical locations. For example, in South Australia data is stored in an Incident
database, logbooks, a fire behaviour analyst server, a Corporate GIS database,
the Critical Resource Incident Information Management System Online
Network (CRIIMSON), the SA Computer Aided Dispatch (SACAD) system, the
Australasian Incident Reporting System (AIRS), and Incident Management Teams
reports (IMTs). For access to each data source, separate permissions are typically
required. Even if data is of high quality and correctly scoped, difficulty in access
may hinder fire behaviour science.
Innovation in data collection
The management of information during active bushfires is an undoubtable
challenge to managers. However, with recent technological developments, it is
likely to become simpler to collect some information. There are a wide range of
methods that have been developed in the research space that have not yet
been adapted for operational use by fire management agencies. Research will
always produce more methods than agencies will adopt, however methods that
can be demonstrated to efficiently provide meaningful data are likely to be
considered. For a new method to be adopted ideally there will need to be 1) a
tangible immediate benefit to the agency utilising it and 2) a long term benefit
to the agency through improved decision support as a result of research outputs.
Researchers and agencies need to work more closely to identify such
methodologies and develop strategies for data collection that ensure the quality
of the data recorded while minimising cost and disruption to the agencies. In this
section, we review a number of recent innovations that have the potential to
assist with both management and science. Some of these are already in use in
parts of Australia.
Perhaps the greatest recent advancement in fire behaviour research is data
derived from remote sensing before, during and after the fire. Remotely sensed
data give researchers a means to quantify patterns of variation in space and
time. The utility of these data depends on the scale of application. Satellites and
aircraft are the main sources of these data. Multi-temporal remote sensing
techniques based on space and airborne sensors have been effectively
employed to assess and monitor landscape change in a rapid and cost-
effective manner (Matvienko et al. 2011; Hally et al. 2016). Remotely sensed data
have been used to detect active fires (Scholes et al. 1996; Holden et al. 2005;
Sertel and Alganci 2015; Linke et al. 2017); map fire extents (Schmidt et al. 2016;
Zhou et al. 2016); estimate surface and crown fuel loading (Smith and Wooster
2005; Dennison et al. 2006; Barrett et al. 2016); assess active fire behaviour (Jones
et al. 2013; Di-Mauro et al. 2014) and examine post-fire vegetation response
(Keeley 2009).
One of the more developed remote sensing approaches is the mapping of
metrics that can be used to derive fire severity. Fire severity is a retrospective
DOCUMENT TITLE | REPORT NO. 460.2019
13
measure of the environmental impact of a fire (Cocke et al. 2005; Picotte and
Robertson 2011). Such approaches include assessing changes in indices such as
Normalized Burn Ratio (dNBR) (Rouse et al. 1973; Coban and Ozdamar 2014;
Chang et al. 2016), and the Normalized Difference Vegetation Index (NDVI)
(Bradstock et al. 2010; Collins et al. 2014; Holsinger et al. 2016; Chu et al. 2017).
Severity maps can be used to determine the relative importance of factors
including fuels, weather, terrain and disturbance history to fire post event (Briz et
al. 2003; Veraverbeke et al. 2012; Polivka et al. 2016). Recording the sequence
of satellite derived metrics over time can provide valuable data to understand
a range of issues such as fuel accumulation, ecological responses and
vegetation change. A fire severity map can also be used as a detailed map of
the burned area and an indirect measure of fire behaviour.
Fire behaviour and measures of the fuel consumed have been quantified
through the analysis of thermal infrared imagery (Billing 1986). Infrared (IR) sensors
and Infrared Line Scanning Systems on aircraft allow land managers to detect
actively burning areas, spot fires, estimate the energy radiated from the fire as it
burns and to analyse fire behaviour. These approaches allow for the
determination of key parameters of the fire, such as intensity, size, rate of spread,
hazards and other factors relevant to suppression activities and logistics. Line
Scanning Systems have been used for many years for fire mapping for firefighting
purposes (Johnston et al. 2014). However, to-date the systematic use of them to
collect fire behaviour data has been limited. When routinely collected,
progression isochrones will significantly simplify the process of fire reconstruction
and improve fire simulation tool validation. Mapped data will also provide an
understanding of how spatial processes like climate, topography, and
vegetation dynamics influence fire behaviour and regimes. Combining these
data with information on fire behaviour type and evidence of “unusual”
behaviour, such as extreme fire behaviour, is vital. Routinely collecting
information about fire intensity, fire front depth, spotting ignitions and “unusual”
fire behaviour will help to better understand fire behaviour and improve
operational and physical models.
Another system in operational use for firefighting that has had limited adoption
for systematic data collection is the use of low altitude IR fire observation.
Operationally in Australia, aircraft use a single IR sensor which can detect fire
fronts or hot spots and firebrands but not both. Most imaging techniques
intended to detect the heat signature of fire are based on MWIR (Medium
Wavelength Infrared) and TIR (Thermal Infrared) sensors (Schroeder et al. 2014).
Using a single IR sensor is problematic as the signal varies with emissivity, there is
considerable incident energy and only a small fraction of the pixels may
correspond to the fire. Using multi-spectral methods can solve of this problem.
For example, in the USA the airborne fire data gathering derived from multi-
spectral data acquired by autonomous modular line-scanner sensors (AMS)
operating in shortwave (SWIR), MWIR and LWIR spectral regions and providing
enhanced dynamic range in support of active fire imaging (Schroeder et al.
2014). Using also a multispectral approach the fire radiative power, fire fractional
area and temperature estimates can be estimated (Dirksen et al. 2009; Amiridis
et al. 2010; Raffuse et al. 2012). Furthermore such systems can view through
smoke, allowing the nature of ember generation and transport to be observed.
A relatively recent set of methods used in research but not yet in operational fire
management is the 3D visualisation and measurement of bushfire smoke plumes
and the atmosphere using LIDAR (LIght Detection And Ranging), SODAR (SOnic
DOCUMENT TITLE | REPORT NO. 460.2019
14
Detection And Ranging) and RADAR (RAdio Detection And Ranging). These
methods extract vertical profiles of the smoke plumes and also record the
movement of winds and hot gases from the fire. Such information is critical for
scientists to understand fire behaviour – in particular, the rapid acceleration that
occurs with some fires as they become large. Understanding the intensity and
evolution of convective plumes is critical in the understanding of lofting and
spotting of embers, where plume structure begins to play an important role in
how the embers are spatially distributed. A number of studies have also
characterised smoke plume behaviour using information derived from satellite
data (Banta et al. 1992; Kovalev et al. 2009; Lareau and Clements 2016).
Information on smoke-plume heights and their dynamics and these data will
allow for improvements in smoke dispersion and air quality models (Hufford et al.
1998; Chong et al. 2012; Saraiva et al. 2014; McCarthy et al. 2016).
Weather RADAR (Banta et al. 1992; Kovalev et al. 2009; Lareau and Clements
2016) and LIDAR (Zhang et al. 2016) have also been used for visualizing active
fires in context of dynamic broad scale weather events, understanding plume
formation and estimation of it characteristics. As weather RADARs are
maintained over large parts of Australia for rain monitoring, they have very broad
coverage and scan at a high frequency. Extreme fire weather features like
sudden wind changes, the escalation of a plume into a pyrocumulonimbus
(PyroCb) (or Cumulonimbus Flammagenitus (CbFg) according to the new
International Cloud Atlas, https://cloudatlas.wmo.int) or the advent of dry
thunder storms and associated lightning are all important events to be
considered during a major bushfire event but are rarely captured using existing
methods. Ground-based scanning systems such as RADAR can be considerate
an important auxiliary tool for detecting unauthorized burning and forest fires,
adding significant value to the information for decision-making in monitoring,
detecting and suppressing bushfires. An advantage of using weather RADAR to
analyse fire is that the network is already in place and maintained for another
purpose. Consequently, barriers to its adoption are low.
Remote sensing methods have provided a major step forward in data collection
and understanding fire behaviour. Methods for collecting these data are also
under constant development. Two major areas are worth highlighting. Firstly, as
new satellites are launched the quality and quantity of data available will
increase. In Australia, research and management have both used the
Advanced Very High Resolution Radiometer (AVHRR) imagery and the Moderate
Resolution Imaging Spectroradiometer (MODIS) on Terra (1999) and Aqua (2002)
(Ambrosia et al. 2011; Wing et al. 2013; Shahbazi et al. 2014). The launch of the
Japan Meteorological Agency (JMA) Himawari-8 satellite, with the 16-band
Advanced Himawari Imager (AHI-8) onboard in October 2014 presents a
significant opportunity to improve the timeliness of satellite fire detection across
Australia. The near real-time availability of images, at a ten minute frequency,
may also provide contextual information (background temperature) leading to
improvements in the assessment of fire characteristics (Hally et al. 2016).
Secondly, unmanned aerial vehicles (UAVs) as remote sensing platforms have
the great potential to increase the efficiency of data acquisition, but their
applications are still at an experimental stage (Werth et al. 2011, 2016; Viegas
2012). UAV remote sensing has low material and operational costs, flexible
control of spatial and temporal resolution, high-intensity data collection, and a
reduction of risk to crews. As the complexity of UAV and sensors increase, so will
our ability to capture high resolution spatial data at bushfires. An additional
DOCUMENT TITLE | REPORT NO. 460.2019
15
advantage is that they can be used in conditions that would be hazardous to
human health; particularly around fast moving fires or where there is unstable
weather.
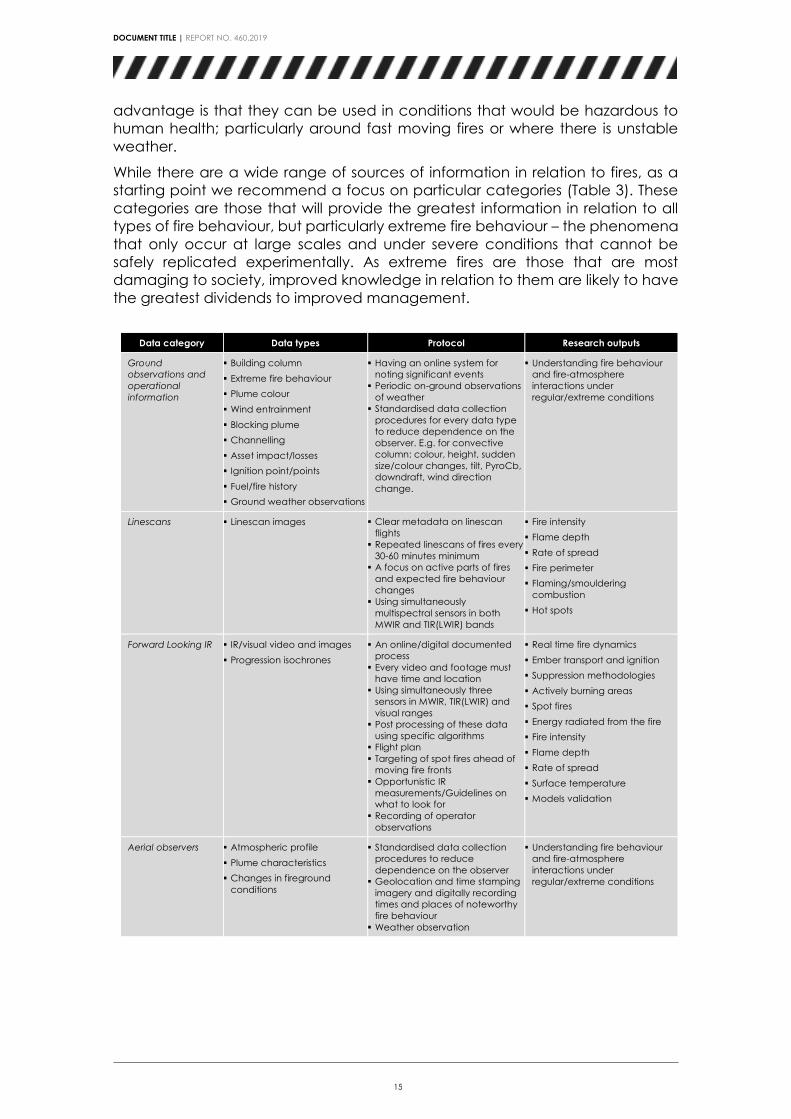
While there are a wide range of sources of information in relation to fires, as a
starting point we recommend a focus on particular categories (Table 3). These
categories are those that will provide the greatest information in relation to all
types of fire behaviour, but particularly extreme fire behaviour – the phenomena
that only occur at large scales and under severe conditions that cannot be
safely replicated experimentally. As extreme fires are those that are most
damaging to society, improved knowledge in relation to them are likely to have
the greatest dividends to improved management.
Data category Data types Protocol Research outputs
Ground
observations and
operational
information
▪ Building column
▪ Extreme fire behaviour
▪ Plume colour
▪ Wind entrainment
▪ Blocking plume
▪ Channelling
▪ Asset impact/losses
▪ Ignition point/points
▪ Fuel/fire history
▪ Ground weather observations
▪ Having an online system for
noting significant events
▪ Periodic on-ground observations
of weather
▪ Standardised data collection
procedures for every data type
to reduce dependence on the
observer. E.g. for convective
column: colour, height, sudden
size/colour changes, tilt, PyroCb,
downdraft, wind direction
change.
▪ Understanding fire behaviour
and fire-atmosphere
interactions under
regular/extreme conditions
Linescans ▪ Linescan images ▪ Clear metadata on linescan
flights
▪ Repeated linescans of fires every
30-60 minutes minimum
▪ A focus on active parts of fires
and expected fire behaviour
changes
▪ Using simultaneously
multispectral sensors in both
MWIR and TIR(LWIR) bands
▪ Fire intensity
▪ Flame depth
▪ Rate of spread
▪ Fire perimeter
▪ Flaming/smouldering
combustion
▪ Hot spots
Forward Looking IR ▪ IR/visual video and images
▪ Progression isochrones
▪ An online/digital documented
process
▪ Every video and footage must
have time and location
▪ Using simultaneously three
sensors in MWIR, TIR(LWIR) and
visual ranges
▪ Post processing of these data
using specific algorithms
▪ Flight plan
▪ Targeting of spot fires ahead of
moving fire fronts
▪ Opportunistic IR
measurements/Guidelines on
what to look for
▪ Recording of operator
observations
▪ Real time fire dynamics
▪ Ember transport and ignition
▪ Suppression methodologies
▪ Actively burning areas
▪ Spot fires
▪ Energy radiated from the fire
▪ Fire intensity
▪ Flame depth
▪ Rate of spread
▪ Surface temperature
▪ Models validation
Aerial observers ▪ Atmospheric profile
▪ Plume characteristics
▪ Changes in fireground
conditions
▪ Standardised data collection
procedures to reduce
dependence on the observer
▪ Geolocation and time stamping
imagery and digitally recording
times and places of noteworthy
fire behaviour
▪ Weather observation
▪ Understanding fire behaviour
and fire-atmosphere
interactions under
regular/extreme conditions
DOCUMENT TITLE | REPORT NO. 460.2019
16
Data category Data types Protocol Research outputs
Satellites ▪ Satellite images
▪ Fire severity maps
▪ Procedure to adopt active
sensors during fires
▪ System to identify and store data
from satellites recording over fire
areas as fires occur
▪ Fire intensity
▪ Flame depth
▪ Rate of spread
▪ Surface temperature
▪ Fire radiative power
▪ Char and ash cover
▪ Area burned
▪ Fire perimeter
▪ Flaming/smouldering
combustion
▪ Smoke plume
▪ Plume injection heights
▪ Hot spots
▪ Atmospheric chemistry changes
Remote weather
observations
▪ Meteorological parameters
▪ Radar data
▪ Having an online system to store
data
▪ Visualization of active fires
▪ Detection of dynamic effects
Unmanned Aerial
Vehicle
▪ Local weather characteristics
▪ IR/visual video and images
▪ Lidar data
▪ Development and
implementation of regulations to
use UAVs during fires.
▪ Mapping canopy gaps and
height
▪ Tracking fires
▪ Supporting intensive forest
management
▪ Fire intensity
▪ Flame depth
▪ Rate of spread
▪ Hot spots/Spotting
▪ Real time fire dynamics
▪ Ember transport and ignition
▪ Suppression methodologies
Vehicle/aircraft
GPS tracks and
suppression
strategies
▪ Aerial and ground GPS tracks
▪ Time of the water
drop/suppression
▪ Vehicle type and fire size class
▪ Having an online system for data
recording
▪ Optimisation suppression
activities and strategy
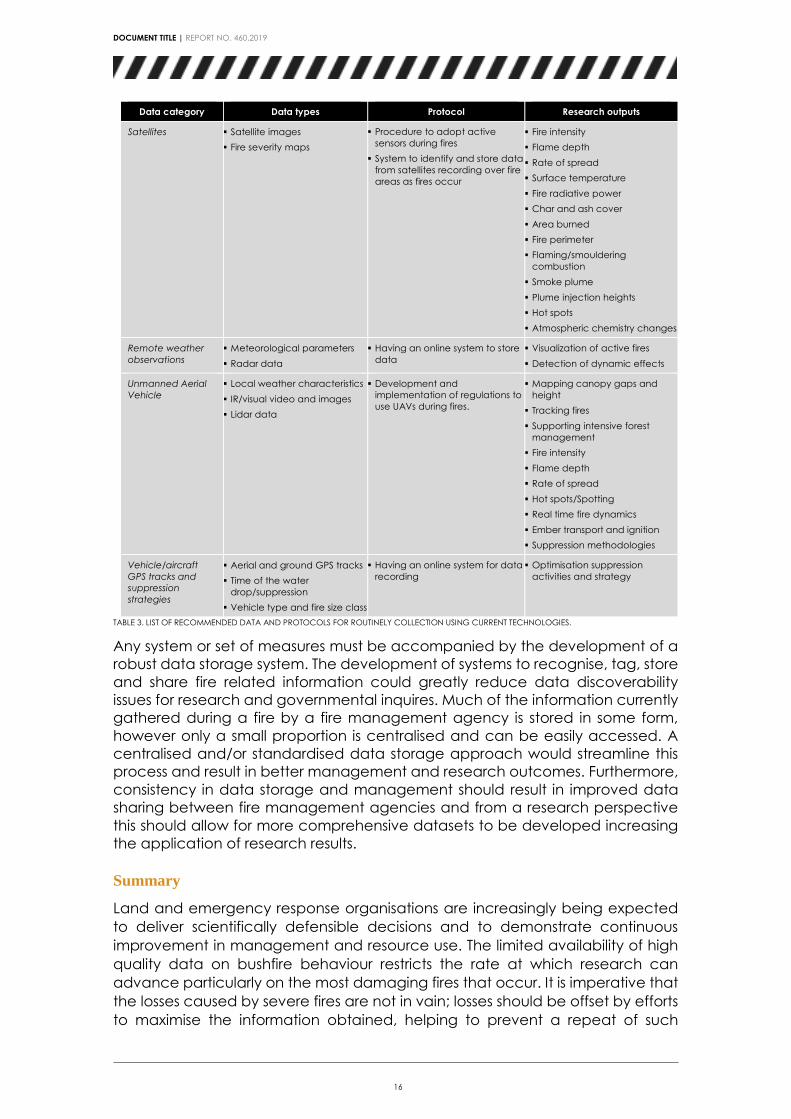
TABLE 3. LIST OF RECOMMENDED DATA AND PROTOCOLS FOR ROUTINELY COLLECTION USING CURRENT TECHNOLOGIES.
Any system or set of measures must be accompanied by the development of a
robust data storage system. The development of systems to recognise, tag, store
and share fire related information could greatly reduce data discoverability
issues for research and governmental inquires. Much of the information currently
gathered during a fire by a fire management agency is stored in some form,
however only a small proportion is centralised and can be easily accessed. A
centralised and/or standardised data storage approach would streamline this
process and result in better management and research outcomes. Furthermore,
consistency in data storage and management should result in improved data
sharing between fire management agencies and from a research perspective
this should allow for more comprehensive datasets to be developed increasing
the application of research results.
Summary
Land and emergency response organisations are increasingly being expected
to deliver scientifically defensible decisions and to demonstrate continuous
improvement in management and resource use. The limited availability of high
quality data on bushfire behaviour restricts the rate at which research can
advance particularly on the most damaging fires that occur. It is imperative that
the losses caused by severe fires are not in vain; losses should be offset by efforts
to maximise the information obtained, helping to prevent a repeat of such
DOCUMENT TITLE | REPORT NO. 460.2019
17
events in the future. Improvement of data collection will facilitate providing
leverage on data collected and allow robust conclusions to be reached sooner
and with less expense. This would include improving systems and processes in use
today, as well as considering new technologies than can help information to be
collected more efficiently. To be successful, this must be in a form of partnership
between researchers and fire agencies, and ideally with a coordinated
approach that standardises methods, technologies and approaches Australia
wide.
FREQUENCY OF EXTREME FIRE BEHAVIOURS IN FORESTED ENVIRONMENTS
This section is based on the paper prepared during the project and submitted for
review to the International Journal of Wildland Fire: Alexander Filkov, Thomas J.
Duff, Trent D. Penman Frequency of extreme fire behaviours in forested
environments.
Data collection in Australia
Extreme fire behaviours (EFBs) are physical phenomena which occur within
extreme fires (Werth et al. 2011, 2016; Viegas 2012). Definitional issues are present
for both extreme fires and EFBs. Tedim et al. (2018) proposed the term extreme
fire event instead of extreme fire. Based on comprehensive literature review the
authors described extreme fire event as a combination of EFBs and the
consequences of them. However, they considered only limited number of EFBs.
At the moment, there are no standardised definitions for EFBs (Werth et al. 2011,
2016; Viegas 2012; Sharples et al. 2016; Bowman et al. 2017). EFBs are physical
phenomena of fire behaviour that may occur when fires burn under specific
conditions. These have the potential to be identified, described and modelled.
In general, extreme fires can involve one to several EFBs simultaneously (Cruz et
al. 2012; Tedim et al. 2018). Viegas (Viegas 2012) described EFB as “a set of
situations that are more like manifestations or forms of extreme fire behaviour
rather than one particular form of fire behaviour”. It means that EFB is not a single
process or event, but a combination of different phenomena. This definition is
used in this work.
A number of recent studies have been devoted to describing the processes
behind particular EFBs (Viegas and Simeoni 2011; Fox and Whitesides 2015;
BNHCRC 2016). However, there is no quantitative research describing the
frequency of EFBs. The EFBs that are common and have substantial impacts on
fire behaviour should be prioritised for the development of models so that their
physical processes can be understood and they can be predicted for
operational fire management purposes. The factors that result in different EFBs
and the consequences of these cannot be statistically analysed without
replications of observations from wildfires, as they are likely to be a complex
functions of many parameters, such as weather, terrain and the fire itself. To
understand the importance of EFBs in fire behaviour, we initially need to
understand how frequently they occur in order to prioritise future research efforts.
We used an expert elicitation approach to determine the frequency of
occurrence of nine recognised extreme fire behaviours: Spotting, Crown fires,
DOCUMENT TITLE | REPORT NO. 460.2019
18
Pyro-convective events (PyroEvs), Eruptive fires, Conflagrations, Jump fires, Fire
tornados/whirls, Fire channelling and Downbursts.
Methods
EFBs have been reported to be a feature of extreme fires. To collect data on
these, we considered all fires greater than 1,000 ha in Australia that occurred
between 2006 and 2016. We approached representatives from management
agencies responsible for fire response in each state) via email and telephone
and asked them to complete a guided survey. For each fire, we asked which (if
any) EFBs had been observed (see below) and what data there may be to
support this. Data were categorised into three types: direct measurements
(linescans, images, video, etc.), indirect data (weather records, etc.) and the
data based on anecdotal evidence (observations recorded in situation reports,
etc.).
The surveys divided EFBs into 9 different types:
1. Spotting. Spotting is a “behaviour of a fire producing firebrands or embers
that are carried by the wind and which start new fires beyond the zone of
direct ignition by the main fire” (NWCG 2017).
2. Fire tornados. A fire tornado/whirl is a “spinning vortex column of
ascending hot air and gases rising from a fire and carrying aloft smoke,
debris, and flame. Fire whirls range in size from less than one foot (0.3 m)
to over 500 feet (152 m) in diameter. Large fire whirls have the intensity of
a small tornado” (NWCG 2017).
3. Fire channelling. Fire channelling/Lateral vortices is a rapid lateral fire
spread across a steep leeward slope in a direction approximately
transverse to the background winds, in addition to the usual downwind
direction (Sharples et al. 2012).
4. Jump fires. Jump fire/Junction zones are associated to the merging of the
fire fronts making a small angle between them producing very high rates
of spread and with the potential to generate fire whirls and tornadoes
(Viegas 2012).
5. Eruptive fires. Eruptive fires are fires that occur usually in canyons or steep
slopes and are characterised by a rapid acceleration of the head fire rate
of spread (Viegas 2012).
6. Crown fires. “A fire that advances from top to top of trees or shrubs more
or less independent of a surface fire.” (NWCG 2017).
7. Conflagrations. “Conflagration are raging, destructive fires. Often used to
connote such a fire with a moving front as distinguished from a fire storm”
(NWCG 2017).
8. Downbursts. Downbursts are downdrafts associated with a Cumulus
flammagenitus1 clouds that induces an outburst of strong winds on or near
1 Cumulus flammagenitus is also known by the unofficial, common name, 'pyrocumulus') (‘International
Cloud Atlas’ 2017).
Cumulus (Cu) are detached clouds, generally dense and with sharp outlines, developing vertically in the
form of rising mounds, domes or towers, of which the bulging upper part often resembles a cauliflower. The
sunlit parts of these clouds are mostly brilliant white; their bases are relatively dark and nearly horizontal
(‘International Cloud Atlas’ 2017).
Flammagenitus (Fg) are clouds that are clearly observed to have originated as a consequence of
localized natural heat sources, such as forest fires, wildfires or volcanic activity and which, at least in part, consist
of water drops (for example, Cumulus flammagenitus (CuFg) or Cumulonimbus flammagenitus (CbFg))
(‘International Cloud Atlas’ 2017).
DOCUMENT TITLE | REPORT NO. 460.2019
19
the ground (Haines 2004). These winds spread from the location of the
downburns and may result in fire spread into the prevailing wind direction.
9. Pyro-convective events. Pyro-convective event is an extreme
manifestation of a flammagenitus cloud, generated by the heat of a
wildfire, that often rises to the upper troposphere or lower stratosphere
(‘International Cloud Atlas’ 2017).
All participants in the survey were provided a presentation, which briefly defined
the above EFBs. Participants were requested to view the presentation before
completing the survey.
All responses were grouped for each fire. Where multiple agencies responded
with information for the same fire, the data from the highest quality data type
was retained. Obtained data were analysed regarding to frequency of EFBs,
quantity of EFBs per fire and confidence level of data.
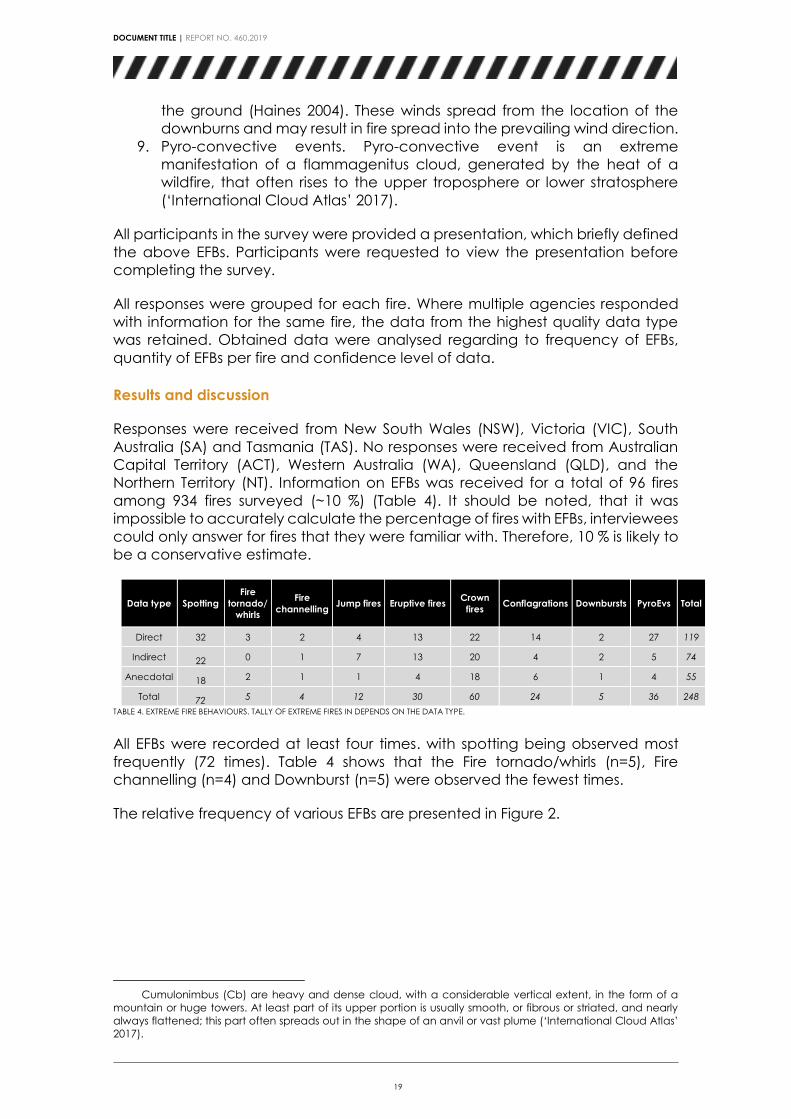
Results and discussion
Responses were received from New South Wales (NSW), Victoria (VIC), South
Australia (SA) and Tasmania (TAS). No responses were received from Australian
Capital Territory (ACT), Western Australia (WA), Queensland (QLD), and the
Northern Territory (NT). Information on EFBs was received for a total of 96 fires
among 934 fires surveyed (~10 %) (Table 4). It should be noted, that it was
impossible to accurately calculate the percentage of fires with EFBs, interviewees
could only answer for fires that they were familiar with. Therefore, 10 % is likely to
be a conservative estimate.
Data type Spotting
Fire
tornado/
whirls
Fire
channelling Jump fires Eruptive fires
Crown
fires Conflagrations Downbursts PyroEvs Total
Direct 32 3 2 4 13 22 14 2 27 119
Indirect 22 0 1 7 13 20 4 2 5 74
Anecdotal 18 2 1 1 4 18 6 1 4 55
Total 72 5 4 12 30 60 24 5 36 248
TABLE 4. EXTREME FIRE BEHAVIOURS. TALLY OF EXTREME FIRES IN DEPENDS ON THE DATA TYPE.
All EFBs were recorded at least four times. with spotting being observed most
frequently (72 times). Table 4 shows that the Fire tornado/whirls (n=5), Fire
channelling (n=4) and Downburst (n=5) were observed the fewest times.
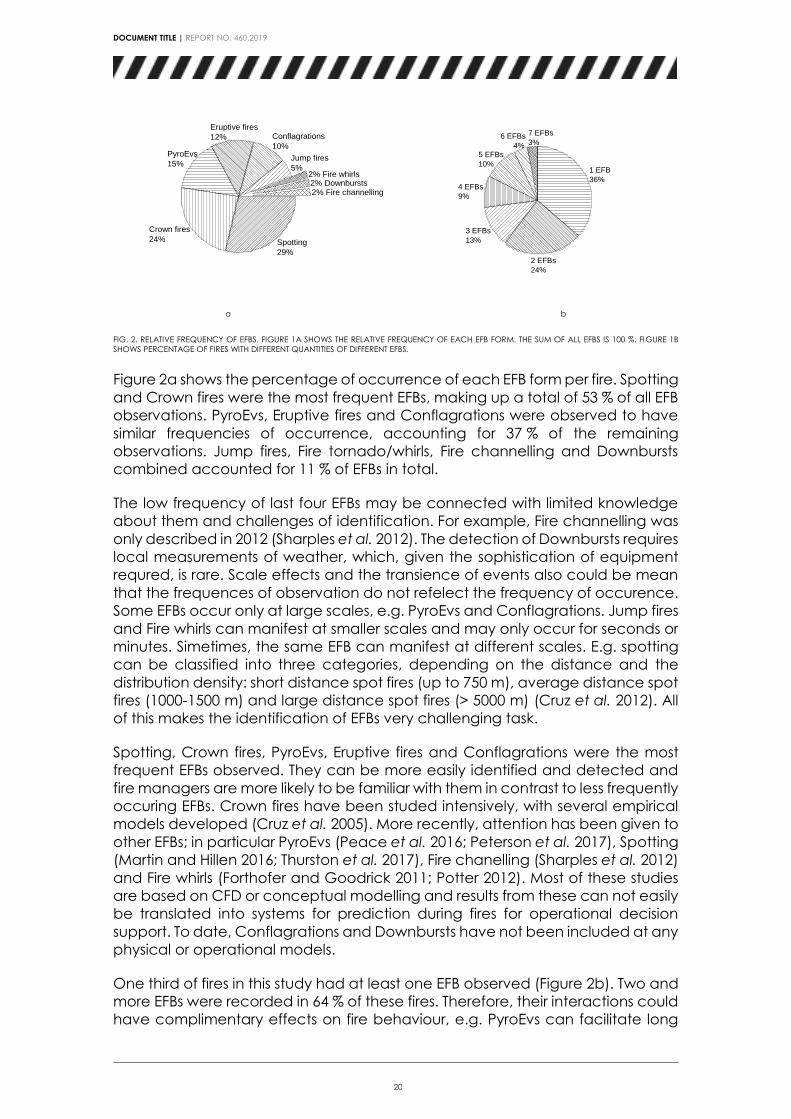
The relative frequency of various EFBs are presented in Figure 2.
Cumulonimbus (Cb) are heavy and dense cloud, with a considerable vertical extent, in the form of a
mountain or huge towers. At least part of its upper portion is usually smooth, or fibrous or striated, and nearly
always flattened; this part often spreads out in the shape of an anvil or vast plume (‘International Cloud Atlas’
2017).
DOCUMENT TITLE | REPORT NO. 460.2019
20
2% Fire channelling2% Downbursts2% Fire whirls
Jump fires
5%
Conflagrations
10%
Eruptive fires
12%
PyroEvs
15%
Crown fires
24% Spotting
29%
7 EFBs
3%6 EFBs
4%5 EFBs
10%
4 EFBs
9%
3 EFBs
13%
2 EFBs
24%
1 EFB
36%
a b
FIG. 2. RELATIVE FREQUENCY OF EFBS. FIGURE 1A SHOWS THE RELATIVE FREQUENCY OF EACH EFB FORM. THE SUM OF ALL EFBS IS 100 %. FIGURE 1B
SHOWS PERCENTAGE OF FIRES WITH DIFFERENT QUANTITIES OF DIFFERENT EFBS.
Figure 2a shows the percentage of occurrence of each EFB form per fire. Spotting
and Crown fires were the most frequent EFBs, making up a total of 53 % of all EFB
observations. PyroEvs, Eruptive fires and Conflagrations were observed to have
similar frequencies of occurrence, accounting for 37 % of the remaining
observations. Jump fires, Fire tornado/whirls, Fire channelling and Downbursts
combined accounted for 11 % of EFBs in total.
The low frequency of last four EFBs may be connected with limited knowledge
about them and challenges of identification. For example, Fire channelling was
only described in 2012 (Sharples et al. 2012). The detection of Downbursts requires
local measurements of weather, which, given the sophistication of equipment
requred, is rare. Scale effects and the transience of events also could be mean
that the frequences of observation do not refelect the frequency of occurence.
Some EFBs occur only at large scales, e.g. PyroEvs and Conflagrations. Jump fires
and Fire whirls can manifest at smaller scales and may only occur for seconds or
minutes. Simetimes, the same EFB can manifest at different scales. E.g. spotting
can be classified into three categories, depending on the distance and the
distribution density: short distance spot fires (up to 750 m), average distance spot
fires (1000-1500 m) and large distance spot fires (> 5000 m) (Cruz et al. 2012). All
of this makes the identification of EFBs very challenging task.
Spotting, Crown fires, PyroEvs, Eruptive fires and Conflagrations were the most
frequent EFBs observed. They can be more easily identified and detected and
fire managers are more likely to be familiar with them in contrast to less frequently
occuring EFBs. Crown fires have been studed intensively, with several empirical
models developed (Cruz et al. 2005). More recently, attention has been given to
other EFBs; in particular PyroEvs (Peace et al. 2016; Peterson et al. 2017), Spotting
(Martin and Hillen 2016; Thurston et al. 2017), Fire chanelling (Sharples et al. 2012)
and Fire whirls (Forthofer and Goodrick 2011; Potter 2012). Most of these studies
are based on CFD or conceptual modelling and results from these can not easily
be translated into systems for prediction during fires for operational decision
support. To date, Conflagrations and Downbursts have not been included at any
physical or operational models.
One third of fires in this study had at least one EFB observed (Figure 2b). Two and
more EFBs were recorded in 64 % of these fires. Therefore, their interactions could
have complimentary effects on fire behaviour, e.g. PyroEvs can facilitate long
DOCUMENT TITLE | REPORT NO. 460.2019
21
distance Spotting and Fire tornados/whirls. Consequently, the potential
interactions of these phenomena should be a focus of investigation.
44%37%
75%
43%
58%
33%
60%
40%50%
31%33%
14%
43% 17%58% 0% 40%
25%
25%30%
11% 14%25%
9%
40%
20%25%
44%37%
75%
43%
58%
33%
60%
40%50%
31%33%
14%
43% 17%58% 0% 40%
25%
25%30%
11% 14%25%
9%
40%
20%25%
Spottin
g
Cro
wn fire
s
Pyr
oE
vsE
ruptiv
e fire
sC
onfla
gra
tions
Jum
p fire
s
Fire
whirl
sD
ow
nburs
tsFire
channelling
0
10
20
30
40
50
60
70
80
90
100
Direct
Indirect
Anecdotal
%
VIC NSW SA TAS
0
10
20
30
40
50
60
70
80
90
100
%
Direct
Indirect
Anecdotal
a b
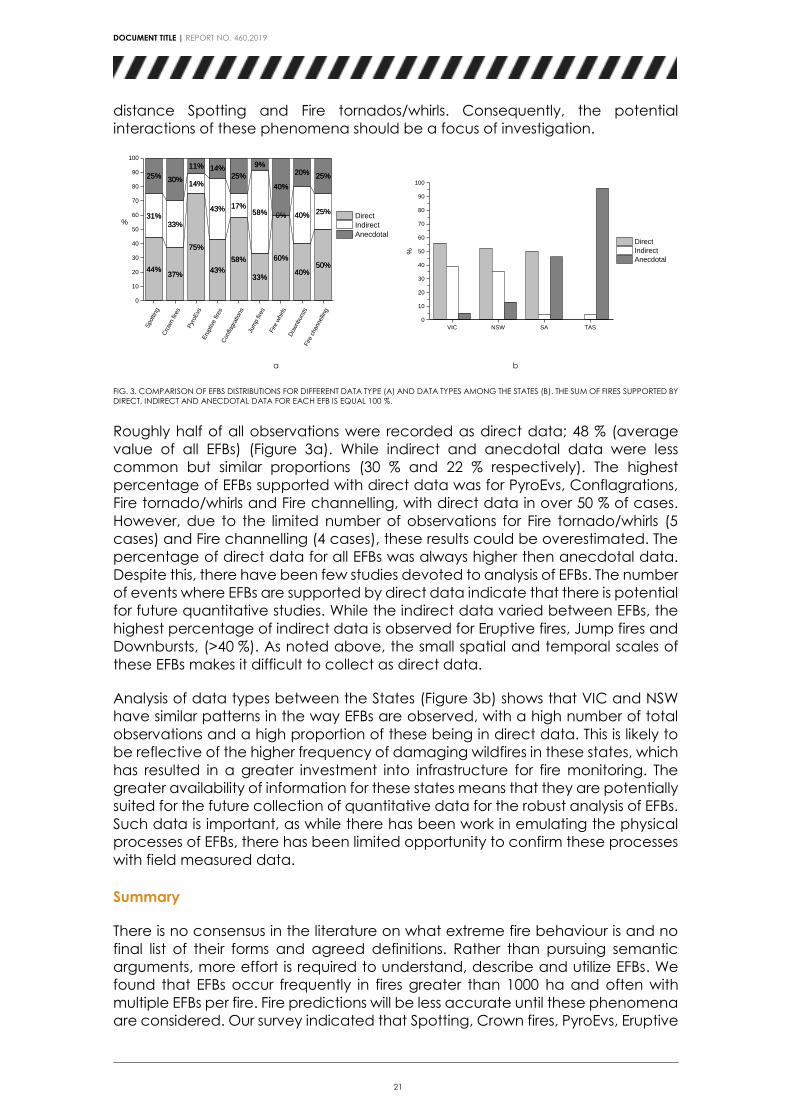
FIG. 3. COMPARISON OF EFBS DISTRIBUTIONS FOR DIFFERENT DATA TYPE (A) AND DATA TYPES AMONG THE STATES (B). THE SUM OF FIRES SUPPORTED BY
DIRECT, INDIRECT AND ANECDOTAL DATA FOR EACH EFB IS EQUAL 100 %.
Roughly half of all observations were recorded as direct data; 48 % (average
value of all EFBs) (Figure 3a). While indirect and anecdotal data were less
common but similar proportions (30 % and 22 % respectively). The highest
percentage of EFBs supported with direct data was for PyroEvs, Conflagrations,
Fire tornado/whirls and Fire channelling, with direct data in over 50 % of cases.
However, due to the limited number of observations for Fire tornado/whirls (5
cases) and Fire channelling (4 cases), these results could be overestimated. The
percentage of direct data for all EFBs was always higher then anecdotal data.
Despite this, there have been few studies devoted to analysis of EFBs. The number
of events where EFBs are supported by direct data indicate that there is potential
for future quantitative studies. While the indirect data varied between EFBs, the
highest percentage of indirect data is observed for Eruptive fires, Jump fires and
Downbursts, (>40 %). As noted above, the small spatial and temporal scales of
these EFBs makes it difficult to collect as direct data.
Analysis of data types between the States (Figure 3b) shows that VIC and NSW
have similar patterns in the way EFBs are observed, with a high number of total
observations and a high proportion of these being in direct data. This is likely to
be reflective of the higher frequency of damaging wildfires in these states, which
has resulted in a greater investment into infrastructure for fire monitoring. The
greater availability of information for these states means that they are potentially
suited for the future collection of quantitative data for the robust analysis of EFBs.
Such data is important, as while there has been work in emulating the physical
processes of EFBs, there has been limited opportunity to confirm these processes
with field measured data.
Summary
There is no consensus in the literature on what extreme fire behaviour is and no
final list of their forms and agreed definitions. Rather than pursuing semantic
arguments, more effort is required to understand, describe and utilize EFBs. We
found that EFBs occur frequently in fires greater than 1000 ha and often with
multiple EFBs per fire. Fire predictions will be less accurate until these phenomena
are considered. Our survey indicated that Spotting, Crown fires, PyroEvs, Eruptive
DOCUMENT TITLE | REPORT NO. 460.2019
22
fires and Conflagrations are the most commonly observed EFBs, and so these
should be the highest priority in determining which EFBs to research for inclusion
in fire models. The relative commonness of direct evidence available for EFBs is
indicative that there should be data available for the development of models.
THE DETERMINANTS OF CROWN FIRE RUNS DURING EXTREME WILDFIRES
This section is based on the paper accepted for presentation at VIII International
Conference on Forest Fire Research in Portugal: Alexander I. Filkov, Luke Collins,
Anthony Rawlins, Thomas J. Duff, Brett Cirulis, Trent D. Penman The determinants
of crown fire runs during extreme wildfires in broadleaf forests in Australia.
Crown fires are a relatively common type of extreme fire behaviour in forest
ecosystems, which are characterised by high fire intensities, rapid rates of spread
and high release of radiant heat. Consequently, crown fires reduce the likelihood
of successful suppression and can threaten human lives through burnovers and
entrapments. Crown fires can have negative impacts on some ecosystems
services such as biodiversity and water quality.
The occurrence and nature of crown fires has been extensively studied in conifer
systems, with a large number of models having been developed (Cruz and
Alexander 2013). Crown fires have been found to be a function of crown fuel
properties (such as dead fuel moisture content, bulk density and the gap from
the surface fuels to the canopy), surface fuel properties, topography and
weather conditions (such as wind speed, temperature). Despite its importance,
research into crown fire dynamics in the broadleaved Eucalyptus forests of
Australia is limited.
Remotely sensed maps of fire severity have been used to study environmental
drivers of crown fires occurrence. Fire severity is a retrospective measure of the
environmental impact of a fire (Keeley 2009). Severity maps can be used to
determine the influence of factors including fuels, weather, terrain and
disturbance history on fire severity, as a surrogate of crown fire behaviour.
Previous studies examining crown fire occurrence in eucalypt forest have used
coarse scale measures of fire weather indices, which combine information on fire
weather and moisture availability into one value (Price and Bradstock 2012;
Storey et al. 2016). Furthermore, past studies have considered the likelihood of
crown fire at a single point (Price and Bradstock 2012; Storey et al. 2016) whereas
from a management perspective the prediction of large patches of crown fire,
or crown fire runs is desirable as they have larger impacts and are a greater
threat to fire suppression activities.
In this study, we use observations from 15 large wildfires that occurred in eucalypt
forest in Australia to develop a model to predict the likelihood and extent of
crown fire events using spatially derived environmental predictors and a range
of weather measurements.
DOCUMENT TITLE | REPORT NO. 460.2019
23
Methods
The study was conducted in forested areas of south-eastern Australia. We
focused on fifteen large wildfires that occurred in forest between 2009 and 2015.
These fires all have several progression isochrones each day.
Fire severity maps were created for each fire at 30 m resolution using Landsat
imagery. We reclassified each pixel as either experiencing crown fire or not. We
measured crown fire runs as the proportion of pixels experiencing crown fire
within a 150 x 150 m window (2.25 ha). Predictor variables were chosen to
represent the four key environmental drivers of fire behaviour, namely fuel
moisture (i.e. live and dead fuel), fuel load and structure (i.e. surface, elevated
and bark fuels, tree height), fire weather (i.e. vapour-pressure deficit, wind speed,
relative wind direction) and topography (i.e. slope and ruggedness). We used
Random Forests to model the effect of these environmental drivers on (i) crown
fire occurrence and (ii) the proportion of pixels experiencing crown fire.
Results and discussion
Results of the modelling showed that fuel moisture and fire weather were most
influential in determining crown fire runs, with topography having intermediate
influence and fuel load and structure having the lowest influence.
Several predictor variables were found to have a large effect on the proportion
of pixels effected by crown fire. They were vapour-pressure deficit, dead fuel
moisture content and wind speed. These all had clearly identified thresholds,
below which crown fires rarely occurred. These threshold values for vapour-
pressure deficit, dead fuel moisture content and wind speed were 3 kPa, 7 % and
40 km/h respectively. Unsurprisingly, these results highlight greater crown fire
activity under warmer and drier conditions. A decrease of dead moisture
content of one percent and an increase of vapour-pressure deficit from 3 kPa to
7 kPa led to growth of the proportion of pixels where crown fires occurred by 40
%. An increase of wind speed from 40 km/h to 60 km/h led to 30 % growth in the
proportion of area.
Guidelines developed from this model can be used to spatialize the risk of crown
fires over landscapes at an hourly scale. These values would provide managers
with a rapid means of assessing the risk of crown fire and subsequent damage at
the resolution of local forecast values. In south-eastern Australia, these values
would be at a 3km spatial resolution for up to seven days. Such information would
be invaluable for fire managers in terms of allocating resources and public
engagement.
DOCUMENT TITLE | REPORT NO. 460.2019
24
KEY MILESTONES
1. Annual Report on Project (2015)
2. Annual RAF presentation
3. Appoint postdoctoral fellow (UMelb)
4. Communications plan submitted for review by End User panel
5. Workshop with end users to develop science plan
6. Progress report (including science plan)
7. Data sources identified and described in a project note
8. Database protocols developed and agreed with end-users. Preliminary
data sets
9. Project note (describing progress in data collation)
10. Annual Report on Project (2016)
11. Project note (describing preliminary analysis of fire phenomena)
12. Annual RAF presentation
13. Paper submitted for approval (Proceedings of the Combustion Institute)
14. Workshop with end uses on project direction and outcomes
15. Project note (describing progress in database development)
16. Conference presentation of research findings (12th International
Symposium on Fire Safety Science)
17. Paper submitted for approval (Fire Safety Journal)
18. Annual Report on Project (2017)
19. Hazard Note (Issue 21)
20. Conference presentation of research findings (AFAC).
21. Showcase 2017 presentation
22. Project note (describing future directions for research)
23. Paper submitted for approval (Forests)
24. Summary document outlining the current status of the fire database
being collated, including the number of fires and nature of the data
DOCUMENT TITLE | REPORT NO. 460.2019
25
UTILISATION OUTPUTS
Commercialisation/Utilisation
An unexpected outcome from this part of the project was a set of suggested
optimal data collection protocols. During this reporting period an opportunity for
end users to investigate the use of the data collection protocols became
apparent. It is envisaged that end user representatives will collaboratively
explore opportunities to use the protocols for standardising elements of data
collection, and that this exploration will commence in the coming quarter.
Education & Training
▪ Course in Basic Wildfire Awareness (Certificate)
▪ Course in 4 wheel drive operations (Certificate)
▪ HLTAID003 Provide first aid (Certificate)
▪ Bushfire and Climate (FRST90025) laboratory exercises
End User Engagement
A workshop was held on the 20th of May 2016 at the AFAC offices in Melbourne.
At the workshop, there were representatives from fire agencies from WA, NSW,
ACT, SA, Victoria and Queensland, as well as representatives from BOM and the
University of New South Wales. The stakeholders:
• Provided feedback on the proposed research methodology for examining
extreme fire behaviour.
• Contributed to the identification of a study set of fires.
• Assisted in the identification of available datasets for the study.
• Agreed to provide large spatial data sets for modelling and analyses.
The outcomes of this workshop were extended through face to face meetings in
each of the relevant states. In addition to agency collaboration, Melbourne
University has been actively working to develop links to the BOM fire research
projects and other BNHCRC researchers.
A second an end-user workshop was held at BNHCRC RAF 2017 in Canberra. It
was devoted to discussion of findings and future research plans. Stakeholders
provided positive feedback on the proposed research methodology and
agreed to provide large spatial data sets for modelling and analyses. Together
with key agency stakeholders we identified potential linkages to other projects.
List of recommended data and protocols for routinely collection during wildfires
was forwarded to NSW RFS.
Opportunities
Thomas Duff undertook an external travel fellowship (funded by the Churchill
Trust) to foster international collaboration on research on extreme fire behaviour
and rare fire events. This included visiting the University of Athens, undertaking
experimental work at the University of Coimbra in Portugal, and working on
research methods with the University of Edinburgh and the Missoula Fire lab in the
US. Trent Penman met with US Forest Service research staff in Portland Oregon
May 2016 to develop future collaborations in fire behaviour and impact research.
DOCUMENT TITLE | REPORT NO. 460.2019
26
Impacts
Alex Filkov presented at Research Advisory Forum, 2016 and 2017; AFAC16 and
17, Brisbane 2016, Sydney 2017; XXth Conference on Сonjugate Problems of
Mechanics of Reactive Media, Informatics and Ecology, Tomsk, Russia, 2016;
12th International Symposium on Fire Safety Science, Lund, Sweden, 2017; XXXIII
Siberian Thermophysical Seminar, Novosibirsk, Russia, 2017; Research Driving
Change Showcase 2017, Adelaide 2017.
Project presentation at:
▪ Forest, Fire and Regions, Horsham
▪ ACT Parks and Conservation Service, Canberra
▪ DEWLP, Melbourne
▪ BOM, DEWNR, Adelaide
▪ Department of Parks and Wildlife, Manjimup
▪ UNSW, CSIRO, Canberra
DOCUMENT TITLE | REPORT NO. 460.2019
27
PUBLICATIONS LIST Articles
1. Filkov, A., Prohanov, S., Mueller, E., Kasymov, D., Martynov, P., Houssami,
M.E., Thomas, J., Skowronski, N., Butler, B., Gallagher, M., Clark, K., Mell, W.,
Kremens, R., Hadden, R.M., Simeoni, A. Investigation of firebrand production
during prescribed fires conducted in a pine forest (2017) Proceedings of the
Combustion Institute, 36 (2), pp. 3263-3270. DOI:
10.1016/j.proci.2016.06.125 (Q1, H106, Scimago Journal & Country Rank)
2. Fateev, V., Agafontsev, M, Volkov, S, Filkov, A. Determination of smoldering
time and thermal characteristics of firebrands under laboratory conditions
(2017) Fire Safety Journal 91, DOI: 10.1016/j.firesaf.2017.03.080 (Q1, H58,
Scimago Journal & Country Rank)
3. Mueller, E.V., N. Skowronski, K. Clark, M. Gallagher, R. Kremens, J.C.
Thomas, M. El Houssami, Alexander Filkov et al. Utilization of remote sensing
techniques for the quantification of fire behavior in two pine stands (2017) Fire
Safety Journal 91, doi: 10.1016/j.firesaf.2017.03.076 (Q1, H58, Scimago
Journal & Country Rank)
4. Thomas, Jan C., Eric V. Mueller, Simon Santamaria, Michael Gallagher,
Mohamad El Houssami, Alexander Filkov, Kenneth Clark, et al. Investigation
of firebrand generation from an experimental fire: Development of a reliable
data collection methodology (2017) Fire Safety Journal 91, 864–871, doi:
10.1016/j.firesaf.2017.04.002 (Q1, H58, Scimago Journal & Country Rank)
5. Alexander Filkov, Thomas J. Duff, Trent D. Penman Improving Fire
Behaviour Data Obtained from Wildfires (2018) Forests, 9, 81;
doi:10.3390/f9020081 (Q1, H22, Scimago Journal & Country Rank)
Hazard Note 6. Duff T, Penman T, Filkov A (2016) Threshold conditions for extreme fire
behaviour, Hazard Note, ISSUE 21, OCTOBER 2016 Poster
7. Alex Filkov, Trent Penman, Tom Duff, Kevin Tolhurst (2016)
Determining Threshold Conditions for Extreme Fire Behaviour, AFAC16,
Brisbane
8. Alex Filkov, Trent Penman, Tom Duff (2017) Gaining benefits from
adversity: standardising data obtained from bushfires, AFAC17, Sydney
Submitted
9. An article Alexander Filkov, Thomas J. Duff, Trent D. Penman Frequency
of extreme fire behaviours in forested environments, International Journal
of Wildland Fire
10. A poster "Extreme fire behaviours: Surveying fire management staff to
determine behaviour frequencies and importance", AFAC 2018.
DOCUMENT TITLE | REPORT NO. 460.2019
28
CURRENT TEAM MEMBERS Researchers:
Dr Alexander Filkov, University of Melbourne
Dr Thomas Duff, University of Melbourne
A/Prof Trent Penman, University of Melbourne
Project lead End users:
Dr. Simon Heemstra - Rural Fire Service, NSW
Andrew Stark - Country Fire Service, SA
End users:
Brad Davies, RFS, NSW
Tim Well, VIC CFA
Musa Kilinc, VIC CFA
Matthews Stuart, NSW RFS
Mike Wouters, SA DEWNR
Andrew Sturgess, Qld
Lachie McCaw, WA
Adam Leavesey, ACT
Gran Alan, NT
Mark Chladil, TFS
Laurence McCoy, NSW RFS
Ralph Smith, WA DFES
Jason J. Sharples, UNSW
Jeff Kepert, BOM
DOCUMENT TITLE | REPORT NO. 460.2019
29
REFERENCES Ambrosia VG, Wegener S, Zajkowski T, Sullivan D V., Buechel S, Enomoto F, Lobitz B, Johan S, Brass J, Hinkley E
(2011) The Ikhana unmanned airborne system (UAS) western states fire imaging missions: from concept
to reality (2006–2010). Geocarto International 26, 85–101. doi:10.1080/10106049.2010.539302.
Amiridis V, Giannakaki E, Balis DS, Gerasopoulos E, Pytharoulis I, Zanis P, Kazadzis S, Melas D, Zerefos C (2010)
Smoke injection heights from agricultural burning in Eastern Europe as seen by CALIPSO. Atmospheric
Chemistry and Physics 10, 11567–11576. doi:10.5194/acp-10-11567-2010.
Australasian Fire and Emergency Services Authorities Council (2013) ‘Australasian Inter-service Incident
Management System (AIIMS), 4th edition.’ (Australasian Fire and Emergency Services Authorities Council
Limited)
Banta RM, Olivier LD, Holloway ET, Kropfli RA, Bartram BW, Cupp RE, Post MJ (1992) Smoke-Column Observations
from Two Forest Fires Using Doppler Lidar and Doppler Radar. Journal of Applied Meteorology 31, 1328–
1349. doi:10.1175/1520-0450(1992)031<1328:SCOFTF>2.0.CO;2.
Barrett K, Loboda T, McGuire AD, Genet H, Hoy E, Kasischke E (2016) Static and dynamic controls on fire activity
at moderate spatial and temporal scales in the Alaskan boreal forest. Ecosphere 7,.
doi:10.1002/ecs2.1572.
Billing P (1986) Operational aspects of the infra-red line scanner. (East Melbourne)
http://trove.nla.gov.au/work/18581201.
BNHCRC (2016) NEXT GENERATION FIRE MODELLING. Hazard Note Issue 21.
http://www.bnhcrc.com.au/file/6657/download?token=a3ioWVVO.
Bowman DMJS, Williamson GJ, Abatzoglou JT, Kolden CA, Cochrane MA, Smith AMS (2017) Human exposure
and sensitivity to globally extreme wildfire events. Nature Ecology & Evolution 1, 58. doi:10.1038/s41559-
016-0058.
Bradstock RA, Hammill KA, Collins L, Price O (2010) Effects of weather, fuel and terrain on fire severity in
topographically diverse landscapes of south-eastern Australia. Landscape Ecology 25, 607–619.
doi:10.1007/s10980-009-9443-8.
Briz S, De Castro AJ, Aranda JM, Meléndez J, López F (2003) Reduction of false alarm rate in automatic forest
fire infrared surveillance systems. Remote Sensing of Environment 86, 19–29. doi:10.1016/S0034-
4257(03)00064-6.
Chang Y, Zhu Z, Feng Y, Li Y, Bu R, Hu Y (2016) The spatial variation in forest burn severity in Heilongjiang Province,
China. Natural Hazards 81, 981–1001. doi:10.1007/s11069-015-2116-9.
Chen X, Zhou Z, Li P, Zhou D, Wang J (2014) Effects of sample orientation on pyrolysis and piloted ignition of
wood. Journal of Fire Sciences 32, 483–497. doi:10.1177/0734904114534612.
Chong D, Tolhurst K, Duff T (2012) PHOENIX Rapidfire 4.0’s Convection and Ember Dispersal Model.
Chu T, Guo X, Takeda K (2017) Effects of Burn Severity and Environmental Conditions on Post-Fire Regeneration
in Siberian Larch Forest. Forests 8, 1–27. doi:10.3390/f8030076.
Coban H, Ozdamar S (2014) Mapping forest fire in relation to land-cover and topographic characteristics.
Journal of Environmental Biology 35, 217–224.
http://www.jeb.co.in/journal_issues/201401_jan14/paper_11.pdf.
Cocke AE, Fulé PZ, Crouse JE (2005) Comparison of burn severity assessments using Differenced Normalized
Burn Ratio and ground data. International Journal of Wildland Fire 14, 189. doi:10.1071/WF04010.
Collins L, Bradstock RA, Penman TD (2014) Can precipitation influence landscape controls on wildfire severity?
A case study within temperate eucalypt forests of south-eastern Australia. International Journal of
Wildland Fire 23, 9–20. doi:10.1071/WF12184.
Cruz MG, Alexander ME (2013) Uncertainty associated with model predictions of surface and crown fire rates
of spread. Environmental Modelling and Software 47, 16–28. doi:10.1016/j.envsoft.2013.04.004.
Cruz MG, Alexander ME, Wakimoto RH (2005) Development and testing of models for predicting crown fire rate
of spread in conifer forest stands. Canadian Journal of Forest Research 35, 1626–1639. doi:10.1139/x05-
085.
Cruz MG, Gould JS (2009) National fire behavior prediction system. In ‘Proceedings of the Biennial Conference
of the Institute of Foresters of Australia’, 1–8 http://www.bushfirecrc.com.au/research/downloads/Cruz-
and-Gould-2009-IFA.pdf.
Cruz MG, Sullivan AL, Gould JS, Sims NC, Bannister AJ, Hollis JJ, Hurley RJ (2012) Anatomy of a catastrophic
wildfire: The Black Saturday Kilmore East fire in Victoria, Australia. Forest Ecology and Management 284,
269–285. doi:10.1016/j.foreco.2012.02.035.
Deloitte Access Economics (2014) Scoping Study on a Cost Benefit Analysis of Bushfire Mitigation Australian
Forest Products. 20–55. http://ausfpa.com.au/wp-content/uploads/2016/01/AFPA-DAE-report-
Amended-Final-2014-05-27.pdf.
Dennison PE, Charoensiri K, Roberts DA, Peterson SH, Green RO (2006) Wildfire temperature and land cover
modeling using hyperspectral data. Remote Sensing of Environment 100, 212–222.
doi:10.1016/j.rse.2005.10.007.
Di-Mauro B, Fava F, Busetto L, Crosta GF, Colombo R (2014) Post-fire resilience in the Alpine region estimated
from MODIS satellite multispectral data. International Journal of Applied Earth Observation and
Geoinformation 32, 163–172. doi:10.1016/j.jag.2014.04.010.
Dirksen RJ, Folkert Boersma K, De Laat J, Stammes P, Van Der Werf GR, Martin MV, Kelder HM (2009) An aerosol
boomerang: Rapid around-the-world transport of smoke from the December 2006 Australian forest fires
observed from space. Journal of Geophysical Research Atmospheres 114,. doi:10.1029/2009JD012360.
Fateev V, Agafontsev M, Volkov S, Filkov A (2017) Determination of smoldering time and thermal characteristics
of firebrands under laboratory conditions. Fire Safety Journal In Press,. doi:10.1016/j.firesaf.2017.03.080.
Filkov AI, Duff TJ, Penman TD (2018) Improving fire behaviour data obtained from wildfires. Forests 9,.
DOCUMENT TITLE | REPORT NO. 460.2019
30
doi:10.3390/f9020081.
Filkov A, Prohanov S, Mueller E, Kasymov D, Martynov P, Houssami ME, Thomas J, Skowronski N, Butler B,
Gallagher M, Clark K, Mell W, Kremens R, Hadden RM, Simeoni A (2017) Investigation of firebrand
production during prescribed fires conducted in a pine forest. Proceedings of the Combustion Institute.
doi:10.1016/j.proci.2016.06.125.
Finney M (2004) FARSITE: Fire Area Simulator-model development and evaluation. (Ogden, UT)
doi:http://www.fs.fed.us/rm/pubs/rmrs%5Frp04.html.
Forthofer JM, Goodrick SL (2011) Review of vortices in wildland fire. Journal of Combustion 2011,.
doi:10.1155/2011/984363.
Fox JM, Whitesides GM (2015) Warning signals for eruptive events in spreading fires. Proceedings of the National
Academy of Sciences of the United States of America 112, 2378–2383. doi:10.1073/pnas.1417043112.
Garcia T, Braun J, Bryce R, Tymstra C (2008) Smoothing and bootstrapping the PROMETHEUS fire growth model.
Environmetrics. doi:10.1002/env.907.
Gould J, McCaw W, Cheney N, Ellis P, Knight I, Sullivan A (2008) ‘Project Vesta: Fire in Dry Eucalypt Forest: Fuel
Structure, Fuel Dynamics and Fire Behaviour.’ (CSIRO Publishing)
Haines DA (2004) Downbursts and Wildland Fires: a Dangerous Combination. Fire Management Today 64, 59–
61.
Hally B, Wallace L, Reinke K, Jones S (2016) Assessment of the utility of the Advanced Himawari Imager to detect
active fire over Australia. In ‘International Archives of the Photogrammetry, Remote Sensing and Spatial
Information Sciences - ISPRS Archives’, 65–71 doi:10.5194/isprsarchives-XLI-B8-65-2016.
Holden ZA, Smith AMS, Morgan P, Rollins MG, Gessler PE (2005) Evaluation of novel thermally enhanced spectral
indices for mapping fire perimeters and comparisons with fire atlas data. International Journal of Remote
Sensing 26, 4801–4808. doi:10.1080/01431160500239008.
Holsinger L, Parks SA, Miller C (2016) Weather, fuels, and topography impede wildland fire spread in western US
landscapes. Forest Ecology and Management 380, 59–69. doi:10.1016/j.foreco.2016.08.035.
Hufford GL, Kelley HL, Sparkman W, Moore RK (1998) Use of real-time multisatellite and radar data to support
forest fire management. Weather and Forecasting 13, 592–605. doi:10.1175/1520-
0434(1998)013<0592:UORTMA>2.0.CO;2.
Hughes L, Alexander D (2017) Climate Change and the Victoria Bushfire Threat: Update 2017. Climate Council
report. http://www.climatecouncil.org.au/uploads/98c26db6af45080a32377f3ef4800102.pdf.
International Cloud Atlas (2017) World Meteorological Organization. https://cloudatlas.wmo.int/home.html.
Johnston JM, Wooster MJ, Lynham TJ (2014) Experimental confirmation of the MWIR and LWIR grey body
assumption for vegetation fire flame emissivity. International Journal of Wildland Fire 23, 463–479.
doi:10.1071/WF12197.
Jones MO, Kimball JS, Jones LA (2013) Satellite microwave detection of boreal forest recovery from the extreme
2004 wildfires in Alaska and Canada. Global Change Biology 19, 3111–3122. doi:10.1111/gcb.12288.
Keeley JE (2009) Fire intensity, fire severity and burn severity: A brief review and suggested usage. International
Journal of Wildland Fire 18, 116–126. doi:10.1071/WF07049.
Kepert JD, Fawcett RJB, Tory KJ, Thurston W (2013) Applications of very high resolution atmospheric modelling
for bushfires. InThornton R (ed) ‘AFAC/BCRC Conference’, Melbourne.(Bushfire Cooperative Research
Centre: Melbourne) http://www.bushfirecrc.com/sites/default/files/managed/resource/kepert_jeff.pdf.
Kovalev VA, Petkov A, Wold C, Urbanski S, Min Hao W (2009) Determination of smoke plume and layer heights
using scanning lidar data. Appl Opt 48, 5287–5294. doi:186077 [pii].
Kuznetsov VT, Fil’kov AI (2011) Ignition of various wood species by radiant energy. Combustion, Explosion and
Shock Waves 47,. doi:10.1134/S0010508211010096.
Lareau NP, Clements CB (2016) Environmental controls on pyrocumulus and pyrocumulonimbus initiation and
development. Atmospheric Chemistry and Physics 16, 4005–4022. doi:10.5194/acp-16-4005-2016.
Linke J, Fortin MJ, Courtenay S, Cormier R (2017) High-resolution global maps of 21st-century annual forest loss:
Independent accuracy assessment and application in a temperate forest region of Atlantic Canada.
Remote Sensing of Environment 188, 164–176. doi:10.1016/j.rse.2016.10.040.
Martin J, Hillen T (2016) The Spotting Distribution of Wildfires. Applied Sciences 6, 177. doi:10.3390/app6060177.
Martin WE, Martin IM, Kent B (2009) The role of risk perceptions in the risk mitigation process: The case of wildfire
in high risk communities. Journal of Environmental Management 91, 489–498.
doi:10.1016/j.jenvman.2009.09.007.
Matvienko GG, Afonin SV, Belov VV (2011) ‘Early Detection of Forest Fires from Space.’ (Nova Science Publishers
Inc: New York)
McCarthy N, McGowan H, Guyot A (2016) The Bushfire Convective Plume Experiment: Mobile Radar
Observations of Pyro-Convection from the Mt Bolton Fire, 2016.
file:///C:/Users/afilkov/Downloads/11._the_bushfire_convective_plume_experiment_mobile_radar_obse
rvations_the_mt_bolton_fire.pdf.
Miller C, Hilton J, Sullivan A, Prakash M (2015) SPARK – A Bushfire Spread Prediction Tool. In ‘Environmental
software systems: infrastructures, services and applications’, 262–271
Mueller EV, Skowronski N, Clark K, Gallagher M, Kremens R, Thomas JC, El Houssami M, Filkov A, Hadden RM,
Mell W, Simeoni A (2017) Utilization of remote sensing techniques for the quantification of fire behavior in
two pine stands. Fire Safety Journal 91,. doi:10.1016/j.firesaf.2017.03.076.
Murphy BP, Bradstock RA, Boer MM, Carter J, Cary GJ, Cochrane MA, Fensham RJ, Russell-Smith J, Williamson
GJ, Bowman DMJS (2013) Fire regimes of Australia: A pyrogeographic model system. Journal of
Biogeography 40, 1048–1058. doi:10.1111/jbi.12065.
Van Nest TA, Alexander ME (1999) Systems for rating fire danger and predicting fire behavior used in Canada.
Proceedings of the National Interagency Behavior Workshop 13.
file:///C:/Users/jcronan.000/Documents/UW/JFSP_ASF/ASF_Info_LibraryVanNest_etal_1999_CFFDRS-
DOCUMENT TITLE | REPORT NO. 460.2019
31
1844307713/VanNest_etal_1999_CFFDRS.pdf%5Cnhttp://2397977089062432769clipping.bmp.
NWCG (2017) Glossary of Wildland Fire Terminology. https://www.nwcg.gov/glossary/a-z.
Peace M, Mattner T, Mills G, Kepert J, McCaw L (2016) Coupled fire-atmosphere simulations of the Rocky River
fire using WRF-SFIRE. Journal of Applied Meteorology and Climatology 55, 1151–1168. doi:10.1175/JAMC-
D-15-0157.1.
Peterson DA, Hyer EJ, Campbell JR, D. FM, Hair JW, Butler CF, Fenn MA (2015) The 2013 Rim Fire: Implications for
Predicting Extreme Fire Spread, Pyroconvection, and Smoke Emissions. Bulletin of the American
Meteorological Society 96, 229–247. doi:10.1175/BAMS-D-14-00060.1.
Peterson DA, Hyer EJ, Campbell JR, Solbrig JE, Fromm MD (2017) A Conceptual Model for Development of
Intense Pyrocumulonimbus in Western North America. Monthly Weather Review 145, 2235–2255.
doi:10.1175/MWR-D-16-0232.1.
Picotte JJ, Robertson K (2011) Timing constraints on remote sensing of wildland fire burned area in the
southeastern US. Remote Sensing 3, 1680–1690. doi:10.3390/rs3081680.
Polivka TN, Wang J, Ellison LT, Hyer EJ, Ichoku CM (2016) Improving Nocturnal Fire Detection with the VIIRS Day-
Night Band. IEEE Transactions on Geoscience and Remote Sensing 54, 5503–5519.
doi:10.1109/TGRS.2016.2566665.
Potter BE (2012) Atmospheric interactions with wildland fire behaviour - II. Plume and vortex dynamics.
International Journal of Wildland Fire 21, 802–817. doi:10.1071/WF11129.
Raffuse SM, Craig KJ, Larkin NK, Strand TT, Sullivan DC, Wheeler NJM, Solomon R (2012) An evaluation of
modeled plume injection height with satellite-derived observed plume height. Atmosphere 3, 103–123.
doi:10.3390/atmos3010103.
Rothermel RC (1972) A mathematical model for predicting fire spread in wildland fuels. USDA Forest Service
Research Paper INT USA 40.
doi:http://www.snap.uaf.edu/webshared/JenNorthway/AKFireModelingWorkshop/AKFireModelingWks
hp/FSPro Analysis Guide References/Rothermel 1972 INT-115.pdf.
Rouse JW, Haas RH, Schell JA, Deering DW (1973) Monitoring Vegetation Systems in the Great Okains with ERTS.
Third Earth Resources Technology Satellite-1 Symposium 1, 325–333.
Saraiva E, Soares R V, Batista AC, Tertuliano H, Gomes M (2014) Weather Radar: An Efficient Tool for Forest Fire
Detection. 15th International Conference on Automatic Fire Detection. Aube ’14, university of Duisburg-
Essen, Duisburg, Germany; 10/2014.
Schmidt IT, O’Leary JF, Stow DA, Uyeda KA, Riggan PJ (2016) Use of ultra-high spatial resolution aerial imagery
in the estimation of chaparral wildfire fuel loads. Environmental Monitoring and Assessment 188, 697.
doi:10.1007/s10661-016-5656-x.
Scholes R, Kendall J, Justice C (1996) The quantity of biomass burned in southern Africa. Journal of Geophysical
Research 101, 23667–23676. doi:Doi 10.1029/96jd01623.
Schroeder W, Ellicott E, Ichoku C, Ellison L, Dickinson MB, Ottmar RD, Clements C, Hall D, Ambrosia V, Kremens
R (2014) Integrated active fire retrievals and biomass burning emissions using complementary near-
coincident ground, airborne and spaceborne sensor data. Remote Sensing of Environment 140, 719–730.
doi:10.1016/j.rse.2013.10.010.
Sertel E, Alganci U (2015) Comparison of pixel and object-based classification for burned area mapping using
SPOT-6 images. Geomatics, Natural Hazards and Risk 5705, 1–9. doi:10.1080/19475705.2015.1050608.
Shahbazi M, Théau J, Ménard P (2014) Recent applications of unmanned aerial imagery in natural resource
management. GIScience & Remote Sensing 51, 339–365. doi:10.1080/15481603.2014.926650.
Sharples JJ, Cary GJ, Fox-Hughes P, Mooney S, Evans JP, Fletcher MS, Fromm M, Grierson PF, McRae R, Baker P
(2016) Natural hazards in Australia: extreme bushfire. Climatic Change 139, 85–99. doi:10.1007/s10584-
016-1811-1.
Sharples JJ, McRae RHD, Wilkes SR (2012) Wind-terrain effects on the propagation of wildfires in rugged terrain:
Fire channelling. International Journal of Wildland Fire 21, 282–296. doi:10.1071/WF10055.
Smith AMS, Wooster MJ (2005) Remote classification of head and backfire types from MODIS fire radiative
power and smoke plume observations. International Journal of Wildland Fire 14, 249–254.
doi:10.1071/WF05012.
Tedim F, Leone V, Amraoui M, Bouillon C, Coughlan RM, Delogu MG, Fernandes MP, Ferreira C, McCaffrey S,
McGee KT, Parente J, Paton D, Pereira GM, Ribeiro ML, Viegas XD, Xanthopoulos G (2018) Defining
Extreme Wildfire Events: Difficulties, Challenges, and Impacts. Fire 1,. doi:10.3390/fire1010009.
Thomas JC, Mueller EV, Santamaria S, Gallagher M, El Houssami M, Filkov A, Clark K, Skowronski N, Hadden RM,
Mell W, Simeoni A (2017a) Investigation of firebrand generation from an experimental fire: Development
of a reliable data collection methodology. Fire Safety Journal 91,. doi:10.1016/j.firesaf.2017.04.002.
Thomas JC, Mueller E V., Santamaria S, Gallagher M, El Houssami M, Filkov A, Clark K, Skowronski N, Hadden RM,
Mell W, Simeoni A (2017b) Investigation of firebrand generation from an experimental fire: Development
of a reliable data collection methodology. Fire Safety Journal 91, 864–871.
doi:10.1016/j.firesaf.2017.04.002.
Thurston W, Kepert JD, Tory KJ, Fawcett RJB (2017) The contribution of turbulent plume dynamics to long-range
spotting. International Journal of Wildland Fire 26, 317–330. doi:10.1071/WF16142.
Tolhurst KG, Shields B, Chong DM (2008) Phoenix: Development and Application of a Bushfire Risk Management
Tool. Australian Journal of Emergency Management, The.
Tutsch M, Haider W, Beardmore B, Lertzman K, Cooper AB, Walker RC (2010) Estimating the consequences of
wildfire for wildfire risk assessment, a case study in the southern Gulf Islands, British Columbia, Canada.
Canadian Journal of Forest Research 40, 2104–2114. doi:10.1139/X10-159.
Veraverbeke S, Hook S, Hulley G (2012) An alternative spectral index for rapid fire severity assessments. Remote
Sensing of Environment 123, 72–80. doi:10.1016/j.rse.2012.02.025.
Vermesi I, Roenner N, Pironi P, Hadden RM, Rein G (2016) Pyrolysis and ignition of a polymer by transient
DOCUMENT TITLE | REPORT NO. 460.2019
32
irradiation. Combustion and Flame 163, 31–41. doi:10.1016/j.combustflame.2015.08.006.
Viegas DX (2012) Extreme Fire Behaviour. ‘Forest Management: Technology, Practices and Impact’. (Eds AC
Bonilla Cruz, RE Guzman Correa) pp. 1–56. (Nova Science Publishers, Inc.)
Viegas DX, Ribeiro LM, Viegas MT, Pita LP, Rossa C (2009) Impacts of fire on society: Extreme fire propagation
issues. ‘Earth Observation of Wildland Fires in Mediterranean Ecosystems’. pp. 97–109 doi:10.1007/978-3-
642-01754-4_8.
Viegas DX, Simeoni A (2011) Eruptive Behaviour of Forest Fires. Fire Technology 47, 303–320. doi:10.1007/s10694-
010-0193-6.
Werth PA, Potter BE, Alexander ME, Clements CB, Cruz MG, Finney MA, Forthofer JM, Goodrick SL, Hoffman C,
Jolly WM, McAllister SS, Ottmar RD, Parsons RA (2016) Synthesis of knowledge of extreme fire behavior:
volume 2 for fire behavior specialists, researchers, and meteorologists. Gen Tech Rep PNW-GTR-891 US
Department of Agriculture, Forest Service, Pacific Northwest Research Station 258.
Werth P a., Potter BE, Clements CB, Finney M a., Goodrick SL, Alexander ME, Cruz MG, Forthofer J a., McAllister
SS (2011) Synthesis of knowledge of extreme fire behavior: Volume I for fire management. Gen Tech Rep
PNW-GTR-854 Portland, OR: US Department of Agriculture, Forest Service, Pacific Northwest Research
Station I, 1–144. http://www.cafiresci.org/storage/papers/jfsp_extreme fire behavior guide vol 1.pdf.
Wing MG, Burnett J, Sessions J, Brungardt J, Cordell V, Dobler D, Wilson D (2013) Eyes in the Sky: Remote Sensing
Technology Development Using Small Unmanned Aircraft Systems. Journal of Forestry 111, 1–7.
doi:10.5849/jof.12-117.
Zhai C, Gong J, Zhou X, Peng F, Yang L (2017) Pyrolysis and spontaneous ignition of wood under time-dependent
heat flux. Journal of Analytical and Applied Pyrolysis 125, 100–108. doi:10.1016/j.jaap.2017.04.013.
Zhang Y, Lim S, Sharples JJ (2016) Modelling spatial patterns of wildfire occurrence in South-Eastern Australia.
Geomatics, Natural Hazards and Risk 5705, 1–16. doi:10.1080/19475705.2016.1155501.
Zhou Q, Hill MJ, Sun Q, Schaaf CB (2016) Retrieving understorey dynamics in the Australian tropical savannah
from time series decomposition and linear unmixing of MODIS data. International Journal of Remote
Sensing 37, 1445–1475. doi:10.1080/01431161.2016.1154224.