determining deterioration models using inspection … deterioration models using inspection data in...
TRANSCRIPT

Determining Deterioration Models Using Inspection Data in Florida
2011 Southeast Bridge Preservation Partnership (SEBPP) Meeting
Raleigh, North Carolina
By
John SobanjoFlorida State University
Tallahassee, Florida
April 14, 2011

Acknowledgement
� Paul D. Thompson, Co-PI and consultant on the various research grants; primary developer of the bridge deterioration models.
� Richard Kerr, FDOT State Maintenance Office, project manager on the research grants.
Overview
� Historical perspectives on bridge deterioration models – Nationwide and Florida.
� Progressive research efforts on bridge deterioration at Florida DOT (1998 – 2010).
� Markov-based models based on expert judgment.� Use of element-level condition data to show bridge preservation.
� NBI Translation of element-level condition data.� Recent research efforts: Improved Markov models; action effectiveness models; and hybrid Weibull-Markov deterioration models.

Historical perspectives
� Component-based bridge inspection (NBI ratings) and original FHWA’s linear deterioration models for bridge major components.
� Stochastic models of bridge deterioration.
� Bridge preservation models with deterioration and action improvement predictions.

Historical perspectives
� Element-level bridge inspection started in 1998 in Florida.
� Initial deterioration model in 1998 based on Pontis Default (California) data.
� Markov-based model developed from expert opinion in 2001.
� Project Level Analysis Tools (PLAT) and Network Analysis Tools (NAT) developed in 2004/2006.
� Improved deterioration/action effectiveness models developed in 2010.

Markovian Deterioration Models
� The state of an element can be described at any point in time as a distribution among a number of condition states.
� Assumes that the probability of making a transition from one condition state to another depends only on the initial state, and not on past conditions or any other information about the element.
� Model is expressed as simple matrix of transition probabilities for the element’s environmental class (Benign, Low, Moderate, or Severe).

Markovian Deterioration Models
� Conditions at any future period can be predicted by simple matrix multiplication.

Markovian Deterioration Model:Expert Judgment (2001)
� Transition probabilities estimated based on the median no. of years between transition.
� If it takes T years for 50% of a population of elements to transition from one state to the next, then the probability in a one-year period of staying in the starting condition state can be calculated from:
P = 0.5(1/T)
� For example, if it takes a median of 6 years to transition from state 1 to state 2, then the transition probability of staying in state 1 is 0.89 or 89%. If we assume that all the rest of the element deteriorates to state 2, then the transition probability from state 1 to state 2 is (1-P) = 0.11 or 11%.
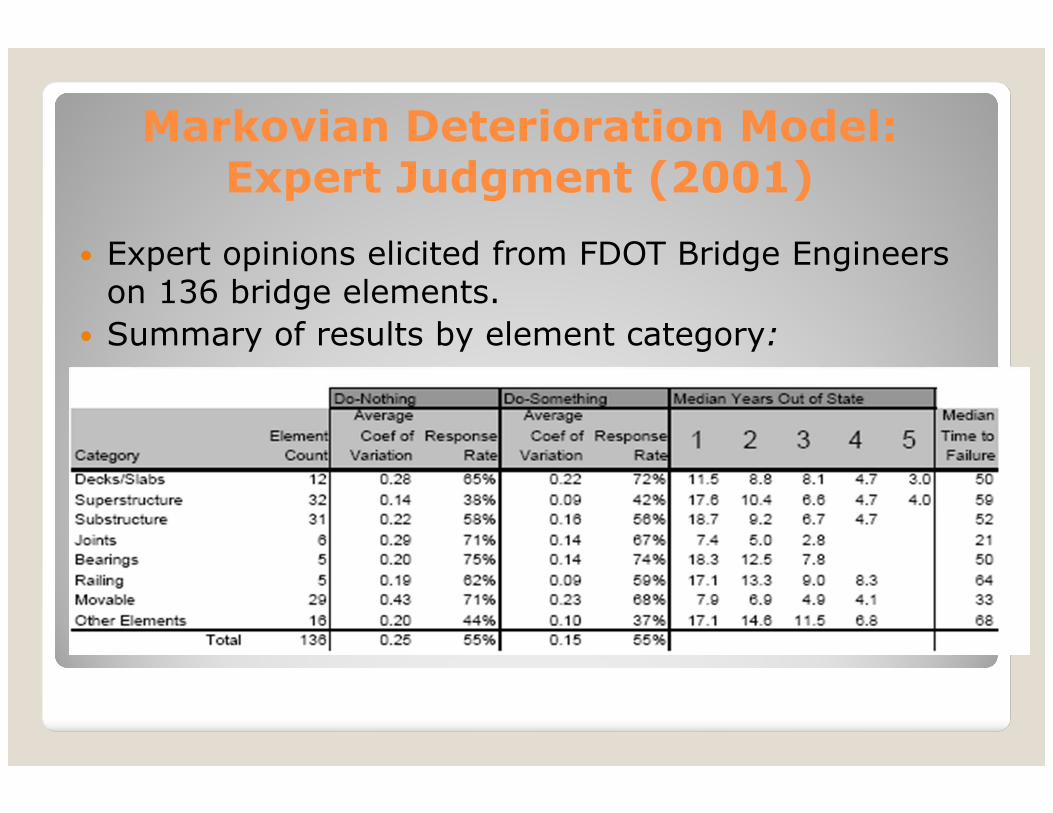
Markovian Deterioration Model:Expert Judgment (2001)
� Expert opinions elicited from FDOT Bridge Engineers on 136 bridge elements.
� Summary of results by element category:
�

Markov-based Deterioration Model:Expert Judgment (2001)
� Expert opinions elicited from FDOT Bridge Engineers on 136 bridge elements.
� Summary of results by material type:
�

Markovian Deterioration Model:Expert Judgment (2001)
� Example transition probability matrices for painted steel in severe environment:
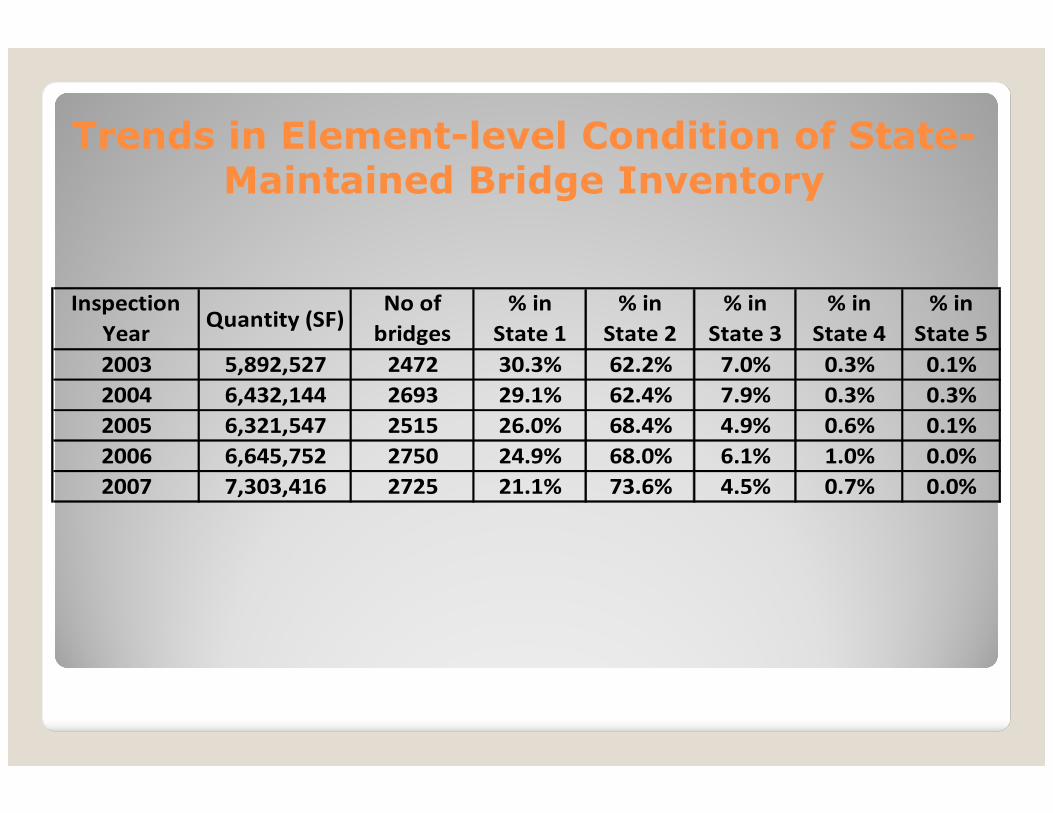
Trends in Element-level Condition of State-Maintained Bridge Inventory
Inspection
YearQuantity (SF)
No of
bridges
% in
State 1
% in
State 2
% in
State 3
% in
State 4
% in
State 5
2003 5,892,527 2472 30.3% 62.2% 7.0% 0.3% 0.1%
2004 6,432,144 2693 29.1% 62.4% 7.9% 0.3% 0.3%
2005 6,321,547 2515 26.0% 68.4% 4.9% 0.6% 0.1%
2006 6,645,752 2750 24.9% 68.0% 6.1% 1.0% 0.0%
2007 7,303,416 2725 21.1% 73.6% 4.5% 0.7% 0.0%

Trends in Element-level Condition of State-Maintained Bridge Inventory

Trends in Element-level Condition of State-Maintained Bridge Inventory

Trends in NBI Condition Ratings of State-Maintained Bridge Inventory

FDOT NBI Translator 2010
This computer spreadsheet program enables the user to translate element-based bridge
inspection data (% in deterioration states) to the FHWA NBI (Condition Rating) format. The
translation is done for each bridge component (deck, superstructure, substructure, or culvert)
separately. Element inspection data from Pontis is stored in the "ElementData2" Worksheet and
the elements' assignment to bridge component is indicated, along with suggested initial weights,
in the "FactorsBridge" Worksheet. The "InputList" Worksheet has a list of specific bridge(s)
(entered by user) and some statistical parameters necessary for optional adjustment or
comparison of the translated ratings.
First the element inspection data is read and separated into bridge component data, with the
element condition indexes and NBI condition ratings also calculated. Starting with the initial user-
assigned relative weights, the elements' quantities are used to estimate the relative weights of
importance for the elements on each bridge components. Next , the weights are used to
aggregate the NBI condition ratings of the respective elements constituting each bridge
component. The smart flags are then used, if indicated in the bridge records, to adjust the
translated ratings. Finally, if the field-inspected NBI ratings are available, the translated ratings
are compared, and also adjusted based on some statistical parameters. The translated ratings
are stored in the "TranslatedRatingDeck" "TranslatedRatingSup" "TranslatedRatingSub" and
"TranslatedRatingCulv" Worksheets.
Improved NBI Translator (2010)
� New Translator Program developed to convert element-based inspection (distribution in condition states) to FHWA NBI Condition Rating.
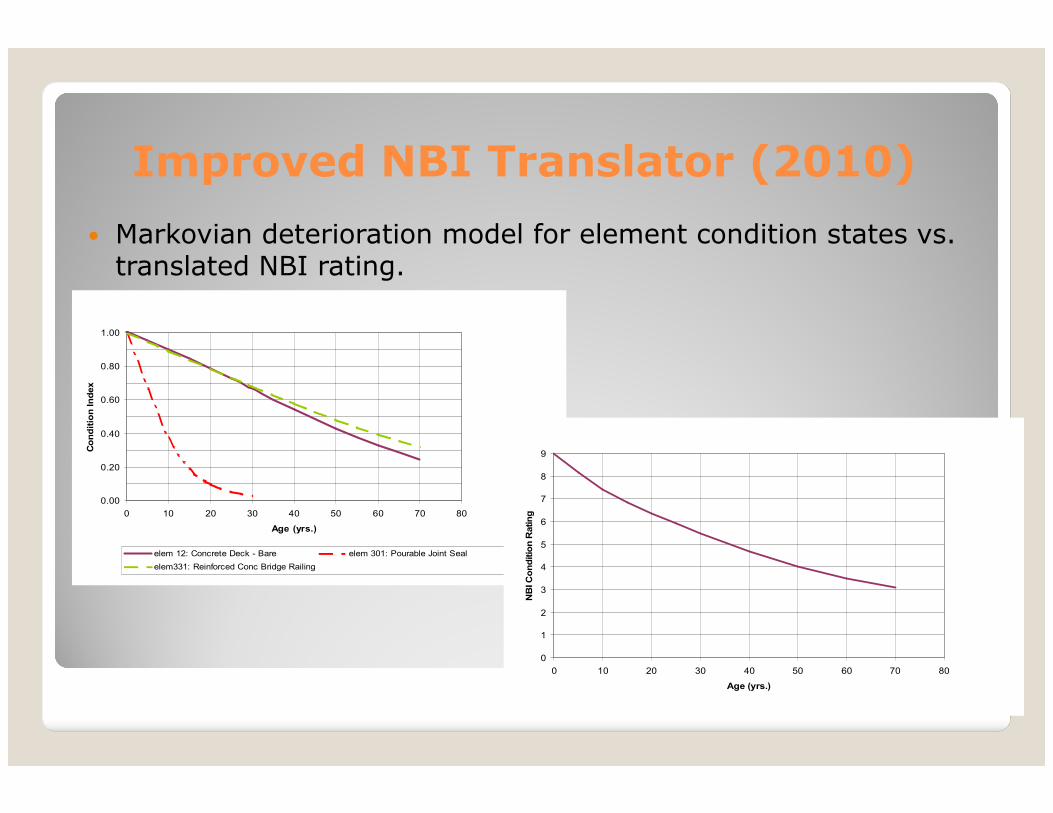
Improved NBI Translator (2010)
� Markovian deterioration model for element condition states vs. translated NBI rating.
0.00
0.20
0.40
0.60
0.80
1.00
0 10 20 30 40 50 60 70 80
Age (yrs.)
Condition Index
elem 12: Concrete Deck - Bare elem 301: Pourable Joint Seal
elem331: Reinforced Conc Bridge Railing
0
1
2
3
4
5
6
7
8
9
0 10 20 30 40 50 60 70 80
Age (yrs.)
NBI Condition Rating

Improved Markovian Deterioration Models (2010)
� Markovian transition probabilities most recently updated in 2010 based entirely on Florida bridge inspection data.
� New simplified procedure developed for estimating one-step transition probabilities using significantly smaller sample sizes than traditional regression.
� New inspection-based models showed deterioration rates far slower than current expert elicitation models.

Improved Markovian Deterioration Models (2010)
� Models estimated from observed changes in element condition between two inspections.

Improved Markovian Deterioration Models (2010)
� Historical bridge activity (from FDOT’s Maintenance Management System (MMS) and its AASHTO Trns•Port database) merged with bridge condition data from Pontis.
� Deterioration models estimated from sets of inspection pairs indicating no preservation activities between the dates.
� Regression-based method used to estimate transition probability matrices from inspection data.

Improved Markovian Deterioration Models (2010)
� Example result from regression-based model.

Improved Markovian Deterioration Models (2010)
� Deterioration model simplified by assuming one-step transition between states.
� New model compared with Markov model based on expert opinions (from 2001) -- state transition times.

Improved Markovian Deterioration Models (2010)
� Markovian models used in Pontis have fairly rapid initial deterioration.
� New method developed to model the onset of deterioration, i.e., the period when a bridge is new, before it starts to exhibit visible defects.
� Weibull survival function used to model the probability of remaining in condition state 1, as a function of age.
� Development of hybrid Markov-Weibull models.

Improved Markovian Deterioration Models (2010)
� Weibull survival function used to model the probability of remaining in condition state 1, as a function of age.
� Weibull function:
� where y1g is the state probability of condition state 1 at age g, if no intervening repair action is taken between year 0 and year g; β is the shaping parameter, which determines the initial slowing effect on deterioration; and α is the scaling parameter.

Improved Markovian Deterioration Models (2010)
� Development of hybrid Markov-Weibull models: weibull survival functions for state 1 and Markov for remaining states. Sample results shown.

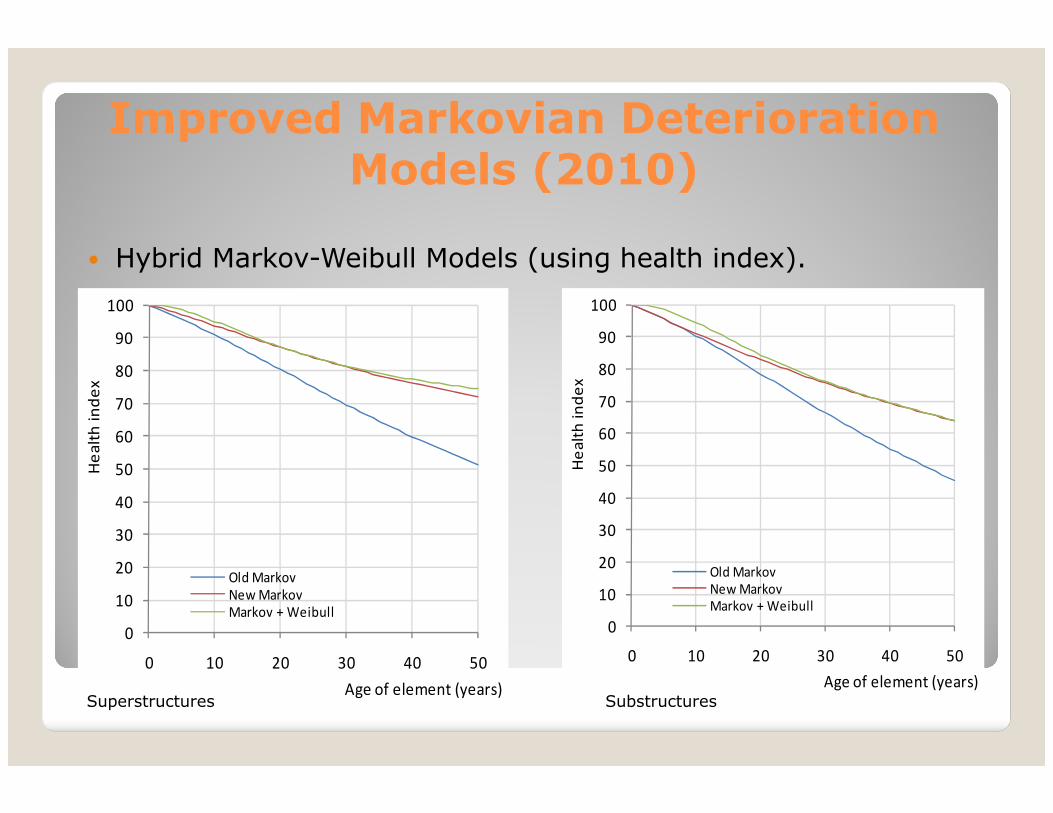
Improved Markovian Deterioration Models (2010)
� Hybrid Markov-Weibull Models (using health index).
�
0
10
20
30
40
50
60
70
80
90
100
0 10 20 30 40 50 60 70 80 90 100
He
alth
ind
ex
Age of element (years)
E1- Elastomeric bearings
F2- Prestressed column/pile/cap
G1- Reinforced concrete culverts
I1- Pile jacket w/o cathodic protection
0
10
20
30
40
50
60
70
80
90
100
0 10 20 30 40 50 60 70 80 90 100
He
alth
ind
ex
Age of element (years)
A1- Concrete deck
B2- Pourable joint seal
C2- Coated metal rail
D7- Reinforced concrete superstructure

Improved Markovian Deterioration Models (2010)
� Hybrid Markov-Weibull Models (using health index).
�
0
10
20
30
40
50
60
70
80
90
100
0 10 20 30 40 50 60 70 80 90 100
He
alth
ind
ex
Age of element (years)
I6- Other (incl asphalt) slope protection
I7- Drainage system
J2- Reinforced concrete wall
K1- Sign structures/hi-mast light poles
0
10
20
30
40
50
60
70
80
90
100
0 10 20 30 40 50 60 70 80 90 100
He
alth
ind
ex
Age of element (years)
L1- Moveable bridge mechanical
L4- Moveable bridge hydraulic power
M1- Moveable bridge electronics
M4- Moveable bridge navigational lights
Improved Markovian Deterioration Models (2010)
� Hybrid Markov-Weibull Models (using health index).
�
0
10
20
30
40
50
60
70
80
90
100
0 10 20 30 40 50
He
alt
h i
nd
ex
Age of element (years)
Old Markov
New Markov
Markov + Weibull0
10
20
30
40
50
60
70
80
90
100
0 10 20 30 40 50
He
alt
h i
nd
ex
Age of element (years)
Old Markov
New Markov
Markov + Weibull
Superstructures Substructures

Improved Markovian Deterioration Models (2010)
� Development of the “do-something” Markovian transition probabilities.


Refined Markov-based Action Effectiveness Model (2010)
� Development of model for the “do-something” transition probabilities.

Conclusions
� Florida DOT has developed one of the first comprehensive bridge deterioration and action effectiveness models based entirely on historical condition state and activity data.
� The models have very strong statistical characteristics due to large sample sizes.
� The historical activity data were difficult to process because of unclear categorization of action types, and imprecise dating.
� Manual categorization and algorithms developed to identify activity completion dates relative to bridge element condition.
Conclusions
� New simplified procedure developed for estimating one-step Markovian models.◦ produces usable results with significantly smaller sample sizes than traditional regression.
◦ enabled the estimation of even relatively uncommon elements.
� New inspection-based models show for most cases, deterioration rates far slower than the expert elicitation models that have been used to-date.
� Further investigation is needed for the deck and culvert models.

Conclusions
� The survival probability concept (Weibull model) was investigated for its usefulness modeling the onset of deterioration; the Weibull parameters appear to make models more realistic.
� New methodology was developed for the estimation of action effectiveness models from historical activity and condition data.
� Actual effectiveness of Florida DOT repair and rehabilitation actions estimated to be greater than those originally estimated by the panel of experts for Florida’s models in 2001.

Acknowledgement
� Paul D. Thompson, Co-PI and consultant on the various research grants; primary developer of the bridge deterioration models.
� Richard Kerr, FDOT State Maintenance Office, project manager on the research grants.

References
� Copies of the final report on the research grants discussed are available for view or download at:
� http://www.dot.state.fl.us/research-center/Completed_Maintenance.shtm

Thank you!!!Any questions