determination of the efficacy of sterile barrier systems
TRANSCRIPT

Determination of the efficacy of sterile
barrier systems against microbial
challenges during transport and storage
Hartmut Dunkelberg and Ulrich Schmelz
Medical Institute of General Hygiene and Environmental Health,
University of Goettingen, Germany
11th World Sterilization Congress and the 7th International
Symposium of Sterilization and Hospital Infection Control,
July 30 – August 01, 2010
Sao Paulo, Brazil

Theoretical probability of a
non-sterile product
≤ 1 : 1,000,000
= Sterility Assurance Level
(SAL) of 10-6 *
*CDC: Guideline for disinfection and sterilization in healthcare facilities, 2008
Sterile: state of being free from all living
microorganisms

Microbial inactivation by steam
sterilization (121°C)
0,000001
0,0001
0,01
1
100
10000
1000000
0 2 4 6 8 10 12 14 16 18 20
Exposure time (min)
Nu
mb
er
of
co
lon
y f
orm
ing
un
its (
cfu
)D121°C-value*
SAL ≤ 10-6
*D-value= decimal reduction time

Sterilization procedures resulting in a
product´s initial sterility
• Steam
• Ethylene oxide
• Formaldehyde steam
• Ionizing radiation
• Hydrogen peroxide gas
plasma

Event-related factors
limit shelf life
Impacts causing visible changes
to the packaging:
- Cuts or breaks on
gaskets,
- Punctures, tears,
- Wetness, water stains,
- Loosened locks and
- Settled dust following
storage on open
shelving.

Broken seals as a result
of multiple handling
Dye penetration
test

Impacts by air flow into the
packaging during transport
and storage challenge the
filtration efficiency:
Transport to different
heights above sea level,
Weather-influenced
atmospheric pressure
changes and
Temperature variations.
Demonstration of gas permeability:
Entering of gaseous bromine into
the packaging
Event-related factors limit shelf life

Example of impact by challenging the
filtration efficiency of the packaging
Air flow induced by cooling the
packaging from 60 to 20 °C:
volume of the baskets: 2,600 cm³
381 cm³ of air entering the
packaging.
Airborne microbial concentration in CSSD: 100 CFU/m³
Microbial challenge of the basket: 0.038 CFU
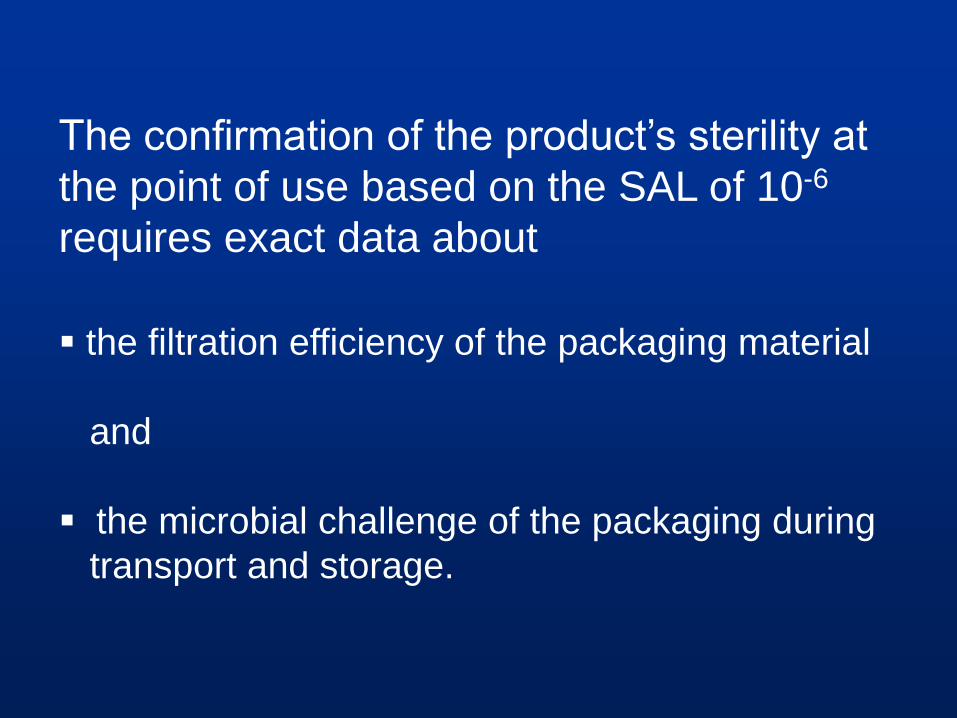
The confirmation of the product’s sterility at
the point of use based on the SAL of 10-6
requires exact data about
the filtration efficiency of the packaging material
and
the microbial challenge of the packaging during
transport and storage.

Nebulizer
Impinger
Time control
module
Vacuum pump
Exposure chamber method

Loading the packaging with nutrient agar

Atmospheric Pressure Changes
-20
0
20
40
60
80
09:4
2:2
1
09:5
3:5
4
10:0
5:2
7
10:1
7:0
0
10:2
8:3
3
10:4
0:0
6
10:5
1:3
9
11:0
3:1
2
11:1
4:4
5
11:2
6:1
8
11:3
7:5
1
11:4
9:2
4
12:0
0:5
7
12:1
2:3
0
12:2
4:0
3
12:3
5:3
6
12:4
7:0
9
12:5
8:4
2
13:1
0:1
5
13:2
1:4
8
13:3
3:2
1
13:4
4:5
4
13:5
6:2
7
14:0
8:0
0
14:1
9:3
3
14:3
1:0
6
Time
hP
a
Humidity
0
20
40
60
80
09
:36
:40
09
:48
:20
10
:00
:00
10
:11
:40
10
:23
:20
10
:35
:00
10
:46
:40
10
:58
:20
11
:10
:00
11
:21
:40
11
:33
:20
11
:45
:00
11
:56
:40
12
:08
:20
12
:20
:00
12
:31
:40
12
:43
:20
12
:55
:00
13
:06
:40
13
:18
:20
13
:30
:00
13
:41
:40
13
:53
:20
14
:05
:00
14
:16
:40
14
:28
:20
Time
%

8
35
80
020
4060
80100
120
2,600 cm³ 5,300 cm³ 7,900 cm³
Packaging volume
nu
mb
er
of
mic
roo
rga
nis
ms
(CF
U)
pe
r p
ac
ka
ge
± Standard error
Microbial barrier efficiency of double wrapped
baskets

Determination of the efficacy of the sterile
barrier systemN0 = Number of bacteria in the air volume passing
the porous packaging material during the test
(= microbial challenge)
N1 = Number of bacteria registered on the plates in the
packaging
Microbial barrier effectiveness in terms
of the Logarithmic Reduction Value
(LRV.):
N0
LRV = Log ----
N1
N1
Filtration efficiency (%) = [1 – ---- ] x 100
N0

4,814,53 4,27
0
1
2
3
4
5
6
2,600 cm³ 5,300 cm³ 7,900 cm³
Packaging volume
LR
V
± Standard error
Filtration efficiency:
99.998 %99.997 %
99.995 %
Logarithmic reduction value (LRV) of double
wrapped baskets

1. Sterility assurance level ≤ 10-6
2. N0 = Microbial challenge during transport and
storage
3. LRV = Microbial barrier efficiency of the packaging
Confirmation of the maintenance of
sterility
Log N0 – LRV ≤ - 6

4,814,53 4,27
0
1
2
3
4
5
6
2,600 cm³ 5,300 cm³ 7,900 cm³
Packaging volume
LR
V
± Standard error
Assessment of maintenance of sterility. Example:
2,600 cm³-basket, cooling from 60 to 20 °C
Air flow : 381 cm³
Microbial challenge (N0) in the
CSSD: 0.038 CFU
Log 0.038 = - 1.42
Sterility is confirmed.
- 1.42 - 4.81 = - 6.23

0,0000010,00001
0,00010,001
0,010,1
110
99,9
9999
99,9
9990
99,9
9900
99,9
9000
99,9
0000
99,0
0000
90,0
0000
0,00
000
Required filtration efficiency (%)
Mic
rob
ial c
ha
lle
ng
e
SAL ≤ 10-6
Relationship between the airborne microbial challenge
and the required filtration efficiency for the assessment
of sterility

Airborne microbial
barrier efficiency is
printed on the
package: LRV or
% Filtration Efficiency
Assessment of maintenance of sterility in the
healthcare setting
… … …

Assessment of
maintenance of
sterility in the
healthcare
setting
Filtration
efficiency in %
www.microbial-evaluation-of-sterile-barrier-systems.com/

0,22
1,52,2
63,951,7
164,8
0,1
1
10
100
1000
0 20 40 60 80
Atmospheric pressure changes (hPa)
Me
an
co
lon
y f
orm
ing
un
its
(CF
U)
pe
r p
ac
ka
ge
Microbial barrier efficiency of flexible
peel pouches

Microbial barrier efficiency of
flexible peel pouches
1,4
1,92,1
1,6
1,2
1,5
0
1
2
3
0 10 20 30 40 50 60 70 80
Atmospheric pressure changes (n=21)
LR
V
Filtration efficiency 99,2 %
Mean filtration efficiency 93,7 %

Microbial barrier efficiency: 16 commercial
porous medical packaging materials:
exposure chamber method*
0
2
4
6
8
Nu
mb
er
of
Sam
ple
s
< 1 % 1 - 10 % >10 %
% Maximal Spore Penetration
103/cm³ airborne bacterial spores; flow rate of 2 cm³ min-1 cm-1
*Data from: Sinclair CS, Tallentire A 2002 PDA J Pharm Sci Tech 56:11-19

Conclusion
• The sterility of the packaging can be confirmed at the SAL at the point of use.
• This requires data on the microbial barrier efficiency and information about the airborne microbial challenge during transport and storage.
• This stability program ensures the safety and the high quality of sterile supplies.
• The described concept of stability testing opens possibilities to optimize the packaging barrier properties by the modification of the design, the volume, and the method of packaging.
References• CDC: Guideline for disinfection and sterilization in healtcare
facilities, 2008; www.cdc.gov/ncidod/dhqp/pdf/guidelines/Disinfection_Nov_2008.pdf
• Food and Drug Administration. Guidance for industry – container and closure system integrity testing in lieu of sterility testing as a component of stability protocol for sterile products. Food and Drug Administration, Rockville, MD, February 2008. Available at: http://www.fda.gov/cber/guidlines.htm. Accessed: June 30, 2008.
• Sinclair CS, Tallentire A. Definition of a correlation between microbiological and physical particulate barrier performance for porous medical packaging materials. PDA J Pharm Sci And Tech 2002;56:11-19

Thank you for your attention!