determination of the concrete chloride diffusion ... papers/paper 37.pdf · comparing the chloride...
TRANSCRIPT

1
Determination of the concrete chloride diffusion coefficient based on an electrochemical test and an optimization model
Juan Lizarazo-Marriagaa, Peter Claisseb
a,b
Departamento de Ingeniería Civil, Universidad Nacional, Bogotá, Colombia. [email protected] b Materials Applied Research Group, Coventry University COV 5FB, UK. [email protected]
Abstract
The chloride diffusion coefficient is an indication of the capacity of any type of concrete to resist chloride penetration and is used to predict the service life of reinforced concrete structures. Its determination has been subject of intense study in the last 50 years and today there is no complete agreement in the methodologies used. In addition, its experimental determination is time and recourse consuming. As alternative, this paper presents a new methodology to find the fundamental properties of concrete including the diffusion coefficients. From the measurement of the electrical properties of concrete during a migration test and using and integrated physical-neural network model the chloride related properties can be found. Results of experiments of normal diffusion were compared with the results of the new methodology and gave encouraging results. Keywords: Concrete, diffusion, chloride migration, neural networks 1. Introduction Corrosion of reinforcing steel is the major cause of deterioration of reinforced concrete structures. Carbon dioxide and especially chlorides are the main causes of corrosion. The chloride diffusion coefficient defines the capacity of any specific concrete to resist chloride penetration and is used to predict the service life of reinforced concrete structures. Usually it is measured experimentally with self (gravity) diffusion or migration tests, but differences can be found in the numerical values of the coefficients depending on the methodology used [1]. Either diffusion or migration tests can be done under steady state or non-steady state conditions. Pure diffusion tests take a long time but migration tests are performed in relatively short time. Salt ponding [2] and Bulk diffusion [3] are examples of non steady state chloride diffusion tests where the apparent diffusion coefficient is determined by fitting profiles of the acid soluble chloride concentration to Fick’s second law of diffusion [4]. Steady state chloride diffusion tests are more time consuming and are calculated using the Fick’s first law of diffusion [5]. They are made in a traditional diffusion cell setup where the upstream compartment is the chloride source and the downstream compartment must be chloride free at the start of the test. The chloride flux is calculated measuring the rate of change of chloride concentration in one of the compartments after the steady state is reached. Migration (otherwise known as electromigration) tests differ from diffusion tests because a constant electrical potential difference is applied across the concrete, so that the calculation of the diffusion coefficient is based on the Nernst-Planck equation [6] rather

2
than on Fick’s law. The Nordtest Method NT 492 [7] is an example of non-steady state migration tests. It was developed by Tang and Nilsson [8] who provided the mathematical theory for calculating the effective diffusion coefficient. The Nordtest Method NT 355 standard [9], and the Japanese JSCE-G571-2003 [10] specify test methods in a steady state condition. For those the flux is calculated according to the measured change of concentration of chlorides when the ions passing through the sample have reached a steady state. The migration coefficient is calculated using the Nernst-Planck or the Nernst-Einstein [11] equations. Regardless of the experimental method used to find the coefficient of diffusion there are some difficulties with each procedure. For example, in addition to the problem of the duration of the tests the determination of chloride concentrations either in solutions or in concrete requires special equipment and the laboratory work is time consuming. Additionally, all the procedures assume no depletion of chlorides in the source reservoirs, a situation which requires the continuous replacement of the solutions or, at least, the monitoring of the concentration, even if large quantities of initial solution are used. In addition, the effect of other ionic species and their interaction with chlorides is neglected. Finally, if the chloride penetration determined with the colorimetric method [12], it is not easy to measure and has a high variability. In order to offer an alternative to the standard methods for calculating the chloride coefficient of diffusion for concrete, this paper presents a new procedure consisting of a new electrochemical test and a computational method. The principal aim of the paper is to present the theoretical basis of a new method. This new method consists of the experimental determination of the electrical current and the electrical membrane potential during a migration test similar to that proposed by ASTM C1202 [13]. The chloride transport related properties are determined with an integrated physical-neural network model. The computational model proposed uses the Nernst-Planck equation and accounts for the interaction of all the species involved by changing the membrane potential voltage in order to avoid any charge surplus inside the concrete sample. In addition, the model uses an artificial neural network to optimize the experimental results to calculate the chloride related properties. The validity of the new methodology was checked by comparing the chloride coefficients obtained from it with the chloride coefficients obtained with a traditional diffusion test. 2. Theoretical aspects of the membrane potential and current during a migration test The Nernst-Planck equation defines the ionic movements in a fully saturated concrete due to the chemical and electrical potential [6].
x
EcD
RT
Fz
x
cDJ ii
ii
ii (1)
where ci is the ionic concentration of species i in the pore fluid; x the distance; zi the
electrical charge of species I; F the Faraday constant; E is the electrical potential; E/dx the electrical field; Ji is the flux of specie i; Di is the diffusion coefficient of species i; R is the gas constant; and T is absolute temperature. In a concrete migration test, in addition to the external electrical field applied there is an internal electrical field produced because of the interactions among all the ions involved in the test (Cl-, OH-, Na+ and K+). As a result, the electrical field contained in the term for the

3
migration flux of equation 1 does not depend only on the constant external electrical potential applied; it is also related with the electrical membrane potential, which is the additional voltage generated due to the requirements of charge neutrality. Different ions have different mobility [14] and diffuse or migrate at different speeds, so an excess of charge builds up this membrane potential in order to compensate the flux of the species and keep the electroneutrality of the system. Equation 2 shows the total electrical field
formed by the external voltage and the membrane potential, where is the external electrical voltage applied and Ep is the membrane potential. A more complex expression
can be found if the Nernst-Planck equation includes a chemical activity coefficient ( ) [15], however, it has been proved that the activity term does not increase the accuracy of the results in a migration concrete test [16, 17].
i
iii
i
i
iip
cDz
x
cDz
F
RT
xx
E
xx
E2
(2)
Xinying Lu [11] stated that if concrete is considered a solid electrolyte, the diffusivity of
charged species i is related to its partial conductivity i, and this relationship is know as the Nernst-Einstein equation. If the partial conductivity and the concentration are know, the diffusion coefficient of a species can be found from equation 3.
ii
i
icFz
RTD
22 (3)
The overall conductivity of concrete ( ) can be related with the partial conductivity of one
specie ( i)
ii t (4)
Where ti is the transference number of species i, which is defined as
i
i
Q
Qt ii
i (5)
Where Qi is the charge contribution of specie i and Q the total charge passed through the sample. The total charge can be expressed as a function of the coefficient of diffusion for specie i (equation 6). Equations 2 and 6 show that the diffusion coefficient is strongly related to the charge (area under the graph of current versus time) and the membrane potential.
iii
i
DcFz
QRTQ
22 (6)
In a chloride mono-ion system, defined as a system where chlorides are isolated of any interaction with other ions, the mathematical solution for the Nernst-Planck equation for a semi-infinite homogeneous medium is [8]:
Dt
aDtxercf
Dt
aDtxercfe
ctxc axs
222),( (7)

4
Where c(x,t) is the concentration of chloride after a time t at a distance x form the surface of the sample, ercf is the complementary error function erf, cs is the steady chloride concentration at the surface, and a is a constant related with the external voltage applied and is defined by equation 8.
RT
zFa (8)
From Faraday’s Law, AFJzi iii , and from equations 1 and 7, the total current for a
chloride mono ion system, can be expressed as equation 9, where A is the area of the cross-section of the sample.
Dt
taDxerfc
ae
tDcAFDi cltD
taDx
cl
sclcl
cl
22
1 4
)( 2
(9)
3. Experiments 3.1. Test Details The tests carried out as part of this research are summarised in the following section. Each test was run twice and the result shown is the average of both results 3.1.2. Current and membrane potential in the ASTM C1202 test The procedure used to measure the electrical current was according to ASTM C1202. In this, a steady external electrical potential of 60 volts D.C was applied to a sample of concrete of 50 mm thick and 100 mm diameter for 6 hours. The anode and cathode were filled with 0.30 N sodium hydroxide and 3.0% sodium chloride solutions respectively. The samples were prepared before the test in conformity with the standard. In addition to the standard test, a salt bridge was added in the middle of the sample to check the voltage distribution. A hole of 4 mm diameter and 6-9 mm deep was drilled at the mid-point. The salt bridge used was a solution of 0.1 M potassium chloride (KCl) in order to avoid any junction potential at the interface of the salt solution and the pore solution. The voltage was measured using a saturated calomel electrode (SCE) relative to the cathode cell. The current through the concrete and the voltage at the mid-point were measured continuously every 10 seconds with a data logger. The membrane potential was calculated by subtracting the value of the voltage measured from the initial value measured at the start of the test. The value of voltage measured at any time in the midpoint position is given in equation 10.
0VVV Ti (10)
V corresponds to the membrane potential, VTi is the voltage measured at time t, and V0 is the voltage at the start of the test. More detail of the experiment can be found in reference [14]. Figure 1 shows the test. The results were analysed using the computer model described in section 4 of this paper.

5
3.1.2. Chloride Diffusion Test The sawn surface of 100 mm diameter and 100 mm high concrete cylinders were placed in contact with a solution of sodium chloride. To prepare the samples, the curved surface of each cylinder was covered with a rubber coating in order to avoid moisture exchange and carbonation during the test. After the samples were coated, the surface that would be in contact with chlorides was in placed contact with a solution of 0.5 g/l of CaOH for one week to avoid any initial sorption effect when the chloride solution was introduced. Figure 2 shows the test. The external concentration of chloride was 7% NaCl and it was renewed every 3 weeks. After 12 weeks of diffusion, the chloride penetration depth was measured using the colorimetric method [18]. Each sample was split axially and sprayed with a solution of 0.1 M silver nitrate. After 15 minutes a white silver chloride precipitation on the split surface was visible and the penetration depth was measured. It was assumed that the free chloride concentration at which the colour changes is around 0.07 N for ordinary Portland cement concrete [7]. The solution of the Nernst-Planck equation presented in equation 7 for the condition of zero external voltage gives equation 11 and corresponds to the solution of Fick’s second law presented by Crank [19].
))4
()((),( 00tD
xerfcccctxc s (11)
Where c0 is the initial concentration of chlorides. In this study it was assumed that at the start of the test the initial concentration of chlorides inside the sample was zero (c0=0) The free chloride concentration, the depth of penetration, the chloride surface concentration (cs), and the time of the diffusion test were known so the diffusion coefficient could be calculated using equation 11, 3.1.3. Open porosity The open porosity accessible by water (P) was measured using the simple method of water displacement. The central part of each cylinder (30 mm thickness) was vacuum saturated until constant weight and weighed in water (Ww) and air (Wa). They were then
dried in an oven at 105 C until constant weight and weighed again (Wd). The porosity was found with equation 12. Three replicates were tested for each mix.
wa
da
WW
WWP
(12)
3.2. Concrete Mixes Samples of type I ordinary Portland cement (OPC) with different water cement ratios were mixed. Table 1 shows the mix designs and the nomenclature used in this study. All the tests were made on samples around 6 months old which were kept in a controlled humidity and temperature room until each test was started. During the mixing, depending on the

6
water content, the mixes had different flow properties. In order to avoid affecting the strength because of the differences in the mix compaction, all the mixes were therefore compacted mechanically with a vibrating table. The moulds were filled with concrete in three layers and compacted to remove the air and reach the maximum density.
4. Computer Model The computational model used two main techniques. An electro-diffusion numerical routine was used for calculating the transient current and the mid-point membrane potential during migration and diffusion tests. This programme uses the physical transport properties as input data and gives as outputs the transient current and the electrical membrane potential. However, as in reality the physical transport properties are unknown, a neural network algorithm was trained to optimize those physical properties. As a result of combining both techniques, the transport properties of a concrete sample could be determined from experimental observations of mid-point membrane potential and current measured simultaneously during a migration test. 4.1. Numerical electro-diffusion model The numerical model used in this research works by repeated application of the Nernst – Planck equation through microscopic time and space steps for various ions simultaneously. The ions considered were potassium found in the initial pore solution of the sample, sodium and hydroxide found in the pore solution and in the external cells, and chloride found in the external cells. The effects of the membrane potential are applied by distorting the voltage in each space step and checked by ensuring that charge neutrality is maintained throughout the sample at all times for all the ions together. At each time step adjustments are made to the voltage to ensure that there is not charge surplus inside the sample. In the model the concentration of ions is defined in two ways: the free ions per unit volume of liquid (Cl) and the total ions per unit volume of solid (Cs). The ratio of those
concentrations is named the binding capacity factor ( ). In the same way, the intrinsic coefficient (Dint) defines the transport of matter when the flux is calculated per unit cross-sectional area of the pores and the concentration in the free liquid. In contrast, the apparent diffusion coefficient (Dapp) defines the transport of any ion when the flux is calculated per unit area of the porous material and the average concentration in the material. The reason why both coefficients are presented is because the computer model calculates the intrinsic coefficient, but the apparent coefficients are normally used to predict the service life of concrete structures. The model can be set under two conditions; first, a migration test with an applied steady
external voltage ( 0) can be modelled under a condition called voltage control in this paper. In this, for any time step, although the current density into any point is equal to the current out of it (Kirchoff’s law), the total current is transient and changes with time (but not with position). The second condition called current control, allows the model to simulate a
self diffusion test under no external field applied ( =0). In this, in addition to the voltage correction necessary to prevent a charge surplus, the programme keeps the total current equal to a pre-set value (zero for this test).
7
As outputs in both conditions the model calculates the transient current caused by each ion, the concentrations, the voltage variation and the membrane potential at all times during the test and in each position [20]. The model was written in visual basic and run as a macro in Microsoft Excel. 4.2. Neural network optimization model To train the network the numerical electro-diffusional model was run many times in order to obtain a database of the input and the corresponding target vectors. During the training the outputs of the model were used as inputs for the neural network and all the data were normalized between -1 and +1 in order to avoid the influence of the scale of the physical quantities. In the same way, a tangential transfer function was limited to be between -1 and +1. The Levenberg-Marquardt training algorithm was used. Figure 3 shows a conceptual diagram of the integrated model The optimization model uses a feed-forward back propagation-network with a multilayer architecture. Six neurons define the input layer, corresponding to values of the current and the mid-point membrane potential at different times. A middle hidden layer has 3 neurons, and the output layer output has 7 neurons corresponding to the intrinsic diffusion coefficients of Cl-, OH-, Na+ and K+, the porosity, the hydroxide composition in the pore solution at the start of the test, and the binding capacity factor for chloride ions. The neural network model was constructed using the neural network tool box of Matlab®. Figure 4 shows the input, the hidden layer and the outputs of the network. 4.3. Integrated numerical- neural network model Obtaining the related transport chloride properties of concrete from measurements of current has been reported recently [21]; however, long durations and steady state conditions are required. In the present research, with the simultaneous measurement of the current and the mid-point membrane potential, it is possible to determine a unique combination of the transport properties by using the trained neural network. In order to simulate the transport properties of concrete and taking into account the complex variables related with the physical phenomenon some assumptions were made: (1) The only ions that interact with the cement matrix products are chlorides and that interaction is defined with a linear binding isotherm. Although has been demonstrated experimentally [22] that non linear isotherms reflects the absorption phenomena better, the model uses an average linear isotherm that represents in a good way the average adsorption of chlorides. (2) The relationship between chloride intrinsic diffusion (Dint-cl) and apparent diffusion
coefficients (Dapp-cl) is defined through the porosity of the material ( ) and the binding
capacity factor ( ). The assumption of a linear isotherm means that is a constant for each ion. It is important to notice again that the apparent diffusion coefficient is the ratio of the flux to the total concentration of chlorides (free and adsorbed) defined per unit volume of the medium. In contrast, the intrinsic diffusion coefficient is the ratio of the flux in the pores to the concentration of free ions in the pore solution per volume of liquid in the pores.

8
Clapp
Cl
D
Dint (13)
(3) At the start of the test the chemical pore solution is composed of ions OH-, K+, and Na+, and, in order to keep electroneutrality, it was assumed that the concentration of hydroxyl ions is equilibrated with a proportion of 33% of sodium and 66% of potassium. This assumption was based on published results [23]. 5. Results and Discussion 5.1. Experimental determination of the transient current, membrane potential and the diffusion coefficients The average current measured for each mix in the migration test is shown in figure 5. As was expected, an increase in the water cement ratio gave an increase in the current passed, and a corresponding increase in the temperature of the sample. The measured
maximum value of temperature in the anode solution was of 63, 44, and 36 C for samples of water cement ratio of 0.6, 0.5 and 0.4 respectively, and the values of charge calculated as the area under the graph of current versus time were 9580, 6863 and 4149 coulombs for samples of water cement ratio of 0.6, 0.5 and 0.4 respectively. The membrane potential measured is shown in figure 6a. For some samples, there was signal noise which may have been caused by the random distribution of aggregate limiting the contact between the salt bridges and the pore volume. This was substantially reduced by slightly increasing the depths of the drilled holes for the salt bridges. The experimental results were filtered with commercial curve fitting software in order to find the best trend of the results and this can be seen in figure 6b. The average membrane potential for each mix is shown in figure 6c, it can be seen that for all mixes the membrane potential showed a rise from its initial value, however, mix OPC-6 showed an initial decrease during the first 2 hours. The chloride diffusion coefficients obtained from the gravity diffusion test and equation 11 were called DFick in this paper and are shown in figure 7. As was expected, an increase in the water cement ratio yielded an increase in the coefficient of diffusion. The values of chloride diffusion coefficient obtained experimentally are in the normal ranges reported in the literature [24], however, the concrete tested can be ranked as high permeability because the diffusion coefficients obtained experimentally were greater than 10-12 m2/s. The high values of the coefficient of diffusion are in accordance with the high values of porosity measured. 5.2. Prediction of chloride related properties The trained neural network was fed with the values for the transient current and the mid point voltage from the migration test and the chloride transport related properties were calculated. As a measure of the reliability of the network, the transport properties obtained were used to run the electro-diffusional model in order to obtain a simulated transient current and mid point membrane potential. The comparison of these curves is shown in figure 8. It can be seen that for the current the simulations are in a very good agreement with the experiments, and for the membrane potential although there are some small differences there is a well defined trend.

9
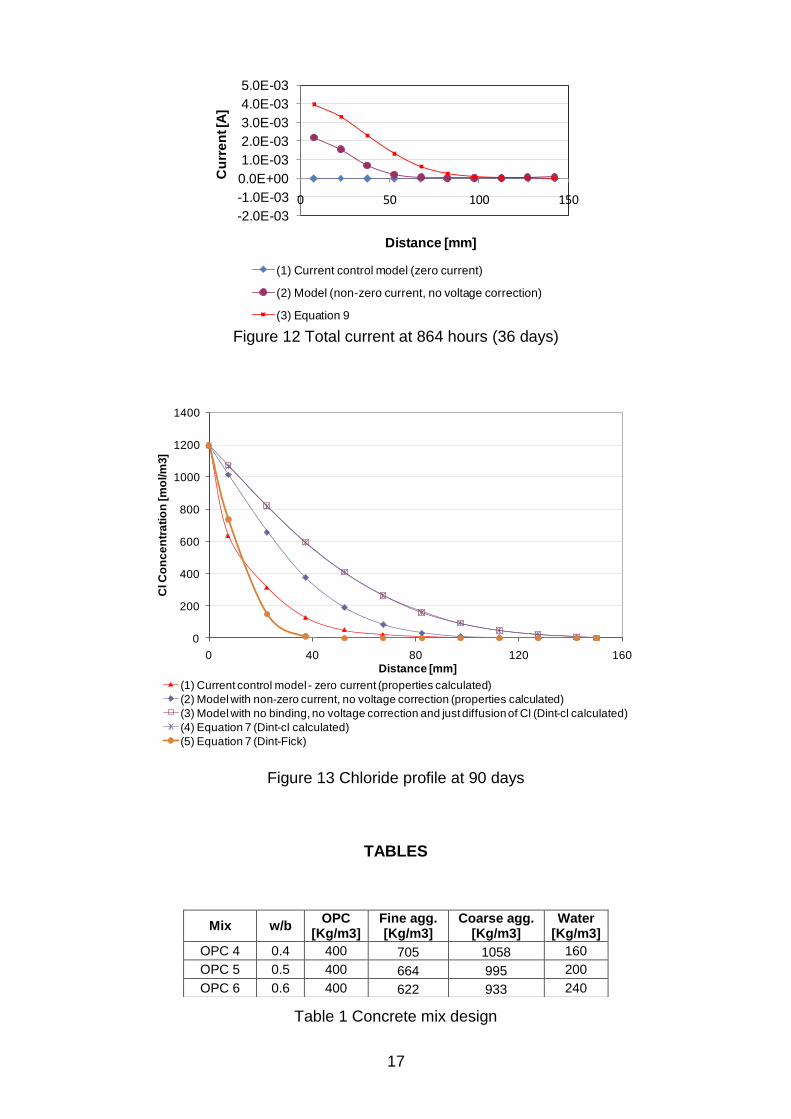
The differences between the measured and simulated membrane potential can be explained by factors related with the accuracy of the measurement device used during the experiment, the heating of the material under an electrical field, or the variability of the test. However, it may be seen that the neural network is able to give a good fit to the profile of the membrane potential given that the number of possible combinations of properties that yield a given current and membrane potential is almost infinite. The calculated transport properties include the porosity, the binding capacity factor and the initial hydroxide composition at the start of the test. As was expected, the porosity increases with an increase of the water binder ratio (figure 9a). In the figure it can be seen that the trend of the measured porosity is similar to that calculated; however some differences arise from errors in either the numerical and experimental methods. The binding capacity factor decreases as the water binder ratio increases, presumably is due to the refining of the hydration compounds enabling them to bind more free chloride ions (figure 9b). The calculated initial chemical content of the pore solution increases with and increase in the water binder ratio. This can be attributed to the higher amount of water, which can keep more alkalis in the pore solution. The calculated intrinsic diffusion coefficients for all the species involved in the simulation (Cl-, OH-, Na+, K+) are shown in figure 10. As was stated by other researchers [6], the anions had a smaller diffusion coefficient than chlorides and hydroxides, except than for mix 6, in which hydroxide and sodium have a similar diffusivity. As was expected, the calculated numerical values of the intrinsic coefficients for all the species are, for all the cases, smaller than the coefficients of diffusion in infinite diluted solutions as can be seen in any electrochemistry textbook. The values obtained are physically possible and are in acceptable ranges. In the same way that the measured chloride diffusion coefficient increases its value with the increase of the water binder ratio, the calculated chloride intrinsic coefficient also increases. The relationship between the chloride coefficients obtained from the diffusion test (using Fick’s law) and the migration test (using the integrated model) is shown in figure 11. The correlation coefficient R2 was 0.99, indicating a strong relationship between the coefficients. The differences arise because of the physical equations used. Both coefficients are related but are defined in a different way. The first was obtained with Fick’s law under conditions of pure diffusion and the second was obtained with the Nernst-Planck equation, including chloride adsorption and interaction among all the species involved. The differences were overcome by using the numerical model as described below. 5.3. Simulation of the current and chloride concentration With the aim of showing the simulation of the current and the chloride concentration for mix 4, the gravity chloride diffusion test was simulated using the computer model. The time selected to show the evolution of the current was 36 days. Figure 12 shows the profile of the current when the phenomenon was simulated using three different approaches. (1) The electro-diffusion current control model with zero current. As was expected, the total current was equal to zero at any point of the sample. The current density generated by each ion was annulled by the current density generated by the remaining ions. When any species diffused through the sample a charge surplus was avoided through the generation

10
of a membrane potential. The authors suggest that this simulation best represents the physical situation in the sample. (2) The electro-diffusion model with no voltage correction. In this, in the solution of the Nernst-Planck equation there is no membrane potential generation. As a result, the Nernst-Planck equation was solved using Fick’s first law for each ion. The total current had a value of 2.1 mA near the surface because at that point the flux of chloride and sodium was high. In the same way, far away from the surface the current decreases. The total current for any point is the result of the sum of the current driven for each ion, according to its charge and diffusion direction. (3) The theoretical equation 9. In this it is supposed that the only species involved are chlorides. The total current profile obtained was similar to the previous condition but the total current near to the surface was 4 mA. The chloride concentration profile at different distaces from the external NaCl solution is shown in figure 13. The time selected to show the evolution of the concentration along the sample was 90 days. As for the current, different aproches were used: (1) the electro-diffusion current control model with zero current using the transport related properties calculated with the model. (2) The electro-diffusion model with no voltage correction using the transport related properties obtained. (3) The model, but with only chlorides present in the system so there was no pore solution or chloride binding. The chloride diffusion coefficient used was the obtained from the neural network. (4) Equation 7, which without an external applied voltage becomes equation 11 (Fick’s law), using the intrinsic chloride diffusion coefficient obtained from the neural network. (5) Fick’s law, but the concentration was obtained using the chloride coefficient of diffusion obtained with the diffusion test DFick. This represents the profile of a function that passes through two points where the concentration was measured experimentally. However, some deviations can be expected because of the variability and uncertainty in the assumption that the change of colour in the colorimetric method is at 0.07 mol/l. Approaches (3) and (4), as was expected, had the same profile; the chloride concentration was the same for both conditions. This provides a check that, for a simplified condition, the computer simulation gave the correct solution. It can be seen from the graph that for methods 3 and 4 that permit development of a net total current (which is not possible in reality because there is no circuit) the chloride concentration is higher. The higher the total current developed, the higher the chloride profile simulated. Method 5 represents the real free chloride concentration (as measured in the diffusion test), and it can be seen that it has a similar trend to the one predicted with the current control model (method 1).
11
6 Conclusions
The experimental-numerical procedure proposed gives viable results for the fundamental properties of concrete. The initial hydroxide composition of the pore solution, the chloride binding capacity, the porosity, and the diffusion coefficients for all the species involved were estimated with good results.
The standard determination of the chloride diffusion coefficients is time and resource consuming, in addition to the uncertainties of the methods and theories used. The neural network methodology proposed is an alternative that can yield to the accurate calculation of the concrete diffusivity with a short and inexpensive test.
The straightforward application of Fick’s law to simulate chloride diffusion in concrete which has been used by many authors in the past can be significantly improved by using a numerical simulation which includes the effects of the other ions in the system.
7. Acknowledgments
The authors would like to thank the support of the Universidad Nacional de Colombia,
COLFUTURO, and the Programme Al an (the European Union programme of High Level Scholarships for Latin America, scholarship No. E06d101124CO). 8. References
1. C.C. Yang, L.C. Wang, Materials Chemistry and Physics 85 (2004) 266.
2. AASHTO, Standard Method of Test for Resistance of Concrete to Chloride Ion Penetration, AASHTO T 259-80. 1997.
3. NTBUILD-443, Concrete Hardened: Accelerated Chloride Penetration. 1995.
4. M. Nokken, A. Boddy, R.D. Hooton, M. Thomas, Cem. Concr. Res. 36 (2006) 200.
5. G.K.Glass, N.R. Buenfeld, Journal of Materials Science, 33 (1998) 5111.
6. C. Andrade, Cem. Concr. Res. 23 (1993) 724.
7. NTBUILD-492, Concrete, mortar and cement-based repair materials: Chloride migration coefficient from non-steady-state migration experiments. 1999.
8. T Luping, L. Nilsson, ACI Materials Journal, 89 (1992) 49.
9. NTBUILD-335, Concrete, mortar and cement-based repair materials: Chloride diffusion coefficient from migration cell experiments. 1997.
10. JSCE-G571, Test method for effective diffusion coefficient of chloride ion in
concrete by migration. Japan Society of Civil Engineers 2003.
11. X. Lu, Cem. Concr. Res. 27 (1997) 293.
12
12. Q. Yuan, C. Shi, F. He, G. Schutter, K. Audenaert, K. Zheng, Cem. Concr. Res. 38 (2008) 1177
13. ASTM-C1202, Standard Test Method for Electrical Indication of Concrete’s Ability
to Resist Chloride Ion Penetration. 2005.
14. J. Lizarazo-Marriaga, P. Claisse, Electrochimica Acta 54 (2008) 2761.
15. O. Truc, PhD thesis, Prediction of Chloride Penetration into Saturated Concrete - Multi - Species - Approach, Chalmers University, Sweden, 2000.
16. E. Samson, J. Marchand, K. Snyder, Materials and Structures 36 (2003) 156.
17. L. Tang, Cem. Concr. Res. 29 (1999) 1469.
18. E. Meck, V. Sirivivatnanon, Cem. Concr. Res. 33 (2003) 1113.
19. Crank, J., The Mathematics of Diffusion, second Edition, Oxford University Press.
1976.
20. P. Claisse, T. W. Beresford, Fourth CANMET/ACI International Conference on Durability of Concrete, Australia, ACI - SP 170 (1997) 1119.
21. C. Yang, S. Chiang, L. Wang, Construction and Building Materials 21 (2007) 1560.
22. A. Delagrave, J. Bigas, J. Ollivier, J. Marchand, M. Pigeon, Advanced Cement Based Materials 5 (1997) 86
23. L. Bertolini (Ed.), B. Elsener (Ed.), P. Pedeferri, R. B. Polder, Corrosion of Steel in Concrete: Prevention, Diagnosis, Repair, Wiley, 2004.
24. Basheer, P.A.M., Permeation Analysis, in Handbook of Analytical Techniques in Concrete Science and Technology, V.S. Ramachandran and J.J. Beaudoin, Editors. 2001, Noyes Publications.

13
Mesh electrodes
D.C. power supply
Concrete sample
Solid acrylic cell
Reservoir - NaOH
Reservoir - NaCl
Coating
KCl solution
Capillary pipe / salt bridge
Reference electrode SCE
Potential differencecathode and sample mid point
Figure 1 Cell and salt bridge [14]
Figure 2 experimental Diffusion test
Figure 3 Conceptual diagram integrated model

14
M.P. Membrane potentialat 3.6 hours
M.P. Membrane potentialat 6 hours
Current at start
M.P. Membrane potentialat 1.2 hours
Current at 3.6 hours
Current at 6 hours
OH pore concentration
Cl diffusion coeficient
OH diffusion coeficient
Na diffusion coeficient
K diffusion coeficient
Capacity factor of Cl binding
Porosity
Input layer Output layer
Figure 4 Multilayer neural architecture used
Figure 5 Current measured experimentally
-3.0
-2.0
-1.0
0.0
1.0
2.0
3.0
4.0
5.0
6.0
7.0
8.0
0 1 2 3 4 5 6
Me
mb
ran
e p
ote
nti
al
[V]
Time [h]
a
OPC 0.4B
OPC 0.4 B
OPC 0.5A
OPC 0.5B
OPC 0.6BOPC 0.6A
-3.0
-1.0
1.0
3.0
5.0
7.0
9.0
0 1 2 3 4 5 6
Me
mb
ran
e p
ote
nti
al
[V]
Time [h]
OPC 0.4
OPC 0.5
OPC 0.6
-3.0
-1.0
1.0
3.0
5.0
7.0
9.0
0 1 2 3 4 5 6
Me
mb
ran
e p
ote
nti
al
[V]
Time [h]
b c
Figure 6 membrane potential measured

15
Figure 7 Chloride coefficients of diffusion - Dint-Fick [m
2/s]
0
200
400
600
800
1000
0 2 4 6
Cu
rren
t [m
Am
p]
Time [h]
OPC 4
Measured
Calculated
-8.0
-6.0
-4.0
-2.0
0.0
2.0
4.0
6.0
8.0
0 2 4 6
Mem
bra
ne p
ote
nti
al
[V]
Time [h]
OPC 4
Measured
Calculated
0
200
400
600
800
1000
0 2 4 6
Cu
rren
t [m
Am
p]
Time [h]
OPC 5
Measured
Calculated
-8.0
-6.0
-4.0
-2.0
0.0
2.0
4.0
6.0
8.0
0 2 4 6
Mem
bra
ne p
ote
nti
al
[V]
Time [h]
OPC 5
Measured
Calculated
0
200
400
600
800
1000
0 2 4 6
Cu
rren
t [m
Am
p]
Time [h]
OPC 6
Measured
Calculated
-8.0
-6.0
-4.0
-2.0
0.0
2.0
4.0
6.0
8.0
0 2 4 6
Mem
bra
ne p
ote
nti
al
[V]
Time [h]
OPC 6
Measured
Calculated
Figure 8 Transient mid point Membrane Potential and current simulated and measured

16
0.170
0.175
0.180
0.185
0.190
0.195
0.200
0.205
0.210
0.30 0.50 0.70
Calc
ula
ted
op
en
po
rosit
y
Water binder ratio
0.200
0.250
0.300
0.350
0.400
0.450
0.500
0.30 0.50 0.70
Bin
din
g c
ap
acit
y f
acto
r
Water binder ratio
a b
Figure 9 Porosity and binding capacity factor calculated
0.00E+00
5.00E-11
1.00E-10
1.50E-10
2.00E-10
2.50E-10
3.00E-10
3.50E-10
OPC 4 OPC 5 OPC 6
Co
eff
icie
nt
of
Dif
fusio
n D
int-
Fic
k [
m2/s
]
Dint-Cl
Dint-OH
Dint-Na
Dint-k
Figure 10 Intrinsic diffusion coefficients calculated
Figure 11 Relationship between the calculated chloride diffusion coefficients
OPC 4
OPC 5
OPC 6
17
-2.0E-03
-1.0E-03
0.0E+00
1.0E-03
2.0E-03
3.0E-03
4.0E-03
5.0E-03
0 50 100 150
Cu
rre
nt [A
]
Distance [mm]
(1) Current control model (zero current)
(2) Model (non-zero current, no voltage correction)
(3) Equation 9
Figure 12 Total current at 864 hours (36 days)
0
200
400
600
800
1000
1200
1400
0 40 80 120 160
Cl C
on
ce
ntr
ati
on
[m
ol/m
3]
Distance [mm]
(1) Current control model - zero current (properties calculated)
(2) Model with non-zero current, no voltage correction (properties calculated)
(3) Model with no binding, no voltage correction and just diffusion of Cl (Dint-cl calculated)
(4) Equation 7 (Dint-cl calculated)
(5) Equation 7 (Dint-Fick)
Figure 13 Chloride profile at 90 days
TABLES
Table 1 Concrete mix design
Mix w/b OPC
[Kg/m3] Fine agg. [Kg/m3]
Coarse agg. [Kg/m3]
Water [Kg/m3]
OPC 4 0.4 400 705 1058 160
OPC 5 0.5 400 664 995 200
OPC 6 0.6 400 622 933 240