determination of preparation conditions for … · determination of preparation conditions for...
TRANSCRIPT

DETERMINATION OF PREPARATION
CONDITIONS FOR MEMBRANE ELECTRODE
ASSEMBLY OF PEM ELECTROLYZER
A Thesis Submitted to
The Graduate School of Engineering and Sciences of
İzmir Institute of Technology
In Partial Fulfillment of the Requirements for the Degree of
MASTER OF SCIENCE
in Energy Engineering
by
Derya DÜZGÖREN
December 2013
İZMİR

We approve the thesis of Derya DÜZGÖREN
Examining Committee Members:
__________________________________
Assoc. Prof. Dr. Erol ŞEKER
Department of Chemical Engineering, Izmir Institute of Technology
__________________________________
Prof. Dr. Gülden GÖKÇEN AKKURT
Department of Mechanical Engineering, Izmir Institute of Technology
__________________________________
Prof. Dr. Sacide ALSOY ALTINKAYA
Department of Chemical Engineering, Izmir Institute of Technology
Prof. Dr. Oğuz BAYRAKTAR
Department of Chemical Engineering, Izmir Institute of Technology
__________________________________
Assoc. Prof. Dr. Figen TOKATLI
Department of Food Engineering, Izmir Institute of Technology
26 December 2013
________________________________
Assoc. Prof. Dr. Erol ŞEKER Prof. Dr. Gülden GÖKÇEN AKKURT
Supervisor, Department of Chemical Co-Supervisor, Department of Mechanical
Enginnering,Izmir Institute of Technology Enginnering, Izmır Instıtute of Technology
_______________________________
Prof. Dr. Gülden GÖKÇEN AKKURT
Head of the Department of Energy
Engineering
Prof. Dr. R. Tuğrul SENGER
Dean of the Graduate School of
Engineering and Sciences

ACKNOWLEGEMENTS
I express my warmest gratitude to my supervisors Dr. Erol ŞEKER and
Dr. Gülden GÖKÇEN AKKURT. Their endless supports and contributions throughout
the course of this thesis encourage me to pull of this work.
I would like to thank Dr. Nejat VEZİROĞLU and Dr. Ayfer VEZİROĞLU for
introducing me to the promising world of hydrogen. Their supports encourage me to
work on hydrogen.
I would like to thank to Dr. Özgenç EBİL for giving permission to use power
supply.
I ought to thank to Burcu ALP and Dr. Filiz ÖZMIHÇI ÖMÜRLÜ for their
understanding and helping for resistivity and water permeability analysis.
I wish to thank to the whole stuff of Department of Chemical Engineering for
their help and technical assistance.
Many friends have helped me to finish this thesis. I express my warmest thanks
to all my friends; Metin UZ, Mert TUNÇER, Emre KILIÇ, Emre DEMİRKAYA,
Vahide Nuran MUTLU, Dildare BAŞALP and especially Gizem PAYER for their
grateful advices, help and sincere friendship.
This journey would not be possible without the support of my family. To my
fiancée İbrahim BİLGİNPERK, thank you for your love and friendship. To my nephew
Efe DÜZGÖREN, thank you dear for make me always smile. I am very grateful to my
parents Mehmet DÜZGÖREN, Semra DÜZGÖREN and my brother Ergün
DÜZGÖREN, who supported me emotionally and financially. I always knew that they
believed in me and wanted the best for me. I hope to have honored them, especially my
mother, she was the biggest supporter of my academic life. Rest in peace my dear mom.

v
ABSTRACT
DETERMINATION OF PREPARATION CONDITIONS FOR
MEMBRANE ELECTRODE ASSEMBLY OF PEM ELECTROLYZER
The aim of this thesis is to investigate the effect of preparation conditions of
Membrane Electrode Assembly (MEA) on the hydrogen production of a single cell
Proton Exchange Membrane (PEM) electrolyzer operated at room temperature and
atmospheric pressure.
In the first part of the thesis, the catalyst ink, without the metal catalysts, coated
membrane (MEA), with the 16 cm2 active area, were produced. For the proton exchange
membrane Nafion-117 membrane was used. An experimental design (Small Central
Composite Design) was done in order to investigate the optimum preparation conditions
(such as temperature, pressure and holding time in the hot press) for MEA of PEM
electrolyzer. The responses were water vapor permeability and the surface resistance of
the catalyst ink coating. The optimum conditions that gave maximum permeability and
lowest surface resistance were found at 135°C of the hot press temperature, 5000 pound
of pressure and 3 minute of holding time.
In the second part, Membrane Electrode Assembly containing Pt and Pt/Ru
metals in the catalyst ink was produced using the optimum conditions found in the first
part. Then the prepared MEA was compared with the commercial MEA containing Pt
and Pt/Ru metals using our home made single PEM electrolyzer.
vi
ÖZET
PEM ELEKTROLİZÖRÜNÜN MEMBRAN ELEKTROT AKSAMININ
HAZIRLANMA ŞARTLARININ BELİRLENMESİ
Bu çalışmanın amacı tek hücreli PEM elektolizörünün oda sıcaklığında ve
atmosfer basıncında membran elektrot aksamının hazırlanma koşullarının hidrojen
üretimi üzerindeki etkisinin incelenmesidir. Bu tez iki kısımda incelenmiştir.
İlk aşamada, 16 cm2 lik aktif alana sahip katalizör içermeyen katalizör
mürekkeple kaplanan membran elektrot aksamı hazırlandı. Nafion-117 elektrolizör
membran kullanıldı. İdeal koşulların (sıcaklık, basınç ve sıcak hidrolik preste kalma
süresi ) belirlenmesi için deneysel tasarım yapıldı. Deneysel tasarım sonucunda yapılan
MEA’lar su buharı geçirgenliği ve elektriksel dirençlerine göre incelendi. En ideal koşul
135°C, 5000 pound, 3 dakika olarak bulundu.
İkinci aşamada, katalizör ilaveli membrane elektrot aksamı, ideal koşullarda
hazırlandı. Hazırlanan MEA pem elektrolizöründe kullanıldı. En son olarak hazır MEA
ile hazırlanan MEA karşılaştırıldı.

vii
dedicated to
my mother; Semra DÜZGÖREN

viii
TABLE OF CONTENTS
LIST OF FIGURES .......................................................................................................... IX
LIST OF TABLES ............................................................................................................ XI
CHAPTER 1. INTRODUCTION………………………………………..…………..........1
CHAPTER 2. LITERATURE SURVEY ........................................................................ ….4
2.1. Hydrogen Production Methods ................................................................. 4
2.1.1. Steam Methane Reforming ................................................................... 4
2.1.2. Coal Gasification .................................................................................. 5
2.1.3. Partial Oxidation of Hydrocarbons ....................................................... 5
2.1.4. Biomass Gasification ............................................................................ 5
2.1.5. Thermo Chemical ................................................................................. 5
2.2. Water Electrolysis ...................................................................................... 6
2.2.1. Proton Exchange Membrane (PEM) Electrolyzer ................................ 8
2.2.1.1. Proton Exchange Membrane of an Electrolyzer Cell……..…..….9
2.2.1.1. Membrane Electrode Assembly and Preparation conditions of
MEA…………………………………………………………….10
CHAPTER 3. MATERIAL AND METHODS ......................................................... 12
3.1. Materials and Equipment ........................................................................... 12
3.2. Methods ...................................................................................................... 13
3.2.1. Carbon Ball milling .............................................................................. 13
3.2.2. Membrane Treatment ........................................................................... 14
3.2.3. Catalyst Loading ................................................................................... 15
3.2.4. Catalyst Ink Preparation ....................................................................... 15
3.2.5. Catalyst Reduction ................................................................................ 15
3.2.6. Membrane Electrode Assembly (MEA) preparation and Analyses ..... 16

ix
3.3.7. Single Cell PEM Electrolyzer Setup .................................................... 17
3.3. Characterization Studies ...................................................................... …. 18
3.3.1. Scanning Electron Microscope with Energy Dispersive X-Ray(EDX)18
3.3.2. X-Ray Diffraction (XRD) ..................................................................... 19
3.3.3. Water Vapor Permeability .................................................................... 19
3.3.4. Resistance…………………………………………………… ….….19
CHAPTER 4. RESULTS AND DISCUSSION………………………………………...20
4.1. Fabrication of Membrane Electrode Assembly…………………….....20
4.1.1 Catalyst ink preparation .................................................................... 20
4.1.2. Membrane Coating ........................................................................... 21
4.1.3 Hot press ............................................................................................ 22
4.2. Characterization of the MEA .................................................................. 23
4.2.1. Water Vapor Permeability ............................................................... 23
4.2.2 Resistance test ................................................................................... 24
4.3 Analysis of the Experimental Design Results .......................................... 24
4.3.1. Water Permeability Analysis ............................................................. 28
4.3.2. Resistance -ResponseAnalysis .......................................................... 33
4.3.3. Validation Analysis ........................................................................... 39
4.4. Cost Analysis .......................................................................................... 39
4.5 Single Cell PEM Electrolyzer .................................................................. 40
4.5.1 Catalyst Reduction .............................................................................. 40
4.5.2. Characterization of MEA .................................................................. 42
4.5.2.1. SEM images of the MEA…………………………..……..……44
4.5.2.2. EDX results………………………………………………….....44
4.5.2.3. XRD results………………………………………………….…45
CHAPTER 5. CONCLUSION .......................................................................................... 46
REFERENCES…………………………………………………………………….….…48

x
APPENDIX A. RAW DATA FOR EXPERIMENTAL DESIGN…………………….50

xi
LIST OF FIGURES
Figure Page
Figure 1.1. World Energy Consumption ........................................................................... 1
Figure 2.1. Schematic representation of PEM electrolysis cell ........................................ 9
Figure 2.2. Molecular formula of Nafion ....................................................................... 10
Figure 3.1. SEM image of activated carbon after ball milling ....................................... 14
Figure 3.2. Nafion membrane treatment procedure ........................................................ 15
Figure 3.3. Coating Equipment (rubber gasket) ............................................................. 16
Figure 3.4. Single Cell PEM Electrolyzer Experimental Setup ...................................... 18
Figure 4.1. Effects of PTFE percentage on to a physical appearance (a) PTFE % is
5%,(b) PTFE %is 30% and (c) PTFE % is 52% .......................................... 21
Figure 4.2. Effect of initial state of the membrane on the MEA physical
appearance (a) without water treatment (dry membrane) (b) with water
treatment (wet membrane) ........................................................................... 22
Figure 4.3. Effect of initial temperature of the hot press (a) high temperature (b)
room temperature ......................................................................................... 22
Figure 4.4. Correlation graphs of water permeability via (a) temperature (b)
pressure (c) time ........................................................................................... 26
Figure 4.5. Correlation graphs of resistance via (a) temperature (b) pressure (c) time 27
Figure 4.6. Analysis of variance for water permeability ................................................ 29
Figure 4.7. (a) normal plot of residuals (b) predicted and actual values graph for
water permeability ....................................................................................... 30
Figure 4.8. The affect of the one factor graph for the water permeabilty (a)
influence of temperature (b) influence of pressure (c) influence of time .... 31
Figure 4.9. Interaction and 3-D surface graphs ............................................................. 33
Figure 4.10. Cube plot of water permeability ................................................................. 34
Figure 4.11. Analysis of variance for resistance ............................................................. 35
Figure 4.12. (a) normal plot of residuals (b) predicted and actual values graph for
resistance ...................................................................................................... 36
Figure 4.13. The affect of the one factor graph for the resistance (a) influence of
temperature (b) influence of pressure (c) influence of time ........................ 37
Figure 4.14. Interaction and 3-D surface graphs ........................................................... 38

xii
Figure 4.15. Cube plot of resistance ............................................................................... 39
Figure 4.16. Voltage and current graphs of the MEA .................................................... 42
Figure 4.17. Voltage via hydrogen flow rate graph ........................................................ 43
Figure 4.18. Picture of (a) commercial MEA (b) prepeared MEA ................................. 43
Figure 4.19. SEM image of the anode and cathode side of the MEA ............................ 43
Figure 4.20. EDX results of anode and cathode side of the MEA .................................. 44
Figure 4.21. XRD patterns of the MEA .......................................................................... 46
Figure F.1. Relative Humidity versusTime graphs……………….……………………50
xiii
LIST OF TABLES
Table Page
Table 2.1. Types of Electrolyzers ..................................................................................... 6
Table 3.1. Properties of Materials used in membrane electrode assembly ..................... 12
Table 3.2. Properties of Materials used in Electrolysis Cell ........................................... 13
Table 3.3. Experimental design factors and levels ......................................................... 16
Table 3.4. Experimental Design ..................................................................................... 17
Table 4.1. Water permeability coefficients ..................................................................... 23
Table 4.2. Resistance test results .................................................................................... 24
Table 4.3. Central composite design matrix with experimental values for
resistivity and water permeability .................................................................. 25
Table 4.4. Correlation Coefficients ................................................................................. 28
Table 4.5. Design Expert optimization output for maximum water permeability and
minimum resistance………………………….................................................39
Table 4.6. Validation Results……………………………………………………….…..40
Table 4.7. Cost Analysis………..……………………………..………………………..41

1
CHAPTER 1
INTRODUCTION
Today, energy is the most important concern for developed and developing
countries. Energy consumption of the world is increasing day by day due the rapid
growth of world population and industrialization. For instane, world primary energy
consumption grew by 1.8% in 2012. Energy demand in the world is supplied by
different energy sources. Energy sources could be categorized into two main group
renewable and nonrenewable energy sources. Currently, the most of the consumed
energy has been supplied by fossil sources, such as coal and petroleum (Figure 1.1)
(BP-WSR 2013).However, it is estimated that these resources will finish within 100
years. In 1956, Huppert A. King proposed a theory showing that the fossil fuel would
eventually come to an end in future due to the energy demand increase and, limited
reserves of the fossil fuels. Accordingly to diminishing of the fossil fuel reserves will be
reflected on the fuel prices (King 1956). Furthermore, the use of the fossil fuel causes
environmental pollutions. Since the fossil fuels contain carbon and other chemicals. In
the processes using fossil fuels, CO2 is released into the atmosphere; in turn CO2 causes
global warming. As a result of increased usage of the fossil fuels, the global warming
increases (Bockris et al. 1991).
Figure 1.1. World Energy Consumption
(Source: BP 2013)
Nuclear 4.9%
Hydroelectric
6.4%
Other Renewable
1.6%
Petroleum
33.1%
Natural Gas 23.7%
Coal 30.3%

2
To meet the growing energy demand, alternative energy production processes,
such as nuclear reactors, thermonuclear reactors, solar energy, wind energy, ocean
thermal energy and new energy sources such as geothermal energy, have been
investigated in recent years. Unfortunately, the alternative processes have
disadvantages, such as nuclear wastes, unpredictable nature of the solar and wind
energy, too (BP 2013).
This has led to the increased research studies to novel energy conversion
systems using “a green fuel” in such as a way that this type of energy systems and the
green fuel, should be economical, clean and inexhaustible. Indeed these features could
be achieved by using hydrogen as a green fuel and hydrogen energy conversion
systems.
Hydrogen is the first element in the periodic table and it is the lightest element
in the world. Although hydrogen is the most abundant element in the universe it is hard
to find freely available in Nature. So, hydrogen needs to be produced using other
sources. In fact, hydrogen is not the energy source but it is an energy carrier. Besides,
hydrogen is the only fuel that is clean and renewable. Hydrogen energy has both
advantages and disadvantages, too. Harmful emissions, NOx and SOx to the atmosphere
are eliminated using hydrogen and hydrogen can be transported safely in the pipelines.
For hydrogen and its conversion systems to be economically viable alternative to the
fossil fuels and their conversion systems, the existing fuel infrastructure and the internal
combustion engines must be used in the same way as using natural gas. Unfortunately,
the current fuel infrastructure and the fuel storage tanks are not suitable for hydrogen
although the internal combustion engines could be modified to directly use hydrogen
has wide range of usage. In addition, although hydrogen has notorious reputation, it is
much safer than the fossil fuels because it dissipates rapidly in air when it is accidently
released; hence this reduces the explosion risk (Bockris, Veziroğlu 1991, Crabtree
2010).
Hydrogen is produced by many methods; for example; steam methane
reforming, coal gasification, the partial oxidation of hydrocarbons, biomass gasification,
biomass pyrolysis, thermochemical, photochemical and electrolysis (Veziroğlu 1991).
Steam methane reforming is the most common way to produce hydrogen in the
industry. However, this is not clean way to produce hydrogen since methane is fossil
fuel and carbon dioxide is released to the atmosphere during this process(Nieva 2014).
Similarly, coal gasification causes air and soil pollutions. These kinds of hydrogen

3
production methods are not a clean way to produce hydrogen since they could release
CO2 and other compounds, such as NOx and SOx to the atmosphere. However, the clean
ways to produce hydrogen are with the usage of renewable sources, such as solar and
wind energy, and the water electrolysis (Shi 2013).
Electrolyzer dissociates water into hydrogen and oxygen gasses by passing an
electric current through the water. There are two types of the electrolyzer, alkaline and
acid water electrolyzers Proton exchange membrane electrolyzer is a solid acid
membrane electrolyzer.
This thesis was the continuation of the previous project carried out in our group.
Briefly, Can AKSAKAL manufactured a single and also five cell PEM electrolyzers
using a commercial Membrane Electrode Assembly (MEA). Then, the electrolyzers,
powered by using solar panels, were tested under varying atmospheric conditions to
study hydrogen and oxygen production efficiency of the electrolyzers. So, in this thesis,
membrane electrode assembly (MEA), having similar metal catalyst content as that of
the commercial MEA, was prepared. Since the preparation conditions of MEA is known
to have direct impact on the performance of the electrolyzer, the effect of preparation
conditions of MEA on hydrogen production and V-I characteristics of a single cell
Proton Exchange Membrane (PEM) was systematically investigated using an
experimental design approach.
The thesis contains five chapters. Following with this introduction, in Chapter 2,
a literature review on hydrogen production methods and PEM electrolyzers are given in
details. In Chapter 3, the specifications of the materials and methods that were used in
this thesis are explained. Chapter 4 gives water permeability and resistivity test results
and experimental design analysis. The characterization result of the prepared MEA was
also explained in this chapter. Finally, in Chapter 5 the conclusions are given with the
research recommendations.

4
CHAPTER 2
LITERATURE SURVEY
2.1. Hydrogen Production Methods
Hydrogen is the most abundant element in the universe but it is not freely
available Nature. Hence, hydrogen must be produced steam methane reforming, coal
gasification, the partial oxidation of hydrocarbons, biomass gasification, biomass
pyrolysis, thermochemical, photochemical and electrolysis.
2.1.1. Steam Methane Reforming
Steam methane reforming for the production of hydrogen is the most
effective, the most economical method and also has the widest range of treatment. The
method is mainly composed of three steps; synthesis (syn-gas) production, water-gas
shift and the gas purification. (Nieva et al. 2014)
CH4 + H2O→ CO + 3H2 (2.1)
CO + H2O → CO2 + H2 (2.2)
CO + 3H2 → CH4 + H2O (2.3)
As seen from the reactions, CO2 emission occurs in this method. This is the
problem for fossil fuel depended hydrogen production (Bockris 1991).

5
2.1.2. Coal Gasification
Coal gasification also called Koppers Totzek process, has a common usage
instead of being economical and efficient way of hydrogen production. The process uses
pulverized coal and partly oxidizes the pulverized coal by oxygen. Unfortunately, it is
not the clean way of producing hydrogen (Monterroso et al. 2014).
2.1.3. Partial Oxidation of Hydrocarbons
Hydrocarbon converted into hydrogen and carbon monoxide (syn-gas). This
procedure is less complex, more compact and effective cost. Reactions of this procedure
is given below (Wang et al. 2012) and (Bockris et al. 1991).
CnHm + n/2 O2 → n CO + m/2 H2 + ısı (2.4)
CnHm + n H2O + ısı → n CO + (n + m/2) H2 (2.5)
CO + H2O → CO2 + H2 + ısı (2.6)
2.1.4. Biomass Gasification
Biomass gasification procedure has three step; gasification to produce syn-gas,
syngas conversion into hydrogen and finally the purification (Crabtree 2010). When
biological waste material is used as a feedstock, this process becomes a completely
renewable and sustainable method of hydrogen generation.
2.1.5. Thermo Chemical
When water is heated above 2500ºC, it separates into oxygen and hydrogen in
thermo chemical process. But there is a problem because in that temperature hydrogen
and oxygen can be converted into water again. The efficiency of the hydrogen
production process is 30%.

6
2.2. Water Electrolysis
Electrolyzer dissociates water into hydrogen and oxygen gasses by passing an
electrical current through the water. Electrolysis is not a renewable method because it
depends on the source of the electricity used in the electrolysis. If electricity can be
provided by any renewable energy source such as, geothermal, solar, wind energy
sources, the electrolysis generates renewable hydrogen and oxygen.
In electrolysis ionic reactions occur. Current is applied between to the anode and
cathode electrodes. Electrodes attract which are of the opposite charge. Anode electrode
is electron donating electrode while cathode electrode is electron accepting electrode.
There are two main types electrolyzer alkaline and acid water electrolyzers.
Among acid electrolyzers, proton exchange membrane (PEM) electrolyzer being the
solid acid membranes is mostly preferred due to ease of handling and safety. Types of
electrolyzers are shown in Table 2.1.
Table 2.1. Types of Electrolyzers
Anode
material
Cathode
material
Separation
media
Electrolyte Working
temperature
Conventional
alkaline
Electrolyzer
Nickel Steel or
nickel
Asbestos 25-35%
KOH
50-60°C
Advanced
Alkaline
Electrolyzer
Activated
nickel
Activated
nickel
Polymer
reinforced
asbestos
25-35%
KOH
80-100°C
Solid oxide
electrolyzer
Platinum
spots
Nickel or
zirconium
- Solid
ceramic
electrolyte
800-1000°C
PEM
electrolyzer
Pt coating Pt, Ir, Ru
coating
Proton
exchange
membrane
Separation
media acts as
an solid
electrolyte
70-90°C

7
Alkaline electrolyzers are the most commonly used electrolyzers in the industry.
By using alkaline electrolyzer 99% purity hydrogen can be obtained, but only with
usage of another purification unit. This because of high electrolyte vapor alkaline
electrolyzer suffers from corrosion .mostly, 25-30 weight percent KOH solution isused
as an electrolyte. The efficiency of hydrogen production reaches up to ~80%. Alkaline
electrolyzer is the most effective on low current densities; i.e.ca. 0.3 Amp/cm2. On the
other hand, the lifetime of the electrolyzer is short and is not durable at high
temperatures due to highly corrosive electrolyte (Barbir 2005).
Proton exchange membrane is much suitable for producing hydrogen. PEM
electrolyzer is easy to use because it can operate with a wide range of current densities.
Different kinds of electricity source can be used. PEM electrolyzers are the same
devices as PEM fuel cells being operates in reverse. However, the catalyst type and
coatings on the membrane surfaces that both sides use are different from each other.
Also, the optimum operation conditions are significantly different. PEM electrolyzer
produces high purity hydrogen and oxygen (~99.999%) among the other electrolyzer
types (Grigoriev et al. 2006). There is no need of another purification step in producing
hydrogen in PEM fuel cells. This is an important property for some applications like
submarines and space shuttles. In addition, PEM electrolyzer can operate at high
pressures up to 300 bars. Furthermore, PEM electrolyzer can operate in a wide range of
temperatures, pressures and current densities. It is possible to integrate PEM
electrolyzer with renewable energy sources.
On the other hand, the cost of the PEM electrolyzer is the most important
problem. The high cost of membrane, electrocataylsts (Pt, Ir) and the high cost of
constructional materials can reduce the usage in a wide range of area (Grigoriev,
Porembsky et al. 2006). Besides, the operation of PEM electrolyzer depends on the
electricity .For reducing the operating cost of the electrolyzer cheaper energy source for
the electricity must be found. In literature there are many works on reducing the
electricity cost by using renewable energy sources. Theoretical electricity equivalent of
1kg hydrogen is about 40 kWh (Grigoriev et al.2006). Another way of reducing the
electricity usage is to increase efficiency of electrolyzers by improving the membrane
electrode assembly material.

8
2.2.1. Proton Exchange Membrane (PEM) Electrolyzer
Basically water is a reactant and products are hydrogen and oxygen. PEM
electrolyzer consists of membrane electrode assembly (MEA) which is composite
material containing solid electrolyte coated with catalysts on each side (it is the medium
where the electrolysis reaction occurs), gas diffusion layer and electric current
collectors.
The reaction medium is the surfaces of the MEA of the electrolyzer. The
electrolyte of PEM is a solid perfluorinated membrane (Nafion membrane) which is the
electrically nonconductive and also physical barrier to both hydrogen and oxygen gases
but protons pass through the membrane. Both sides of the membrane is coated with
noble metals. In anode side, the membrane is coated with Pt and in cathode side it is
coated with Ru and Pt. The overall reaction is shown below
H2O →H2 +1/2 O2 (2.7)
The mechanism of the electrolysis reaction has two parts; anode reaction and
cathode reaction under the applied potential across the MEA. Anode side reaction is the
decomposition of the water shown below.
H2O →2 H+
+1/2 O2 +2e- (2.8)
After water dissociate into the oxygen, protons and electrons, protons go through
PEM electrolyte to the cathode side while the electrons comes from an external power
supply to complete the electrical circuit. Cathode side reaction is shown below.
2H+
+2e- → H2 (2.9)
Schematic representation of the parts of a single cell is given in Figure 2.1.

9
Figure 2.1. Schematic representation of PEM electrolysis cell
2.2.1.1. Proton Exchange Membrane of an Electrolyzer Cell
Proton exchange membrane of an electrolyzer cell is a proton conductive
material. It is a polymer based membrane which is called Nafion (perfluorinated
membrane). PEM is used for both fuel cell and electrolyzer but its properties are
different from each other.
Without water PEM is poor proton conductor. Some amount of water must be
kept during PEM electrolysis otherwise the performance of the cell decreases.
Nafion membranes have good film formation, high proton conductivity in water,
low electrical conductivity, effective reactant/product separator and mechanical
durability at high temperatures (80-140ºC).Another property that affects the
conductivity is the thickness of the membrane; in fact, the increased thickness decreases
hydration.
10
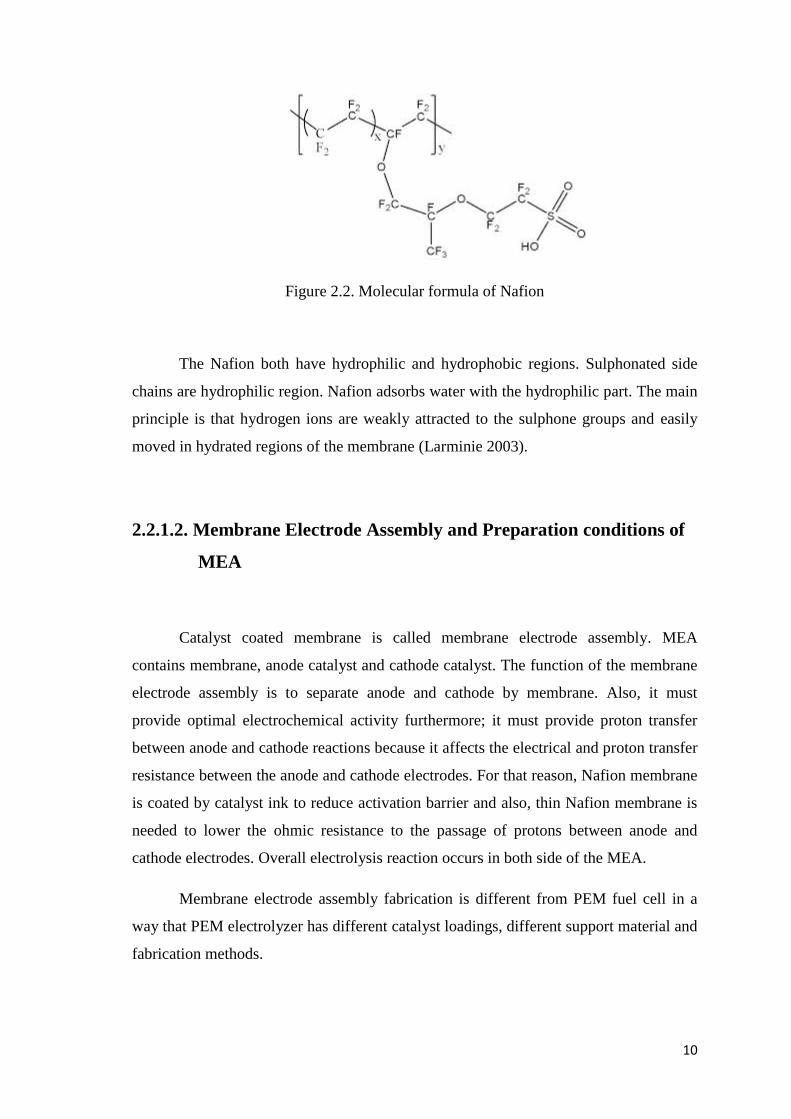
Figure 2.2. Molecular formula of Nafion
The Nafion both have hydrophilic and hydrophobic regions. Sulphonated side
chains are hydrophilic region. Nafion adsorbs water with the hydrophilic part. The main
principle is that hydrogen ions are weakly attracted to the sulphone groups and easily
moved in hydrated regions of the membrane (Larminie 2003).
2.2.1.2. Membrane Electrode Assembly and Preparation conditions of
MEA
Catalyst coated membrane is called membrane electrode assembly. MEA
contains membrane, anode catalyst and cathode catalyst. The function of the membrane
electrode assembly is to separate anode and cathode by membrane. Also, it must
provide optimal electrochemical activity furthermore; it must provide proton transfer
between anode and cathode reactions because it affects the electrical and proton transfer
resistance between the anode and cathode electrodes. For that reason, Nafion membrane
is coated by catalyst ink to reduce activation barrier and also, thin Nafion membrane is
needed to lower the ohmic resistance to the passage of protons between anode and
cathode electrodes. Overall electrolysis reaction occurs in both side of the MEA.
Membrane electrode assembly fabrication is different from PEM fuel cell in a
way that PEM electrolyzer has different catalyst loadings, different support material and
fabrication methods.

11
There are two different ways for electrode fabrication used in PEM electrolyzer.
First method is the separate electrode method which catalyst ink is fixed to a porous and
conductive material, such as carbon cloth or carbon paper (Larminie 2003). The
electrodes are then fixed to each side of the membrane by hot press (Thangamuthu
2005). The second method is to build electrodes directly onto the membrane these
fabrication approaches are used to achieve a good conduction of the catalyst surface
with the PEM which increases the effectiveness of the cell per unit mass of the
catalyst(Ioroi et al. 2002).
Membrane Electrode Assembly preparation conditions varies in the literature.
There is no systematic investigation about the preparation conditions for MEA used in
PEM electrolyzer. For example, Prasana et al. investigated the effect of MEA
fabrication method on durability of PEM fuel cell. They used hot press conditions
140°C, 2000 kg/cm2 pressure for 1.5 min (Prasana et al.). In another literature study, the
optimization and modeling of electrode structure and composition was investigated for
novel PEM electrolyzer. Zavieh, prepared MEA at 130ºC and 2MPa of pressure for 1
min (Zavieh). Besides, in order to investigate the effect of ionomer content, the
preparation conditions were 130ºC and 100 MPa of pressure for 3 min for MEA (Xu et
al.). Song et al. investigated the electrocatalysts for the oxygen evolution reaction. They
produced the MEA at 140°C and 10 MPa. So, in this study , MEA was prepared using
an experimental design method to systematically investigate the effect of the
preparation parameters, such as temperature, pressure and holding time of the hot press,
on the hydrogen evolution and V-I characteristics of the PEM electrolyzer.

12
CHAPTER 3
MATERIAL AND METHODS
Catalyst coated membrane electrode assembly was prepared. The preparation
conditions, such as temperature, pressure and hot press holding time used in hydraulic
press, were varied using the experimental design in order to find optimum water
permeability and surface resistance for MEA. Then, the MEA, having optimum water
permeability and conductivity, were used in the single cell electrolyzer to compare its
hydrogen production to that of commercial MEA.
3.1. Materials and Equipment
All the chemicals, such as hydrogen peroxide (Sigma, H2O2, 50%) and sulfuric
acid (Fluka, H2SO4, 95-98 %), were analytical grade and used without further
purification throughout this study.
The specifications of the materials used in the preparation of the membrane
electrode assembly are given in Table 3.1.
Table 3.1. Properties of Materials used in membrane electrode assembly
Materials Specifications
Nafion membrane N-117 membrane (Ion power) size 70*70 mm
Activated carbon Carbon powder, activated, ash 4% max (Alfa Aesar)
Nafion ion so lution Perfluorosulfonic acid-PTFE copolymer 5% w/w solution ( Alfa
Aesar )
Iso-propanol Merck
Water Deionized water
Membrane electrode
assembly
Catalyst coated N-117 membrane (Ion Power) (70*70)mm total
area
Platinum Alfa Aesar
Iridium Alfa Aesar

13
In this study, the single cell PEM electrolyzer prepared by Can Z. Aksakal was
used. Materials and their specifications used to prepare the electrolyzer cell are given in
Table 3.2. Regulated DC power supply GP1305TP of EZ electronics, was used to
supply the required electrical energy for the electrolysis cell
Table 3.2. Properties of Materials used in Electrolysis Cell
Materials Specifications
Gas diffusion layer (GDL) 1 micron Pt coated 1.5 mm Titanium screen
(45x45)mm
Bipolar Plate Carbone Lorraine 1940PT graphite Layer
Gaskets Temperature resistant 1 mm thick silicon gaskets
Endplates 8mm thick stainless steel plates (70x70)mm
Compression Bolts 5mm diameter 8 steel bolts covered with plastic
insulators
Electric Conduction Plates 1mm thick TSE 554 copper plates
3.2. Methods
The experiments in this study can be categorized into 5 groups.
Carbon ball milling.
Membrane treatment.
Catalyst ink preparation.
Manufacture of catalyst coated membrane electrode assembly.
Investigation of the water permeable and conductivity of the prepared MEA.
The MEA prepared with the optimum conditions was used in single cell
electrolyzer to test its hydrogen production and V-I characteristics.
3.2.1. Carbon Ball milling
Active carbon particle size was not small enough to prevent from precipitating
out of the catalyst ink solution. Also, it is known that carbon particle size affects the
conductivity of the MEA; in fact the smallest particle gives the most conductive
membrane. That’s why small particle size of activated carbon was needed. Therefore,
14
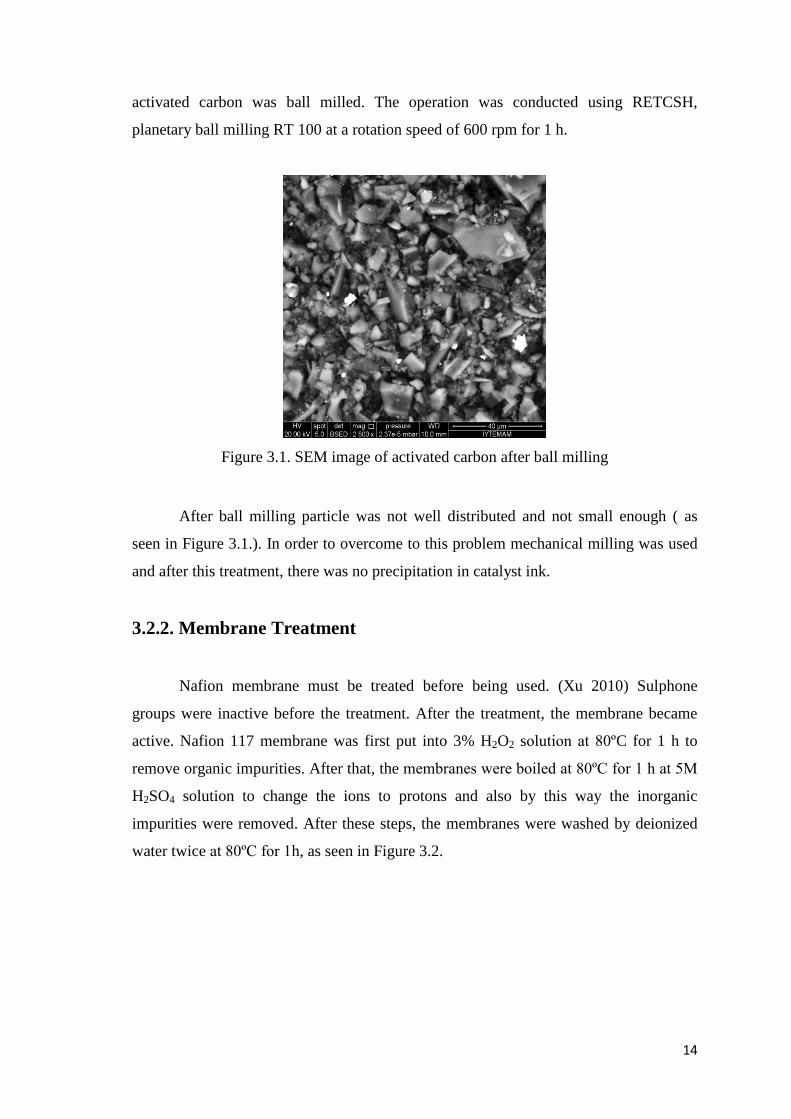
activated carbon was ball milled. The operation was conducted using RETCSH,
planetary ball milling RT 100 at a rotation speed of 600 rpm for 1 h.
Figure 3.1. SEM image of activated carbon after ball milling
After ball milling particle was not well distributed and not small enough ( as
seen in Figure 3.1.). In order to overcome to this problem mechanical milling was used
and after this treatment, there was no precipitation in catalyst ink.
3.2.2. Membrane Treatment
Nafion membrane must be treated before being used. (Xu 2010) Sulphone
groups were inactive before the treatment. After the treatment, the membrane became
active. Nafion 117 membrane was first put into 3% H2O2 solution at 80ºC for 1 h to
remove organic impurities. After that, the membranes were boiled at 80ºC for 1 h at 5M
H2SO4 solution to change the ions to protons and also by this way the inorganic
impurities were removed. After these steps, the membranes were washed by deionized
water twice at 80ºC for 1h, as seen in Figure 3.2.

15
Figure 3.2. Nafion membrane treatment procedure
3.2.3. Catalyst Loading
First, the catalyst ink solution was prepared without Pt or Ru to find out the
optimum conductivity and water permeability. Then, the membrane prepared with the
optimum conditions was loaded with Pt and Ru to obtain MEA.
In the second part of the thesis membrane electrode assembly was prepared with
the catalyst loading. For PEM electrolyzer Pt for anode side and Pt/Ru for cathode side
in preparing MEA was used as the metal catalysts. For both anode and cathode sides, 1
mg/cm2 metal were added. Catalyst was loaded to active carbon using impregnation
method and the metal precursor. Briefly, in the impregnation Metal precursor solution
having the necessary amount of metal was added to active carbon while being mixed
and then put take the oven at 60°C for an hour.
3.2.4. Catalyst Ink Preparation
Catalyst ink was prepared for coating the membrane. For anode and cathode
0.15g of ground active carbon, 0.5ml of water, 0.5ml of isopropanol and 0.17g Nafion
of the ion solution were mixed. Prepared ink was ultrasonicated for half an hour.
3.2.5. Catalyst Reduction
A catalyst metal precursor needs to be reduced to obtain metal catalysts on the
active carbon. So, NaBH4 was used for reduction of the metal precursors. The procedure
of the reduction was. Catalyst loaded active carbon was treated with 0.5M NaBH4 for 2
Nafion 117
H2O2
solution
H2SO4
solution
Deionized
water
Deionized
water

16
hours at room temperature. After that the powder washed with deionized water at 60-
70°C until no Cl ion detected in washed water. After the washing, the powder was dried
at 110°C for 4.
3.2.6. Membrane Electrode Assembly (MEA) preparation and
Analyses
The treated membrane was coated with the catalyst ink by using a paint brush. In
order to prevent the formation of deformation, such as surface wrinkles, of the
membrane during coating, wet membrane was used. The wet membrane was
compressed using the rubber gasket (as shown in Figure 3.3.) .The catalyst ink was
applied to membrane using the paint brush while membrane was kept wet. Then, the
prepared nafion membrane was dried at room temperature.
Figure 3.3. Coating Equipment (rubber gasket)
Hot press was used after this step. Hot press conditions changed during the
preparation are; temperature, pressure and holding time. Experimental design (Small
Central Composite Design) was constructed using the design expert 7software. In the
design were water vapor permeability and the surface resistance were the responses
while the temperature, pressure and the holding time were the design factors with 3
levels as seen in Table 3.3.
Table 3.3. Experimental design factors and levels
Factors/Levels Low level Central High level
Temperature (ºC ) 110 122.5 135
Pressure (pound) 5000 10000 15000
Time (minute) 3 6.5 10

17
Central composite design was used with 3 levels and 3 factors. Experimental
design gave 15 experiments. In the design, there were 4 fact points, 5 central points and
6 axial points. Planned design was given in Table 3.4.
Table 3.4. Experimental Design
Std.order Run order Pt type blocks temperature pressure time
8 1 1 1 122.5 15000 6.5
12 2 0 1 122.5 10000 6.5
7 3 1 1 122.5 5000 6.5
2 4 0 1 135 5000 10.0
11 5 1 1 122.5 10000 6.5
15 6 1 1 122.5 10000 6.5
13 7 1 1 122.5 10000 6.5
14 8 1 1 122.5 10000 6.5
10 9 0 1 122.5 10000 10.0
9 10 0 1 122.5 10000 3.0
6 11 1 1 135 10000 6.5
4 12 1 1 110 5000 3.0
5 13 0 2 110 10000 6.5
3 14 -1 2 110 15000 10.0
1 15 -1 2 135 15000 3.0
3.3.7. Single Cell PEM Electrolyzer Setup
After optimum conditions were obtained using small central composite design,
the MEA wasprepared with the optimum conditions, i.e.135°C , 5000 pound of press
pressureand 3 min of holding time to be tested in the single cell PEM Electrolyzer at
room temperature and atmospheric pressure. In Figure 3.4. single cell PEM Electrolyzer
experimental setup isshown.
After the assembly of the cell, the deionized water was fed to the water inlet
using peristaltic pump. To make sure that water filled up the inside of cell,filling
process was continued until water came out from oxygen output side. The oxygen

18
output was connected to the inlet water reservoir to recirculate the water back to the
inlet . Hydrogen output was connected to a gas liquid seperator to seperate the water
and hydrogen.Positive terminal of the power supply was connected to the anode side
and its, negative terminal was connected to the cathode side to apply the electricity to
the cell.
Figure 3.4. Single Cell PEM Electrolyzer Experimental Setup
3.3. Characterization Studies
3.3.1. Scanning Electron Microscope with Energy Dispersive X-Ray
(EDX)
Scanning Electron Microscope (Quanta 250FEG) was used to determine the
surface elemental analysis and also the structure of the active carbon on the MEA
surface using back scattering detectors.
19
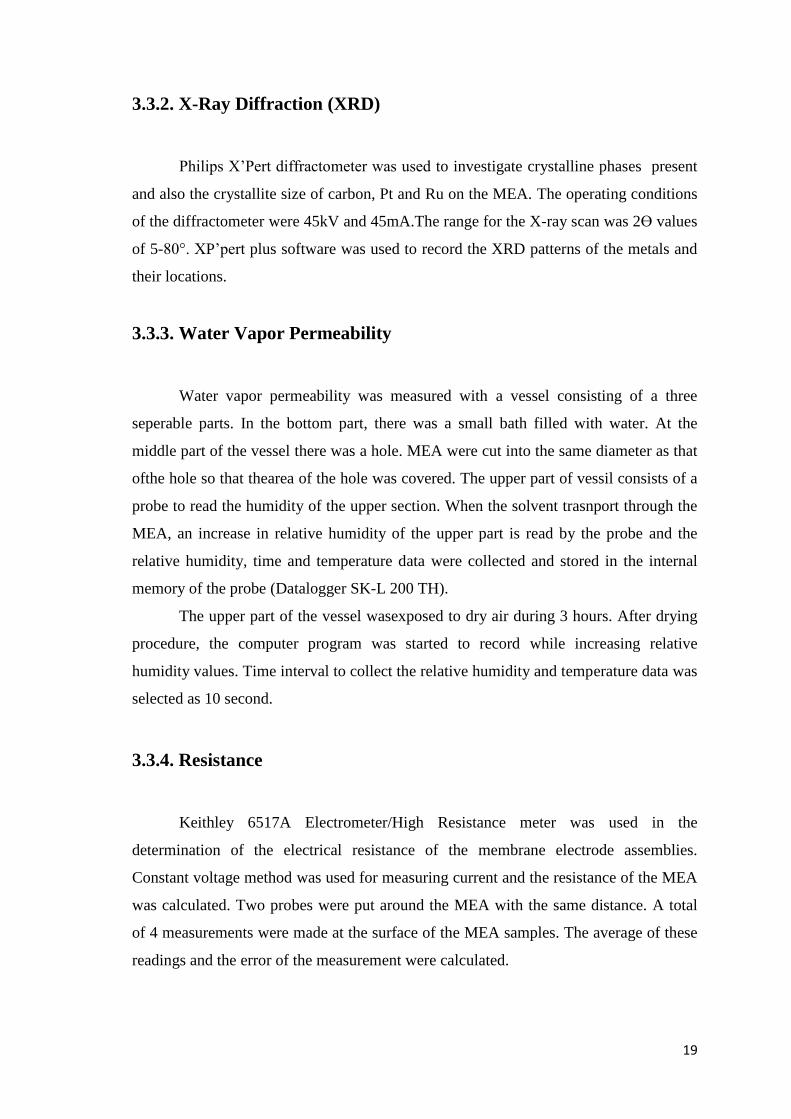
3.3.2. X-Ray Diffraction (XRD)
Philips X’Pert diffractometer was used to investigate crystalline phases present
and also the crystallite size of carbon, Pt and Ru on the MEA. The operating conditions
of the diffractometer were 45kV and 45mA.The range for the X-ray scan was 2Ө values
of 5-80°. XP’pert plus software was used to record the XRD patterns of the metals and
their locations.
3.3.3. Water Vapor Permeability
Water vapor permeability was measured with a vessel consisting of a three
seperable parts. In the bottom part, there was a small bath filled with water. At the
middle part of the vessel there was a hole. MEA were cut into the same diameter as that
ofthe hole so that thearea of the hole was covered. The upper part of vessil consists of a
probe to read the humidity of the upper section. When the solvent trasnport through the
MEA, an increase in relative humidity of the upper part is read by the probe and the
relative humidity, time and temperature data were collected and stored in the internal
memory of the probe (Datalogger SK-L 200 TH).
The upper part of the vessel wasexposed to dry air during 3 hours. After drying
procedure, the computer program was started to record while increasing relative
humidity values. Time interval to collect the relative humidity and temperature data was
selected as 10 second.
3.3.4. Resistance
Keithley 6517A Electrometer/High Resistance meter was used in the
determination of the electrical resistance of the membrane electrode assemblies.
Constant voltage method was used for measuring current and the resistance of the MEA
was calculated. Two probes were put around the MEA with the same distance. A total
of 4 measurements were made at the surface of the MEA samples. The average of these
readings and the error of the measurement were calculated.

20
CHAPTER 4
RESULTS AND DISCUSSION
4.1. Fabrication of Membrane Electrode Assembly
In the literature there are many methods for fabricating the membrane electrode
assembly (MEA) for PEM fuel cells but there are a few studies on the preparation of
MEA for PEM electrolyzer. In fact, there are no systematic studies on the preparation of
MEA for PEM electrolyzer. In this work, the catalyst coated membrane method was
used for fabricating the membrane electrode assembly. In catalyst coated membrane
method, the catalyst ink is directly applied onto the membrane. The values of the
preparation parameters, such as temperature, pressure and holding time, were set using
small central composite design. In this experimental design, the water permeability and
the surface resistance were response of the MEA since water permeability and surface
resistance affect the V-I performance and hydrogen generation rate of the PEM
electrolyzer.
4.1.1. Catalyst ink preparation
Although the catalyst materials are different in anode and cathode sides, the
active carbon, nafion solution, isopropanol and water contents are the same. In the first
part of the study, the catalyst ink was prepared without the metal catalyst in order to
find the optimum preparation conditions at which water permeability and conductivity
were high.
First issue was to determine the suitable catalyst ink composition because the
activated carbon and PTFE (Nafion ion solution) percentages affect the
physicochemical properties, such as colloidal stability of the catalyst ink and the
durability of the coating. The concentration of nafion ion solution was first varied. If the
Nafion ion solution concentration was low, the coating layer on membrane was
observed to peel off after the hot press application Figure 4.1. shows the effect of the

21
different concentrations of Nafion ion solution on physical appearance of the MEA. As
can be seen from the figure, when the PTFE percentage was 52% the durable coating
was obtained.
Figure 4.1. Effects of PTFE percentage on to a physical appearance (a) PTFE % is
5%,(b) PTFE % is 30% and (c) PTFE % is 52%
4.1.2. Membrane Coating
It was found that Nafion membrane was wrinkled and twisted if membrane was
dry during preparation. This was due to the fast and uneven absorption of water in
Nafion. In literature, this was the most significant problem for the catalyst coated
membrane method. In this study rubber gaskets were used as a template during coating
to coat the ink. The membrane was clamped between two gaskets before applying the
catalyst coating on the wet membranes. The visual quality of the MEA prepared using
dry and wet membranes is compared as shown in Figure 4.2.

22
Figure 4.2. Effect of initial state of the membrane on the MEA physical appearance (a)
without initial water treatment (dry membrane) (b) with initial water
treatment (wet membrane)
4.1.3. Hot press
Hot press was the last part of the fabrication of membrane electrode assembly. In this
study, the aim was to determine the effect of the hot press conditions on the
physicochemical properties of the MEA. Three factors were selected in the
experimental design; temperature, pressure and holding time. It was observed that the
catalyst ink coated membrane was wrinkled and folded if the membrane was directly
put into hot press at high temperature .This was eliminated by putting the membrane
into the press at room temperature before raising the press temperature. Also, it was
found that the slow heating rate prevented the membrane from deforming. Figure 4.3.
shows the effect of the initial temperature of the press on the physical appearance of the
MEA.
Figure 4.3. Effect of initial temperature of the hot press (a) high temperature (b) room
temperature

23
4.2. Characterization of the MEA
4.2.1. Water Vapor Permeability
All the 15 MEAs were prepared using the parameters generated by small central
composite design. After that water vapor permeability tests were performed for all the
samples. The thickness of MEA used in the experiments are slightly different from each
other, the change of relative humidity in the upper part of the permeability vessel was
plotted as a function of time and normalized with the thickness of the films. The
permeability of water vapor was calculated from the slope of linear portion of a ln PIL-
Pıui / PIL-Pıut= (Peff.A.R.T/Vu.L).t and time graph. Results were tabulated in
Table 4.1.
Table 4.1. Water permeability coefficients
No Temperature(°C) Pressure(pound) Time(minute) water permeability
mol/s.cm.kPa
1 122.5 15000 6.5 0.2131
2 122.5 10000 6.5 0.3232
3 122.5 5000 6.5 0.3899
4 135 5000 10 0.0944
5 122.5 10000 6.5 0.3336
6 122.5 10000 6.5 0.3864
7 122.5 10000 6.5 0.4298
8 122.5 10000 6.5 0.276
9 122.5 10000 10 0.2415
10 122.5 10000 13 0.3088
11 135 10000 6.5 0.3194
12 110 5000 3 0.3971
13 110 10000 6.5 0.275
14 110 15000 10 0.3993
15 135 15000 3 0.172

24
4.2.2. Resistance test
Another issue affecting the efficiency of the water electrolyzer is the resistance
of the MEA. The resistance test was repeated 4 times for all the prepared MEAs and the
results were given in Table 4.2.
Table 4.2. The resistance test results
No Experiment 1
(kΩ)
Experiment 2
(kΩ)
Experiment 3
(kΩ)
Experiment 4
(kΩ)
Average(kΩ)
1 5.9 4.3 4.4 4.5 4.77
2 3.7 3.8 4.2 4.5 4.05
3 10.1 8.8 10.2 10.1 9.80
4 3.1 2.98 3.2 3.3 3.14
5 4.6 4.1 4.5 4.6 4.45
6 5.3 4.8 4.3 5.1 4.87
7 2.6 3.3 3.9 2.6 3.10
8 2.16 2.38 2.08 1.77 2.09
9 2.25 2.77 2.25 2.28 2.38
10 2.01 7.3 6.09 4.7 5.02
11 8.5 8.5 6.2 4.28 6.87
12 3.9 4.4 3.9 3.4 3.90
13 2.65 2.65 2.39 2.4 2.52
14 1.8 2.17 1.64 2.35 1.99
15 3.8 3.06 3.11 3.06 3.2575
4.3. Analysis of the Experimental Design Results
In this work, while the hot press conditions, such as temperature, pressure and
time were changed, water permeability and resistivity were monitored. A response
surface methodology via central composite design was used. The central composite
designs for three factors at three levels were used. This design was used to obtain the
optimum conditions in the preparation of PEM electrolyzer. 15 different combinations
of the factors were obtained through the central composite design by using Design
Expert 7 software. The measured responses at each combination of the factors were
tabulated in Table 4.3. Water permeability was found to vary from 0.0944 to 0.4298 and
the resistance varied from 1.99 to 9.8 kΩ.

25
Table 4.3. Central composite design matrix with experimental values for resistivity and
water permeability
The correlation coefficient shows the relationship between two variables
numerically. In fact, the correlation coefficient scales from +1 to -1. Positive sign means
that the variables acted in the same way. Negative sign means that variables acted in the
opposite way. If the correlation coefficient is zero, it means that variables have no
relationship with each other. Before the detailed analysis, the interactions correlation
coefficients were sought. Figure 4.4. and Figure 4.5. shows the correlation graphs.

26
Figure 4.4. Correlation graphs of water permeability via (a) temperature (b) pressure (c)
time

27
Figure 4.5. Correlation graphs of resistance via (a) temperature (b) pressure (c) time

28
Table 4.4. shows the correlation coefficients. It is seen from the correlation
coefficients that; temperature has the highest and negative effect on the water
permeability, while pressure is negative and has small effect on water permeability and
also the holding time has small and positive effect on water permeability. On the other
hand,temperature has positive and highest effect on resistance while the, pressure is
small but as negative effect on the resistance whereas and the holding time has small
and positive effect on the resistance.
Table 4.4. Correlation coefficients
Correlation
Relative humidity Resistance
Temperature -0.588 0.249
Pressure -0.030 -0.221
Time 0.034 0.063
4.3.1. Water Permeability Analysis
The results of Anova were shown in Figure 4.6. The Model f-value of 3.80
implies that the model is significant for water permeability. The values of ‘’Prob> F‘’
below 0.05 indicated that the model terms were significant. According to the model, the
interaction of pressure and time was significant for the water permeability. The values
of the coefficient of the multiple determination (R2= 0.7445; R
2 adj= 0.5459 and R
2
pred= -0.70 for water permeability). These values are not close to each other. This
possibly indicated a large block effect or a possible problem with the model and data.
Things to consider were model reduction, response transformation, outliers according to
the design expert. However, the model reduction and response transformation did not
help to improve model. The model became insignificant. But lower press values of 0.21
could also explain the significance of the model. The lack of fit F value of 0.4082
means lack of fit is not significant. There is only a %40.82 chance that a lack of fit F
value this large could occur due to the noise. Insignificant lack of fit is desired values;
hence it means that model is fits.

29
Figure 4.6. Analysis of variance for water permeability
The mathematical regression model for water permeability fitted using the coded
factors were as follows:
Water permeability regression model
0.30+0.022*temperature-0.088*pressure-0.034*time – 0.015 temperature*pressure –
0.11 *temperature*time + 0.15 pressure*time
Figure 4.7. (a) normal plot of residuals (b) predicted and actual values graph for
water permeability. Normality plot has no unusual appearance so there is no need the
transformation the values.

30
(a)
(b)
Figure 4.7. (a) normal plot of residuals (b) predicted and actual values graph for water
permeability
Figure 4.8. shows that the effect of the one factor on the water permeability. As
shown in the figure, the temperature has small influence on water permeability. The
water permeability increases with the increase of temperature. With the temperature
increase, water permeability increase from 0.281 to 0.3261. However, the pressure has
negative effect on the water permeability. The water permeability decreased with the
increase of pressure. The pressure has the biggest effect on the water permeability. With
the increase of the pressure, water permeability decreased from 0.392 to 0.215. Also,
the holding time has negative effect on the water permeability. Water permeability
decreases as time increases from 0.3376 to 0.2703.

31
(a)
(b)
(c)
Figure 4.8. The affect of the one factor graph for the water permeability (a) influence of
temperature (b) influence of pressure (c) influence of time

32
Figure 4.9. shows the interaction and 3-D surface plots. As shown in the figure,
temperature and pressure has no interaction with each other. The smallest water
permeability (0.2450) occurs at the pressure of 12500 pound and the temperature
of122.5°C. The highest water permeability (0.3925) occurs at 5000 pound and 122.5°C.
However, temperature and time has interaction. The smallest value of water
permeability occurs at 3 min and 110°C. The value of water permeability is 0.2315 at
that condition. The highest value was obtained at 3 min and 133°C; in fact the value of
water permeability was 0.420 at that condition. Time and pressure has the interaction
with each other as well. The smallest value of water permeability occurs at 3 min and
13500 pound. The value of water permeability is 0.175. The highest value was obtained
at 3 min and 5000 pound that gave 0.4996 of water permeability.
Figure 4.9. Interaction and 3-D surface graphs

33
Figure 4.10. shows the cube plot of the water permeability. The cube plot shows
that all the three conditions affect the water permeability. As shown in the figure, the
maximum value of the water permeability was obtained at 3 minute, 135°C and 5000
pound. The value of water permeability was 0.726 under these preparation conditions.
The minimum value of the water permeability was obtained at 3 minute 110°C and
15000 pound.
Figure 4.10. Cube plot of water permeability
4.3.2. Resistance –Response Analysis
The results of Anova were shown in Figure 4.11. The Model f-value of 6.92
implies that the model is significant for resistance. The values of ‘’ Prob> F ‘’ below
0.05 indicated that the model terms were significant. According to the model, one
factor, temperature, the interaction of temperature and pressure, interaction of pressure
and time, also the quadratic effects of temperature were significant for the resistivity.
The values of the coefficient of the multiple determination (R2= 0.8385; R
2 adj= 0.7174
and R2 pred= 0.32 for resistivity.) are not close to each other. This possibly indicated a
large block effect or a possible problem with the model and data. So, model reduction,
response transformation, outliers need to be considered according to the design expert
software. However, the model reduction and response transformation did not help to

34
improve the model. In fact the model became insignificant. Lower press values of 37.85
could also explain the significance of the model. The lack of fit F value of 0.1596
means lack of fit is insignificant. There is only a 15.96% chance that a lack of fit F
value could occur due to the noise. Insignificant lack of fit is desired values. It means
that model fits.
Figure 4.11. Analysis of variance for resistance
The mathematical regression model for resistance, fitted using three factors,
were as follows:
Resistance regression model
3.53 – 1.81* temperature +0.95 * pressure + 0.41 *time +2.77 *temperature*time -3.32
pressure*time +2.04 temperature2

35
Figure 4.12. shows the normal plot residuals, the predicted and actual values for
the resistance. Normality plot has no unusual issue so there is no need for the
transformation of the values.
(a)
(b)
Figure 4.12. (a) normal plot of residuals (b) predicted and actual values graph for
resistance
Figure 4.13. shows that the effect of the one factor on the resistance. As shown in
the figure, with the temperature increase, the resistance initially increases than it
decreases. With the temperature, the resistance decreases from 7.3736 kΩ to 3.68 kΩ.
However, pressure has positive effect on the resistance. The resistance increases with
the increase of pressure. With the increase of the pressure, the resistance increases from
2.5736 kΩ to 4.4836 kΩ. Also, the holding time has negative and small effect on the
resistance. The resistance increases from3.12 kΩ to 3.93 kΩ as time increases.

36
(a)
(b)
(c)
Figure 4.13. The effect of the one factor graph for the resistance (a) influence of
temperature (b) influence of pressure (c) influence of time

37
Figure 4.14. shows the interaction and 3-D surface plots. As shown in the
figure, the temperature and time has interaction with each other. The smallest value of
the resistance occurs at 4.75 min and 128°C. The value of resistance is 2.11 kΩ under
these conditions. The highest value was obtained at 5 min and 110°C. The value of
resistance was 8.2123 kΩ under these time and temperature preparation conditions.
Time and pressure has the interaction with each other, as well. The smallest
value of the resistance occurs at 4 min and 5000 pound. The value of resistance is
0.2715 kΩ at these conditions. The highest value was obtained at 4 min and 135000
pound. The value of resistance was 5.971 kΩ at these conditions.
Figure 4.14. Interaction and 3-D surface graphs
Figure 4.15. shows the cube plot of the resistance. The cube plot shows all
three conditions affecting the resistance. As shown in the figure, the maximum value of
the resistance was obtained at 3 minute, 110°C and 15000 pound. The value of the

38
resistance was 2.65 kΩ. The minimum value of the resistance was obtained at 10 minute
110°C and 15000 pound at which the value of the resistance was 14.01 kΩ.
Figure 4.15. Cube plot of resistance
The comparison of water permeability and resistance analysis to find the
optimum preparation condition was done using the design expert 7. The optimum
conditions were obtained at the maximum water permeability and the minimum
resistance. In the Table 4.5., the maximum water permeability and the minimum
resistance were attained at the optimum conditions of 129.93°C, 7260.25 pound and
4.60 minute.

39
Table 4.5. Design Expert optimization output for maximum water permeability and
minimum resistance
4.3.3. Validation Analysis
Validation of the model (permeability and resistance models) was done at 3
different conditions using the factors selected in such as a way that they are not the
same as the factor values used in the construction of the design but within the set of the
factor values used in the design. The model prediction and the experimental results are
shown in Table 4.6. It is seen that the predicted permeability values using model is
within the experimental design. Hence, the model predicts the water permeability of
MEA prepared using the factors used in this study.
Table 4.6. Validation Results
4.4. Cost Analysis
A cost analysis using the market values for chemicals and the membranes shows
that it costs $3.79/cm2 to prepare MEA as seen in the Table 4.7. given below.
Temperature(°C) Pressure(pound) Time(min) Regression model
result
Experimental
result
115 7000 5 0.3647 0.38
128 12000 8 0.2678 0.23
130 7000 4.5 0.4698 0.48

40
Table 4.7. Cost Analysis
Market Value Cost of 1 cm2 MEA
Nafion Membrane 10 cm2 = $ 32 $3.2
PTFE 25 ml= €60 $0.03
Pt 1 g= $94.90 $0.40
Ru 1 g= $ 48.20 $0.15
Activated Carbon 100 g = $21 $0.003
Isopropanol 500 ml =€20.4 $0.003
4.5. Single Cell PEM Electrolyzer
4.5.1. Catalyst Reduction
After having obtained the optimum preparation conditions, the catalyst loaded
MEA was prepared using that the optimum conditions (i.e.135°C, 5000 pound and 3
min). The prepared MEA was then tested in the single cell PEM Electrolyzer.
It is known that Pt precursor, such as platonic acid, could be reduced at 80°C in
ethanol. So, it seemed that the preparation conditions used in this study would be
enough to obtain the metallic catalysts, such as Pt and Pt/Ru on the MEA. But the time,
3 min was not enough for reducing the metal precursor to obtain the metallic catalyst.
Therefore, MEA was prepared using slightly different preparation conditions (135°C,
5000 pound and 10 minute) which were different than the optimum conditions found
with the model. Indeed, the MEA under this slightly different conditions was found to
be active in the electrolyzer but the resistance of the prepared MEA was high which
was also predicted by the model; hence, resulting in high over voltages at current
densities used in this study. Therefore, NaBH4 was used to reduce the metal precursors
on the active carbon to avoid using high holding time or temperature which are not
going to be the optimum preparation conditions. In fact, it was found that the catalyst
ink solution prepared using NaBH4 treated metal precursor impregnated active
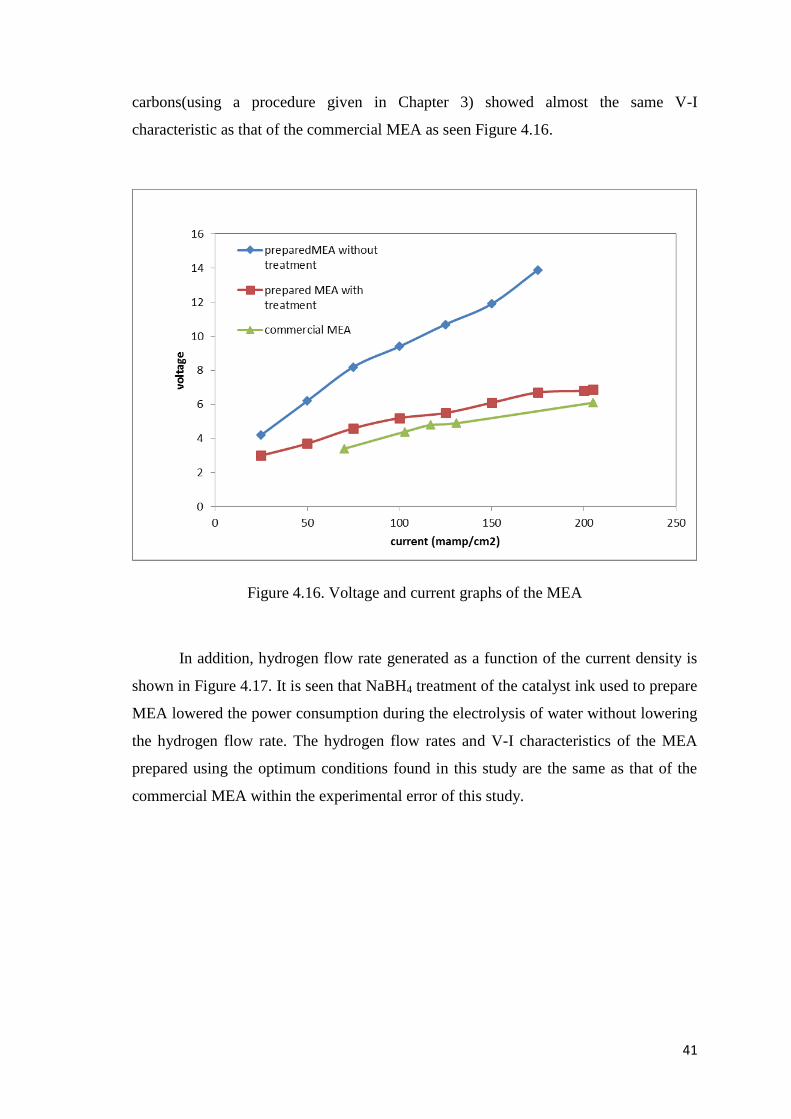
41
carbons(using a procedure given in Chapter 3) showed almost the same V-I
characteristic as that of the commercial MEA as seen Figure 4.16.
Figure 4.16. Voltage and current graphs of the MEA
In addition, hydrogen flow rate generated as a function of the current density is
shown in Figure 4.17. It is seen that NaBH4 treatment of the catalyst ink used to prepare
MEA lowered the power consumption during the electrolysis of water without lowering
the hydrogen flow rate. The hydrogen flow rates and V-I characteristics of the MEA
prepared using the optimum conditions found in this study are the same as that of the
commercial MEA within the experimental error of this study.
42
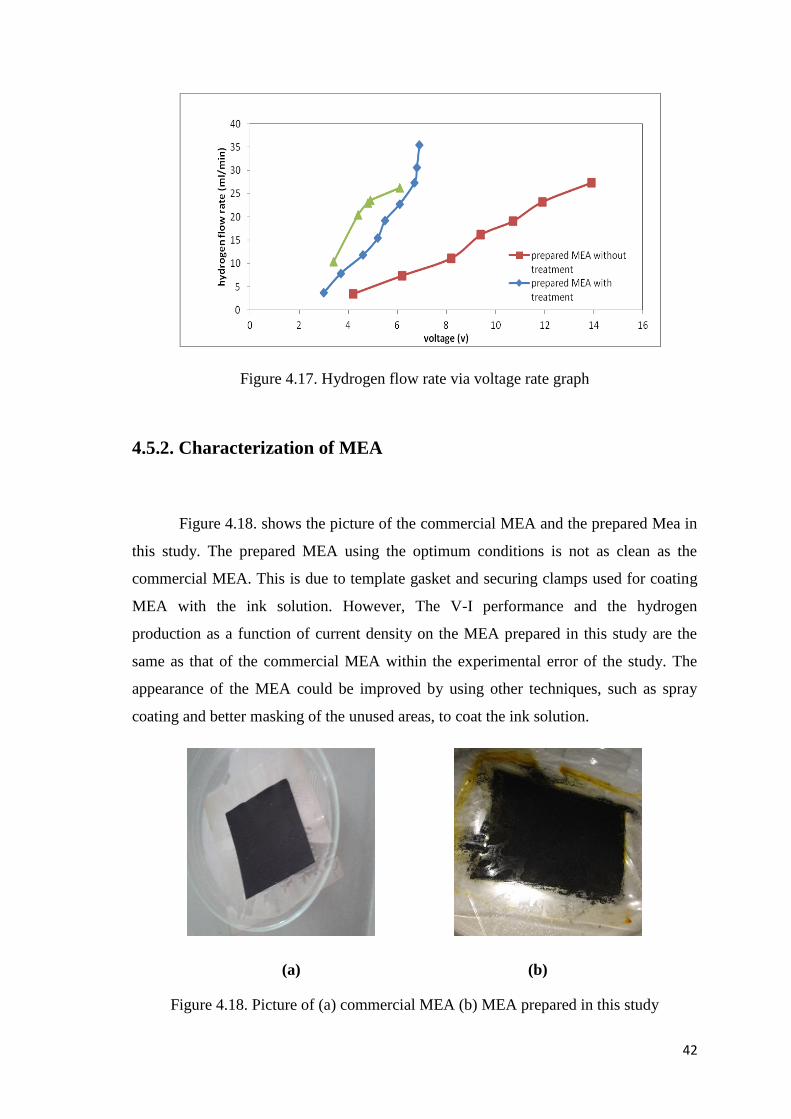
Figure 4.17. Hydrogen flow rate via voltage rate graph
4.5.2. Characterization of MEA
Figure 4.18. shows the picture of the commercial MEA and the prepared Mea in
this study. The prepared MEA using the optimum conditions is not as clean as the
commercial MEA. This is due to template gasket and securing clamps used for coating
MEA with the ink solution. However, The V-I performance and the hydrogen
production as a function of current density on the MEA prepared in this study are the
same as that of the commercial MEA within the experimental error of the study. The
appearance of the MEA could be improved by using other techniques, such as spray
coating and better masking of the unused areas, to coat the ink solution.
(a) (b)
Figure 4.18. Picture of (a) commercial MEA (b) MEA prepared in this study

43
4.5.2.1. SEM images of the MEA
The prepared MEA was characterized using SEM. The morphology of the MEA
was seen in the SEM micro-graph. The active carbon particles containing metal
catalysts were not homogenously distributed. So, milling method of the active carbon
needs to further be improved or other types of carbon, such as carbon black or carbon
nanotubes need to be considered even though the V-I characteristics and hydrogen flow
rate of the MEA prepared using mechanically milled activated carbon are the same as
that of the commercial MEA
Figure 4.19. SEM image of the anode and cathode side of the MEA
4.5.2.2. EDX results
An EDX result shows the composition and contents of the MEA. Figure 4.20.
shows EDX results of the anode and the cathode sides. It is seen that chloride ions are
still present on the MEA even though washing was used to remove the chloride ions.
This shows that the washing step needs to be improved to remove the chloride ions left
during the reduction of the metal precursor using NaBH4.

44
Figure 4.20. EDX results of anode and cathode side of the MEA
4.5.2.3. XRD results
XRD patterns of the MEA show that carbon is present in the form of graphite
and amorphous carbon at the peaks located at 2Ө angles of 40°and10° respectively.
Besides, platinum must have the peak located at 39° and also the other peaks of the Pt
located at 36,46,85° must be seen. So, this could be due to that Pt crystallites are smaller
than 5 nm (since the XRD is sensitive to the crystallites larger than 5 nm). In fact EDX
results show that ME contains Pt metal on both sides. Figure 4.21. shows the XRD
patterns of the prepared MEA.

45
Figure 4.21. XRD patterns of the MEA
46
CHAPTER 5
CONCLUSION
In the first part of the thesis the preparation conditions of the membrane
electrode assembly was investigated using water permeability and resistance as the
response of the MEA. The small center composite experimental design was done to find
the optimum preparation conditions. The optimum conditions were found to be135°C,
5000 pound and 3 minute of press holding time.
In the second part of the thesis, the MEA loaded with the metal catalyst was
prepared at optimum conditions. The V-I performance and the hydrogen production of
the prepared MEAs and commercial membranes were compared in the single cell PEM
Electrolyzer. The optimum conditions did not yield the MEA with metal catalysts
because of the insufficient reduction condition for the metal precursors. However, the
catalyst ink prepared using the metal precursor impregnated active carbon treated with
the NaBH4 yielded highly active MEA for water electrolysis. In fact, the resistance of
the prepared MEA was almost the same as that of the commercial MEA but the
hydrogen production was slightly higher than of the commercial MEA.

47
REFERENCES
Grigoriev S.A., Porembsky V.I.,Fateev V.N.,2006 ” Pure hydrogen production by PEM
electrolysis for hydrogen energy” International Journal of Hydrogen
Energy 31(2006)171-175.
Yamaguchi M, Horiguchi M, Nakanori T. 2000,”Development of large –scale water
electrolyser using solid polymer electrolyte in WE-NET” Proceeding of
the 13 th world Energy Conference,vol.1 ,June 12-15, 2000, Beijing
,China. p. 274-281.
Tsutomu Oi,Yoshinori Sakaki, 2003 “Optimum hydrogen production and current
density of the PEM type water electrolyzer operated only during the off-
peak period of electricity demand”Journal of Power Sources 129 (2004)
229-337.
Frano barbir,2005 “PEM electrolysis for production of hydrogen from renewable energy
sources”Solar Energy78 (2005) 661-669.
Lee S.J, Mukerjee S., McBreen j., Rho Y. W.,Kho Y.T.,Lee T.H., 1998 “Effects of
Nafion impregnation on performances of PEMFC
electrodes”Electrochimica Acta, Vol. 43 ,No.24 ,p.3693-3701,1998.
María A. Nieva, María M. Villaverde, Antonio Monzón, Teresita F. Garetto, Alberto J.
Marchi,” Steam-methane reforming at low temperature on nickel-based
catalysts”Chemical Engineering Journal vol 235 p 158-166 ,2014.
Monterroso R., Maohong F., Zhanga F., Gaoa Y., Popa T., Argyle M. D.,” Effects of an
environmentally-friendly”, inexpensive composite iron–sodium catalyst on
coal gasification”Fuel ,p.341-349 ,2014.
Xu W., Scott K., “The effects of ionomer content on PEM water electrolyser membrane
electrode assembly performance”International Journal of Hydrogen
Energy” p 12029-12037 ,2012.

48
Wang Z., Huang H., Liu H., Zhou X.,” Self-sustained electrochemical promotion
catalysts for partial oxidation reforming of heavy hydrocarbons”
,International Journal of Hydrogen Energy p. 17928-17935,2012.
Kim C. S., Chun Y.G., Peck D. R.,1998”A Novel Process to Fabricate Membrane
Electrode Assemblies for Proton Exchange Membrane Fuel
Cells”International Journal of Hydrogen Energy Vol 23 ,No.11 pp 1045-
1048.
Hubbert M.King ,Shell Development Company Ezploration and Production Research
Division ,Publication No:95 Houstan Texas (1956).
Hoogers, G., 2003 “Fuel Cell Technology Handbooké ( CRC press).
Larminie J., Dicks A., 2003 “Fuel Cell Systmems Explained”( John Wiley ans Sons).
British Petrol World Statistical Rewiews 2013 Energy Outlook.

1

50
APPENDIX A
RAW DATA FOR EXPERIMENTAL STUDY
Figure F.1. Relative Humidty versus Time Graphs
(cont.on next page)
Base Membrane
No 1 Membrane

51
Figure F.1. (cont.) (cont.on next page)
No 2 Membrane
No 3 Membrane
No 4 Membrane

52
Figure F.1 (cont.) (cont. on next page)
No 5 Membrane
No 6 Membrane
No 7 Membrane

53
Figure F.1 (cont.) (cont. on next page)
No 9 Membrane
No 8 Membrane
No 10 Membrane
Membrane

54
Figure F.1. (cont.) (cont. on next page)
No 13 Membrane
No 12 Membrane
No 11 Membrane

55
Figure F.1 (cont.)
No 14 Membrane
No 15 Membrane