determination of photovoltaic effective capacity … · determination of photovoltaic effective...
TRANSCRIPT

DETERMINATION OF PHOTOVOLTAIC EFFECTIVE CAPACITY FOR NEW JERSEY Richard Perez for Clean Power Research Project Manager: Cassandra Kling, BPU EXECUTIVE SUMMARY The effective capacity of a power plant represents its effective contribution to a utility’s available generating capacity. Because PV plants are not controllable, their effective capacity is generally underestimated. However, there is growing evidence that, when utility demand peaks are driven by commercial air conditioning, PV may effectively contribute to the utility’s available generating capacity. The effective capacity of PV power plants operating in the service territory of the three largest New Jersey utilities was estimated by analyzing three years of hourly system load data and time/site specific solar irradiance data. The three considered utilities are:
• Public Service Electric and Gas Co. (PSEG) • Jersey Central Power and Light Co. (JCPL) • Atlantic Electric Co. (AECO)
Effective capacity was quantified using three complementary metrics:
• Effective Load Carrying Capability (ELCC), • Minimum buffer Energy Storage (MBES) and • Solar Load Control (SLC) requirements.
DETERMINATION OF PHOTOVOLTAIC EFFECTIVE CAPACITY FOR NEW JERSEY
2
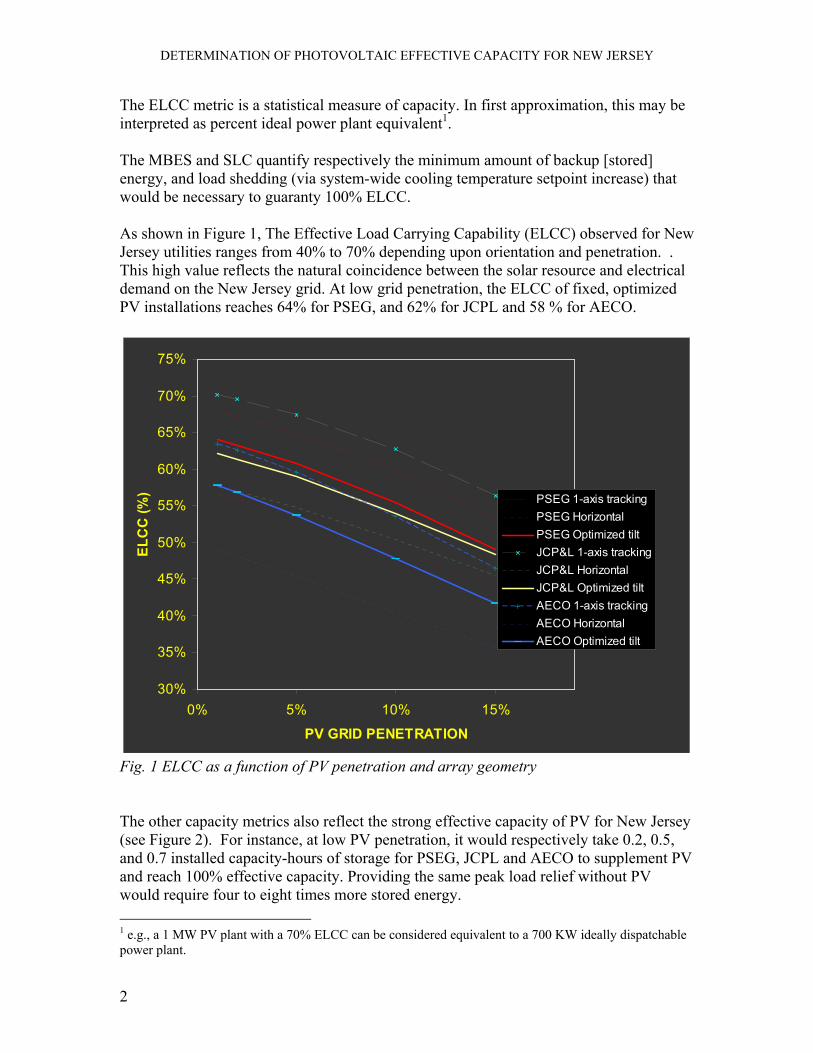
The ELCC metric is a statistical measure of capacity. In first approximation, this may be interpreted as percent ideal power plant equivalent1. The MBES and SLC quantify respectively the minimum amount of backup [stored] energy, and load shedding (via system-wide cooling temperature setpoint increase) that would be necessary to guaranty 100% ELCC. As shown in Figure 1, The Effective Load Carrying Capability (ELCC) observed for New Jersey utilities ranges from 40% to 70% depending upon orientation and penetration. . This high value reflects the natural coincidence between the solar resource and electrical demand on the New Jersey grid. At low grid penetration, the ELCC of fixed, optimized PV installations reaches 64% for PSEG, and 62% for JCPL and 58 % for AECO.
30%
35%
40%
45%
50%
55%
60%
65%
70%
75%
0% 5% 10% 15%
PV GRID PENETRATION
ELC
C (%
) PSEG 1-axis trackingPSEG HorizontalPSEG Optimized tiltJCP&L 1-axis trackingJCP&L HorizontalJCP&L Optimized tiltAECO 1-axis trackingAECO HorizontalAECO Optimized tilt
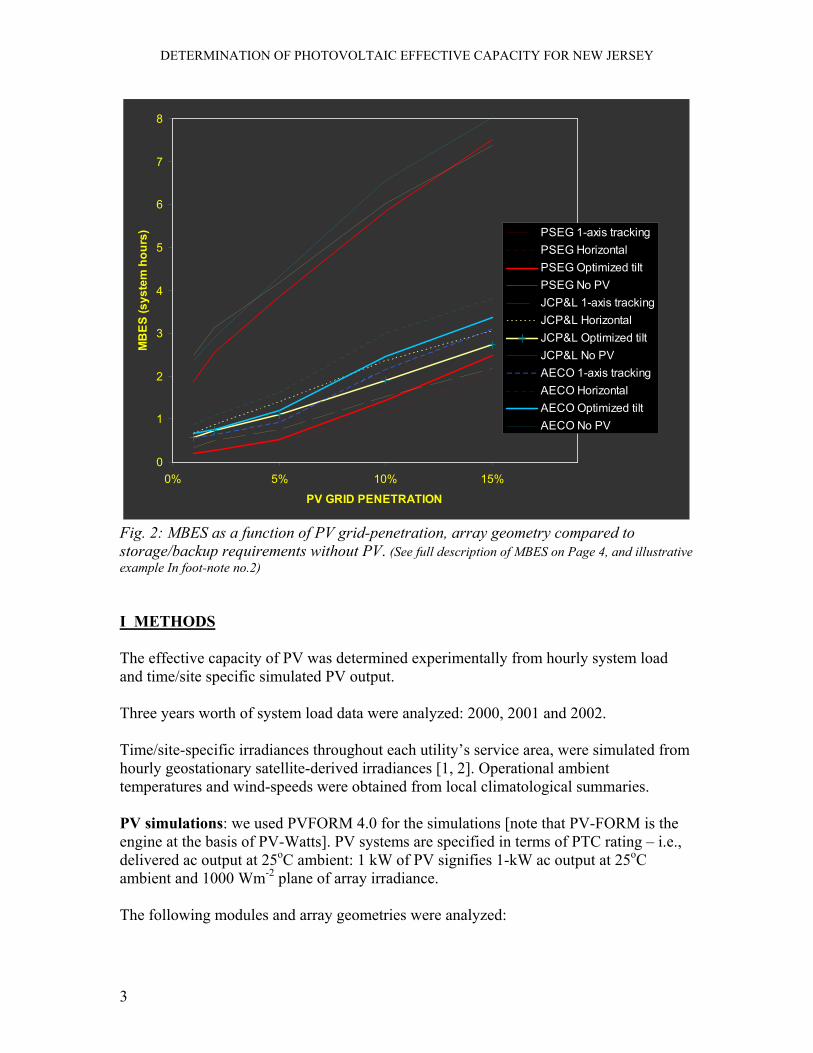
Fig. 1 ELCC as a function of PV penetration and array geometry The other capacity metrics also reflect the strong effective capacity of PV for New Jersey (see Figure 2). For instance, at low PV penetration, it would respectively take 0.2, 0.5, and 0.7 installed capacity-hours of storage for PSEG, JCPL and AECO to supplement PV and reach 100% effective capacity. Providing the same peak load relief without PV would require four to eight times more stored energy. 1 e.g., a 1 MW PV plant with a 70% ELCC can be considered equivalent to a 700 KW ideally dispatchable power plant.
DETERMINATION OF PHOTOVOLTAIC EFFECTIVE CAPACITY FOR NEW JERSEY
3
0
1
2
3
4
5
6
7
8
0% 5% 10% 15%
PV GRID PENETRATION
MB
ES (s
yste
m h
ours
) PSEG 1-axis trackingPSEG HorizontalPSEG Optimized tiltPSEG No PVJCP&L 1-axis trackingJCP&L HorizontalJCP&L Optimized tiltJCP&L No PVAECO 1-axis trackingAECO HorizontalAECO Optimized tiltAECO No PV
Fig. 2: MBES as a function of PV grid-penetration, array geometry compared to storage/backup requirements without PV. (See full description of MBES on Page 4, and illustrative example In foot-note no.2) I METHODS The effective capacity of PV was determined experimentally from hourly system load and time/site specific simulated PV output. Three years worth of system load data were analyzed: 2000, 2001 and 2002. Time/site-specific irradiances throughout each utility’s service area, were simulated from hourly geostationary satellite-derived irradiances [1, 2]. Operational ambient temperatures and wind-speeds were obtained from local climatological summaries. PV simulations: we used PVFORM 4.0 for the simulations [note that PV-FORM is the engine at the basis of PV-Watts]. PV systems are specified in terms of PTC rating – i.e., delivered ac output at 25oC ambient: 1 kW of PV signifies 1-kW ac output at 25oC ambient and 1000 Wm-2 plane of array irradiance. The following modules and array geometries were analyzed:
DETERMINATION OF PHOTOVOLTAIC EFFECTIVE CAPACITY FOR NEW JERSEY
4
• Modules: Standard crystalline modules. • Geometries: We considered three geometries (1) 1-axis tracking with horizontal
north-south axis; (2) horizontal, and (3) Fixed-tilt optimized for mid afternoon maximum output (20o-tilt and 60o-azimuth, West). The first represents nearly ideal summer power output, while the second represents common commercial roof installations.
• Effective capacity metrics: Three types of metrics were produced:
• Effective Load Carrying Capability (ELCC): This is a statistical measure of effective capacity. The ELCC represents the increase in capacity available to a localized grid that is attributable to the deployed PV capacity on that grid, at constant loss-of-load probability [3, 4].
ELCC is quantified in % of installed PV capacity. The ELCC may be interpreted in terms of ideal resource equivalence; e.g., a 100 MW PV plant with a 45% ELCC may be considered as equivalent to a 45 MW fully dispatchable unit with no down-time.
• Minimum Buffer Energy Storage (MBES): This is a deterministic measure of
capacity. The MBES represents the minimum amount of back-up or stored energy that would be sufficient to guaranty that all loads above a threshold, equal to peak-load minus installed PV capacity, are met by PV + storage [5]. This metric is interesting because, as a measure of the worse case situation, it removes the statistical uncertainty associated with the ELCC. In addition, it provides insight on the economic impact of guaranteeing 100% firm capacity, because it can be easily extrapolated in additional PV installed cost2.
MBES is quantified in installed PV capacity-hours (e.g., 0.5 hours = 50 MWh for 100 MW installed PV capacity). The MBES is contrasted to the amount of storage or backup energy that would be necessary to accomplish the same objective without PV.
• Solar Load Control Degree-Hours (SLC): Because peak loads are driven by A/C
demand, it has been shown that utility-wide cooling temperature mitigation in response to critical load-PV situations [6] could, via temporary load shedding, guaranty that PV + SLC meet all loads in excess the threshold specified above, with minimal end-use temperature discomfort.
SLC is quantified in terms of (1) maximum daily oC-hours of end-user discomfort, and (2) total yearly oC-hours of user discomfort. As for MBES, these metrics are contrasted to the amount of temperature increase that would be necessary to accomplish the same objective without PV.
2 For instance, 0.5 system hours at 1MW = 500 kWh; with a battery-storage cost of, e.g., $300/kWh, guaranteeing firm PV capacity would add $150 per installed PV kW.

DETERMINATION OF PHOTOVOLTAIC EFFECTIVE CAPACITY FOR NEW JERSEY
5
Impact of PV grid-penetration: Because of utility load shape, peak load drivers, and because of the daytime-only availability of PV power, the effective capacity of PV is bound to decrease with PV grid penetration. This decrease is a direct consequence of the facts that peaks are indirectly driven by the sun (creating enhanced cooling load requirements during the hottest days). As PV penetration increases, PV capacity is no longer confined to meeting the highest peak loads, but must also address shoulder loads, and – ultimately – base loads that are not correlated with PV. PV grid-penetrations ranging from 1% of utility peak to 15% of utility peak were considered for this study.
DETERMINATION OF PHOTOVOLTAIC EFFECTIVE CAPACITY FOR NEW JERSEY
6
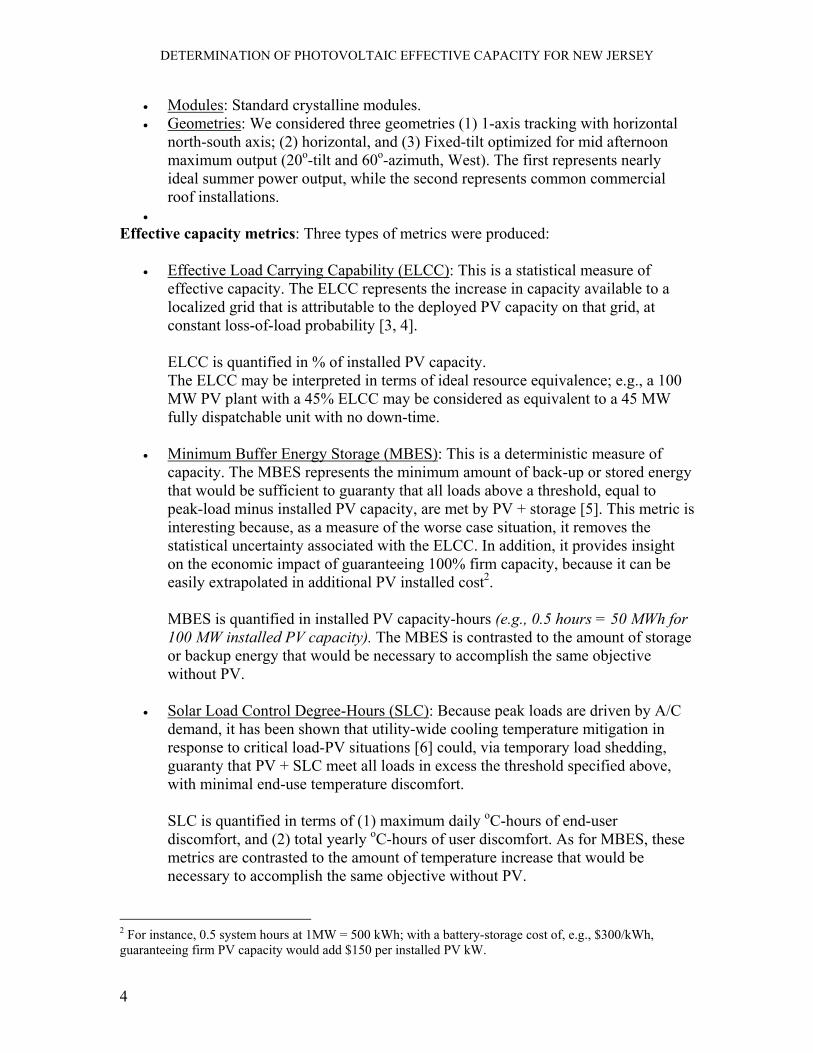
II RESULTS Results presented in this section are 2000-2002 averages. Year-specific results can be found in the appendix. PUBLIC SERVICE ELECTRIC AND GAS As a qualitative illustration of the natural relationship existing between peak demand and PV generation, Fig. 3 illustrates load and PV output profiles3 on the 3-year period peak day, July 23, 2002.
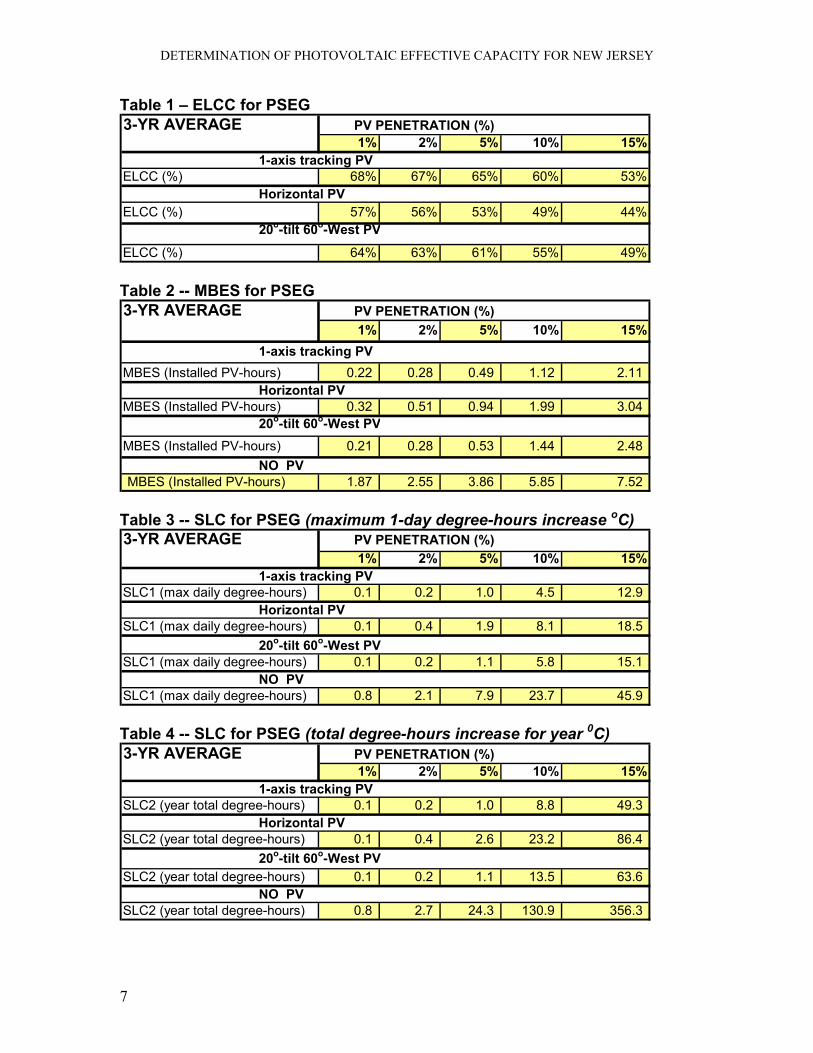
Fig. 3 – PV output3 and PSEG load on 7/23/02. Effective capacity results using respectively ELCC, MBES and SLC as metrics, are presented in Tables 1, 2, 3 and 4. Table 3 reports the maximum one-day SLC system-wide temperature increase required to guaranty 100% PV capacity. Table 4 reports the total cumulative degree-hours required throughout the entire cooling season. 3 In Fig. 1, PV output is shown for a total installed capacity = 10% of utility peak, using 1-axis tracking geometry. The horizontal line is set at peak minus 10%. (note that the area between the horizontal line and the bold line illustrates MBES requirements).
DETERMINATION OF PHOTOVOLTAIC EFFECTIVE CAPACITY FOR NEW JERSEY
7
Table 1 – ELCC for PSEG 3-YR AVERAGE PV PENETRATION (%) 1% 2% 5% 10% 15% 1-axis tracking PVELCC (%) 68% 67% 65% 60% 53% Horizontal PVELCC (%) 57% 56% 53% 49% 44% 20o-tilt 60o-West PV
ELCC (%) 64% 63% 61% 55% 49% Table 2 -- MBES for PSEG 3-YR AVERAGE PV PENETRATION (%) 1% 2% 5% 10% 15% 1-axis tracking PVMBES (Installed PV-hours) 0.22 0.28 0.49 1.12 2.11 Horizontal PVMBES (Installed PV-hours) 0.32 0.51 0.94 1.99 3.04 20o-tilt 60o-West PVMBES (Installed PV-hours) 0.21 0.28 0.53 1.44 2.48 NO PVMBES (Installed PV-hours) 1.87 2.55 3.86 5.85 7.52
Table 3 -- SLC for PSEG (maximum 1-day degree-hours increase oC) 3-YR AVERAGE PV PENETRATION (%) 1% 2% 5% 10% 15% 1-axis tracking PVSLC1 (max daily degree-hours) 0.1 0.2 1.0 4.5 12.9 Horizontal PVSLC1 (max daily degree-hours) 0.1 0.4 1.9 8.1 18.5 20o-tilt 60o-West PVSLC1 (max daily degree-hours) 0.1 0.2 1.1 5.8 15.1 NO PVSLC1 (max daily degree-hours) 0.8 2.1 7.9 23.7 45.9 Table 4 -- SLC for PSEG (total degree-hours increase for year 0C) 3-YR AVERAGE PV PENETRATION (%) 1% 2% 5% 10% 15% 1-axis tracking PVSLC2 (year total degree-hours) 0.1 0.2 1.0 8.8 49.3 Horizontal PVSLC2 (year total degree-hours) 0.1 0.4 2.6 23.2 86.4 20o-tilt 60o-West PVSLC2 (year total degree-hours) 0.1 0.2 1.1 13.5 63.6 NO PVSLC2 (year total degree-hours) 0.8 2.7 24.3 130.9 356.3
DETERMINATION OF PHOTOVOLTAIC EFFECTIVE CAPACITY FOR NEW JERSEY
8
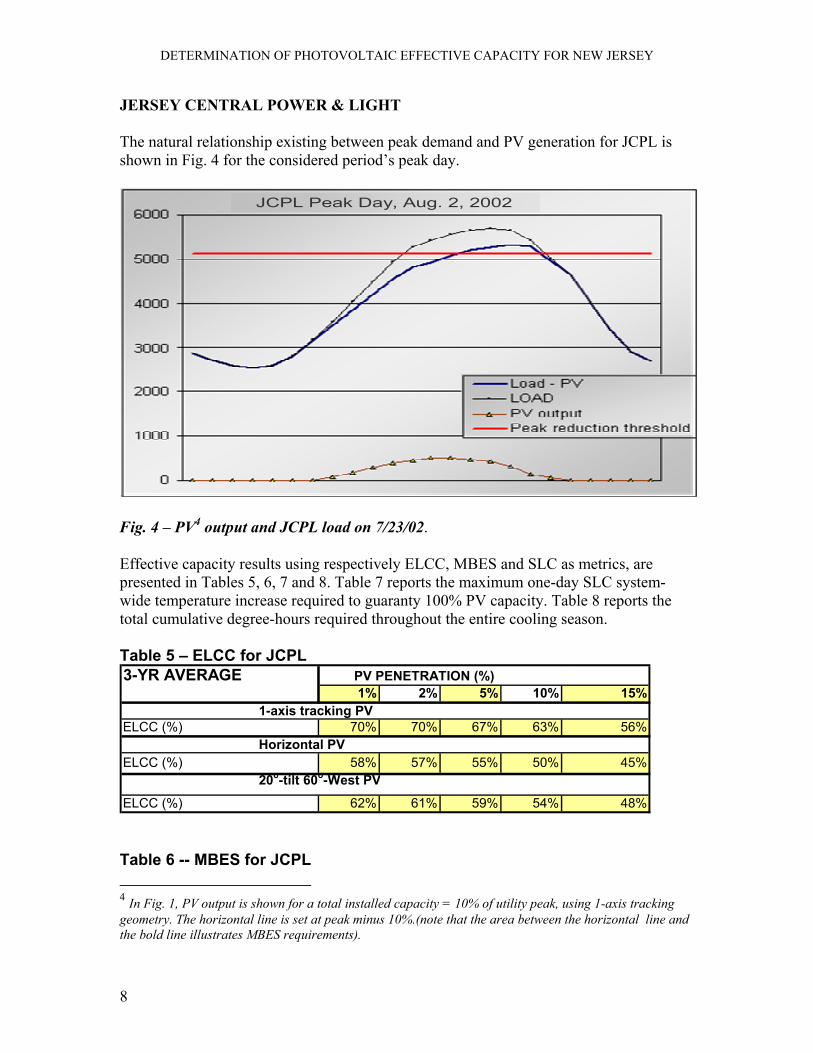
JERSEY CENTRAL POWER & LIGHT The natural relationship existing between peak demand and PV generation for JCPL is shown in Fig. 4 for the considered period’s peak day.
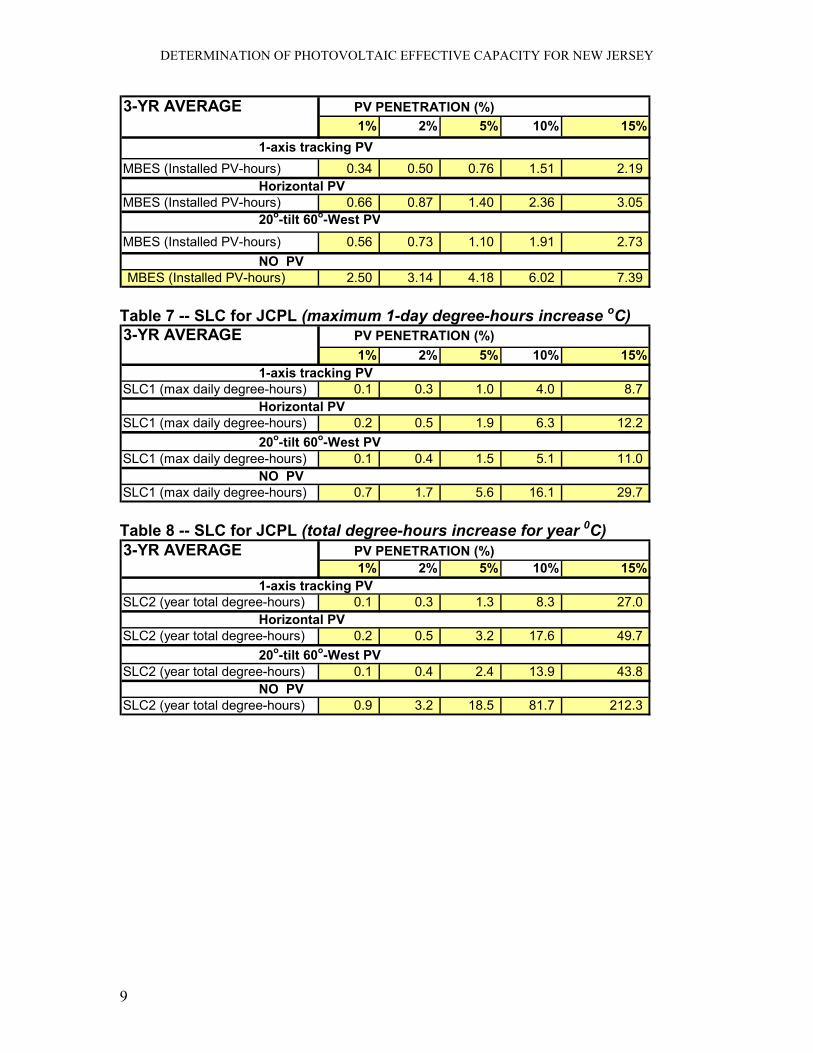
Fig. 4 – PV4 output and JCPL load on 7/23/02. Effective capacity results using respectively ELCC, MBES and SLC as metrics, are presented in Tables 5, 6, 7 and 8. Table 7 reports the maximum one-day SLC system-wide temperature increase required to guaranty 100% PV capacity. Table 8 reports the total cumulative degree-hours required throughout the entire cooling season. Table 5 – ELCC for JCPL 3-YR AVERAGE PV PENETRATION (%) 1% 2% 5% 10% 15% 1-axis tracking PVELCC (%) 70% 70% 67% 63% 56% Horizontal PVELCC (%) 58% 57% 55% 50% 45% 20o-tilt 60o-West PV
ELCC (%) 62% 61% 59% 54% 48% Table 6 -- MBES for JCPL 4 In Fig. 1, PV output is shown for a total installed capacity = 10% of utility peak, using 1-axis tracking geometry. The horizontal line is set at peak minus 10%.(note that the area between the horizontal line and the bold line illustrates MBES requirements).
JCPL Peak Day, Aug. 2, 2002JCPL Peak Day, Aug. 2, 2002JCPL Peak Day, Aug. 2, 2002
DETERMINATION OF PHOTOVOLTAIC EFFECTIVE CAPACITY FOR NEW JERSEY
9
3-YR AVERAGE PV PENETRATION (%) 1% 2% 5% 10% 15% 1-axis tracking PVMBES (Installed PV-hours) 0.34 0.50 0.76 1.51 2.19 Horizontal PVMBES (Installed PV-hours) 0.66 0.87 1.40 2.36 3.05 20o-tilt 60o-West PVMBES (Installed PV-hours) 0.56 0.73 1.10 1.91 2.73 NO PVMBES (Installed PV-hours) 2.50 3.14 4.18 6.02 7.39
Table 7 -- SLC for JCPL (maximum 1-day degree-hours increase oC) 3-YR AVERAGE PV PENETRATION (%) 1% 2% 5% 10% 15% 1-axis tracking PVSLC1 (max daily degree-hours) 0.1 0.3 1.0 4.0 8.7 Horizontal PVSLC1 (max daily degree-hours) 0.2 0.5 1.9 6.3 12.2 20o-tilt 60o-West PVSLC1 (max daily degree-hours) 0.1 0.4 1.5 5.1 11.0 NO PVSLC1 (max daily degree-hours) 0.7 1.7 5.6 16.1 29.7 Table 8 -- SLC for JCPL (total degree-hours increase for year 0C) 3-YR AVERAGE PV PENETRATION (%) 1% 2% 5% 10% 15% 1-axis tracking PVSLC2 (year total degree-hours) 0.1 0.3 1.3 8.3 27.0 Horizontal PVSLC2 (year total degree-hours) 0.2 0.5 3.2 17.6 49.7 20o-tilt 60o-West PVSLC2 (year total degree-hours) 0.1 0.4 2.4 13.9 43.8 NO PVSLC2 (year total degree-hours) 0.9 3.2 18.5 81.7 212.3

DETERMINATION OF PHOTOVOLTAIC EFFECTIVE CAPACITY FOR NEW JERSEY
10
ATLANTIC ELECTRIC COMPANY The natural relationship existing between peak demand and PV generation for AECO is shown in Fig. 5 for the considered period’s peak day.
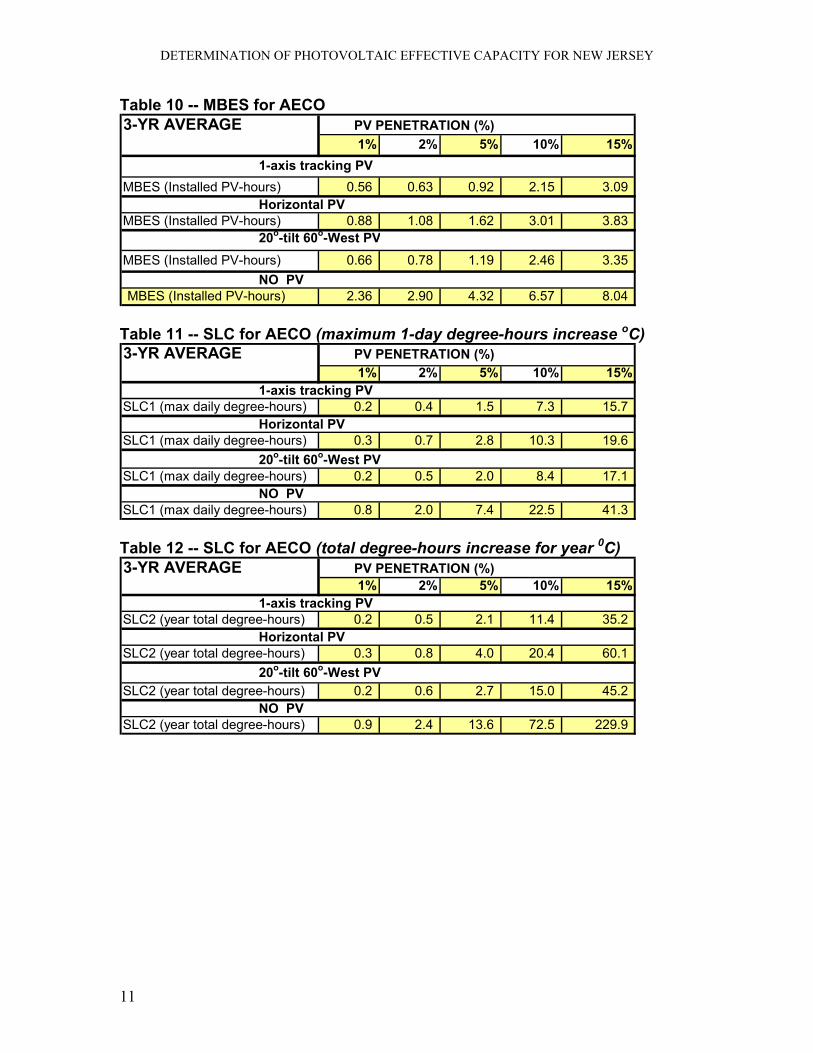
Fig. 5 – PV5 output and AECO load on 7/23/02. Effective capacity results using respectively ELCC, MBES and SLC as metrics, are presented in Tables 9, 10, 11 and 12. Table 11 reports the maximum one-day SLC system-wide temperature increase required to guaranty 100% PV capacity. Table 12 reports the total cumulative degree-hours required throughout the entire cooling season. Table 9 – ELCC for AECO 3-YR AVERAGE PV PENETRATION (%) 1% 2% 5% 10% 15% 1-axis tracking PVELCC (%) 63% 63% 60% 53% 46% Horizontal PVELCC (%) 49% 48% 45% 40% 36% 20o-tilt 60o-West PV
ELCC (%) 58% 57% 54% 48% 42% 5 In Fig. 1, PV output is shown for a total installed capacity = 10% of utility peak, using 1-axis tracking geometry. The horizontal lline is set at peak minus 10% (note that the area between the horizontal line and the bold line illustrates MBES requirements).
0
5 0 0
1 0 0 0
1 5 0 0
2 0 0 0
2 5 0 0
3 0 0 0
L o a d - P VL O A DP V o u t p u tP e a k re d u c t io n t h re s h o ld
J C P L P e a k D a y - - J u ly 2 9 , 2 0 0 2AECO Peak Day, July 29, 2002
0
5 0 0
1 0 0 0
1 5 0 0
2 0 0 0
2 5 0 0
3 0 0 0
L o a d - P VL O A DP V o u t p u tP e a k re d u c t io n t h re s h o ld
J C P L P e a k D a y - - J u ly 2 9 , 2 0 0 2AECO Peak Day, July 29, 2002
DETERMINATION OF PHOTOVOLTAIC EFFECTIVE CAPACITY FOR NEW JERSEY
11
Table 10 -- MBES for AECO 3-YR AVERAGE PV PENETRATION (%) 1% 2% 5% 10% 15% 1-axis tracking PVMBES (Installed PV-hours) 0.56 0.63 0.92 2.15 3.09 Horizontal PVMBES (Installed PV-hours) 0.88 1.08 1.62 3.01 3.83 20o-tilt 60o-West PVMBES (Installed PV-hours) 0.66 0.78 1.19 2.46 3.35 NO PVMBES (Installed PV-hours) 2.36 2.90 4.32 6.57 8.04
Table 11 -- SLC for AECO (maximum 1-day degree-hours increase oC) 3-YR AVERAGE PV PENETRATION (%) 1% 2% 5% 10% 15% 1-axis tracking PVSLC1 (max daily degree-hours) 0.2 0.4 1.5 7.3 15.7 Horizontal PVSLC1 (max daily degree-hours) 0.3 0.7 2.8 10.3 19.6 20o-tilt 60o-West PVSLC1 (max daily degree-hours) 0.2 0.5 2.0 8.4 17.1 NO PVSLC1 (max daily degree-hours) 0.8 2.0 7.4 22.5 41.3 Table 12 -- SLC for AECO (total degree-hours increase for year 0C) 3-YR AVERAGE PV PENETRATION (%) 1% 2% 5% 10% 15% 1-axis tracking PVSLC2 (year total degree-hours) 0.2 0.5 2.1 11.4 35.2 Horizontal PVSLC2 (year total degree-hours) 0.3 0.8 4.0 20.4 60.1 20o-tilt 60o-West PVSLC2 (year total degree-hours) 0.2 0.6 2.7 15.0 45.2 NO PVSLC2 (year total degree-hours) 0.9 2.4 13.6 72.5 229.9
DETERMINATION OF PHOTOVOLTAIC EFFECTIVE CAPACITY FOR NEW JERSEY
12
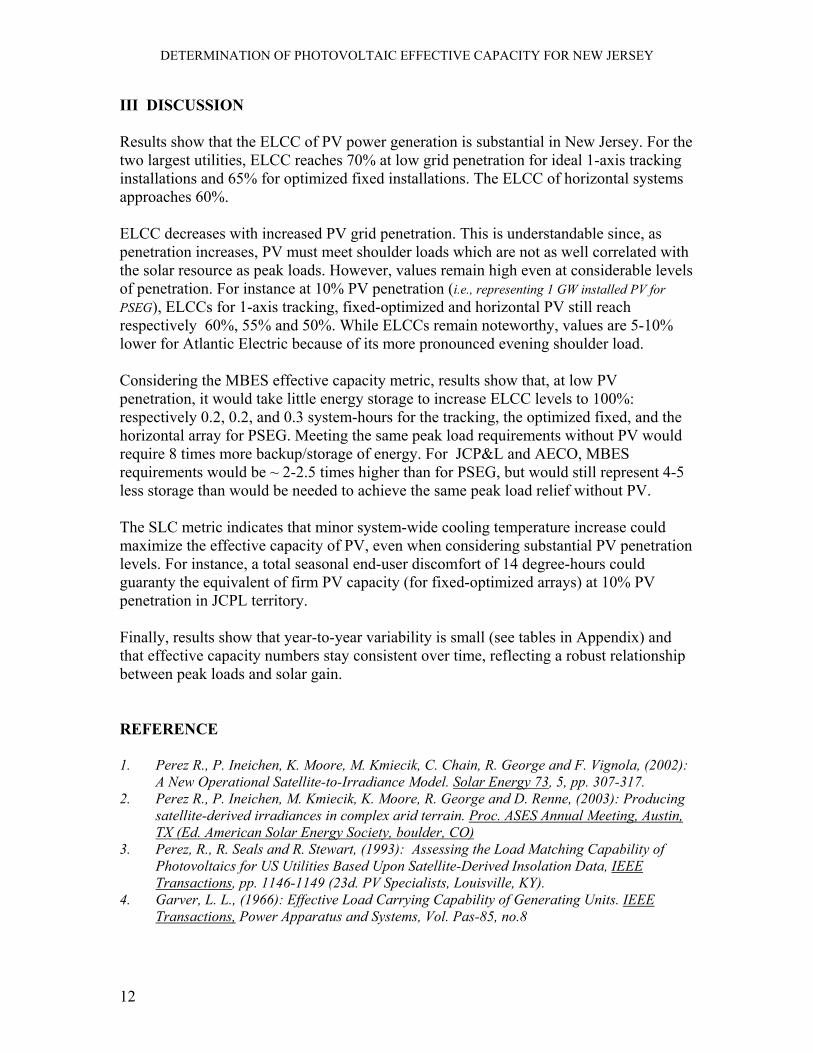
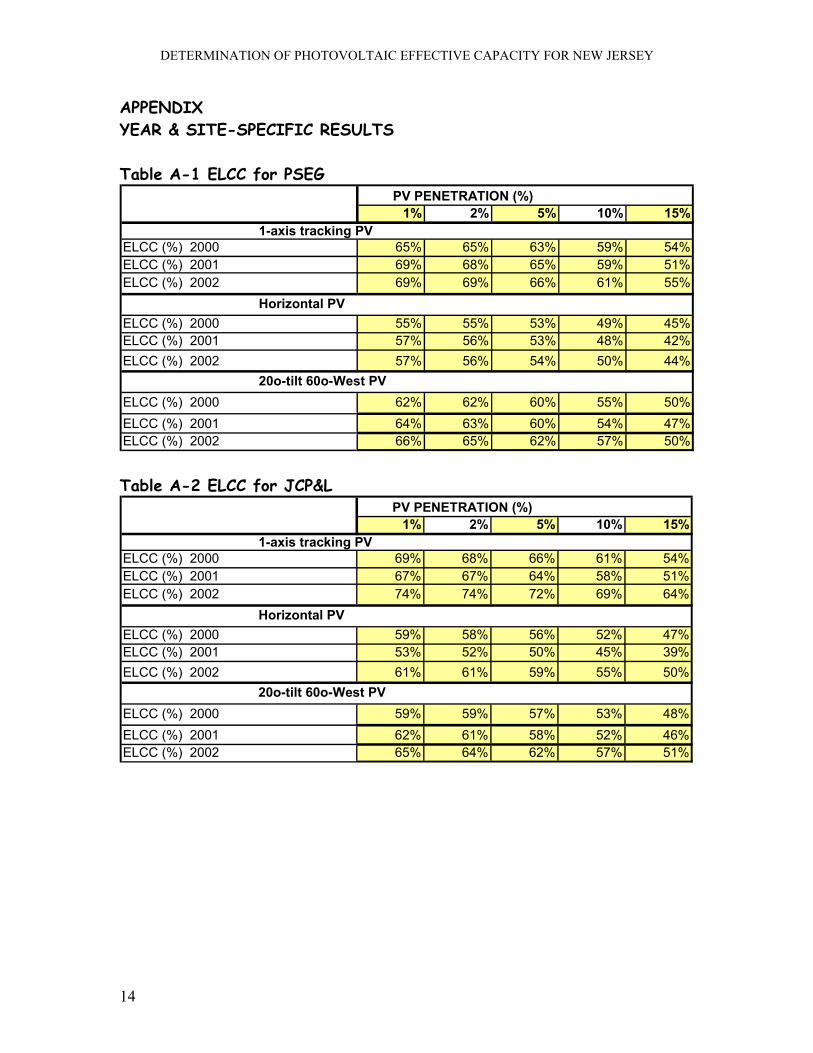
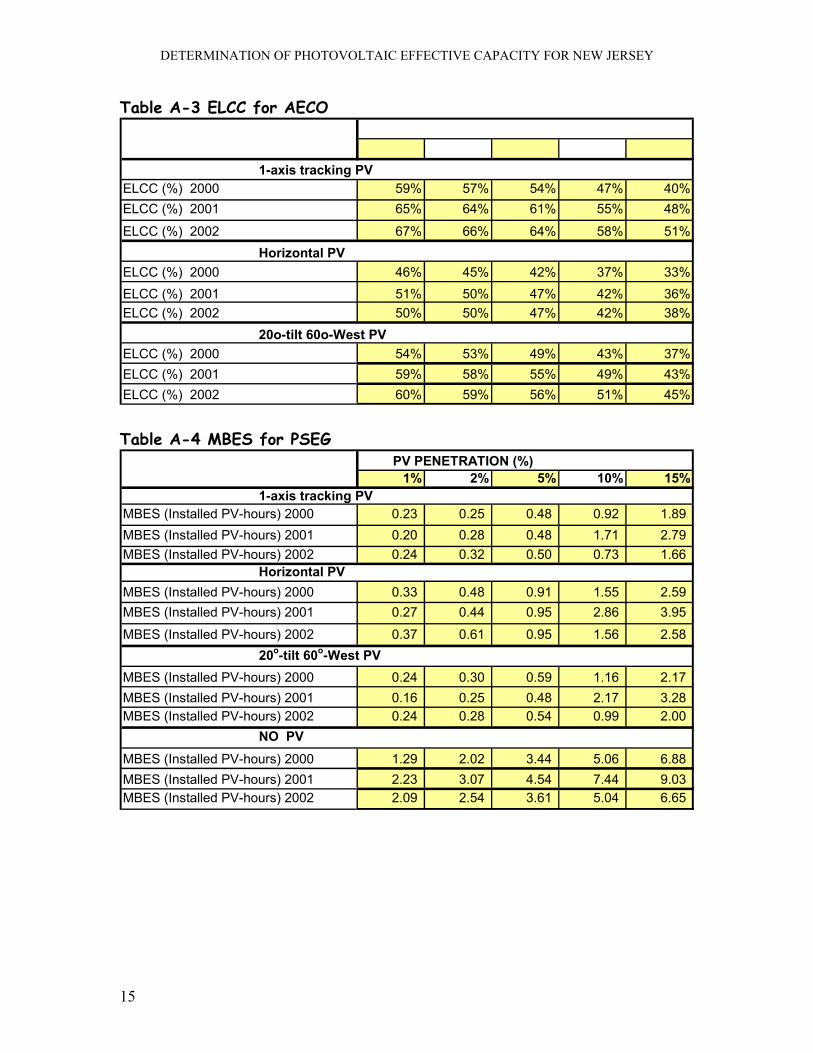
III DISCUSSION Results show that the ELCC of PV power generation is substantial in New Jersey. For the two largest utilities, ELCC reaches 70% at low grid penetration for ideal 1-axis tracking installations and 65% for optimized fixed installations. The ELCC of horizontal systems approaches 60%. ELCC decreases with increased PV grid penetration. This is understandable since, as penetration increases, PV must meet shoulder loads which are not as well correlated with the solar resource as peak loads. However, values remain high even at considerable levels of penetration. For instance at 10% PV penetration (i.e., representing 1 GW installed PV for PSEG), ELCCs for 1-axis tracking, fixed-optimized and horizontal PV still reach respectively 60%, 55% and 50%. While ELCCs remain noteworthy, values are 5-10% lower for Atlantic Electric because of its more pronounced evening shoulder load. Considering the MBES effective capacity metric, results show that, at low PV penetration, it would take little energy storage to increase ELCC levels to 100%: respectively 0.2, 0.2, and 0.3 system-hours for the tracking, the optimized fixed, and the horizontal array for PSEG. Meeting the same peak load requirements without PV would require 8 times more backup/storage of energy. For JCP&L and AECO, MBES requirements would be ~ 2-2.5 times higher than for PSEG, but would still represent 4-5 less storage than would be needed to achieve the same peak load relief without PV. The SLC metric indicates that minor system-wide cooling temperature increase could maximize the effective capacity of PV, even when considering substantial PV penetration levels. For instance, a total seasonal end-user discomfort of 14 degree-hours could guaranty the equivalent of firm PV capacity (for fixed-optimized arrays) at 10% PV penetration in JCPL territory. Finally, results show that year-to-year variability is small (see tables in Appendix) and that effective capacity numbers stay consistent over time, reflecting a robust relationship between peak loads and solar gain. REFERENCE 1. Perez R., P. Ineichen, K. Moore, M. Kmiecik, C. Chain, R. George and F. Vignola, (2002):
A New Operational Satellite-to-Irradiance Model. Solar Energy 73, 5, pp. 307-317. 2. Perez R., P. Ineichen, M. Kmiecik, K. Moore, R. George and D. Renne, (2003): Producing
satellite-derived irradiances in complex arid terrain. Proc. ASES Annual Meeting, Austin, TX (Ed. American Solar Energy Society, boulder, CO)
3. Perez, R., R. Seals and R. Stewart, (1993): Assessing the Load Matching Capability of Photovoltaics for US Utilities Based Upon Satellite-Derived Insolation Data, IEEE Transactions, pp. 1146-1149 (23d. PV Specialists, Louisville, KY).
4. Garver, L. L., (1966): Effective Load Carrying Capability of Generating Units. IEEE Transactions, Power Apparatus and Systems, Vol. Pas-85, no.8

DETERMINATION OF PHOTOVOLTAIC EFFECTIVE CAPACITY FOR NEW JERSEY
13
5. R. Perez, (1997): Grid-Connected Photovoltaic Power: Storage Requirements to Insure 100% Peak Shaving Reliability. Proc. Energy Storage Association Annual meeting, Washington, DC (Ed. Energy storage Assoc., Washington, DC)
6 Perez, R., C. Herig, R. Mac Dougall, and B. Vincent, (2002) Utility-Scale Solar Load Control, Proc. UPEX 03’, Austin, TX. (Ed. Solar Electric Power Association, Washington, DC.)
DETERMINATION OF PHOTOVOLTAIC EFFECTIVE CAPACITY FOR NEW JERSEY
14
APPENDIX YEAR & SITE-SPECIFIC RESULTS Table A-1 ELCC for PSEG
PV PENETRATION (%) 1% 2% 5% 10% 15% 1-axis tracking PVELCC (%) 2000 65% 65% 63% 59% 54%ELCC (%) 2001 69% 68% 65% 59% 51%ELCC (%) 2002 69% 69% 66% 61% 55% Horizontal PVELCC (%) 2000 55% 55% 53% 49% 45%ELCC (%) 2001 57% 56% 53% 48% 42%ELCC (%) 2002 57% 56% 54% 50% 44% 20o-tilt 60o-West PVELCC (%) 2000 62% 62% 60% 55% 50%ELCC (%) 2001 64% 63% 60% 54% 47%ELCC (%) 2002 66% 65% 62% 57% 50% Table A-2 ELCC for JCP&L
PV PENETRATION (%) 1% 2% 5% 10% 15% 1-axis tracking PVELCC (%) 2000 69% 68% 66% 61% 54%ELCC (%) 2001 67% 67% 64% 58% 51%ELCC (%) 2002 74% 74% 72% 69% 64% Horizontal PVELCC (%) 2000 59% 58% 56% 52% 47%ELCC (%) 2001 53% 52% 50% 45% 39%ELCC (%) 2002 61% 61% 59% 55% 50% 20o-tilt 60o-West PVELCC (%) 2000 59% 59% 57% 53% 48%ELCC (%) 2001 62% 61% 58% 52% 46%ELCC (%) 2002 65% 64% 62% 57% 51%
DETERMINATION OF PHOTOVOLTAIC EFFECTIVE CAPACITY FOR NEW JERSEY
15
Table A-3 ELCC for AECO
1-axis tracking PVELCC (%) 2000 59% 57% 54% 47% 40%ELCC (%) 2001 65% 64% 61% 55% 48%
ELCC (%) 2002 67% 66% 64% 58% 51% Horizontal PVELCC (%) 2000 46% 45% 42% 37% 33%ELCC (%) 2001 51% 50% 47% 42% 36%ELCC (%) 2002 50% 50% 47% 42% 38% 20o-tilt 60o-West PVELCC (%) 2000 54% 53% 49% 43% 37%ELCC (%) 2001 59% 58% 55% 49% 43%ELCC (%) 2002 60% 59% 56% 51% 45% Table A-4 MBES for PSEG
PV PENETRATION (%) 1% 2% 5% 10% 15% 1-axis tracking PVMBES (Installed PV-hours) 2000 0.23 0.25 0.48 0.92 1.89 MBES (Installed PV-hours) 2001 0.20 0.28 0.48 1.71 2.79 MBES (Installed PV-hours) 2002 0.24 0.32 0.50 0.73 1.66 Horizontal PVMBES (Installed PV-hours) 2000 0.33 0.48 0.91 1.55 2.59 MBES (Installed PV-hours) 2001 0.27 0.44 0.95 2.86 3.95
MBES (Installed PV-hours) 2002 0.37 0.61 0.95 1.56 2.58 20o-tilt 60o-West PVMBES (Installed PV-hours) 2000 0.24 0.30 0.59 1.16 2.17 MBES (Installed PV-hours) 2001 0.16 0.25 0.48 2.17 3.28 MBES (Installed PV-hours) 2002 0.24 0.28 0.54 0.99 2.00 NO PVMBES (Installed PV-hours) 2000 1.29 2.02 3.44 5.06 6.88 MBES (Installed PV-hours) 2001 2.23 3.07 4.54 7.44 9.03 MBES (Installed PV-hours) 2002 2.09 2.54 3.61 5.04 6.65
DETERMINATION OF PHOTOVOLTAIC EFFECTIVE CAPACITY FOR NEW JERSEY
16
Table A-5 MBES for JCP&L PV PENETRATION (%)
1% 2% 5% 10% 15% 1-axis tracking PVMBES (Installed PV-hours) 2000 0.56 0.79 1.17 1.89 2.45 MBES (Installed PV-hours) 2001 0.31 0.55 0.90 2.31 3.03 MBES (Installed PV-hours) 2002 0.15 0.15 0.22 0.34 1.10 Horizontal PVMBES (Installed PV-hours) 2000 0.77 1.00 1.55 2.27 2.82 MBES (Installed PV-hours) 2001 0.95 1.24 2.06 3.47 4.18 MBES (Installed PV-hours) 2002 0.25 0.37 0.60 1.34 2.14
20o-tilt 60o-West PVMBES (Installed PV-hours) 2000 0.88 1.11 1.26 1.62 2.40 MBES (Installed PV-hours) 2001 0.54 0.77 1.40 2.77 3.49 MBES (Installed PV-hours) 2002 0.26 0.32 0.64 1.34 2.31 NO PVMBES (Installed PV-hours) 2000 2.55 3.17 3.78 5.27 6.72 MBES (Installed PV-hours) 2001 3.18 3.88 5.35 7.35 8.56 MBES (Installed PV-hours) 2002 1.77 2.38 3.42 5.44 6.88 Table A-6 MBES for AECO
PV PENETRATION (%) 1% 2% 5% 10% 15% 1-axis tracking PVMBES (Installed PV-hours) 2000 0.84 0.95 1.45 2.91 3.73 MBES (Installed PV-hours) 2001 0.21 0.31 0.66 1.81 3.02 MBES (Installed PV-hours) 2002 0.62 0.62 0.66 1.74 2.50 Horizontal PVMBES (Installed PV-hours) 2000 1.03 1.21 1.77 3.28 4.10 MBES (Installed PV-hours) 2001 0.59 1.00 1.64 2.95 3.82 MBES (Installed PV-hours) 2002 1.03 1.04 1.45 2.80 3.56 20o-tilt 60o-West PVMBES (Installed PV-hours) 2000 0.90 1.01 1.51 2.94 3.76 MBES (Installed PV-hours) 2001 0.30 0.52 1.01 2.21 3.29 MBES (Installed PV-hours) 2002 0.79 0.80 1.04 2.24 3.00 NO PVMBES (Installed PV-hours) 2000 2.28 2.90 4.21 6.50 7.95 MBES (Installed PV-hours) 2001 2.83 3.53 5.09 7.21 8.65 MBES (Installed PV-hours) 2002 1.98 2.29 3.66 6.00 7.52
DETERMINATION OF PHOTOVOLTAIC EFFECTIVE CAPACITY FOR NEW JERSEY
17
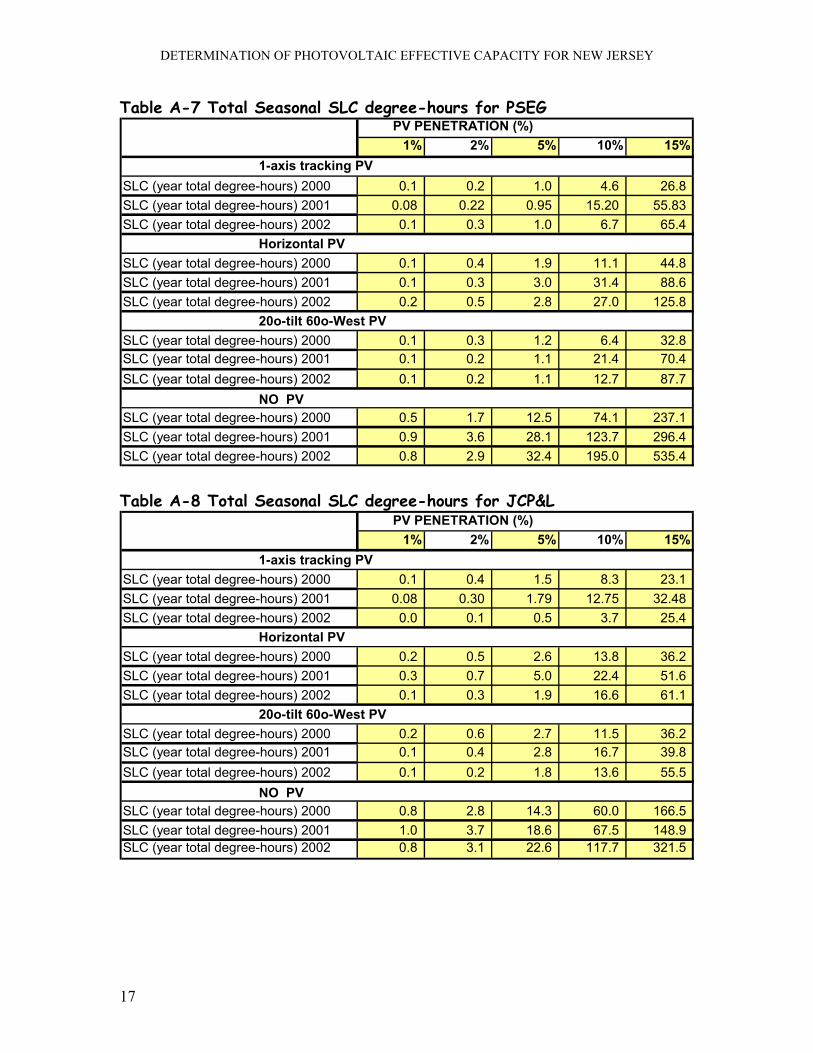
Table A-7 Total Seasonal SLC degree-hours for PSEG PV PENETRATION (%)
1% 2% 5% 10% 15% 1-axis tracking PVSLC (year total degree-hours) 2000 0.1 0.2 1.0 4.6 26.8 SLC (year total degree-hours) 2001 0.08 0.22 0.95 15.20 55.83 SLC (year total degree-hours) 2002 0.1 0.3 1.0 6.7 65.4 Horizontal PVSLC (year total degree-hours) 2000 0.1 0.4 1.9 11.1 44.8 SLC (year total degree-hours) 2001 0.1 0.3 3.0 31.4 88.6 SLC (year total degree-hours) 2002 0.2 0.5 2.8 27.0 125.8 20o-tilt 60o-West PVSLC (year total degree-hours) 2000 0.1 0.3 1.2 6.4 32.8 SLC (year total degree-hours) 2001 0.1 0.2 1.1 21.4 70.4 SLC (year total degree-hours) 2002 0.1 0.2 1.1 12.7 87.7 NO PVSLC (year total degree-hours) 2000 0.5 1.7 12.5 74.1 237.1 SLC (year total degree-hours) 2001 0.9 3.6 28.1 123.7 296.4 SLC (year total degree-hours) 2002 0.8 2.9 32.4 195.0 535.4 Table A-8 Total Seasonal SLC degree-hours for JCP&L
PV PENETRATION (%)1% 2% 5% 10% 15%
1-axis tracking PVSLC (year total degree-hours) 2000 0.1 0.4 1.5 8.3 23.1 SLC (year total degree-hours) 2001 0.08 0.30 1.79 12.75 32.48 SLC (year total degree-hours) 2002 0.0 0.1 0.5 3.7 25.4 Horizontal PVSLC (year total degree-hours) 2000 0.2 0.5 2.6 13.8 36.2 SLC (year total degree-hours) 2001 0.3 0.7 5.0 22.4 51.6 SLC (year total degree-hours) 2002 0.1 0.3 1.9 16.6 61.1 20o-tilt 60o-West PVSLC (year total degree-hours) 2000 0.2 0.6 2.7 11.5 36.2 SLC (year total degree-hours) 2001 0.1 0.4 2.8 16.7 39.8 SLC (year total degree-hours) 2002 0.1 0.2 1.8 13.6 55.5 NO PVSLC (year total degree-hours) 2000 0.8 2.8 14.3 60.0 166.5 SLC (year total degree-hours) 2001 1.0 3.7 18.6 67.5 148.9 SLC (year total degree-hours) 2002 0.8 3.1 22.6 117.7 321.5
DETERMINATION OF PHOTOVOLTAIC EFFECTIVE CAPACITY FOR NEW JERSEY
18
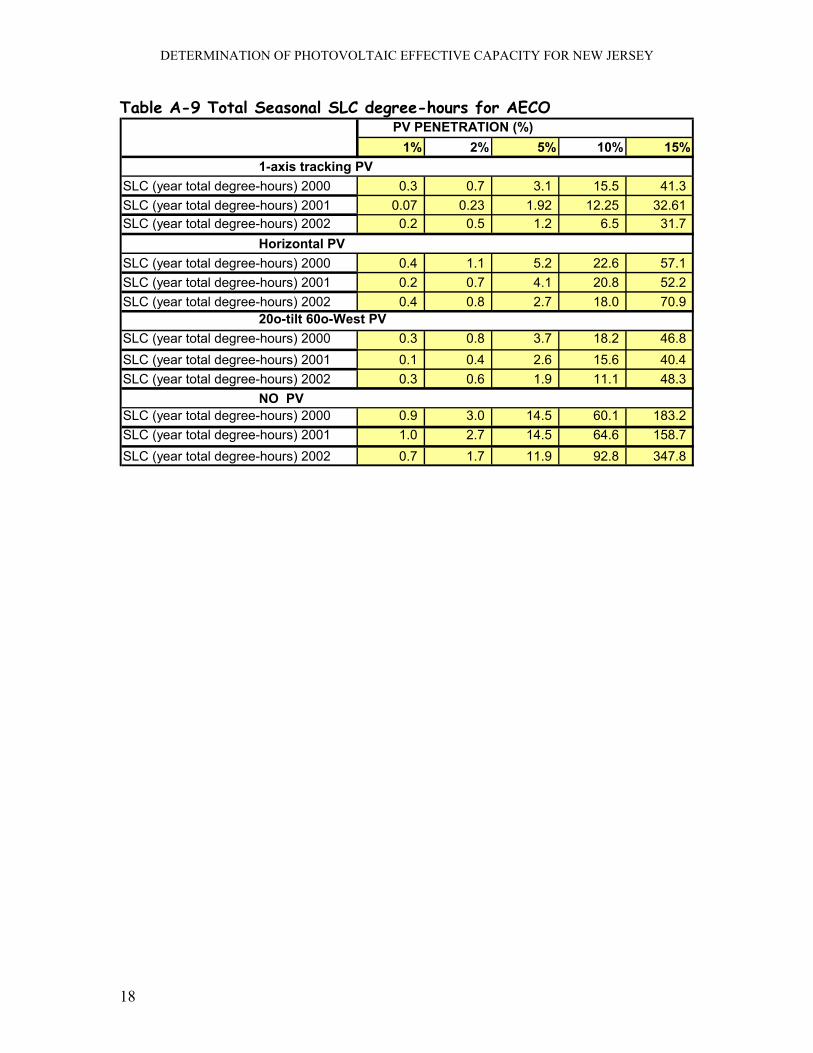
Table A-9 Total Seasonal SLC degree-hours for AECO PV PENETRATION (%)
1% 2% 5% 10% 15% 1-axis tracking PVSLC (year total degree-hours) 2000 0.3 0.7 3.1 15.5 41.3 SLC (year total degree-hours) 2001 0.07 0.23 1.92 12.25 32.61 SLC (year total degree-hours) 2002 0.2 0.5 1.2 6.5 31.7 Horizontal PVSLC (year total degree-hours) 2000 0.4 1.1 5.2 22.6 57.1 SLC (year total degree-hours) 2001 0.2 0.7 4.1 20.8 52.2 SLC (year total degree-hours) 2002 0.4 0.8 2.7 18.0 70.9 20o-tilt 60o-West PVSLC (year total degree-hours) 2000 0.3 0.8 3.7 18.2 46.8 SLC (year total degree-hours) 2001 0.1 0.4 2.6 15.6 40.4 SLC (year total degree-hours) 2002 0.3 0.6 1.9 11.1 48.3 NO PVSLC (year total degree-hours) 2000 0.9 3.0 14.5 60.1 183.2 SLC (year total degree-hours) 2001 1.0 2.7 14.5 64.6 158.7 SLC (year total degree-hours) 2002 0.7 1.7 11.9 92.8 347.8