determination of permethrin and its metabolite in brains...
TRANSCRIPT
Determination of permethrin and itsmetabolite in brains and urines of rats byGC-ECD and GC-MS
MARIA CAVALIEREJulho de 2014

Master in Pharmacy
Biochemistry/ Molecular Biology
Determination of permethrin and its metabolite in brains and urines of rats by GC-
ECD and GC-MS
Maria Cavaliere
(1131609)
Supervisor (University of Camerino): Rosita Gabbianelli
Supervisor ISEP: Valentina Domingues
Co-supervisors: Luìsa Correia-Sá
2013/2014

i
Acknowledgement
My first thanks goes to Professor Valentina F. Domingues for her constant
availability and kindness, moreover I want to thanks all the staff of the laboratory
but in a particular way Luisa Correia-Sá and Paula Paiga.

ii
Abstract:
Synthetic pyrethroids are pesticides derived from naturally occurring pyrethrins,
taken from pyrethrum of dried Chrysanthemum flowers. Pyrethroid insecticides are
one of the most commonly used residential and agricultural insecticides. Many
pyrethroids can significantly harm the nervous system. Permethrin could be one of
the factors involved in the onset of neurodegenerative diseases. The present study
aims to evaluate in brain, the effect that can induce the exposure to permethrin,
during early life of female rats (from 6 to 21 days of life). Therefore, have been
examined the concentrations of permethrin and its main metabolite (3-PBA) in the
brain and urine in female rats sacrificed the day after and 14 days after treating. The
different concentrations of permethrin and 3-PBA (after 24h and after 14 days in the
end of treatment) were obtained using two different methods. The evaluation of
permethrin by liquid-liquid extraction and GC-ECD was performed. The levels of the
3-PBA (in urine and brains) were obtained by SPE procedure and GC-MS using the 2-
PBA as internal standard.
Keywords: pesticides, pyrethroids, permethrin, brain toxicity, 3-PBA (3-
phenoxybenzoic acid), 2-PBA (2-phenoxybenzoic acid), SPE, GC-ECD, GC-MS

iii
INDEX
1. Pyrethroids and permethrin…………………………………………………….1-4
1.1. Mode of action of pyrethroids…………………………………………… 4-7
1.2. Health effect and toxicity of permethrin……………………………. 7-8
1.3. Brain toxicity……………………………………………………………………..8-11
2. Permethrin kinetics………………………………………………………………11-12
2.1. Absorption…………………………………………………………………………...12
2.2. Distribution…………………………………………………………………………..12
2.3. Metabolism………………………………………………………………………12-14
2.4. Extraction…………………………………………………………………………14-15
3. Materials and method…………………………………………………………. 15-17
3.1. SPE (solid phase extraction) method development ………….17-18
3.1.1. Normal phase………………………………………………………………………..18
3.1.2. Reserve phase……………………………………………………………………….18
3.1.3. Cation exchange…………………………………………………………….…19-21
3.2. Gas chromatography…………………………………………………………21-22
3.2.1. GC/MS…………………………………………………………………………………….22
3.2.2. GC/ECD………………………………………………………………………………….. 22
4. Experimental part………………………………………………………………………..23
4.1. Reagents………………………………………………………………………………...23
4.2. Sampling………………………………………………………………………………….23
4.3. Sampling preparation……………………………………………………………..23
4.4. Solution preparation………………………………………………………….23-25
4.5. Procedure……………………………………………………………………….….25-32
4.6. Chromatographic analysis…………………………………………………..33-34
4.7. Recoveries evaluation……………………………………………………………..34
5. Results and discussion………………………………………………………………….35

iv
5.1. Chromatography results…………………………………………………………..….35
5.1.1. GC-ECD, retention time, linearity, calibration curve permethrin… 36
5.1.2. GC-MS retention time, linearity, calibration curve ………………………37
6. Recoveries……………………………………………………………………………………….38
7. Conclusion ………………………………………………………………………………….……43
8. References ………………………………………………………………………………………44

v
INDEX FIGURES
Figure 1: Structures of the six natural pyrethrins
Figure 2: Permethrin structure
Figure 3: Isomers of permethrin
Figure 4: Pyrethroid effects on neuronal excitability
Figure 5: Metabolic clearance of permethrin
Figure 6: Representation of SPE clean-up procedure
Figure 7: Functional group of cartridge
Figure 8: Scheme of procedure for preliminaries tests
Figure 9: Scheme of derivatization procedure
Figure 10: Scheme of procedure to standardized the method
Figure 11: Scheme of procedure with sample from rats treatment with permethrin
Figure 12: Scheme of procedure with rats treaded with permethrin
Figure 13: Scheme of procedure with urines from rats treated with permethrin
Figure 14: Chromatogram retention time permethrin
Figure 15: Calibration curve of permethrin achieved by the correlation of area versus
concentration
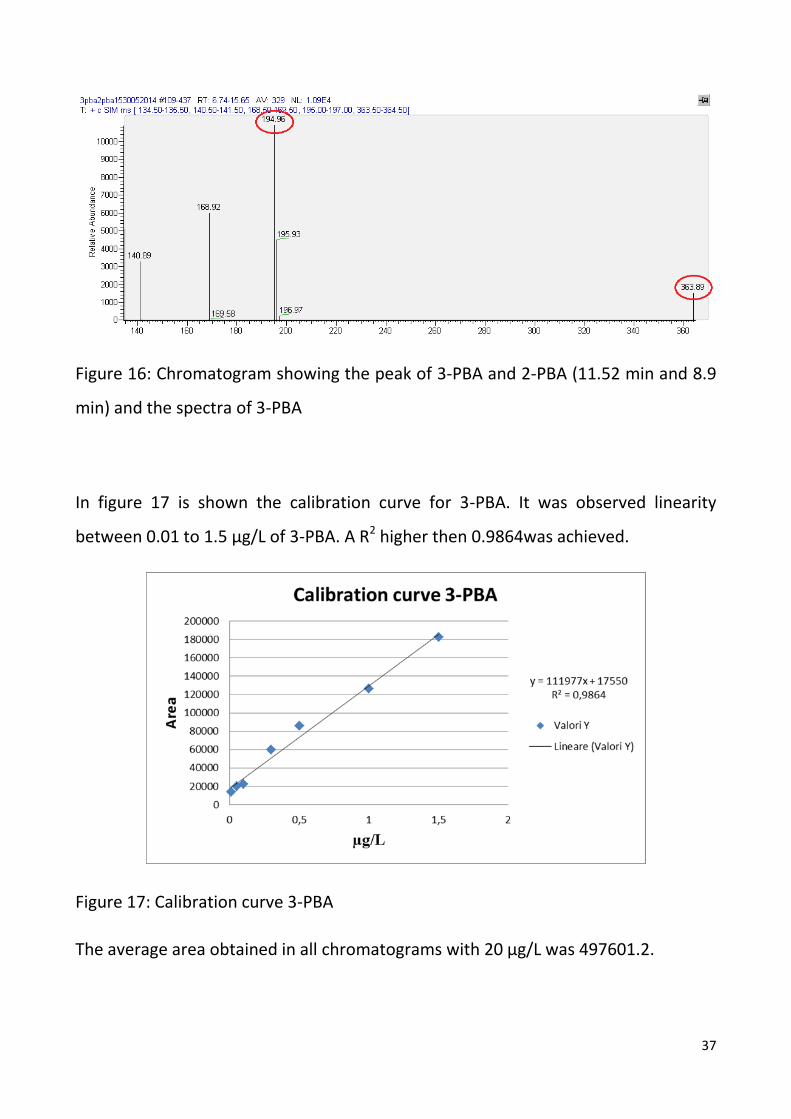
Figure 16: Chromatogram showing the peak of 3-PBA and 2-PBA (11.52 min and 8.9
min) and the spectra of 3-PBA
Figure 17: Calibration curve 3-PBA
Figure 18: Recoveries of 3-PBA obtained in samples with different procedures
Figure 19: Recoveries of 2-PBA obtained with different times in ultrasound
Figure 20: Permethrin concentration in rats brains after 24h and 14 days of exposure
Figure 21: Concentration of 3-PBA in brains after 24 h and after 14 days of exposure
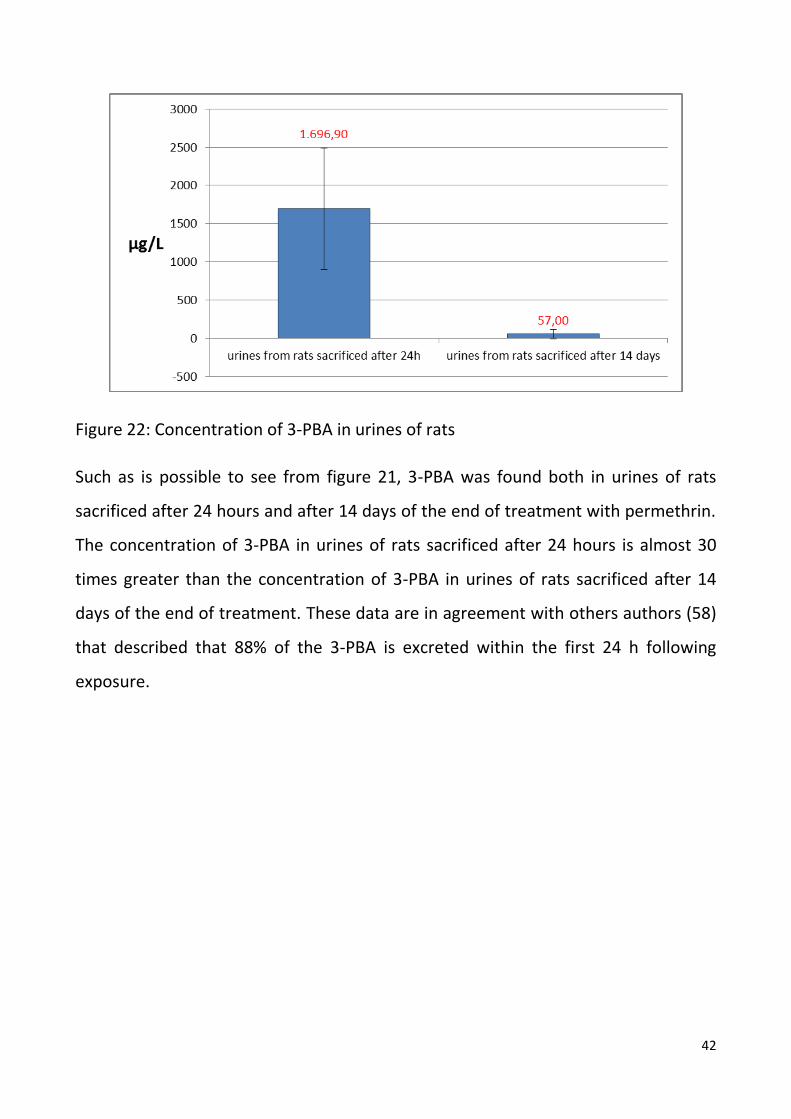
Figure 22: Concentration of 3-PBA in urines of rats

vi
List of abbreviation, acronyms and symbols
FDA: Food and Drugs Administration
CNS: Central Nervous System
WHO: World Health Organization
VGSC: Voltage-gated sodium channel
DA: Dopamine
NO: Nitric oxide
SOD: Superoxide dismutase
NMDA: N-methyl-D- aspartate receptor
3-PBA: 3- phenoxibenzoic acid
ADH: Alcohol dehydrogenase
ALDH: Aldehyde dehydrogenase
SPE: Solid phase extraction
GC: Gas chromatography

1
1. Pyrethroids and Permethrin Synthetic pyrethroids such as, cypermethrin, deltamethrin, permethrin and
cyfluthrin originate from the botanical insecticide pyrethrum, an extract obtained
from the flowers of Chrysanthemum cinerariaefolium. Pyrethrins as one of the
natural esters of pyrethrum and the synthetic pyrethroids are among the
insecticides most often used worldwide (1). Pyrethrins, a single pesticide active
ingredient, contain six components that have insecticidal activity: pyrethrin I,
pyrethrin II, cinerin I, cinerin II, jasmolin I and jasmolin II (Figure 1).
Figure 1: Structures of the six natural pyrethrins.
The insecticidal properties of pyrethrins are derived from ketoalcoholic esters of
chrysanthemic and pyrethroic acids. These acids are strongly lipophilic and rapidly
penetrate many insects and paralyze their nervous system (2). Both pyrethrins and
synthetic pyrethroids are sold as commercial pesticides used to control pest insects
in agriculture, homes, communities, restaurants, hospitals, schools, and as a topical
head lice treatment. Various formulations of these pesticides are often combined
with other chemicals, known as synergists, to increase potency and persistence in
the environment. Formulations that are commercially available include aerosols,

2
dips, emulsifiable concentrates, wettable powders, granules, and concentrates for
ultra-low volume applications targeting mosquitoes. While chemically and
toxicologically similar, pyrethrins are extremely sensitive to light, heat and moisture.
In direct sunlight, half-lives that can be measured in hours. However, the
pyrethroids, the synthetic analogues of naturally occurring pesticides, were
developed to capture the effective insecticidal activity of this botanical insecticide,
with increased stability in light, yielding longer residence times (3). Pyrethroids have
replaced organophosphorus and carbamate insecticides because of their low toxicity
toward mammals and high insecticidal activity.
Permethrin was the first synthetic pyrethroids photostable enough to be used in
agriculture and the most used pyrethroids in USA. Permethrin is an insecticide in the
pyrethroids chemical family (Figure 2).
Figure 2- Permethrin structure
Permethrin was synthesized by replacing the methyl groups with chlorine atoms in
the acid side-chain, which block photochemical degradation on the adjacent double
bond. Permethrin has 4 isomers; the trans-isomer degrades more rapidly than the
toxic cis-isomer and they have a lower toxicity in rats than do the corresponding cis-
isomers (Figure 3).

3
Figure 3: Isomers of permethrin
Permethrin is used as an insecticide or as an insect repellent or insect screen
in agriculture, to protect crops
in agriculture, to kill livestock parasites
for industrial/domestic insect control
in timber treatment
as a personal protective measure (cloth impregnant, used primarily for US
military uniforms and mosquito nets)
in pet flea preventative collars or treatment
Formulations of Permethrin are considered pharmaceuticals, which are regulated by
the United States Food and Drug Administration (FDA) (4). Permethrin comes in
many forms: sprays, dusts, fogs, emulsifiable concentrates and creams. Like all the
pyrethroids, the permethrin belong to a group of chemicals that are neurotoxic and
share a similar mode of action that is distinctive from other classes of insecticides.
There are several ways that the permethrin can enter the body of an organism to
exert their effects. The first mode is non-stereospecific with rapid penetration
through the epidermis, followed by uptake by the blood or hemolymph carrier
proteins and subsequent distribution throughout the body. Pyrethroid diffusion
along the epidermis cells is the main route of distribution to the central nervous

4
system (CNS) after penetration (5). Pyrethroids also can enter the CNS directly via
contact with sensory organs of the peripheral nervous system. The sensory
structures of both invertebrates and vertebrates are sensitive to pyrethroids (6).
Pyrethroids can also enter the body through the airway in the vapour phase, but
such penetration represents only a small contribution due to the low vapour
pressure of pyrethroids. Pyrethroids can also be ingested, and penetration into the
blood-hemolymph through the alimentary canal can play an important role in
toxicity. Because these insecticides are relatively non-volatile, the primary source of
exposure is believed to be through diet. Additional exposure via ingestion of
contaminated household dust may occur after the indoor application of pesticides
such as Permethrin that is the main Pyrethroids used in the home for indoor pest
control, in pet shampoos and treatment for wood furniture (7).
1.1. Mode of action of pyrethroids:
Pyrethroids have been classified toxicologically into two subclasses based on the
induction of either whole body tremors (T syndrome) or a coarse whole body tremor
progressing to sinuous writhing (choreoathetosis) with salivation (CS syndrome)
following near-lethal dose levels in both rats (Rattus norvegicus) and mice (Mus
musculus), and closely follows the chemical structure of the two types of
pyrethroids (8,9). Type I pyrethroids (Pyrethroids lack a cyano group at the “carbon
of the 3-phenoxybenzyl alcohol moiety”) are characterized by the T -syndrome
which consists of aggressive sparring, sensitivity to external stimuli, fine tremors
progressing to whole body tremors and prostration. Type I pyrethroids also elevate
core body temperature, which is attributed to the excessive muscular activity
associated with tremors. Type II pyrethroids (pyrethroids have a cyano group at the
“carbon of the 3-phenoxybenzyl alcohol moiety”) are characterized by the CS
syndrome which is comprised initially of pawing and burrowing behaviour followed

5
by profuse salivation, choreoathetosis, increased startle response, and terminal
chronic seizures. Type II pyrethroids decrease core body temperature, which is
attributed to excessive salivation and wetting of the ventral body surface. There are
a few pyrethroids that produce mixed signs, including both tremors and salivation,
and these are classified accordingly as type I/II (10).
Multiple lines of evidence show that pyrethroids, as a class, do not act in a similar
fashion on the voltage-gated sodium channels, and the classifications of toxicology
are not absolute for either invertebrates or vertebrates (11, 12). Increasing the dose
levels of pyrethrins and pyrethroids results in a proportional increase in motor
activity, which is the classic dose-response effect with respect to neurotoxic
substances. Pyrethroids and permethrin act very quickly to produce symptoms of
lost coordination and paralysis which are known as "the knockdown effect", and
which are often accompanied by spasms and tremors that induce intense repetitive
activation in sense organs and in myelinated nerve fibres. The spasms can be violent
and can cause the loss of extremities, such as legs and wings in insects. Physiological
and biochemical studies, of pyrethroids show that in both vertebrates and
invertebrates the primary mode of action is the binding of the voltage-gated sodium
channel (6, 12-13). Mammals, unlike insects, however, have multiple isoforms of
the sodium channel that vary by tissue type, as well as biophysical and (14)
pharmacological properties. Type I pyrethroids modify the sodium channels such
that there is a slight prolongation of the open time, which results in multiple long
action potentials. Type II pyrethroids significantly prolong channel open time,
resulting in an increased resting membrane potential and often inducing a
depolarizationdependent block of action potentials. Type I pyrethroids cause
multiple spike discharges, while type II pyrethroids cause a stimulus-dependent
depolarization of the membrane potential which reduces the amplitude of the
action potential, and a loss of electrical excitability in both vertebrates and

6
invertebrates (6, 15). The toxic action is exerted by preventing the deactivation or
closing of the gate after activation and membrane depolarization. This results in
destabilizing the negative after potential of the nerve due to the leakage of Na+ ions
through the nerve membrane. This causes hyperactivity by delaying the closing
sodium channels which allows a persistent inward current to flow after the action
potential, causing repetitive discharges that can occur either spontaneously or after
a single stimulus. The differences between type I and II pyrethroids are expressed in
the motor nerve terminals, where type I cause presynaptic repetitive discharges,
and type II cause a tonic release of transmitter indicative of membrane
depolarization (16, 17). Type II pyrethroids are a more potent toxicant than type I in
depolarizing the nerves (17). Type II pyrethroids are associated with faster
activation-deactivation kinetics on the Na+ sodium channels than type I pyrethroids
in vertebrates (12). The higher toxicity of type II pyrethroids is mostly attributed to
the hyper-excitatory effect on the axons which results from their stronger
membrane depolarizing action. Type I pyrethroids modify the sodium channels in
the closed state, while type II pyrethroids modify the open but not inactivated
sodium channels (18). However, this relationship does not always hold true; for
example the cis-permethrin interact with both closed and open sodium channels,
but bind with greater affinity to the open state (19-21) (Figure 4)
Figure 4- Pyrethroid effects on neuronal excitability.

7
Pyrethroids affect the voltage-sensitive calcium channels, y-aminobutyric acid
(GABA) receptors and GABA-activated channels, and voltage-sensitive chloride
channel (22, 23). Type II pyrethroids are more potent enhancers of Ca2+ influx and
glutamate release under depolarizing conditions than type I pyrethroids (11, 19).
The GABA receptor-chloride ionophore complex is also a target of type II
pyrethroids. GABA is an inhibitory transmitter in the synapse of the CNS of both
vertebrates and invertebrates. Pyrethroids inhibit the Ca-ATPase, Ca-Mg ATPase
neurotransmitters and the peripheral benzodiazepine receptors, (24) but their
action on these sites is minor compared with the voltage-gated sodium channels.
The effects on these (22) sites could, however, enhance the uncontrolled
convulsions and tremors. These changes in synaptic transmission may alter neuronal
function and may contribute to toxicity and neurodegenerative pathology (24).
1.2. Health effect and toxicity of permethrin
The environmental presence of this pesticide as well as of other insecticides and
fungicides has been correlated with neurological disorders such as Alzheimer’s
disease, Parkinson’s disease or dementia in old age (25). Furthermore previous
studies showed that Permethrin treatment in rats induced oxidative stress, immune
system imbalance, cardiac and neuronal damage and cognitive deficits (16). The
LD50 (the lethal dose that kills 50% of a population of test animals) for Permethrin is
variable, ranging from 430 mg/kg body weight to over 4000 mg/kg for rats (26).
Permethrin induces neurotoxicity, mutagenicity, cancer, immune system effects,
cardiac toxicity and other effects. At relatively high doses, neurotoxic symptoms in
mammals include tremors, loss of coordination, hyperactivity and an increase in
body temperature (26). Permethrin leads to neuronal cell death in various parts of
the brain, which could lead to motor deficits, learning and memory dysfunction.
Ingestion of even small doses of Permethrin reduces the ability of immune system
8
cells to recognize and respond to foreign proteins. Doses equivalent to 1/100 of the
LD50 inhibited T-Lymphocytes and Natural Killer (NK) cells by over 40% (27).
Permethrin affects both male and female reproductive systems too; it binds to
receptors for androgen (28). Permethrin was found to have mutagenic effects; in the
human cell cultures, and caused an increase in chromosome aberrations,
chromosome fragments and DNA lesions (26). Moreover, the World Health
Organization (WHO) reported that permethrin increased the frequency of lung
tumors in female mice, increasing the expression of a gene involved with the
proliferation of cells in mammary gland (29). Permethrin was shown to increase the
risk of prostate cancer in men with a family history of prostate cancer (30).
1.3. Brain toxicity:
Epidemiologic evidence suggests that environmental factors are an important cause
of neurodegenerative diseases and psychiatric disorders (31). Contaminants
accumulated through the food chain and environmental exposure can modify gene
expression changing protein synthesis in different tissues (32). Pesticides are
identified as one of the risk factors involved, through epigenetic mechanisms, in the
regulatory processes controlling gene expression leading to the initiation and
progression of age-related diseases (32). Even low levels of pesticides may
negatively affect the brain inducing loss of neurons that leads to cognitive decline,
impaired memory and attention, and motor function (31).These neuro behavioral
disturbances may be associated with neurological disorders such as Alzheimer's
disease, Parkinson's disease or dementia in old age (31). Permethrin is able to
induce impairment of striatal mitochondrial function, changes in the immune
system and oxidative stress in adult rats treated sub-chronically with a low dose of
this pesticide (33). This pesticide could be one of the factors involved in the onset of
neurodegenerative diseases, the results are discussed considering the variations in

9
the levels of neurodegenerative markers in cerebral areas, in plasma and in
leukocytes. A developing brain is much more susceptible to the toxic effects of
chemicals than an adult brain. This vulnerability period extends from fetal
development through infancy, childhood and adolescence. The biological effects of
pyrethroids are in part caused by their ability to alter neuronal activity since they
interact with specific binding sites of voltage-gated sodium channel (VGSC) (VGSCs
are the primary molecular targets for pyrethroids insecticidal activity and their acute
neurotoxicity in vertebrates) (34) slowing the rate of VGSC closing, prolonging the
inward sodium conductance and then shifting the membrane to more polarized
potentials (35). A secondary consequence to cell membrane depolarization is an
increased Ca2+ influx into the neurons through voltage-gated calcium channel
(VGCC) that contributes to impact neuronal synaptic plasticity of neurons. Lower
Dopamine (DA) levels and accelerated DA turnover following early life permethrin
treatment was also observed (35). Midbrain dopamine (DA) neurons are formed in
the ventral tegmentum during development. DA cells have been extensively studied,
mostly because of their critical involvement in disorders such as Parkinson’s disease
and schizophrenia. The pesticides may negatively affect the brain inducing loss of
neurons that leads to cognitive decline, impaired memory and attention, and motor
function (35). Recently, showed that when permethrin was administered during
early life (from 6th to 21st day), alterations in striatum (36), in heart and in plasma
(37), were observed during adult age. The dopamine turnover and oxidative stress
measured in adult rats treated with a low dose of permethrin during early life (1/50
LD50, from 6th to 21st day of life) (35), can be associated with other signs
characteristic of neurological disorders. With this aim, the levels of Nurr1, a
transcription factor essential for the maintenance of dopaminergic neurons, and
other markers correlated with neurodegeneration such as glutamate, calcium, nitric
oxide (NO), superoxide dismutase (SOD) were evaluated. Some results show that

10
early life permethrin treatment reduces Nurr1 mRNA and protein expression as well
as calcium and NO levels in striatum from adult rats. An imbalance in glutamate,
calcium and NO levels was measured in hippocampus from treated rats, while no
changes in prefrontal cortex were detected. Calcium levels measured in leukocytes
from treated rats resulted decreased, as well as calcium and SOD in plasma, in which
increased NO levels were found. The hypothesize is that the intake of this pesticide
could be one of the factors involved in the onset of neurodegenerative diseases, the
results are discussed considering the variations in the levels of neurodegenerative
markers in cerebral areas, in plasma and in leukocytes. Nurr1 was chosen because it
is a nuclear transcription factor regulating the development and maintenance of
dopaminergic neurons, in limbic areas, in the ventral DA neurons, and in cortical
areas, where its distribution overlaps with DA containing neurons (38). It is
important for neuronal plasticity and has been reported decreased in PD as well as
modified in other neuronal disorders (39). Nurr1 can modulate the NF-kB ("nuclear
factor kappa-light-chain-enhancer of activated B cells") activity in brain microglia,
and since the effect of permethrin treatment can trigger an oxidative stress
imbalance on redox systems (40), NF-kB and Nrf2(NF-E2-related factor 2), two of the
main transcription factors regulating the genes involved in pro-inflammatory and
anti-inflammatory responses respectively, were studied. Moreover NF-kB is even
modulated by calcium; in fact this element is a common second messenger whose
concentration within a cell is finely modulated to promote many physiological
functions as hormonal release, muscular contraction, and gene expression (41).
Calcium is linked with membrane polarization and therefore related with neuronal
homeostasis and brain senescence (42). In neurons the calcium channels function is
depending on their position, at presynaptic level, they modulate the
neurotransmitters release, while at post-synaptic level they can modulate learning
and memory processes (43), in fact an increase in the luminal level of calcium is

11
correlated with the learning and memory deficits that occur during the onset of
Alzheimer disease (43). Moreover, together with the up regulation of dopamine
synthesis and the presence of α-synuclein aggregates, high cytoplasmic Ca2+ levels
led to selective death of substantia nigra dopaminergic neurons, causing the typical
motor deficits of Parkinson’s disease. Neurotransmitters as glutamate induce an
influx of calcium by receptor-operated channels such as NMDA receptors (N-methyl-
D-aspartate receptor) at post-synaptic sites (43) where an abnormal release of
glutamate causes their over-activation that occurs in excessive accumulation of
intracellular calcium. NMDA receptor anchored to NO synthase modulate the
production of nitric oxide (NO), a neural modulator involved in neurotransmitters
release, neuronal excitability, learning and memory (44). Therefore nitric oxide
overproduction due to glutamate triggered toxicity, together with the NO released
by astrocytes and microglia with response to inflammatory stimuli, contribute to the
oxidative damage reported in post mortem studies, in vitro and in vivo Parkinson’s
disease models (45) and also in the neuropathology of Alzheimer disease (46).
2. Permethrin kinetics
2.1. Absorption:
Absorption of pyrethroids through the gastrointestinal tract and the skin is variable
and depends on the vehicle of administration. For the general population the main
route of exposure to agricultural pesticides is through residues in food, studies
carried out on workers suggest that, similarly to any other pesticide, dermal
exposure is the most significant route of absorption for agricultural applicators and
sprayers in fact minimally it is absorbed through intact skin (studies involving skin
applications of Permethrin indicated that about 0.5% of the applied dose was
absorbed dermally) (47). However the penetration of pyrethroids into the skin is
slow and may cause a typical local paraesthesia (tingling and burning sensations),

12
which may persist for several hours. Can be absorbed even from the
gastrointestinal tract and by inhalation of dust and spray mist. Animal studies
showed quick and substantial absorption of Permethrin upon ingestion (48). In one
study of rats, about 60% of the orally administered dose was absorbed with an
absorption half-life of less than one hour (49).
2.2 Distribution:
After absorption, pyrethroids are rapidly distributed throughout the body, mainly in
the adipose tissue, stomach, intestine, liver and kidneys and the nervous system.
Peak concentrations measured in plasma, nerve tissue, liver, and kidneys occurred
around four hours after ingestion. Levels found in nervous tissues were generally
higher compared with in plasma (50). A human case study involving an intentional
ingestion of Permethrin showed a similar distribution pattern with a peak
Permethrin concentration found in blood three to four hours after ingestion (51).
2.3. Metabolism:
Several studies done using rats, goats, cows, and hens, have demonstrated that the
Permethrin were metabolized quickly in the liver. Hydrolysis, hydroxylation,
oxidation, and conjugation are all involved in the process of metabolism (48) (52).
Permethrin itself is considered the only compound of toxicological significance (48)
(53) even if were identified several metabolites of permethrin. Permethrin is easily
hydrolysed, and the hydrolysis product is also easily oxidized in rats in vitro.
Permethrin is converted to PBAlc (3-Phenoxybenzyl alcohol) and further to PBAld
(3-phenoxybenzylaldehyde) and 3-phenoxybenzoic acid (3-PBA) by mixed function
oxidase in rats. Trans-isomers are more rapidly metabolized by hydrolytic (esterase)
pathways while cis-isomers are preferentially metabolized by slower oxidative
(P450) pathways (50). The cis-isomer of permethrin, which is metabolized

13
predominantly by P450’s in laboratory animals (50), was not detectably
metabolized in human liver microsomes in the presence or absence of an NADPH
regenerating system (52). Oxidations of PBAlc and PBAld are mainly mediated by
mixed function oxidase, in addition to ADH (alcohol dehydrogenase) and ALDH
(aldehyde dehydrogenase), which were shown to contribute to the oxidation by
Hodson and co-workers (2002; 2003). The alcohol generated from permethrin,
PBAlc is oxidized to PBAld, and the aldehyde is further oxidized to 3-PBA by rat liver
microsomes. The alcohol and aldehyde moieties of pyrethroids are mainly
metabolized by oxidation to the corresponding aldehydes and carboxylic acids by
ADH and ALDH in mammalian species (52). The terminal phase of pyrethroids
metabolism is the formation of glucuronide and glycine conjugates (54). These
pathways appear similar between laboratory animals and humans. Common
metabolites are found in the urine of both laboratory animals and humans (53, 54).
The 3-PBA metabolite is common to 10 of the 18 pyrethroids registered in the
United States, including permethrin, cypermethrin, deltamethrin, esfenvalerate
(55). Both type I and type II pyrethroids undergo ester hydrolysis which results in a
cyclopropyl acid and either 3-phenoxybenzyl alcohol (type I) or a cyanohydrin (type
II) (56). The aromatic alcohol is further oxidized to 3-PBA while the cyanohydrin is
able to spontaneously rearrange to the phenoxybenzaldehyde in aqueous solutions
and then undergo hydroxylation to 3-PBA. 3-PBA is a nonspecific urinary
metabolite, meaning that it is a breakdown product common to most of the
pyrethroids with the exception of cyfluthrin. It is also the most frequently detected
urinary metabolite in humans (Figure 5). Since 3-PBA is a common metabolite for
most pyrethroids pesticides, it has been used as a marker of pyrethroids exposure
by the Center for Disease Control and Prevention in the National Health and
Nutrition Examination Survey study (57). The elimination half-life of about 8 h
14
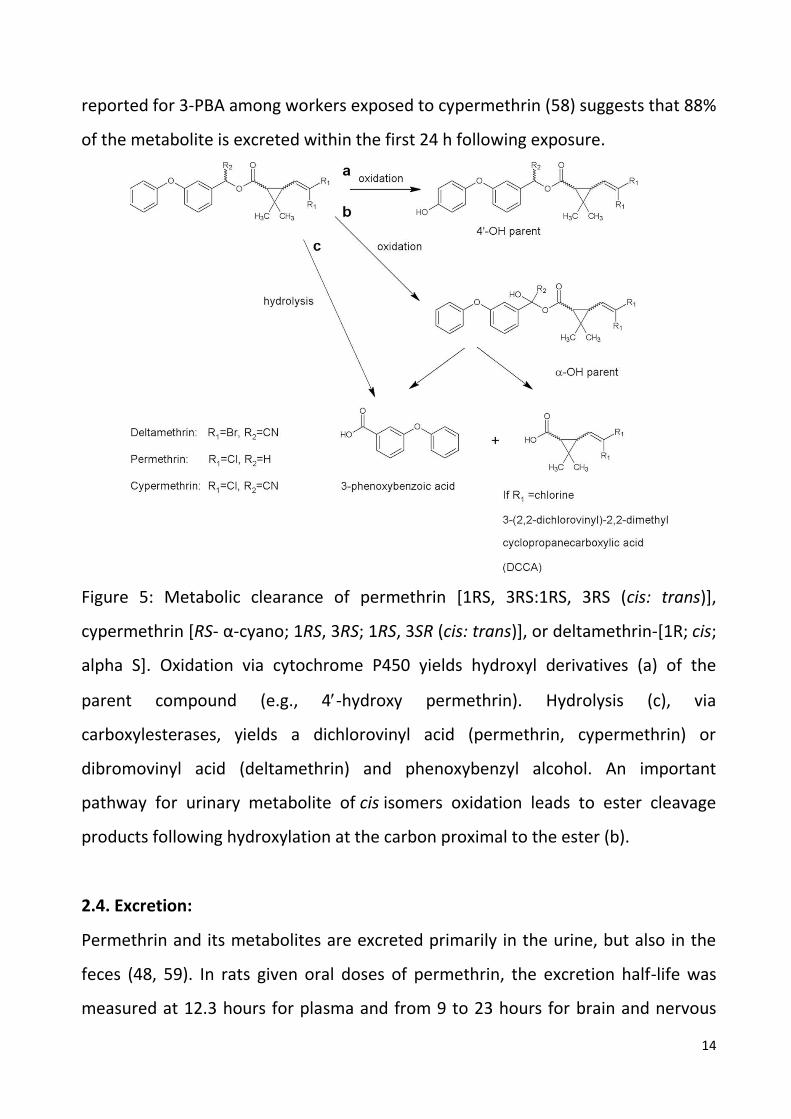
reported for 3-PBA among workers exposed to cypermethrin (58) suggests that 88%
of the metabolite is excreted within the first 24 h following exposure.
Figure 5: Metabolic clearance of permethrin [1RS, 3RS:1RS, 3RS (cis: trans)],
cypermethrin [RS- α-cyano; 1RS, 3RS; 1RS, 3SR (cis: trans)], or deltamethrin-[1R; cis;
alpha S]. Oxidation via cytochrome P450 yields hydroxyl derivatives (a) of the
parent compound (e.g., 4-hydroxy permethrin). Hydrolysis (c), via
carboxylesterases, yields a dichlorovinyl acid (permethrin, cypermethrin) or
dibromovinyl acid (deltamethrin) and phenoxybenzyl alcohol. An important
pathway for urinary metabolite of cis isomers oxidation leads to ester cleavage
products following hydroxylation at the carbon proximal to the ester (b).
2.4. Excretion:
Permethrin and its metabolites are excreted primarily in the urine, but also in the
feces (48, 59). In rats given oral doses of permethrin, the excretion half-life was
measured at 12.3 hours for plasma and from 9 to 23 hours for brain and nervous

15
tissue, including the medulla oblongata (60). 3-PBA is the main metabolite of the
permethrin and other pyrethroids resulting from the oxidation of the 3-
phenoxybenzyl alcohol. Its concentration in the urine is the most representative
marker for pyrethroids exposure in rodents (61) and humans (62).
3. Materials and methods
3.1. SPE (Solid-phase extraction) Method Development
Extraction methods:
Solid-phase extraction (SPE) is an extraction method that uses a solid phase and a
liquid phase to isolate one, or one type, of analyte from a solution. It is usually used
to clean up a sample before using a chromatographic or other analytical method to
quantitate the amount of analyte(s) in the sample. It is a fast method, easy to
handle for analysis in a variety of domains:
The common SPE applications are:
• Pharmaceutical compounds and metabolites in biological fluids;
• Drugs of abuse in biological fluids;
• Environmental pollutants in drinking and waste water;
• Pesticides and antibiotics in food/agricultural matrices;
• Desalting of proteins and peptides;
• Fractionation of lipids;
• Water and fat soluble vitamins
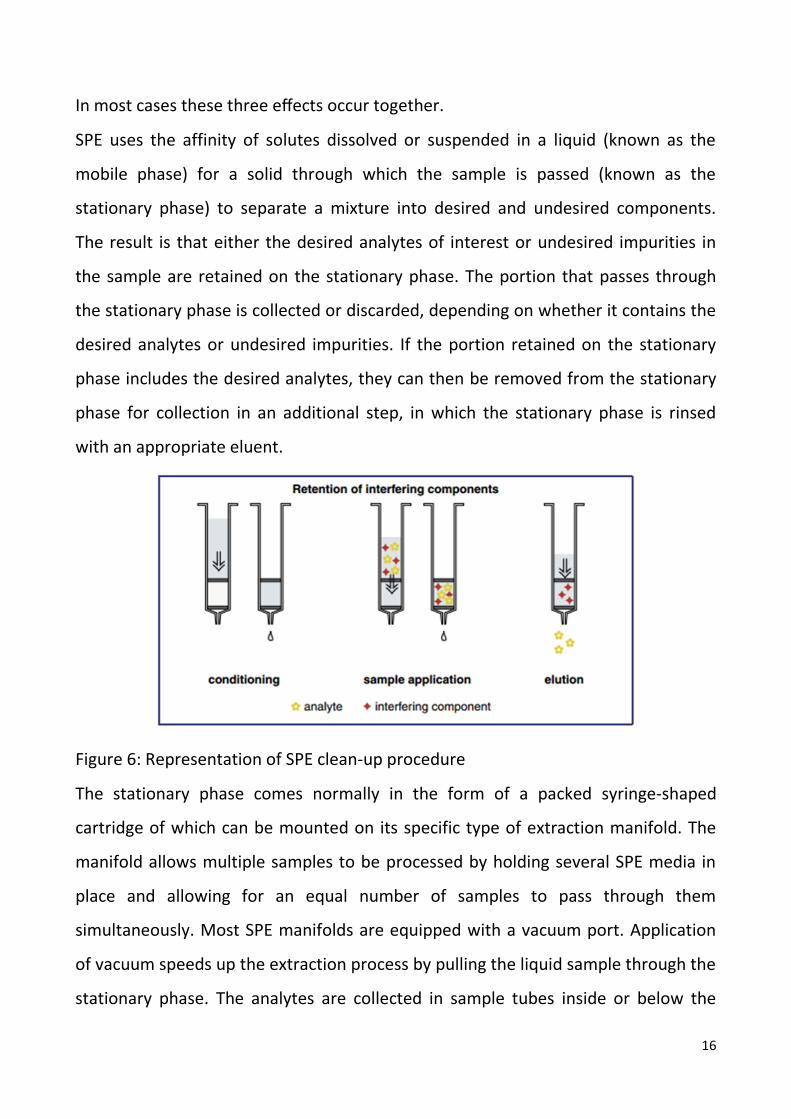
The SPE process basically consists in four different steps: conditioning, sample
addition, washing and elution (63) (Figure 6).
In general, SPE can be used for three important purposes in up-to-date analyses:
• Concentration of the analyte;
• Removal of interfering substances;
• Changing the matrix of the analyte as needed for subsequent analyses
16
In most cases these three effects occur together.
SPE uses the affinity of solutes dissolved or suspended in a liquid (known as the
mobile phase) for a solid through which the sample is passed (known as the
stationary phase) to separate a mixture into desired and undesired components.
The result is that either the desired analytes of interest or undesired impurities in
the sample are retained on the stationary phase. The portion that passes through
the stationary phase is collected or discarded, depending on whether it contains the
desired analytes or undesired impurities. If the portion retained on the stationary
phase includes the desired analytes, they can then be removed from the stationary
phase for collection in an additional step, in which the stationary phase is rinsed
with an appropriate eluent.
Figure 6: Representation of SPE clean-up procedure
The stationary phase comes normally in the form of a packed syringe-shaped
cartridge of which can be mounted on its specific type of extraction manifold. The
manifold allows multiple samples to be processed by holding several SPE media in
place and allowing for an equal number of samples to pass through them
simultaneously. Most SPE manifolds are equipped with a vacuum port. Application
of vacuum speeds up the extraction process by pulling the liquid sample through the
stationary phase. The analytes are collected in sample tubes inside or below the
17
manifold after they pass through the stationary phase. Solid phase extraction
cartridges and disks are available with a variety of stationary phases, each of which
can separate analytes according to different chemical properties. Most stationary
phases are based on silica that has been bonded to a specific functional group.
Sorbent selection requires consideration of sample volume, the nature of the
analyte, analyte concentration and the inherent properties of the sorbent itself.
Silica and polymers are the most popular sorbents used for SPE. Polymer loading
capacities are higher than silica sorbents; however, silica sorbents exhibit greater
selectivity. During the drying step, the risk of oxidation of the analytes could be
minimized by the addition of anti-oxidant agents, such as ascorbic acid (64). In
addition, sodium chloride (NaCl) can be added to the sample to improve the
extraction efficiency (65). SPE cartridges should not be allowed to dry at any point
during conditioning and sample loading, in order to keep the sorbent ligands active
and prevent air from trapping in the cartridges. A comparison between automated
SPE-GC-ECD with non-automated SPE-GC-ECD in the extraction of some pyrethroids
from surface water showed that automated SPE could be used successfully for
extraction and pre-concentration of pesticides (66).
3.1.1. Normal Phase SPE procedure (Non-polar Sample Matrix)
A typical solid phase extraction involves four basic steps. First, the cartridge is
equilibrated with a non-polar solvent or slightly polar, which wets the surface and
penetrates the bonded phase. Then water, or buffer of the same composition as
the sample, is typically washed through the column to wet the silica surface. The
sample is then added to the cartridge. As the sample passes through the stationary
phase, the analytes in the sample will interact and retain on the sorbent while the
solvent, salts, and other impurities pass through the cartridge. After the sample is
loaded, the cartridge is washed with buffer or solvent ton remove further

18
impurities. Then, the analyte is eluted with a non-polar solvent or a buffer of the
appropriate pH. A stationary phase of polar functionally bonded silicas with short
carbons chains frequently makes up the solid phase. This stationary phase will
adsorb polar molecules which can be collected with a more polar solvent (67).
3.1.2. Reversed phase SPE (Aqueous Sample Matrix)
Reversed phase SPE separates analytes based on their polarity. The stationary
phase of a reversed phase SPE cartridge is derivatized with hydrocarbon chains,
which retain compounds of mid to low polarity due to the hydrophobic effect. The
analyte can be eluted by washing the cartridge with a non-polar solvent, which
disrupts the interaction of the analyte and the stationary phase (67). A stationary
phase of silicon with carbon chains is commonly used. Relying on mainly non-polar,
hydrophobic interactions, only non-polar or very weakly polar compounds will
adsorb to the surface (67).
3.1.3. Cation Exchange
Cation exchange sorbents are derivatized with functional groups that interact and
retain positively charged cations, such as bases. Strong cation exchange sorbents
contain aliphatic sulfonic acid groups that are always negatively charged in aqueous
solution, and weak cation exchange sorbents contain aliphatic carboxylic acids,
which are charged when the pH is above about 5. Strong cation exchange sorbents
are useful because any strongly basic impurities in the sample will bind to the
sorbent and usually will not be eluted with the analyte of interest; to recover a
strong base a weak cation exchange cartridge should be used. To elute the analyte
from either the strong or weak sorbent, the stationary phase is washed with a
solvent that neutralizes ionic interaction between the analyte and the stationary
phase (67).
For this study was used:

19
Selectivity: strata™-X-C Strong Cation Exchange and Reversed Phase (Figure 7)
Figure 7: Functional group of cartridge
Particle size (μm) 33
Pore size (Å) 85
Surface area (m2 /g) 800
pH stability 1-14
Ionic capacity 1 meq/g
Cleaner Reproducible Extractions:
Unlike traditional silica-based mixed mode sorbents that are blended, strata-X-C
has a strong cation exchange group uniformly bonded on the polymeric surface
completely eliminating recovery or reproducibility problems. The strong cation
exchange mechanism gives consistent and extremely clean extracts from biologi-
cal matrices such as plasma and urine since hydrophobic contaminants can be
completely removed by using 100 % organic wash solvents.
3.2. Gas Chromatography
Gas Chromatography (GC or GLC) is a commonly used analytic technique in many
research and industrial laboratories for quality control as well as identification and
quantitation of compounds in a mixture. GC is also a frequently used technique in
many environmental and forensic laboratories because it allows for the detection
of very small quantities. A broad variety of samples can be analysed as long as the
compounds are sufficiently thermally stable and volatile. A mobile and a stationary
phase are required for this technique. The mobile phase (=carrier gas) is comprised

20
of an inert gas i.e., helium, argon, or nitrogen. The stationary phase consists of a
packed column where the packing or solid support itself acts as stationary phase, or
is coated with the liquid stationary phase (=high boiling polymer). Most analytical
gas chromatographs use capillary columns, where the stationary phase coats the
walls of a small-diameter tube directly (i.e., 0.25 µm film in a 0.32 mm tube). The
separation of compounds is based on the different strengths of interaction of the
compounds with the stationary phase (“like-dissolves-like”-rule). The stronger the
interaction is, the longer the compound interacts with the stationary phase and
more time it takes to migrate through the column (=longer retention time).
The factors which influence the separation of the components are:
Boiling point:
The boiling point of a compound is often related to its polarity. The lower the
boiling point is, the shorter is the retention time because the compound will spent
more time in the gas phase. That is one of the main reasons why low boiling
solvents (i.e., diethyl ether, dichloromethane) are used as solvents to dissolve the
sample. The temperature of the column does not have to be above the boiling
point because every compound has a non-zero vapour pressure at any given
temperature.
The polarity of components versus the polarity of stationary phase on column:
If the polarity of the stationary phase and compound are similar, the retention time
increases because the compound interacts stronger with the stationary phase. As a
result, polar compounds have long retention times on polar stationary phases and
shorter retention times on non-polar columns using the same temperature.
Column temperature:
An excessively high column temperature results in very short retention time but
also in a very poor separation because all components mainly stay in the gas phase.
If the compound does not interact with the stationary phase, the retention time

21
will decrease. At the same time, the quality of the separation deteriorates, because
the differences in retention times are not as pronounced anymore.
Carrier gas flow rate:
A high flow rate reduces retention times, but a poor separation would be observed
as well. Like above, the components have very little time to interact with the
stationary phase and are just being pushed through the column.
Column length:
A longer column generally improves the separation. The trade-off is that the
retention time increases proportionally to the column length and a significant peak
broadening will be observed as well because of increased longitudinal diffusion
inside the column.
Amount of material injected:
Ideally, the peaks in the chromatogram display a symmetric shape (Gaussian curve).
If too much of the sample is injected, the peaks show a significant tailing, which
causes a poorer separation. Most detectors are relatively sensitive and do not need
a lot of material in order to produce a detectable signal.
3.2.1. GC-MS (Gas chromatography mass spectrometry)
Gas chromatography mass spectrometry (GC/MS) is an instrumental technique,
comprising a gas chromatograph (GC) coupled to a mass spectrometer (MS), by
which complex mixtures of chemicals may be separated, identified and quantified.
This makes it ideal for the analysis of the hundreds of relatively low molecular
weight compounds found in environmental materials. In order for a compound to
be analysed by GC/MS it must be sufficiently volatile and thermally stable. In
addition, functionalised compounds may require chemical modification
(derivatization), prior to analysis, to eliminate undesirable adsorption effects that
would otherwise affect the quality of the data obtained. Samples are usually

22
analysed as organic solutions consequently materials of interest (e.g. soils,
sediments, tissues etc.) need to be solvent extracted and the extract subjected to a
clean-up before GC/MS analysis is possible. The sample solution is injected into the
GC inlet where it is vaporized and swept into a chromatographic column by the
carrier gas (usually helium). The sample flows through the column and the
compounds comprising the mixture of interest are separated by virtue of their
relative interaction with the coating of the column (stationary phase) and the
carrier gas (mobile phase). The latter part of the column passes through a heated
transfer line and ends at the entrance to ion source where compounds eluting from
the column are converted to ions. The next component is a mass analyser (filter),
which separates the positively charged ions according to various mass related
properties depending upon the analyser used. After the ions are separated they
enter a detector the output from which is amplified to boost the signal. The
detector sends information to a computer that records all of the data produced,
converts the electrical impulses into visual displays and hard copy displays. In
addition, the computer also controls the operation of the mass spectrometer.
3.2.2. GC-ECD (Gas chromatography Electron capture detectors)
Electron capture detectors (ECD) are typically used in environmental testing for
detecting PCB’s, organochlorine pesticides, herbicides and various halogenated
hydrocarbons. ECD consists of a cavity that contains two electrodes and a radiation
source that emits –radiation. The collision between electrons and the carrier gas
(methane plus an inert gas) produces a plasma-containing electrons and positive
ions. If a compound is present that contains electronegative atoms, those electrons
will be “captured” to form negative ions and the rate of electron collection will
decrease. The detector is extremely selective for compounds with atoms of high
electron affinity, but has a relatively small linear range.
23
4. Experimental Part
4.1. Reagents
The reagents used were:
n-Hexane [ purity 99%], acetonitrile (ACN) [purity 99.9%] , magnesium sulphate
(MgSO4 ), sodium acetate (CH3COONa), chloridic acid (HCl) [purity 36.5-38%],
potassium hydroxide (KOH), ethyl acetate (CH2COOC2H5) [purity 99.8%], methanol
(CH3OH), ammonium hydroxide (NH4OH) [purity 31.2%] pH 10, methanol 5% in
ethyl acetate [ purity 99.5%], hexafluoro-2-propanol (HFEIP) [purity 99.8%] , N,N'-
Diisopropylcarbodiimide (DIC) [ purity 99%], potassium carbonate (K2CO3).
4.2. Sampling
7 Female rats were treated with permethrin from 6 to 21 days of life. Then 4 of
them were sacrificed the day after (22 days of life) and the other 3, 14 days after
the treatment (35 days of life). Hearts and urine were collected (data of the
collection 29/10/2013) from these rats.
The samples were at -20°C until analysis, which were made at room temperature.
4.3. Sample preparation
In order to carry out this study, samples (rat's brain) have been homogenized with a
drill by a Torax equipment and preserved in approximately 5mL of ACN at -20°C. In
order to determinate the concentrations of 3-PBA, 2-PBA and permethrin, several
tests were performed.
4.4. Solution preparation
12.09 mg of permethrin have been weighed in a 5 mL flacks.
With this amount of permethrin were prepared:
Permethrin solution 1 (1209mg/L)

24
Permethrin solution 2 (10mg/L)
Permethrin solution 3 (500µg/L)
Permethrin solution 4 (625µg/L)
Permethrin solution 5 (125µg/L)
Preparation of microvials for calibration curve:
Two series of standards for calibration curve were prepared:
Concentrations: 0.3mg/L, 0.4mg/L, 0.6mg/L, 0.7mg/L, 0.8mg/L and 0.9mg/L;
Concentrations: 0.5mg/L; 0.4mg/L; 0.3mg/L; 0.2mg/L; 0.1mg/L; 0.05mg/L;
0.02mg/L
Buffer solution pH7:
2.86mL of glacial acetic acid have been taken, put in a flask and diluted with
H2O until 500mL (solution A)
One the other hand 6.8g of sodium acetate have been taken, put in a flask
and diluted with H2O until 500mL (solution B)
The buffer solution has been prepared with 89.25 mL from solution A and
160.75mL from solution B
Moreover some solutions have been prepared with 3-PBA and with 2-PBA:
• 3-PBA solution 1: 2000mg/L,
• 3-PBA solution 2: 10mg/L
• 3-PBA solution 3: 50µg/L
• 3-PBA solution 4: 5 µg/L
• 3-PBA solution 5: 2 µg/L
• 2-PBA solution 1: 2000 mg/L
• 2-PBA solution 2: 10mg/L
• 2-PBA solution 3: 50µg/L
For 3PBA and 2PBA calibration curves were prepared:
Concentrations 3PBA: 0.01µg/L, 0,05µg/L, 0,1µg/L, 0,3µg/L, 0,5µg/L, 1µg/L, 1,5µ/L
25
Concentration 2PBA; 20µg/L
Ions selected for the identification of metabolites 3-PBA and 2-PBA are: 135:169;
141; 195; 197. The most abundant ion for metabolite 3-PBA is 364 the most
abundant ion for metabolite 2-PBA is 195.
A NH4OH solution with pH 10 was prepared through the dilution of pure NH4OH.
4.5. Procedure
For preliminary studies only the buffer solution was used:

26
Figure 8: Scheme of procedure for preliminaries tests
The solid phase extraction (SPE) consisted in:
Conditioning:
5 mL of ethyl acetate
5 mL MeOH
5 mL H20

27
5 mL of HCl
Add sample
5 mL of sample
Cleaning
5 mL of HCl
5 mL of NH4OH
Drying
Elution:
5 mL of 5% of MeOH in AcOEt
Before injection in GC a derivatization was performed, the procedure is described in
figure 9
Derivatization reactions are meant to transform an analyte for detectability in Gas
Chromatography (GC) or other instrumental analytical methods. Derivatization in GC
analysis can be defined as a procedural technique that primarily modifies an
analyte’s functionality in order to enable chromatographic separations. A modified
analyte in this case will be the product, which is known as the derivative. The
derivative may have similar or closely related structure, but not the same as the
original non-modified chemical compound. Volatility of sample is a requirement for
GC analysis. Derivatization will render highly polar materials to be sufficiently
volatile so that they can be eluted at reasonable temperatures without thermal
decomposition or molecular re-arrangement.

28
Figure 9: Scheme of derivatization procedure
Several brains obtained from rats, not treated with permethrin, were used in order
to standardize the method. The general procedure with brains is described in figure
10

29
Figure 10: Scheme of procedure to standardized the method
During the tests several changes have been carried to the method, namely:

30
At first samples have been filtrated with paper filter in the beginning of test.
Then the aqueous phase was filtrated in order to prevent a loss of
permethrin.
The minutes of ultrasound were increased from 10’ to 20’ to have clear
separation between the aqueous phase and supernatant.
The procedure of derivatization has been modified; 150 µL of n-hexane to
improve the concentration of 3-PBA and 2-PBA.
In other to verify the method, several tests were performed using the samples from
rats treated with permethrin that are described in Figure 11

31
Figure 11: Scheme of procedure with sample from rats treatment with permethrin
The permethrin, 3-PBA and 2-PBA -data from brains from treated rats were obtained
with the procedure described in figure 12.
A control with buffer and enzyme but without sample was performed. Only results
with higher values than the achieved by the control was processed.

32
Figure 12: Scheme of procedure with rats treaded with permethrin

33
3-PBA values from urines were obtained with the procedure described in figure 13.
Figure 13: Scheme of procedure with urines from rats treated with permethrin
4.6. Chromatographic analysis
Permethrin was analyzed using a Shimadzu GC-2010 with ECD apparatus equipped
with a capillary column ZB-XLB (30 m x 0.25 mm x 0, 25 mm) from Phenomenox. A
volume of injection 1µL was used. The oven temperature was programmed starting
at 60°C and held for 1’min followed by increase of 30°C/min to 250°C and then
increase 10°C/min until 290°C and held for 3’. The detection was 300°C C. Helium
(Linde Sogas) was used as carrier gas at a constant flow rate of 1.3 mL/min, whereas
nitrogen (Linde Sogas, purityg99.999%) was employed as makeup gas at a flow of 30
mL/min. The system was operated by GCsolution Shimadzu software.

34
Operation of a GC/MS in SIM mode allows for detection of specific analytes with
increased sensitivity relative to full scan mode. Because the instrument is set to look
for only masses of interest it can be specific for a particular analyte of interest.
Typically two to four ions are monitored per compound and the ratios of those ions
will be unique to the analyte of interest. In order to increase sensitivity, the mass
scan rate and dwell times.
The equipment that has been used for testing these samples it was GC-MS/SIM and
MS/MS using a Supelco column fitted with an SLB-5MS (30 m x 0.25 mm x 0.25µm
film thikness) column operating in the splitless mode. Helium was used as carrier gas
at a constant flow rate of 1.3 mL/min. The oven temperature was programmed
starting at 40 C and held for 1 min, followed by increases of 15 C/min to 260. The ion
source and MS transfer line were at 250°C.
4.7. Recoveries evaluation
The recoveries were achieved by the relation between the area of the analyt
(permethrin or 3-PBA) after the procedure and the area of a standard analyt in
solution.

35
5. Results and discussion:
5.1. Chromatography results
5.1.1. GC-ECD, retention time, linearity, calibration curve permethrin
A solution containing permethrin was injected in GC-ECD and the retention time was
recorded. Figure 14 show the chromatogram obtained with the peak of permethrin
achieving 7.6 min of retention time.
Figure 14: Chromatogram retention time permethrin
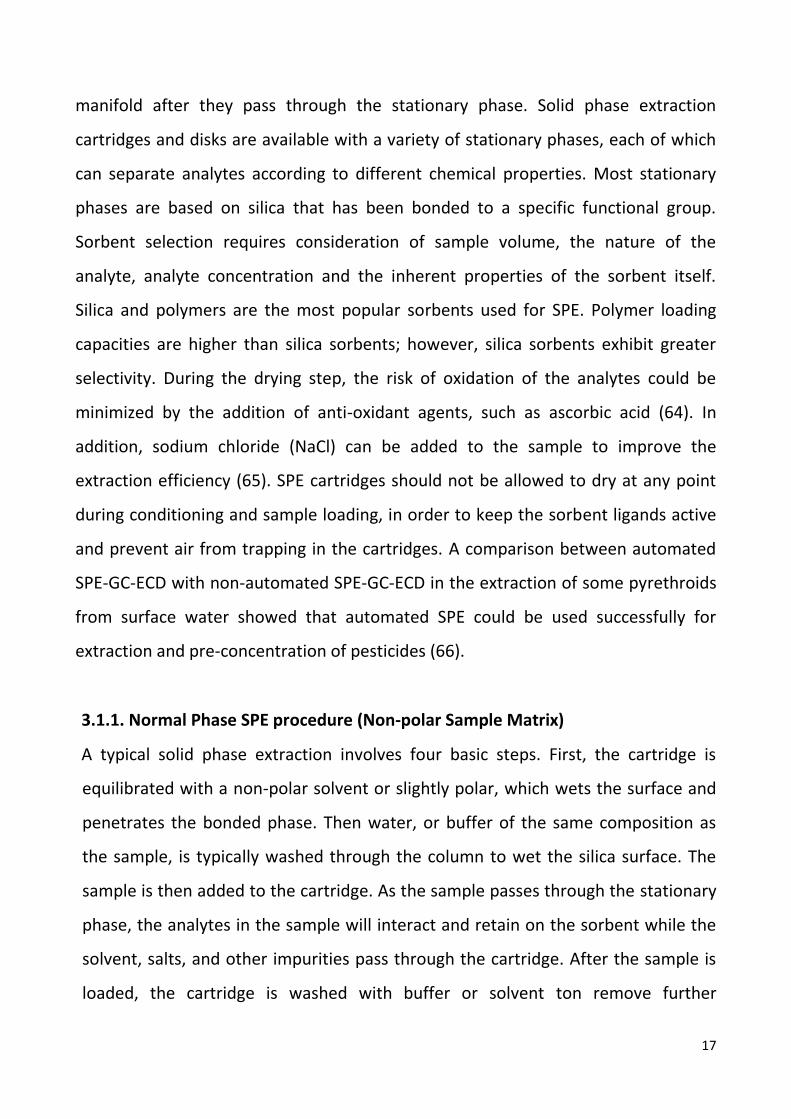
It was injected in GC-ECD five standards of permethrin (0.3 µg/L; 0.4 µg/L; 0.6
µg/L;0.8µg/L; 0.9 µg/L). Figure 15 shows the achieved calibration curve for
Permethrin. It was observed linearity between 0.3 to 0.9 µg/L of permethrin in n-
hexane. A R2 higher than 0.9842 was achieved.
36
Figure 15: Calibration curve of permethrin achieved by the correlation of area versus
concentration
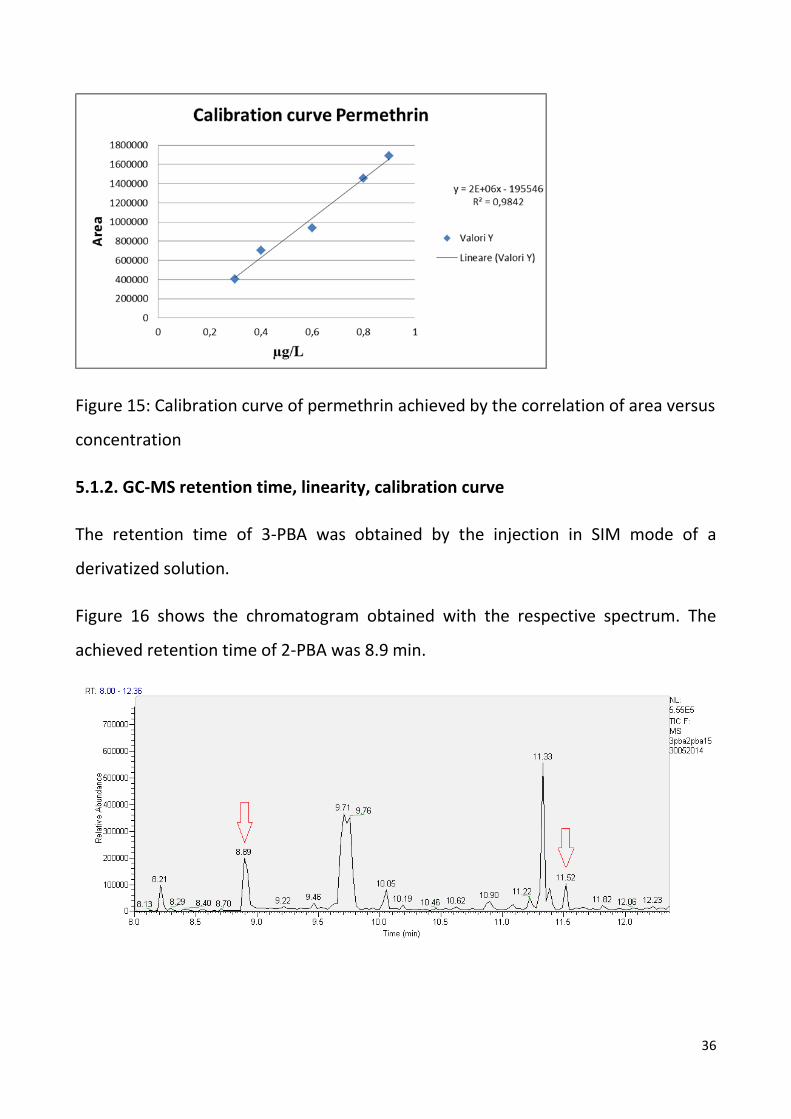
5.1.2. GC-MS retention time, linearity, calibration curve
The retention time of 3-PBA was obtained by the injection in SIM mode of a
derivatized solution.
Figure 16 shows the chromatogram obtained with the respective spectrum. The
achieved retention time of 2-PBA was 8.9 min.
37
Figure 16: Chromatogram showing the peak of 3-PBA and 2-PBA (11.52 min and 8.9
min) and the spectra of 3-PBA
In figure 17 is shown the calibration curve for 3-PBA. It was observed linearity
between 0.01 to 1.5 µg/L of 3-PBA. A R2 higher then 0.9864was achieved.
Figure 17: Calibration curve 3-PBA
The average area obtained in all chromatograms with 20 µg/L was 497601.2.

38
6. Recoveries:
The recoveries were obtained using the quotient between the area obtained with
the tested procedure and the area obtained with a standard. The 3-PBA and 2-PBA
recovery obtained with buffer solution was 78% and 58%, respectively. Identical
procedure was performed with samples from rats not treated with permethrin in
buffer solution. The recoveries of 3-PBA obtained with different tested procedures
(ultrasounds 10’ and 20’) are shown in figure 18:
Figure 18: Recoveries of 3-PBA obtained in samples with different procedures
The highest recovery is obtained with the procedure that uses 20 min in
ultrasounds, achieving 66.9 % of recovery.

39
The recoveries of 2-PBA obtained with different procedures are shown in figure 19.
Figure 19: Recoveries of 2-PBA obtained with different times in ultrasound
For 2-PBA 10 min in ultrasounds is sufficiently to achieve 104 % of extraction.
However for 3-PBA is necessary 20 min to achieve 67% of recovery, for that reason it
was selected the procedure with 20 min in ultrasound.
The amounts of permethrin and 3-PBA in brains from female rats treated with
permethrin were obtained using the equations from the calibration curves. Figure
20 shows the parallel between quantities of permethrin in brains of female rats
treated with permethrin and sacrificed the day after the treatment (22 days of life)
and brains of female rats treated with permethrin and sacrificed 14 days after the
treatment (35 days of life).

40
Figure 20: Permethrin concentration in rats brains after 24h and 14 days of exposure
The results demonstrate that permethrin was found in both brains of female rats
sacrificed on the day after (24h after) and 14 days after the end of treatment. Such
as the graph shows the concentration of permethrin in the brains from female rats
sacrificed the day after the end of treatment is lower than that found in the brains
of female rats sacrificed the 14th day after the end of treatment. The higher levels
achieved in brains may be explained with the lipophilic character of this organ.
Accordingly it can be affirm that the exposure to permethrin can represent a risk
factor for the development of neuro- degenerative diseases.
The data of the metabolite of permethrin in brain is show in figure 21.

41
Figure 21: Concentration of 3-PBA in brains after 24 h and after 14 days of exposure.
These results show that in female rats sacrificed the day after (24h) the end of
treatment, the amount of metabolite 3-PBA is high in contrast to the amount that
was found in female rats sacrificed 14 days after the end of treatment. This results
in agreement with other authors (58). The amount of 3-PBA 14 days after the end of
the treatment is lower than the limit of detection because the area detected by the
equipment was lower than that of the buffer.
The amounts of 3-PBA in urines of female rats treated with permethrin were
calculated using the equations of calibration curves. Figure 22 shows the quantities
of 3-PBA in urines of rats sacrificed the days after and 14 days after the treatment
with permethrin.
42
Figure 22: Concentration of 3-PBA in urines of rats
Such as is possible to see from figure 21, 3-PBA was found both in urines of rats
sacrificed after 24 hours and after 14 days of the end of treatment with permethrin.
The concentration of 3-PBA in urines of rats sacrificed after 24 hours is almost 30
times greater than the concentration of 3-PBA in urines of rats sacrificed after 14
days of the end of treatment. These data are in agreement with others authors (58)
that described that 88% of the 3-PBA is excreted within the first 24 h following
exposure.

43
7. Conclusion:
In this research, were studied female rats from the same treatment to investigate
the effect of early life permethrin and its major metabolite on the brain. These
results could confirms a neurodegenerative process associated with exposure to this
pesticide, (Parkinson-like neurodegeneration). In all the brain samples treated with
the same concentration the permethrin concentrations increase from 24h to 14
days 13.5 times. The metabolite achieved a maximum level at 24 h (2.6 µg/L) and
none of the samples of 14 days achieved values above the limit of detection.
Therefore this results link the hypotheses that permethrin in the brain longer than
expected. Accordingly it can be affirm that the exposure to permethrin can
represent a risk factor for the development of neuro- degenerative diseases.

44
8. References
Figure 1. D.M. Soderlund et al./Toxicology 171 (2002) 3–59
Figure 2. http://www.fieldherpforum.com
Figure 3. www.inchem.org433 × 240
Figure 4. http://openi.nlm.nih.gov/detailedresult.php?img=1277854_ehp0113-
000123f3&req=4
Figure 5. http://toxsci.oxfordjournals.org/content/130/1/33/F3.expansion.html
Figure 6. Current Trends in Sample Treatment Techniques for Environmental and
Food Analysis
Figure7.
http://separations.co.za/fileadmin/themes/default/pdf/SIDEBAR/2.%20CHROMTEC
HNIQUES/c.%20SPE/Strata%20-%20SPESolutionsBrochure.pdf
1. Methods in Biotechnology, Vol. 19, Pesticide Protocols Edited by: J. L. Martínez
Vidal and A. Garrido Frenich © Humana Press Inc., Totowa, NJ
2. 2-Reigart, J., M.D. et al., Recognition and Management of Pesticide
Poisonings, EPA, 1999.
3. Gosselin, R.E. 1984. Clinical Toxicology of Commercial Products. Williams and
Wilkins. Baltimore, MD.
4. Reregistration 2. Eligibility Decision (RED) for Permethrin; U.S. Environmental
Protection Agency, Office of Prevention, Pesticides and Toxic Substance, Office of
Pesticide Programs, U.S. Government Printing Office: Washington, DC, 2007.
5. K. Naumann, Synthetic Pyrethroid Insecticides: Structures and Properties,
Springer-Verlag, New York, NY, USA, 1990
45
6. D. M. Soderlund and J. R. Bloomquist, Annu. Rev. En tomol. , 1989, 34, 77.
7. Berkowitz, Exposure to indoor pesticides during pregnancy in a multiethnic,
urban cohort. Environ Health Perspect 2003; 111,1:79
8. R. D. Verschoyle and W. N. Aldridge, Arch. Toxicol., 1980, 45, 325.
9. L. J. Lawrence and J. E. Casida, Pestic. Biochem. Phvsiol., 1982, 18, 9.
10. Verschoyle, R.D., Aldridge, W.N., 1980. Structure–activityrelationships of
some pyrethroids in rats. Arch. Toxicol.45, 325–329.
11. X. Wang, F. Xue, A. Hua and F. Ge, Physiol. Entomol., 2006, 31, 190.
12. C. Breckenridge, L. Holden, N. Sturgess, M. Weiner, L. Sheets, D.Sargent, D. M.
Soderlund, J. S. Choi, S. Symington, J. M. Clark, S. Burr and D. Ray, Neurotoxicology,
2009, 30, S17.
13. J. R. Bloomquist, Annu. Rev. Entomol., 1996, 41, 163.
14. A. L. Goldin, Ann. N. Y. Acad. Sd, 1999, 868, 38.
15. S. J. Lozano, S. L. O'Halioran, K. W. Sargent and J. C. Brazner, E,nviron. Toxicol.
Chem., 1992, 11, 35.
16. M.L. Falcioni, C Nasuti, C. Bergamini, R Fato, G. Lenaz, R. Gabbianelli The
primary role of GSH against nuclear DNA damage of striatum induced by permethrin
in rats Neuroscience, 2010, 168, 2.
17. V. L. Salgado, S. N. Irving and T. A. Miller, Pestie. Biochem. Physiol.,1983, 20,
169.
18. D. M. Soderlund, Pestic. Biochem. Physiol., 2010, 97, 78.
19. P. J. Forshaw, T. Lister and D. E. Ray, Toxicol. Appl. Pharmaco!., 2000, 163, 1

46
20. F. Cantalamessa Acute toxicity of two pirethyroids, permethrin and
cypermethrin in neonatal and adult rats Arch. Toxicol., 1993, 67, 510.
21. J. G. Scott and Z. Wen, Pest Manag. Sci., 20 I, 57, 958.
22. D. M. Soderlund, J. M. Clark, L. P. Sheets, L. S. Mullin, V. J. Piccirillo, D. Sargent,
J. T. Stevens and M. L. Weiner, Toxicology, 2002, 171, 3.
23. S. B. Symington, A. G. Zhang, W. Karstens, J. Van Houten and J. M. Clark,
Pestie. Biochem. Physiol., 1999, 65, 181.
24. F. Matsumura and S. M. Ghiasuddin, J. Environ. Sci. Health B., 1983, 18, 1.
25. Parrón, T., Requena, M., Hernández, A.F., Alarcón, R.; Association between
environmental exposure to pesticides and neurodegenerative diseases. Toxicol. Appl.
Pharmacol. 2011.
26. Cox, C. 1998. Permethrin. Journal of Pesticide Reform 18(2): 14-20.
27. Blaylock, R. L, M. Abdel-Nasser, S. M. McCarty, J. A. Knesel, K. M. Tolson, P. W.
Ferguson, and H. M. Mehendale. Suppression of cellular immune responses in BALB/c
mice following oral exposure to Permethrin. Bulletin of Environmental
Contamination and Toxicology 1995, 54 (5): 768-774.
28. Eil, C. and B. C. Nisula. The binding properties of pyrethroids to human skin
fibroblast androgen receptors and to sex hormone binding globulin. Journal of
Steroid Biochemistry 1990, 35, 409.
29. Kasat K., V. Go, and B. G. Pogo. Effects of Pyrethroids insecticides and
estrogen on WNT10B proto-oncogene expression. Environment International, 2002,
28(5), 429.

47
30. Alavanja, M.C.R., et al. Use of agricultural pesticides and prostate cancer risk
in the agricultural health study cohort. American Journal of Epidemiology. 2003, 157:
800-814.
31. Parrón, T., Requena, M., Hernández, A.F., Alarcón, R.,. Association between
environmental exposure to pesticides and neurodegenerative diseases. Toxicol. Appl.
Pharmacol. 2011.
32. Relton, C.L., Smith, G.D.,. Epigenetic epidemiology of common complex
disease: prospects for prediction, prevention, and treatment. PLoS Med. 2010, 7,
e1000356. doi:10.1371/journal.pmed.1000356.
33. Gabbianelli, R., Nasuti, C., Falcioni, G., Cantalamessa, F.,. Cypermethrin-
induced plasma membrane perturbation on erythrocytes from rats: reduction of
fluidity in the hydrophobic core and in glutathione peroxidase activity. Toxicology
175, 91–101; Gabbianelli, R., Lupidi, G., Villarini, M., Falcioni, G., 2003. DNA damage
induced by copper on erythrocytes of gilthead sea bream Sparus aurata and mollusc
Scapharca inaequivalvis. Arch. Environ. Contam. Toxicol. 2002, 45, 350–356)
34. N.A. Velázquez-Ulloa, N.C. Spitzer, D. Dulcis Contexts for dopamine specification
by calcium spike activity in the central nervous system J Neurosci., 2011, 31, 78
35. T. Narahashi Neuronal ion channels as the target sites of insecticides
Pharmacol. Toxicol., 1996, 79, 1.
36. Cox, C. Permethrin. Journal of Pesticide Reform 1998, 18(2), 14.
37. Vadhana, M.S.D., Carloni, M., Nasuti, C., Fedeli, D., Gabbianelli, R.,. Early life
permethrin insecticide treatment leads to heart damage in adult rats. Exp. Gerontol.
2011, doi:10.1016/j.exger.2011.05.005.

48
38. T. Perlmann, A. Wallén-Mackenzie Nurr1, an orphan nuclear receptor with
essential functions in developing dopamine cells Cell Tissue Res., 2004, 318, 45.
39. Y. Chu, W. Le, K. Kompoliti, J. Jankovic, E.J. Mufson, J.H. Kordower Nurr1 in
Parkinson’s disease and related disorders J. Comp. Neurol., 2006, 494 (3) 495.
40. Gabbianelli, R., Falcioni, M.L., Nasuti, C., Cantalamessa, F., Imada, I., Inoue,
M.,. Effect of permethrin insecticide on rat polymorphonuclear neutrophils. Chem.
Biol. Interact. 2009b, 182, 245.
41. C. Viero, G. Dayanithi Decoding calcium signals in living cells IIOAB J., 1, 2010,
11.
42. D.S. Woodruff-Pak, M.R. Foy, G.G. Akopian, K.H. Lee, J. Zach, K.P. Nguyen,
D.M. Comalli, J.A. Kennard, A. Agelan, R.F. Thompson Differential effects and rates of
normal aging in cerebellum and hippocampus Proc. Natl. Acad. Sci. U. S. A., 2010,
107, 1624.
43. M. Berridge Neuronal calcium signaling Neuron, 1998, 21, 13.
44. J.P. Kiss, E.S. Vizi Nitric oxide: a novel link between synaptic and nonsynaptic
transmission. Trends Neurosci., 2001, 24, 211.
45. Zhang,X.,Jones,D., Gonzalez-Lima, F., Neurodegeneration produced
byrotenone in the mouse retina: a potential model to investigate environmental
pesticide contributions to neurodegenerative diseases. J. Toxicol. Environ. Health A
2006, 69, 1681.
46. W. Li, J. Xue, C. Niu, H. Fu, C.S. Lam, J. Luo, H.H. Chan, H. Xue, K.K. Kan, N.T.
Lee, C. Li, Y. Pang, M. Li, K.W. Tsim, H. Jiang, K. Chen, X. Li, Y. Han Synergistic
neuroprotection by bis(7)-tacrine via concurrent blockade of N-methyl-d-aspartate
receptors and neuronal nitric-oxide synthase Mol. Pharmacol., 2007, 71, 1258.

49
47. VanDerRhee, H. J.; Farquhar, J. A.; Vermeulen, N. P. E. Efficacy and
Transdermal Absorption of Permethrin in Scabies. Patients. Acta Derm. Venereol.
1989, 69 (2), 170.
48. Food and Drug Administration. 2003. Pesticide Program: Residue Monitoring
2001. Washington, Updated July 2004 D. C.: Food and Drug Administration, Center
for Food Safety and Applied Nutrition
49. Anadon, A.; Martinez-Larranaga, M. R.; Diaz, M. J.; Bringas, P. Toxicokinetics
of Permethrin in the Rat. Toxicol. Appl. Pharmacol. 1991, 110, 1.
50. Toxicological. Profile for Pyrethrins and Pyrethroids; U.S. Department of
Health and Human Services, Agency for Toxic Substances and Disease Registry:
Atlanta, 2003.
51. Gotoh, Y.; Kawakami, M.; Matsumoto, N.; Okada, Y. Permethrin Emulsion
Ingestion: Clinical Manifestations and Clearance of Isomers. Clin. Toxicol. 1998, 36
(1), 57.
52. Krieger, R., Handbook of Pesticide Toxicology - Agents, 2nd ed; Academic
Press: San Diego, 2001; Vol. 2, pp 1279.
53. Heudorf U, Butte W, Schulz C, Angerer J... Reference values for metabolites of
pyrethroid and organophosphorous insecticides in urine for human biomonitoring in
environmental medicine. Int J Hyg Environ Health 2006, 209, 293.
54. Reregistration Eligibility Decision (RED) for Permethrin; U.S. Environmental
Protection Agency, Office of Prevention, Pesticides and Toxic Substance, Office of
Pesticide Programs, U.S. Government Printing Office: Washington, DC, 2007.
55. Baker, S.E.; Olsson, A.O.; Barr, D.B. Isotope dilution high-performance liquid
chromatography- tandem mass spectrometry method for quantifying urinary

50
metabolites of synthetic pyrethroid insecticides. Arch. Environ. Contam. Toxicol.
2004, 46, 281
56. Casida,. Mechanism of selective action of pyrethroid insecticides. Annu. Rev.
Pharmacol. Toxicol.1983 23, 413
57. Centers for Disease Control and Prevention (2005) Third national report on
human exposure to environmental chemicals. Centers for Disease Control, Atlanta
58. Kühn, K.; Wieseler, B.; Leng, G.; Idel, H. Toxicokinetics of pyrethroids in
humans: Consequences for biological monitoring. Bull. Environ. Contam. Toxicol.
1999, 62, 101
59. Bradberry, S. M.; Cage, S. A.; Proudfoot, A. T.; Vale, J. A. Poisoning due to
Pyrethroids. Toxicol. Rev. 2005, 24 (2), 93.
60. VanDerRhee, H. J.; Farquhar, J. A.; Vermeulen, N. P. E. Efficacy and
Transdermal Absorption of Permethrin in Scabies Patients. Acta Derm. Venereol.
1989, 69 (2), 170.
61. Nakamura, Y., Sugihara, K., Sone, T., Isobe, M., Ohta, S., Kitamura, S.,. The in
vitro metabolism of a pyrethroid insecticide, permethrin, and its hydrolysis products
in rats. Toxicology 2007, 235, 176–184.
62. Leng G, Kuhn KH, Idel H. 1997. Biological monitoring of pyrethroids in blood
and pyrethroid metabolites in urine: applications and limitations. Sci Total Environ
199:173–181.
63. Catherine L. Arthur, Janusz Pawliszyn, Anal. Chem., 1990, 62 (19), 2145.
64. Tomlin, C. D. S. The Pesticide Manual: A World Compendium, 14th ed.; British
Crop Production Council: Alton, England, 2006; pp 813-814.

51
65. Supelco (1998), Guide to Solid Phase Extraction (http:/ / www. sigmaaldrich.
com/ Graphics/ Supelco/ objects/ 4600/ 4538. pdf), pp. 9,
66. Supelco (1998), Guide to Solid Phase Extraction (http:/ / www. sigmaaldrich.
com/ Graphics/ Supelco/ objects/ 4600/ 4538. pdf), pp. 2–12
67. Supelco (1998), Guide to Solid Phase Extraction (http:/ / www. sigmaaldrich.
com/ Graphics/ Supelco/ objects/ 4600/ 4538. pdf), pp. 3–4
52
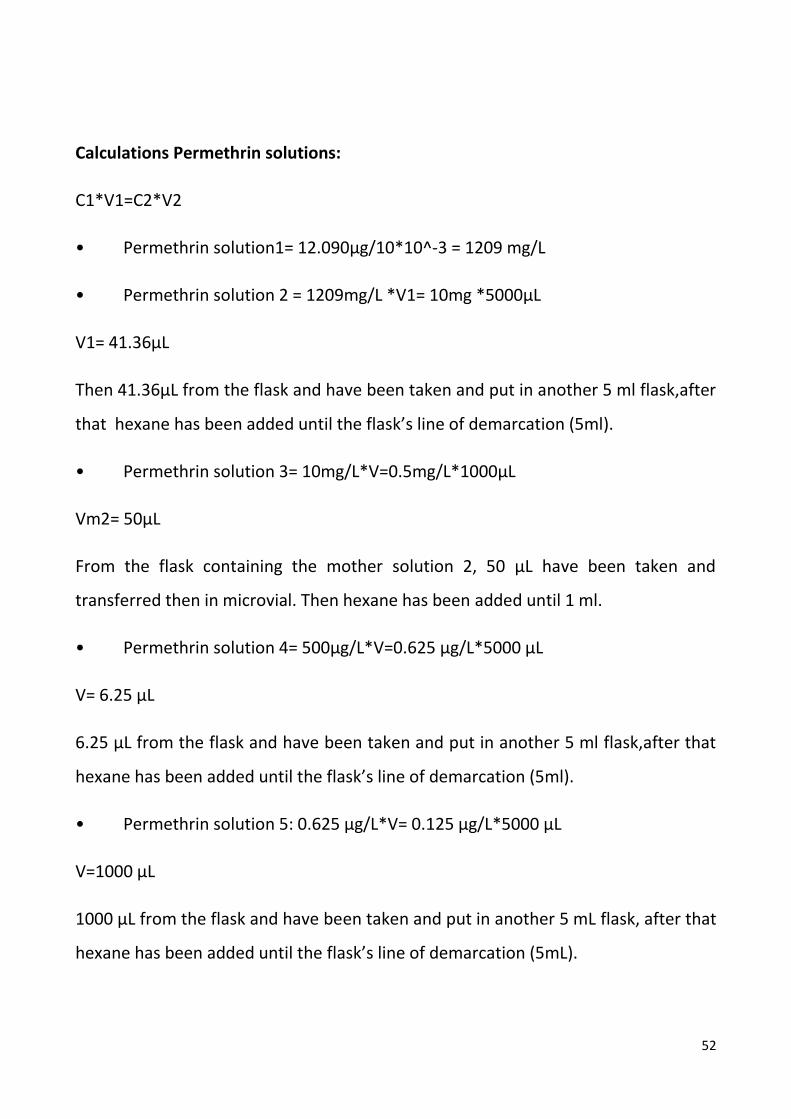
Calculations Permethrin solutions:
C1*V1=C2*V2
• Permethrin solution1= 12.090µg/10*10^-3 = 1209 mg/L
• Permethrin solution 2 = 1209mg/L *V1= 10mg *5000µL
V1= 41.36µL
Then 41.36µL from the flask and have been taken and put in another 5 ml flask,after
that hexane has been added until the flask’s line of demarcation (5ml).
• Permethrin solution 3= 10mg/L*V=0.5mg/L*1000µL
Vm2= 50µL
From the flask containing the mother solution 2, 50 µL have been taken and
transferred then in microvial. Then hexane has been added until 1 ml.
• Permethrin solution 4= 500µg/L*V=0.625 µg/L*5000 µL
V= 6.25 µL
6.25 µL from the flask and have been taken and put in another 5 ml flask,after that
hexane has been added until the flask’s line of demarcation (5ml).
• Permethrin solution 5: 0.625 µg/L*V= 0.125 µg/L*5000 µL
V=1000 µL
1000 µL from the flask and have been taken and put in another 5 mL flask, after that
hexane has been added until the flask’s line of demarcation (5mL).

53
Permethrin calibration curve:
Concentration Area
0.3µg/L 404822
0.4 µg/L 706464
0.6 µg/L 938850
0.8 µg/L 1454210
0.9 µg/L 1689112
Table 1: Permethrin area
10mg*V= 0.3µg/L*1000µL V=30µL
30µL have been taken from permethrin solution of 10mg/L and hexane was added
10mg*V= 0.4µg/L*1000µL V=40µL
40µL have been taken from permethrin solution of 10mg/L and hexane was added
until 1mL.
10mg*V= 0.6µg/L*1000µL V=60µL
60µL have been taken from permethrin solution of 10mg/L and hexane was added
until 1mL.
10mg*V= 0.8µg/L*1000µL V=80µL
80µL has been taken from permethrin solution of 10mg/L and hexane was added
until 1mL.
10mg*V= 0.9µg/L*1000µL V=90µL

54
90µL has been taken from permethrin solution of 10mg/L and hexane was added
until 1mL.
Calculations 3-PBA solutions:
In 5mL of ACN 10mg of 3-PBA were added.
• 3-PBA solution1 = 10000µg/ 5*10^-3L= 2000mg/L
• 3-PBA solution 2= 2000mg/L*V=10mg/L*10mL
V=0.05mL
0.05mL was taken from the 3-PBA solution of 2000mg/L. Then acetonitrile was
added until 10mL.
• 3-PBA solution 3= 10mg/L*V=0.05mg/L*10mL
V=0.05mL
0.05mL was taken from the 3-PBA solution of 10mg/L. Then acetonitrile was added
until 10mL.
• 3-PBA solution 4= 10mg/L*V=50µg/L*10mL
V=0.05mL
0.05mL was taken from the 3-PBA solution of 10mg/L. Then acetonitrile was added
until 10mL.
• 3-PBA solution 5= 50µg/L*V=2µg/L*10mL
V=0.4mL
0.4mL was taken from the 3-PBA solution of 50µg/L. Then acetonitrile was added
until 10mL.

55
In 5mL of ACN 10mg of 2-PBA were added.
• 2-PBA solution1 = 10000µg/ 5*10^-3L= 2000mg/L
• 2-PBA solution 2= 2000mg/L*V=10mg/L*10mL
V=0.05mL
0.05mL was taken from the 3-PBA solution of 2000mg/L. Then acetonitrile was
added until 10mL.
• 2-PBA solution 3= 10000µg/L*V=50µg/L*10mL
V=0.05mL
0.05mL was taken from the 2-PBA solution of 10mg/L. Then acetonitrile was added
until 10mL.
For 3PBA and 2PBA calibration curves were prepared:
Concentrations 3PBA: 0.01µg/L, 0.05µg/L, 0.1µg/L, 0.3µg/L, 0.5µg/L, 1µg/L, 1.5µ/L
Concentration 3-
PBA
Area 3-PBA
0.01 µg/L 13744
0.05 µg/L 19729.67
0.1 µg/L 22358.33
0.3 µg/L 59872.5
0.5 µg/L 85899
1 µg/L 126342
56
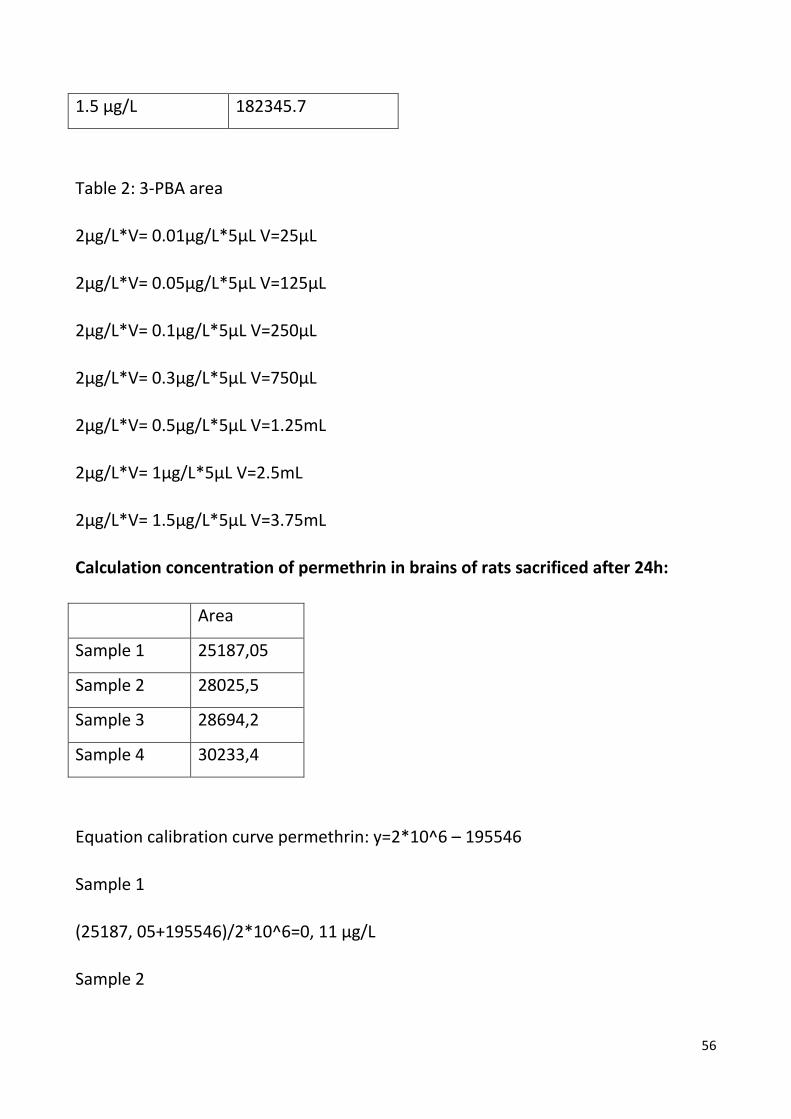
1.5 µg/L 182345.7
Table 2: 3-PBA area
2µg/L*V= 0.01µg/L*5µL V=25µL
2µg/L*V= 0.05µg/L*5µL V=125µL
2µg/L*V= 0.1µg/L*5µL V=250µL
2µg/L*V= 0.3µg/L*5µL V=750µL
2µg/L*V= 0.5µg/L*5µL V=1.25mL
2µg/L*V= 1µg/L*5µL V=2.5mL
2µg/L*V= 1.5µg/L*5µL V=3.75mL
Calculation concentration of permethrin in brains of rats sacrificed after 24h:
Area
Sample 1 25187,05
Sample 2 28025,5
Sample 3 28694,2
Sample 4 30233,4
Equation calibration curve permethrin: y=2*10^6 – 195546
Sample 1
(25187, 05+195546)/2*10^6=0, 11 µg/L
Sample 2

57
(28025, 5+195546)/2*10^6=0, 11 µg/L
Sample 3
(28694, 2+195546)/2*10^6=0, 11 µg/L
Sample 4
(30233, 4+195546)/2*10^6=0, 11 µg/L
Average samples: (0, 11+ 0, 11+ 0, 11+ 0, 11) = 0, 11 µg/L
Calculation concentration of permethrin in brains of rats sacrificed after 14 days:
Area
Sample 1 5109745
Sample 2 2629519
Sample 3 658153,5
Sample 1
(5109745+195546)/2*10^6=2, 65 µg/L
Sample 2
(2629519+195546)/2*10^6=1, 41 µg/L
Sample 3
(658153, 5+195546)/2*10^6=0, 42 µg/L
Average samples: (2, 65+1, 41+0, 42)/3= 1, 49µg/L
Calculation concentration of 3-PBA in brains of rats sacrificed after 24h:
Area

58
Sample 1 345170,7
Sample 2 429439,5
Sample 3 442287
Sample 4 69046
Equation calibration curve 3-PBA: y=111977x + 17550
Sample 1
(345170, 7- 17550)/ 111977 = 2, 92 µg/L
Sample 2
(429439, 5 – 17550) / 111977 = 3, 67 µg/L
Sample 3
(442287 – 17550) / 111977 = 3, 79 µg/L
Sample 4
0 µg/L
Average simples: (2, 92+ 3,67+ 3,79+ 0)/4 = 2,59 µg/L
Calculation concentration of 3-PBA in brains of rats sacrificated after 14days:
Area
Sample 1 59368
Sample 2 115699,3
Sample 3 103765,3
Sample 1

59
0 µg/L
Sample 2
0 µg/L
Sample 3
0 µg/L
Average simples: 0 µg/L
Calculation of 3-PBA in urines of rats sacrificed after 24h:
Area
Sample 1 123369516
Sample 2 181787279
Sample 3 200621820
Sample 4 358380967
Sample 5 113235427
Sample 6 162789863
Sample 1
(123369516-17550)/111977= 1101.58 µg/L
Sample 2
(181787279-17550)/111977= 1623.28 µg/L
Sample 3
(200621820-17550)/111977= 1791.48 µg/L
Sample 4

60
(358380967-17550)/111977= 3200.33 µg/L
Sample 5
(113235427-17550)/111977= 1011.08 µg/L
Sample 6
(162789863-17550)/111977= 1453.62 µg/L
Average samples: (1101.58+1623.28+1791.48+3200.33+1011.08+1453.62)/6=
1681.9µg
Calculation of 3-PBA in urines of rats sacrificed after 14days:
Area
Sample 1 18628900
Sample 2 1968870
Sample 3 1656695
Sample 4 6669439
Sample 5 3077413
Sample 1
(18628900-17550)/111977= 166.21 µg/L
Sample 2
0 µg/L
Sample 3

61
0 µg/L
Sample 4
0 µg/L
Sample 5
0 µg/L
Average samples: (166.21+0+0+0+0)/5= 33.42 µg/L