determination of iodine and molybdenum in milk by ... · pdf filedetermination of iodine and...
TRANSCRIPT
Loughborough UniversityInstitutional Repository
Determination of iodine andmolybdenum in milk byquadrupole ICP-MS
This item was submitted to Loughborough University's Institutional Repositoryby the/an author.
Citation: REID, H.J. ... et al, 2008. Determination of iodine and molybdenumin milk by quadrupole ICP-MS. Talanta, 75 (1), 15 March, pp. 189-197
Additional Information:
• This article was published in the journal, Talanta [ c© Elsevier].The definitive version (doi:10.1016/j.talanta.2007.10.051) is available at:http://www.sciencedirect.com/science/journal/00399140
Metadata Record: https://dspace.lboro.ac.uk/2134/3268
Publisher: c© Elsevier
Please cite the published version.

This item was submitted to Loughborough’s Institutional Repository by the author and is made available under the following Creative Commons Licence
conditions.
For the full text of this licence, please go to: http://creativecommons.org/licenses/by-nc-nd/2.5/
Page 1 of 26
NOTICE: this is the author's version of a work that was accepted for publication in
Talanta. Changes resulting from the publishing process, such as peer review,
editing, corrections, structural formatting, and other quality control mechanisms may
not be reflected in this document. Changes may have been made to this work since
it was submitted for publication. A definitive version was subsequently published in
Talanta, Volume 75, Issue 1, 15 March 2008, Pages 189-197
(doi:10.1016/j.talanta.2007.10.051).”

Page 2 of 26
Determination of iodine and molybdenum in milk by quadrupole
ICP-MS
Helen J. Reid*a, Abdul A. Bashammakhb, Phillip S Goodallc, Mark R. Landona, Ciaran
O’Connora, and Barry L. Sharpa
aDepartment of Chemistry, Loughborough University, Loughborough, Leics, LE11 3TU, UK.
bDepartment of Chemistry, Faculty of Science, King Abdulaziz University, P. O. Box 80203,
Jeddah 21589, Kingdom of Saudi Arabia.
cNexia Solutions, Sellafield, Seascale, Cumbria, CA20 1PG, UK.
Abstract
A reliable method for the determination of iodine and molybdenum in milk samples, using
alkaline digestion with tetramethylammonium hydroxide and hydrogen peroxide, followed by
quadrupole ICP-MS analysis, has been developed and tested using certified reference
materials. The use of He + O2 (1.0 ml min-1 and 0.6 ml min-1) in the collision-reaction cell of
the mass spectrometer to remove 129Xe+ - initially to enable the determination of low levels of
129I - also resulted in the quantitative conversion of Mo+ to MoO2+ which enabled the
molybdenum in the milk to be determined at similar mass to the iodine with the use of Sb as
a common internal standard. In order to separate and pre-concentrate iodine at sub μg L-1
concentrations, a novel method was developed using a cation-exchange column loaded with
Pd2+ and Ca2+ ions to selectively retain iodide followed by elution with a small volume of
ammonium thiosulfate. This method showed excellent results for aqueous iodide solutions,
although the complex milk digest matrix made the method unsuitable for such samples. An
investigation of the iodine species formed during oxidation and extraction of milk sample
digests was carried out with a view to controlling the iodine chemistry.

Page 3 of 26
Keywords: Iodine, collision-reaction cell, molybdenum, milk, sample preparation, ICP-MS
Introduction
Milk is recognized as the most complete food in the human diet because it contains all the
macronutrients such as proteins, lipids and carbohydrates and all the essential
micronutrients such as elements, vitamins and enzymes. A lot of information has been
accumulated concerning the composition of milk in terms of fat, protein and vitamins [1];
however, less attention has been paid to the elemental composition of milk in spite of the
great importance of essential elements in nutrition [2,3].
Iodine is one of the most important trace elements in human nutrition; its physiological
function as a constituent of thyroxine, the hormone secreted by the thyroid gland,
necessitates the control of intake levels, as deficiency or excessive exposure both have a
detrimental affect on thyroid function [1,4]. Concentrations of iodine in cow’s milk, which is a
major contributor to dietary exposure, are naturally influenced by the levels of iodine in
feedstuffs, which vary seasonally [5]. It has been reported that iodine in milk is present
mostly as free iodide [6] with relatively small amounts of organic iodine. Whilst 127I is the only
stable isotope, the most hazardous iodine species are the radioactive isotopes such as 129I
and 131I which may enter the food chain via the air-grass-cow-milk pathway as a result of
aerial emissions from nuclear reprocessing plants [7]. The long-lived radionuclide 129I is
monitored by regular measurement of 129I content of liquid milk from cows in the potentially-
affected areas [8,9], typically by radiometric analysis after appropriate separation techniques
[10].
Inductively-coupled plasma mass spectrometry (ICP-MS) potentially offers a quick, simple
method of monitoring iodine isotopes in milk; however there are a number of problems
associated with the use of ICP-MS for this assay. Firstly, iodine has a relatively high
detection limit in ICP-MS in comparison to other elements due to its high ionisation potential
(10.45 eV). Also, signal memory effects can be a problem, due to evaporation of iodine as HI

Page 4 of 26
or I2 from aerosol droplets in the spray chamber [11]. Furthermore, interference on the 129I+
signal arises from 129Xe+ and possibly also 127IH2+ ions [12,13], making the use of oxygen as
a collision/reaction gas an attractive option for this analysis.
Before considering instrumental conditions, however, it is necessary to carefully consider
sample preparation, to avoid losses due to iodine’s volatility and complex redox chemistry. At
low pH iodide is easily oxidised to volatile molecular iodine by dissolved oxygen (or other
dissolved oxidants):
4I– + O2 (g) + 4H+ → 2H2O + 2I2 (aq) E0 = 0.61V (1)
At high pH, the oxidation of iodide to iodine is avoided, and it is therefore usual to prepare
samples in alkaline media to prevent the oxidation of I– to I2 or the formation of HI. With milk
samples, it is also important to destroy the organic matrix to reduce the spectral interferences
from carbon species and the possibility of cone blockage in the ICP-MS interface. Thus
decomposition with strong alkali, such as ammonia, potassium hydroxide or
tetramethylammonium hydroxide (TMAH), alone or in combination, has been used to prepare
milk samples for iodine determination [4,11,14,15]. These procedures lead to the
conservation of the iodine as iodide or iodate, which is then determined by ICP-MS
regardless of the iodine species present in the original sample. The use of alkaline conditions
also potentially enable the simultaneous determination of other important anion-forming
elements such as selenium, arsenic, sulfur and molybdenum, though this aspect appears to
have received little attention in the literature, iodine usually being determined separately from
other trace elements. The flexibility of this sample preparation technique is illustrated in the
present study by the successful determination of molybdenum, an essential nutrient required
for the function of molybdoenzymes, such as milk xanthine oxidase which catalyses the
oxidation of xanthine to uric acid [16].
Page 5 of 26
For iodine determination alone, an alternative approach is to deliberately convert iodine in
the sample to elemental iodine vapour for analysis, and total iodine has been determined in
milk by vapour generation ICP-optical emission spectrometry [17], though an alkaline
digestion was still required to destroy the organic matrix prior to generating the iodine
vapour. Iodine has been determined directly in milk powder by electrothermal vaporization-
ICP, but again interference from the organic matrix was a problem, necessitating the use of
pre-reduced Pd as a chemical modifier and internal standard [18].
The work reported here describes the preparation of milk samples for the determination of
iodine and molybdenum by ICP-MS using sample pre-concentration and hexapole collision-
reaction cell technology. The first aim was to develop a straightforward digestion method to
break down the organic matrix of the milk, without loss of analyte, yielding a clear solution
suitable for continuous nebulisation and analysis by ICP-MS. Once this was achieved,
attention turned to preconcentration of the digest before introduction to the ICP-MS to
improve detection limits. To determine 129I, the use of oxygen in the hexapole collision-
reaction cell of the instrument removes 129Xe+ ions by a rapid charge-transfer mechanism
(equation (2)) [19], thus preventing them interfering with 129I determination.
Xe+ + O2 → Xe + O2+ ΔH = -0.06 eV; k = 1.10 x 10⁻¹⁰ cm3 s-1 (2)
It has been reported that 129Xe+ reacts 104 times faster with O2 than 129I+ does [20] and thus
use of oxygen can selectively remove 129Xe+. This may also be of importance in facilitating
the use of low level 129I spikes for isotope dilution determination of 127I [21].

Page 6 of 26
Experimental
Instrumentation
A VG PQ ExCell with Collision Cell Technology (CCT) (Thermo Elemental, Winsford,
Cheshire, UK), was employed for ICP-MS analysis. The instrument, located in a general-
purpose laboratory without air filtration or conditioning equipment, was used with a polyamide
or glass nebuliser, a silica impact bead spray chamber, cooled to 5ºC by a Peltier cooler, and
standard silica torch. Standard nickel sample and skimmer cones were used.
The ion optics were tuned to optimise the sensitivity of the signal at m/z 115 for a 1 μg L-1
indium solution, which was typically 60,000 – 120,000 counts s-1 in standard (non-CCT)
mode. The relative standard deviation of 1 μg L-1 115In signals was less than 1.5 % and the
oxide levels were monitored to ensure the 140Ce+/140Ce16O+ ratio did not exceed 0.02. Typical
operational conditions for the ICP-MS are given in Table 1.
Sb (200 ng g-1) was used as the internal standard and dilute tetramethylammonium
hydroxide (TMAH, 0.5% in water) was used as the wash solution, with a 4 min washout time
between samples (extended from the normal 90 s to prevent carryover of iodine).
For removal of 129Xe, helium and oxygen were introduced into the collision cell while
aspirating a 5 ng g-1 iodide solution. With the He flow rate set to 1 mL min-1, the O2 flow was
varied to maximise the 127/129 signal ratio whilst retaining sufficient sensitivity for iodine
determination. Similarly pole bias settings of both the hexapole and quadrupole analyzer
were adjusted to produce a high 127/129 ratio. Optimal conditions established this way were
O2 flow 0.6 ml min-1 with a hexapole bias of -2V and quadrupole bias of -10V. The slight
negative bias on the hexapole is expected because the charge transfer reaction of Xe with
O2 is slightly endothermic (+0.06 eV) and is therefore favoured by more energetic ions [22].

Page 7 of 26
Table 1. Typical operating parameters for the VG PQ ExCell
RF Power / W 1350
Gases / l min-1
Plasma 12.60
Auxiliary 0.80
Nebuliser 1.03
Lenses Tuned for optimum In signal
Hexapole pole bias / V -1.96
L3 / V -119.4
Focus / V +20.9
Deflector lens / V -35.8
Quadrupole pole bias / V +1 or -10a
Torch position Tuned for optimum In signal
Acquisition Parameters
No of scans 100
Channels per mass 1
Dwell time / ms 10
No of replicates 5
Scanning mode Peak jump
m/z measured 92, 95, 96, 97, 98, 121, 123, 124, 127, 128, 129, 130, 131,
132
Delay time/s 90
Wash time/s 90 a denotes quadrupole bias when collision cell mode enabled
Unicam 8700 series and Shimadzu UV-1601PC UV-Visible spectrophotometers were
employed to monitor the presence of I2, I– and I3– in oxidation experiments.
A 757 VA Computrace (Metrohm, Herisau, Switzerland) was used for the electrochemical
oxidation of potassium iodide in 0.1 M KCl using a platinum electrode with a potential sweep
of -1.2V to 1.2V.
Page 8 of 26
Materials and Reagents
Certified reference materials (CRMs) produced by the National Institute of Standards and
Technology (Dried Whole Milk, NIST 8435) and the European Community Bureau of
Reference (Dried Skimmed Milk, BCR 063R) were purchased from LGC, Teddington. A
further sample of the NIST 8435 reference material was obtained from the Central Science
Laboratory (CSL), York. Several liquid and dried milk samples were obtained from local
Tesco and Safeway stores.
Two dried milk samples were supplied by British Nuclear Fuels Ltd (BNFL): a sample of
unknown 129I content but believed to be below 0.01 ng g-1 in the liquid milk, and a further
sample which had been spiked with 1 μg L-1 of 129I, then freeze-dried to give a 129I
concentration of 8 ng g-1.
Reagents for the digestion of the milk powder samples were purchased as follows:
tetramethylammonium hydroxide (TMAH) from Apollo (Stockport, UK); hydrogen peroxide
(20 vol) and Triton-X from Romil Pure Chemistry Ltd. (Cambridge, UK). Further treatment of
the digests utilised Oxone® (potassium hydrogen peroxymonosulfate sulfate) and methyl-
iso-butylketone, both from Aldrich Chemicals (Gilligham, Dorset, UK); methanol, ammonium
thiosulfate, sodium chloride, potassium iodide and nitric acid (trace analysis grade) from
Fisher Scientific (Loughborough, UK); and toluene and from Lancaster (Morecambe, Lancs,
UK).
OnGuard-H™ ion exchange cartridges (Dionex, Camberley, UK) were used for iodine
preconcentration, along with palladium nitrate (Avocado, Heysham, UK) and calcium
standard solution (1000 μg mL-1) (Fisher Scientific, Loughborough, UK). All solutions were
made up using deionised water (18.2 MΩ) (Elga Maxima, Prima Systems, UK).

Page 9 of 26
The ICP-MS instrument was set up using a multi-element tune solution supplied by SPEX
Chemicals (Metuchen, NJ, USA). Calibration standards were freshly prepared from
purchased 1000 μg mL-1 standard solutions: iodide from SPEX Certiprep (Metuchen, NJ,
USA), and molybdenum and antimony (internal standard) from Fisher Scientific
(Loughborough, UK).
Digestion Procedure
500mg dried milk (or 3 g liquid milk) was weighed into a centrifuge tube. To the dried sample,
3 mL water was added and mixed well by shaking. 4 mL each of tetramethylammonium
hydroxide (TMAH, 25%), Triton X-100 (surfactant, 5% w/v) and H2O2 (20 vol) were then
added. The tube was placed in a water bath at 70ºC for 2 hours, agitating on a vortex mixer
every 10 - 15 min. Following this, the digest was made up to 20 mL with water, including the
addition of 1 mL of 400 μg L-1 Sb solution as internal standard, shaking to mix. The tube was
placed in a centrifuge and spun at ~5000 rpm for 5 min. This procedure was found to give a
clear, stable solution that could be nebulised continuously and stored for several days in a
refrigerator without degradation. Procedural blanks were prepared alongside each batch of
samples.
Calibration Procedure
Calibration standards were made up in the ranges 1 - 100 μg L-1 of iodide, and 1 - 20 μg L-1
of molybdenum, each standard solution containing the same concentrations of TMAH, Triton
X-100 and Sb as the digests. A calibration curve of 127I/121Sb signal ratio versus iodine
concentration was then used for quantification of 127I in the digests. Molybdenum was
quantified in the digests via calibration curves of 98Mo/121Sb (standard mode) or
128MoO2/121Sb (collision-reaction cell mode) versus molybdenum concentration.
Pre-concentration Procedures
Using oxidation/solvent extraction

Page 10 of 26
The milk powder was digested as above, but excluding the addition of internal standard. The
digest (20 mL) was then taken down to pH 2 via drop-wise addition of conc. HNO3. Oxone®
(0.2 g) and toluene (5 mL) were added simultaneously as soon as pH 2 was reached, and
the vessel stirred using a vortex mixer for around 5 min. The mixture was spun on a
centrifuge for a further 3 min to separate the layers; the organic layer was collected and the
aqueous layer discarded.
Aqueous ammonium thiosulfate, 0.1M (2 mL) was added to the organic layer and the mixture
stirred on a vortex mixer for 5 min. Finally, the mixture was spun on a centrifuge (~5000 rpm)
and the aqueous layer removed for analysis.
In establishing the above procedure, the effect of using Oxone® as an oxidising agent for
iodide was studied. UV-visible spectra of solutions of potassium iodide (0.3 mM), acidified to
pH 2 with sulfuric acid, were recorded at measured time intervals after addition of Oxone®
(40μL of 1% or 2% solution), to monitor the presence of iodine species via the characteristic
absorbance wavelengths of I2 (460nm), I3− (290 and 350 nm) and I− (226 nm).
Using a cation-exchange column:
An OnGuard-H™ cartridge was loaded with Pd2+ by passing palladium nitrate solution (100
μg mL-1, 8 mL) through the cartridge. Following this, 13 mL of an aqueous solution containing
500 μg L-1 iodide and 50 μg mL-1 Ca2+ was passed thorough the cartridge. The percentage of
applied palladium and iodide retained on the cartridge was monitored by ICP-MS
determination of these elements in the eluent. The cartridge was washed with methanol,
before applying a solution of ammonium thiosulfate (0.01M, 0.5 mL) to the cartridge to elute
the iodide (as palladium iodide). This procedure was tried using the milk digest solution in
place of the aqueous iodide/calcium solution.
Page 11 of 26
Results and Discussion
Determination of 127I in milk powder
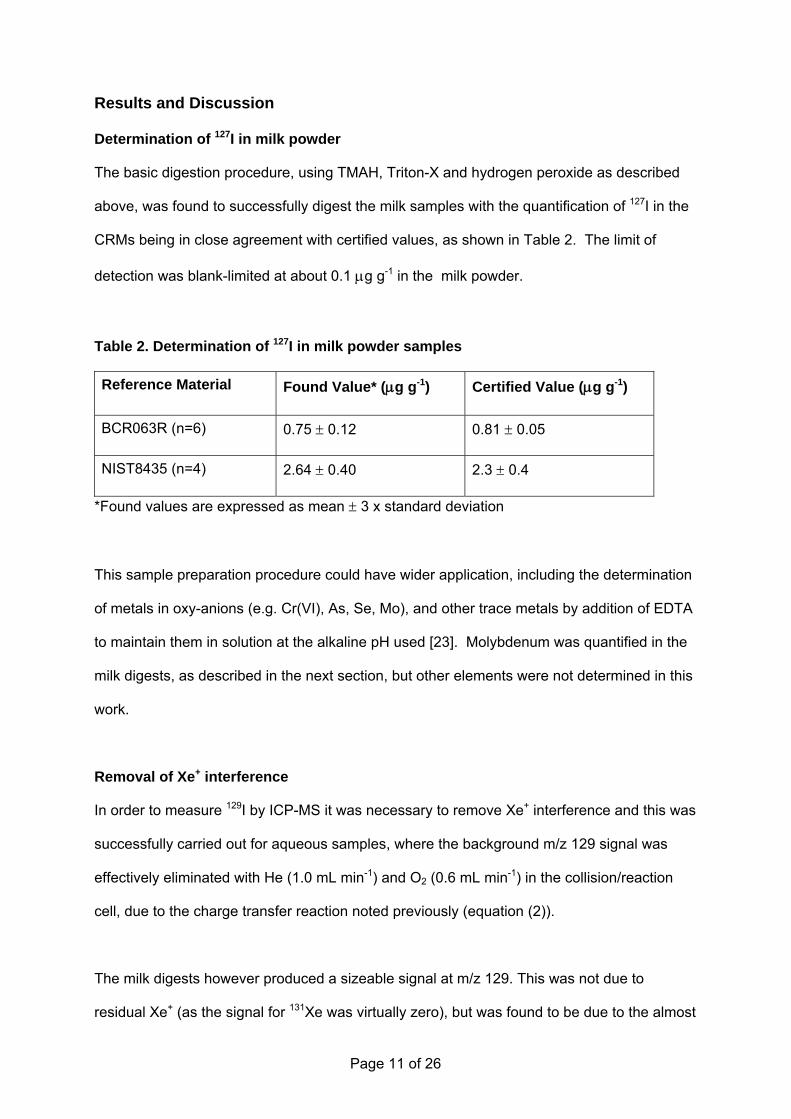
The basic digestion procedure, using TMAH, Triton-X and hydrogen peroxide as described
above, was found to successfully digest the milk samples with the quantification of 127I in the
CRMs being in close agreement with certified values, as shown in Table 2. The limit of
detection was blank-limited at about 0.1 μg g-1 in the milk powder.
Table 2. Determination of 127I in milk powder samples
Reference Material Found Value* (μg g-1) Certified Value (μg g-1)
BCR063R (n=6) 0.75 ± 0.12 0.81 ± 0.05
NIST8435 (n=4) 2.64 ± 0.40 2.3 ± 0.4
*Found values are expressed as mean ± 3 x standard deviation
This sample preparation procedure could have wider application, including the determination
of metals in oxy-anions (e.g. Cr(VI), As, Se, Mo), and other trace metals by addition of EDTA
to maintain them in solution at the alkaline pH used [23]. Molybdenum was quantified in the
milk digests, as described in the next section, but other elements were not determined in this
work.
Removal of Xe+ interference
In order to measure 129I by ICP-MS it was necessary to remove Xe+ interference and this was
successfully carried out for aqueous samples, where the background m/z 129 signal was
effectively eliminated with He (1.0 mL min-1) and O2 (0.6 mL min-1) in the collision/reaction
cell, due to the charge transfer reaction noted previously (equation (2)).
The milk digests however produced a sizeable signal at m/z 129. This was not due to
residual Xe+ (as the signal for 131Xe was virtually zero), but was found to be due to the almost
Page 12 of 26
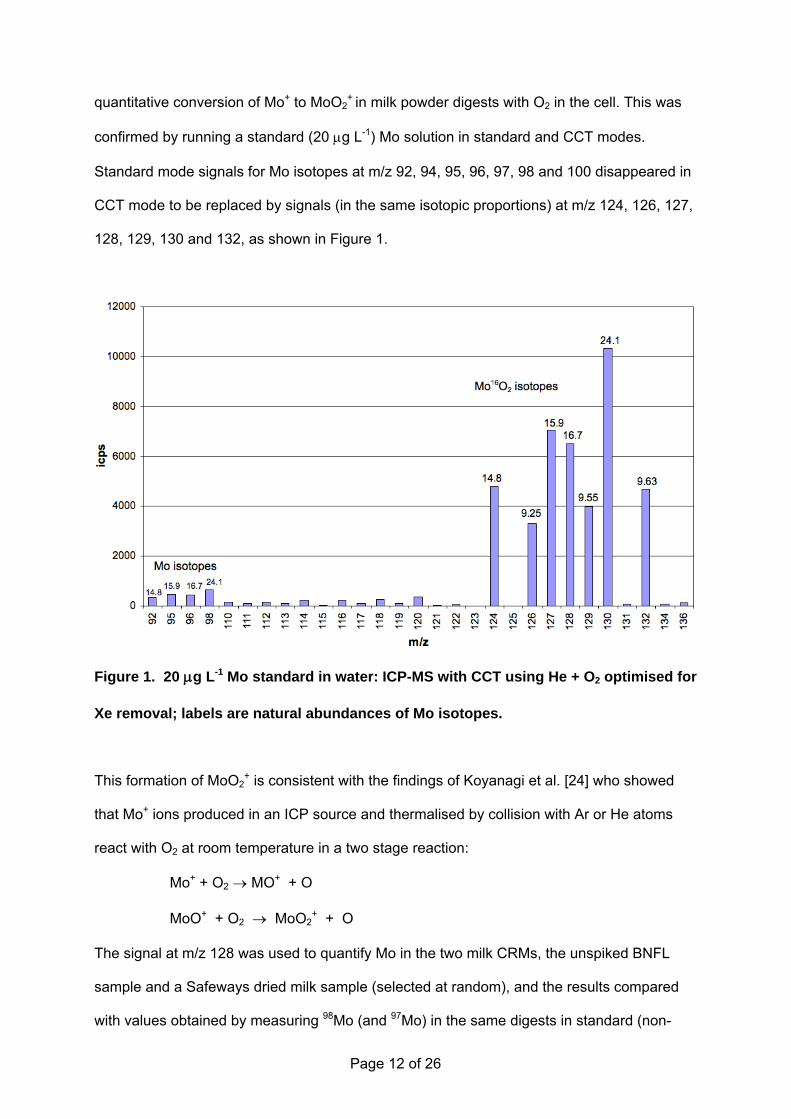
quantitative conversion of Mo+ to MoO2+
in milk powder digests with O2 in the cell. This was
confirmed by running a standard (20 μg L-1) Mo solution in standard and CCT modes.
Standard mode signals for Mo isotopes at m/z 92, 94, 95, 96, 97, 98 and 100 disappeared in
CCT mode to be replaced by signals (in the same isotopic proportions) at m/z 124, 126, 127,
128, 129, 130 and 132, as shown in Figure 1.
Figure 1. 20 μg L-1 Mo standard in water: ICP-MS with CCT using He + O2 optimised for
Xe removal; labels are natural abundances of Mo isotopes.
This formation of MoO2+ is consistent with the findings of Koyanagi et al. [24] who showed
that Mo+ ions produced in an ICP source and thermalised by collision with Ar or He atoms
react with O2 at room temperature in a two stage reaction:
Mo+ + O2 → MO+ + O
MoO+ + O2 → MoO2+ + O
The signal at m/z 128 was used to quantify Mo in the two milk CRMs, the unspiked BNFL
sample and a Safeways dried milk sample (selected at random), and the results compared
with values obtained by measuring 98Mo (and 97Mo) in the same digests in standard (non-

Page 13 of 26
CCT) mode. In all cases 121Sb was used as the internal standard for the determinations. The
results are summarized in Table 3 and it can be seen that there is good agreement between
the Mo values recorded in the two instrumental modes and also that the results for the CRMs
are in acceptable agreement with the certified value for NIST8435. The detection limit for Mo
was 0.01 μg g-1 in the milk powder in both standard and CCT modes.
Table 3. Determination of molybdenum in milk powder samples in standard and CCT modes
Sample
Mo content (μg g-1) from 98Mo/121Sb (standard mode)*
Mo content (μg g-1) from 128MoO2/121Sb (CCT mode)*
Certified (c) values (μg g-1)
BCR063R 0.23 ± 0.03 0.23 ± 0.08 n/a
NIST8435 0.22 ± 0.04 0.24 ± 0.03 0.29 ± 0.13 (c)
BNFL (unspiked) 0.40 ± 0.10 0.37 ± 0.11 n/a
Safeways dried milk 0.31 ± 0.13 0.27 ± 0.16 n/a
* Experimental values are expressed as mean ± 3 x standard deviation of results from 3 separate digests of each sample. Quantitation using 97Mo/121Sb gave the same results as 98Mo/121Sb.
As can be seen from Table 3, Mo concentrations in the milk samples were all similar and in
the range 0.2 - 0.4 μg g-1 (5 - 10 μg L-1 in the digest solution). This is not high enough to
cause noticeable interference with the measurement of 127I in milk, though may be significant
(5 - 10% increase in m/z 127 signal) for iodine levels less than 1 mg kg-1 in milk powder.
However, interference on 129I at low levels would clearly be severe, as can be seen in Table
4 which shows typical signal levels obtained for standards and digest solutions, with and
without the use of gas in the collision cell.
Attempts were made to adjust conditions in the cell to try to remove as much Xe as possible
whilst minimising production of MoO2+ and maintaining a strong iodine signal at m/z 127. A
mixed standard solution containing 10 μg L-1 molybdenum and 20 μg L-1 iodine was
Page 14 of 26
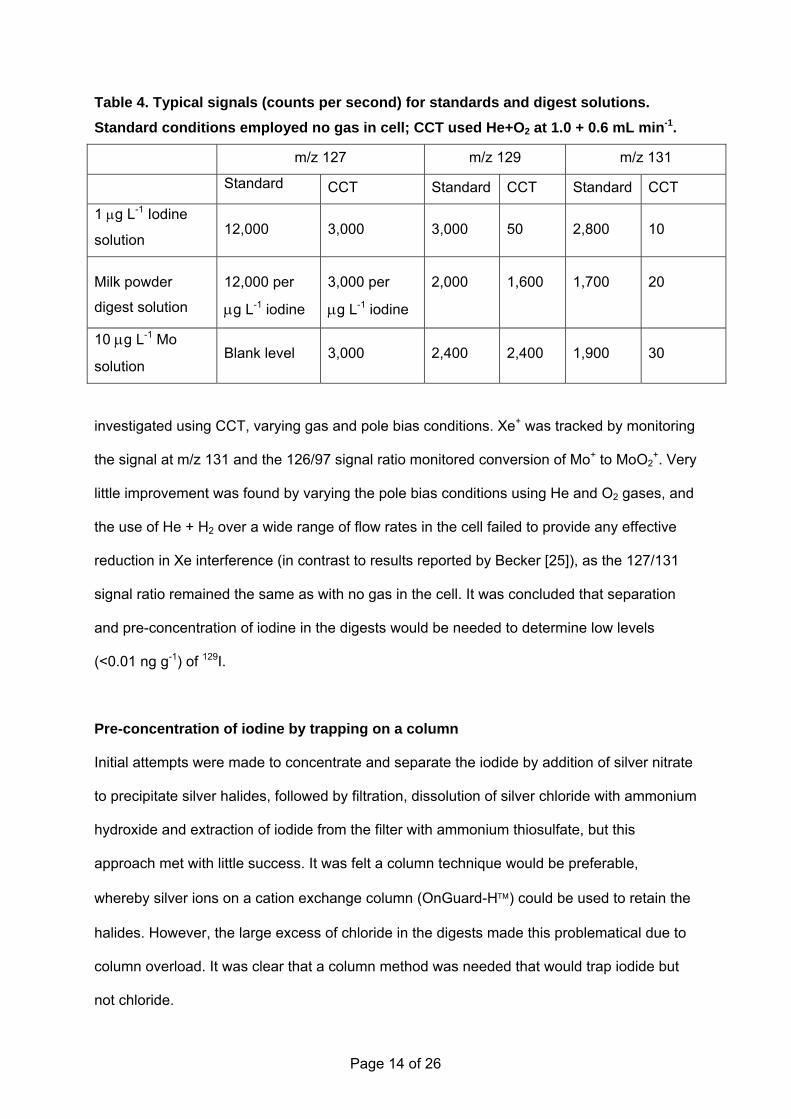
Table 4. Typical signals (counts per second) for standards and digest solutions. Standard conditions employed no gas in cell; CCT used He+O2 at 1.0 + 0.6 mL min-1.
m/z 127 m/z 129 m/z 131
Standard CCT Standard CCT Standard CCT
1 μg L-1 Iodine
solution 12,000 3,000 3,000 50 2,800 10
Milk powder
digest solution
12,000 per
μg L-1 iodine
3,000 per
μg L-1 iodine
2,000 1,600 1,700 20
10 μg L-1 Mo
solution Blank level 3,000 2,400 2,400 1,900 30
investigated using CCT, varying gas and pole bias conditions. Xe+ was tracked by monitoring
the signal at m/z 131 and the 126/97 signal ratio monitored conversion of Mo+ to MoO2+. Very
little improvement was found by varying the pole bias conditions using He and O2 gases, and
the use of He + H2 over a wide range of flow rates in the cell failed to provide any effective
reduction in Xe interference (in contrast to results reported by Becker [25]), as the 127/131
signal ratio remained the same as with no gas in the cell. It was concluded that separation
and pre-concentration of iodine in the digests would be needed to determine low levels
(<0.01 ng g-1) of 129I.
Pre-concentration of iodine by trapping on a column
Initial attempts were made to concentrate and separate the iodide by addition of silver nitrate
to precipitate silver halides, followed by filtration, dissolution of silver chloride with ammonium
hydroxide and extraction of iodide from the filter with ammonium thiosulfate, but this
approach met with little success. It was felt a column technique would be preferable,
whereby silver ions on a cation exchange column (OnGuard-H™) could be used to retain the
halides. However, the large excess of chloride in the digests made this problematical due to
column overload. It was clear that a column method was needed that would trap iodide but
not chloride.

Page 15 of 26
To this end, the use of a Pd2+-loaded column was investigated, to make use of the insolubility
of PdI2 compared to the solubility of PdCl2. Passing Pd(NO3)2 solution (100 μg mL-1, 8mL)
through an OnGuard-H™ cartridge resulted in effective saturation of available sites with Pd2+.
However, on passing through aqueous solutions of potassium iodide, it was found that iodide
was poorly retained on the cartridge, indicating that little PdI2 was being formed. This
problem was alleviated by the addition of Ca2+ which by competing for binding sites appeared
to mobilise the Pd2+ making it available for PdI2 formation. On passing 13 mL of an aqueous
solution of 500 μg L-1 I− plus 50 μg mL-1 Ca2+ through the Pd2+-loaded cartridge it was found
that >97% of the iodide was retained on the cartridge; for lower levels of iodide (100 μg L-1 I−)
the retention was a little less efficient, but still >80%.
It was found that a 0.01M solution of ammonium thiosulfate was very efficient at eluting the
PdI2 from the cartridge in a small volume (the characteristic brown colour was seen within the
first 0.5 mL of eluent, whereafter the eluent ran clear) whilst avoiding the column degradation
observed with higher thiosulfate concentrations. Thus a high pre-concentration factor could
be achieved. It was further found that methanol did not elute any of the iodide; thus methanol
could be used as a wash step between loading and eluting the column, to remove any
unwanted organic matter.
It was hoped that this success at pre-concentrating iodine (as iodide) in aqueous samples
using a Pd2+-loaded cartridge could be translated to the milk digest samples. This optimism
was fuelled by the fact that the milk samples already contained sufficient calcium to facilitate
retention on the cartridge, and the cartridges have a quoted pH working range of 0-14 and
hence would not be adversely affected by the strongly alkaline digests. However, the
method did not work with the milk digests. The palladium was stripped from the cartridge on
application of the digest solution and consequently iodide was not retained; it is likely that the
Pd2+ was displaced by the tetramethylammonium ion present in large excess from the
digestion reagent.

Page 16 of 26
It was thought that it might be possible to form PdI2 within the digest solution simply on
addition of a large molar excess of Pd(NO3)2. However, experiments such as a Bjerrom plot
and speciation simulations using CHESS (Chemical Equilibrium of Species and Surface
environmental speciation modelling software, ARMINES, Fontainebleu, France) showed that,
at the strongly alkaline pH of the digest solution, Pd2+ does not exist and that the dominant
species will in fact be PdO (aq) and Pd(OH)2. The Pd2+ ion will only exist in the solution if the
pH < 2. This is important since it would suggest that the formation of PdI2 would not be ionic
and would not occur rapidly; instead the reaction would have to proceed by a ligand
substitution reaction and could potentially be very slow.
Pre-concentration of iodine by oxidation/solvent extraction
As an alternative to a column separation, solvent extraction was tried, extracting the analyte
as molecular iodine from an acidified digest (HNO3 added to pH 2), using toluene as the
solvent. The non-polar, but highly polarisable, molecular iodine should be extracted into the
toluene layer. Ammonium thiosulfate or TMAH could then be used to back-extract the iodine
as iodide into a small volume of aqueous solution. However, very low and variable amounts
of iodine were extracted from digests (as measured by ICP-MS), despite various
modifications to the conditions (e.g. pH adjustments, omission of Triton-X, addition of NaCl)
to try to improve the separation and extraction process.
The I2 may well have been lost through one or more of a variety of other reactions which may
have been favoured under the conditions used, such as:
• Formation of I2-Cl− (due to high Cl− in digests)
• Interaction of I2 with H2O, e.g.
(3)
• Loss of I2 via disproportionation to I− and IO3−
• Formation of I3−:

Page 17 of 26
(4)
Spiking the digests with potassium iodide (ca. 0.1mM or 20 μg mL-1) appeared to enable the
formation of molecular iodine and its subsequent reduction to iodide to be visibly tracked
although later studies showed that the visible species was almost certainly I3−. In addition,
the H2O2/HNO3 in the digest may have provided insufficient oxidation potential to form I2
reliably.
The formation of I3− (equation (4)) was clearly shown by measuring UV-visible spectra of
acidified solutions (pH 1-2) containing potassium iodide (2 -10mM) and hydrogen peroxide
(20 vol, 4mL) in 20 mL water, which showed sizeable peaks at 350 nm and 460 nm (Figure 2
(a),(b)) indicating the presence of I3− and I2, thus showing oxidation of the iodide to iodine,
with significant I3− also produced.
The size of the I2 peak (460 nm) decreased at pH >1 and at pH 3 and higher the I2 peak
disappeared, though the I3− peak could be seen up to pH 6, indicating that any I2 produced
under these less acidic conditions appeared to be complexed with the large excess of I−.
(Note that the large peak at ca. 300 nm is due to the nitrate ion of the nitric acid used to
acidify the solution). Further evidence for the formation of I3− in oxidised iodide solutions was
found during studies into a possible method for removing trace iodine contamination from the
TMAH reagent by a polarographic method. Electrochemical oxidation of potassium iodide (in
deionised water with 0.1 M KCl electrolyte) produced a straw-coloured liquid with a UV-
visible spectrum having characteristic I3− peaks (290 nm and 350 nm) but no I2 peak at 460
nm (Figure 2 (c)).

Page 18 of 26
(a)
(b)
(c)
Figure 2: UV-visible absorbance spectra of potassium iodide solution after oxidation (a) with H2O2 at pH 1, (b) with H2O2 at pH 2.2 and (c) electrochemically in water + 0.1M KCl. Peaks indicate the presence of I3− (290 & 350 nm) in (a-c) and I2 (460 nm) in (a, b).
Use of Oxone® as oxidising agent
As oxidation to I2 may not have been taking place reliably in the acidified digest, it was felt
that a more powerful oxidising agent than H2O2 + HNO3 in the digest was required. Oxone®
(Dupont Chemicals) has as its active ingredient potassium monopersulfate (KHSO5) which is
present in the triple salt potassium hydrogen peroxymonosulfate sulfate
(2KHSO5.KHSO4.K2SO4, molecular weight 614.7) [26]. Oxone® dissolved in water is
naturally acidic (pH 2.3 for 1% solution, pH 2.0 for 3% solution), and undergoes reduction as
shown in the following half reaction:

Page 19 of 26
HSO5− + 2H+ + 2e− → HSO4
− + H2O E0 = +1.44V
and thus the reduction potential is sufficiently positive to enable Oxone® to reliably and
completely oxidise I− to I2 at room temperature in acid solution, via the reaction:
HSO5− + 2H+ + 2I− → HSO4
− + I2 + H2O (5)
By monitoring the characteristic UV-visible absorbance wavelengths of I2 (460nm), I3− (290
and 350 nm) and I− (226 nm) in test solutions, Gazda et al.[27] showed that Oxone®
treatment was capable of converting not only I− but also I3− to I2, probably as a result of
oxidation of all available I− causing a shift in the equilibrium of equation (4).
To investigate the effect of using Oxone® instead of H2O2 as an oxidising agent for iodide,
Oxone® (1.25 mM) was added to 20 mL of potassium iodide solution (5 mM). The UV-
visible spectrum of the solution was measured at 10 minute intervals. The spectra were very
different from those observed using H2O2 at the same pH (pH 2). Only the I2 peak (460 nm)
was evident; the I3− peaks were entirely absent, and the I2 peak gradually decreased over
time, disappearing completely an hour after the Oxone® was first added (Figure 3).
A possible reason for this decline in I2 could be due to the formation of volatile HI in acidic
solution, or reaction with water to produce HOI and I− (equation (3)). Although Oxone® has
sufficient oxidation potential in principle to convert I2 to IO3−, (E0 = +1.21V), in practice this
reaction is not favoured at low pH.
Acidic conditions are necessary for the Oxone® to work (equation (5)) and this was
confirmed in practice. A 1% aqueous solution of Oxone® had a natural pH of 2 and adjusting
to alkaline pH meant that the iodide was not oxidised.

Page 20 of 26
(a) (b)
Figure 3: UV-visible spectra showing the gradual disappearance of I2 produced in acidified potassium iodide solution (a) immediately after adding Oxone® and (b) one hour later; (c) shows the decline in absorbance at 460 nm (I2 peak) over the one-hour period.
Subsequent experiments with varying concentrations of potassium iodide showed that a
concentration of 50 μg mL-1 (0.3 mM), acidified to pH 2 with sulfuric acid (to avoid interfering
nitrate peaks) produced a very large but on-scale iodide peak and such a solution was used
to follow the oxidation process, by adding Oxone® directly into the quartz cuvette and
observing the change in the spectrum over time. The UV-visible spectrum of Oxone®
solution alone showed only one peak at 202 nm; thus any un-reacted Oxone® would not
mask the peaks due to iodine species.
Page 21 of 26
After measuring the spectrum of the 50 μg mL-1 acidified potassium iodide solution, 40μL of
Oxone® solution (1%) was added and the spectrum recorded immediately, then again after 5
min and 10 min. On addition of Oxone®, the iodide peak (226 nm) reduced in size and small
peaks at 290 nm, 350 nm and 460 nm appeared. However, after 5 min, the peaks at 290 and
350 nm (I3−) had more than doubled in size, whilst that at 460 nm (I2) remained very small.
The spectrum after 10 min remained virtually the same with a very slight further reduction in
the iodide peak at 226 nm (see Figure 4a).
The above experiment was repeated, but this time doubling the amount of Oxone® added.
This time the iodide peak essentially disappeared on addition of Oxone®, and three small
peaks at 290, 350 and 460 nm appeared, but after 5 min the first two of these had gone,
leaving a single peak at 460 nm, which almost doubled in size from 0 - 5 min before
gradually decreasing but remaining at about two-thirds of its maximum height after an hour
(see Figure 4b). This indicated that the higher level of Oxone® had successfully oxidised the
I− to I2, and the I3− formed (according to equation (4)) had also been quantitatively converted
to I2, as previously reported [27].
The above experiments showed that if insufficient Oxone® were added, such that un-
oxidised iodide remained, any I2 formed would complex with the remaining I− to leave I3− as
the dominant oxidised species. Therefore Oxone® should be added in excess to a solution at
pH 2 to ensure quantitative conversion to I2.
Whilst the iodine species formed in aqueous iodide solutions treated with Oxone® could
usefully be monitored via their UV-visible absorbance profiles, it was not possible to monitor
the iodine species in the digest solutions directly by UV-visible spectroscopy, due to large
absorbances of other components in the digest matrix masking the iodine peaks.

Page 22 of 26
(a) (b)
Figure 4: UV-visible spectra showing the effect of treating a 50 μg mL-1 solution of
acidified potassium iodide (pH 2) in a standard UV cuvette with (a) 40 μL of 1%
Oxone® solution and (b) 40 μL of 2% Oxone® solution, where t is the time period
between the addition of Oxone and recording the spectrum (The peak at ~200 nm is probably due to residual Oxone®).
Solvent Extraction following Oxone® oxidation
Digests of the milk sample spiked with 129I were prepared for analysis using the Oxone
oxidation/extraction scheme as detailed in the Experimental section. These, along with
procedural blanks and un-extracted digests for comparison, were introduced to the ICP-MS,
with the collision cell employed as described earlier. The signals at m/z 95, 97, 126, 127,
128, 129, 130 and 131 were measured. By monitoring m/z 131, it was seen that Xe+ had
been successfully removed. Monitoring m/z 126-130 showed clearly the characteristic
pattern of MoO2+ for the un-extracted digest, except that the signal at m/z 129 was higher
Page 23 of 26
than would be expected from the Mo isotope ratios, indicating that 129I was being detected,
albeit largely masked by the MoO2+ signal. In principle, the pre-concentration procedure
should remove the molybdenum and lead to a ten-fold increase in iodine signals at m/z 127
and 129 (20 mL digest solution to 2 mL ammonium thiosulfate extract). Whilst analysis of the
pre-concentrated digest showed that the MoO2+ interference had been essentially removed,
the signal at m/z 129 was much lower than would be expected for the 129I (assuming a
concentration factor of 10). Moreover the 127I signal had only increased by a factor of 3.
Possible reasons for the poor extraction efficiency can be suggested by considering the
stages in the extraction and the possible iodine species formed. In the initial digest, it is
assumed that the iodine is present mostly as free iodide [6] and some organic iodine which is
released according to
which is heavily biased towards the right hand side of the equilibrium when TMAH is present.
Once the iodide is oxidised to iodine on addition of Oxone® (equation (5)), there is the
possibility that it may be complexed by residual organic matter in solution. The addition of a
strong complexing agent with a high affinity for iodine might mitigate this effect and aid the
extraction of iodine. Polyvinylpyrrolidone (PVP) should fulfil this function, and the yellow
colour of the iodine-PVP complex (used as a colorimetric reagent for iodine determination
[27]) could aid visual tracking of the extraction.
Alternatively, it has been shown that iodine readily complexes with iodide ions to form I3−. In
the presence of a large excess of chloride ions in the digest (of the order of 250 μg mL-1),
I2Cl− may be formed, thus hampering extraction of I2 into toluene. One solution to this would
be to add silver nitrate after the I2 has been formed, to precipitate out the chloride as AgCl
and thus avoid the formation of I2Cl−.
Page 24 of 26
Addition of either PVP or silver nitrate to the digests yielded no improvement in extraction
efficiency, although the work was hampered by high blanks at m/z 127 and m/z 129 from the
addition of the reagents, as seen in the procedural blanks.
Conclusion
The complex redox chemistry of iodine makes this a difficult element to extract from complex
biological matrices and determine at low (sub μg L-1) concentrations, as encountered when
monitoring low levels of 129I in milk. This work has yielded a reliable method for the
determination of 127I in milk samples (verified with certified reference materials), using
alkaline digestion with TMAH and hydrogen peroxide, followed by quadrupole ICP-MS
analysis. The digestion method has been successfully applied to the determination of
molybdenum in milk and could also be used to prepare biological materials for determination
of other anions, e.g. of Se and As and, with the addition of EDTA, trace metals analysis.
Investigation of pre-concentration/extraction techniques to remove the matrix interferences,
as well as raising the 129I concentration to measurable levels, has resulted in a new method
for the separation and pre-concentration of iodide, using a Pd2+-loaded cation-exchange
column followed by elution with ammonium thiosulfate, which although unsuitable for the milk
digests, is applicable to aqueous samples.
A new method for the preconcentration of iodide and removal of interferences in the milk
digest solutions, via oxidation with Oxone®, extraction into toluene and back-extraction into
ammonium thiosulfate, has shown some promise, although the extraction efficiency was low.
Further measures to control the iodine chemistry during the extraction would need to be
developed before this can be considered a viable method for this application.
Acknowledgements
Page 25 of 26
The authors wish to thank BNFL for advice, sponsorship and provision of samples, and
Thermo Analytical for the provision of the PQ ExCell instrument. The laboratory work of
former Loughborough University students Geraldine Connally, Matt Dexter, Earny Silva,
Claire Tyler, Peter Winship and Shen Xu is also gratefully acknowledged.
References
[1] R.G. Jensen (ed.), Handbook of Milk Composition, Academic Press, USA, 1995.
[2] F.A.R. Martino, M.L.F. Sanchez and A.S. Medel, J. Anal. At. Spectrom., 15 (2000) 163.
[3] P. Bratter, I.N. Blasco, V.E.N. de Bratter and A. Raab, Analyst, 123 (1998) 821.
[4] P.A. Fecher, I. Goldmann and A. Nagengast, J. Anal. At. Spectrom., 13 (1998) 977.
[5] E.H. Larsen, P. Knuthsen and M. Hansen, J. Anal. At. Spectrom., 14 (1999) 41.
[6] L.F. Sanchez and J. Szpunar, J. Anal. At. Spectrom., 14 (1999) 1697.
[7] O.T. Farmer, C.J. Barinaga and D.W. Koppenaal, J. Radioanal. Nucl. Chem., 234 (1998) 153.
[8] B.G. Fritz and G.W. Patton, J. Environ. Radioact., 86 (2006) 64.
[9] K. Simpson, S.J. Parry, and M.J. Fulker, J. Radioanal. Nucl. Chem., 249 (2001) 89.
[10] S.J. Parry, B.A. Bennett, R. Benzing, A.E. Lally, C.P. Birch, and M.J. Fulker, Sci. Total Environ., 173 (1995) 351.
[11] H. Vanhoe, F.V. Allemeersch, J. Versiek, and R. Dams, Analyst, 118 (1993) 1015.
[12] A.V. Izmer, S.F. Bouliger, and J.S. Becker, J. Anal. At. Spectrom., 18 (2003) 1339.
[13] P. Bienvenu, E. Brochard, E. Excoffier, and M. Piccione, Canadian Journal of Analytical Sciences And Spectroscopy, 49 (2004) 423.
[14] H. Baumann, Fresenius’ J. Anal.Chem., 338 (1990) 809.
[15] S. Sturup and A. Buchert, Fresenius’ J. Anal. Chem., 354 (1996) 323.
[16] R. Hille, Archives of Biochemistry and Biophysics, 433 (2005) 107.
[17] E. Niedobova, J. Machat, V. Otruba and V. Kanicky, J. Anal. At. Spectrom., 20 (2005) 945.

Page 26 of 26
[18] M. Resano, E. Garcia-Ruiz, L. Moens and V. Vanhaecke, J. Anal. At. Spectrom., 20 (2005) 81.
[19] M.A. Dexter, Ph.D. Thesis, Loughborough University, 2003.
[20] G.C. Eiden, C.J. Barinaga and D.W. Koppenaal, Rapid Commun. Mass Spectrom., 11 (1997) 37.
[21] R. Santamaria-Fernandez, P. Evans, C.S.J. Wolff-Briche and R. Hearn, J. Anal. At. Spectrom., 21 (2006) 413.
[22] M.A. Dexter, H.J. Reid and B.L. Sharp, J. Anal. At. Spectrom., 17 (2002) 676.
[23] A.A. Bashammakh, Ph.D. Thesis, Loughborough University, 2003.
[24] G.K. Koyanagi, D. Caraiman, V. Blagojevic and D.K. Bohme, J. Phys. Chem. A, 106 (2002) 4581.
[25] J.S. Becker, J. Anal. At. Spectrom., 17 (2002) 1172.
[26] DuPont Oxone® Monopersulfate Compound Technical Information, http://www.dupont.com/oxone/techinfo/index.html (accessed 7 Jun 2007)
[27] D.B. Gazda, R.J. Lipert, J.S. Fritz and M.D. Porter, Anal. Chim. Acta, 510 (2004) 241.