determination of finish-cutting operation number and machining
TRANSCRIPT

Journal of Materials Processing Technology 87 (1999) 69–81
Determination of finish-cutting operation number andmachining-parameters setting in wire electrical discharge machining
J.T. Huang, Y.S. Liao *, W.J. HsueDepartment of Mechanical Engineering, National Taiwan Uni6ersity, 1, Sec. 4, Roose6elt Road, Taipei 10764, Taiwan
Received 9 August 1997
Abstract
Wire electrical discharge machining (WEDM) plays an important role in precision manufacturing. To obtain a preciseworkpiece with good surface quality, some extra repetitive finish cuts along the rough cutting contour are necessary. An attempthas been made to unveil the influence of the machining parameter (pulse-on time, pulse-off time, table feed-rate, flushing pressure,distance between wire periphery and workpiece surface, and machining history) on the machining performance of WEDM infinish cutting operations. The gap width, the surface roughness and the white layer depth of the machined workpiece surface aremeasured and evaluated. Based on the Taguchi quality design method and numerical analysis, it is found that the pulse-on timeand the distance between the wire periphery and the workpiece surface are two significant factors affecting the machiningperformance. Mathematical models relating machining parameters and performance are established by regression, and non-linearprogramming using the Feasible-direction algorithm was used to obtain the optimal machining parameters. A strategy of optimalmulti-cut WEDM process planning from rough to finish cutting operations, including the number of machining operations andtheir corresponding machining-parameters setting for each operation, has been proposed. Experimental results show that theproposed approach can achieve better performance than that achieved by a well-skilled operator. A better surface quality andaccurate dimension value can be obtained in less machining time. © 1999 Published by Elsevier Science S.A. All rights reserved.
Keywords: Wire electrical discharge machining; Finish cutting; Machining parameters; Offset; Taguchi method
1. Introduction
The technologies of wire electrical discharge machin-ing (WEDM) have been emphasized significantly andhave improved rapidly in recent years owing to therequirements in various manufacturing fields, especiallyin the precision die industry. Good rigidity and thedynamic characteristic of the machine are pre-requisitesto achieving optimal machining performance. In addi-tion, proper machining-parameters setting of WEDMalso plays an important role. The setting of machiningparameters relies strongly on the experience of operatorsand machining-parameters tables provided by machine-tool builders. It is difficult to utilize the optimal func-tions of a machine owing to their being too manyadjustable machining parameters.
Usually some extra repetitive finish cuts along thecontour of a previous cut are necessary, by offsetting thewire by a value as shown in Fig. 1, so that the specifiedaccuracy and good surface quality can be obtained. Thefinish-cutting process is a process of one-side cuttingwith a smaller offset value, which needs smaller electri-cal discharge energy and results in a faster tablefeed-rate. Besides the generally-required machining con-ditions in rough cutting, the number of finish cuts andtheir corresponding offset value in each cut should bespecified before the start of machining operations [1].The offset is important in process planning and its valueis always given in WEDM machining-parameters settingtables. Inappropriate offset value leads to unsatisfactoryaccuracy, and will reduce the surface quality of themachined part also. Because of the non-contact charac-teristic of electrical discharge and gap-width estimationof multi-cuts, determining an optimal offset value inadvance is difficult and still a challenge.
* Corresponding author. Fax: +886 22 3631755; e-mail:[email protected]
0924-0136/99/$ - see front matter © 1999 Published by Elsevier Science S.A. All rights reserved.
PII S0924-0136(98)00334-3

J.T. Huang et al. / Journal of Materials Processing Technology 87 (1999) 69–8170
Fig. 1. A schematic plan view of: (a) rough and; (b) finish, cutting of WEDM.
Kravet [1] proposed a calculation method for amulti-cut finish-cutting process in WEDM. The numberof machining operations was determined by minimizingthe total machining time (Tm)=�n
1 (machining volume/metal removal rate). In this expression, the machiningvolume and the metal removal rate are both functionsof surface roughness, and they are difficult to estimateaccurately. Furthermore, the approach to determine theoptimal machining parameters for each operation suchas pulse-on time, pulse-off time, etc. was not discussed.
Scott, Boyina and Rajurkar [2] used a factorial de-sign method to determine the optimal combination ofcontrol parameters in WEDM, the measures of machin-ing performance being the metal removal rate and thesurface finish. It was found that the discharge current,the pulse duration and the pulse frequency are signifi-cant control factors. A total number of 729 experimentswere conducted, and 32 machining-parameters settingsthat resulted in a better metal removal rate and surfaceroughness were determined by a numerical method.However, this approach requires too many experimentsand finish cutting operations are not considered.
Tarng [3] applied a neural network with a simulatedannealing (SA) algorithm to determine the optimalcutting parameters in WEDM. A neural network caneasily formulate a model of the cutting parameters andperformance by training and learning. This researchfocused on the rough cutting process only, where finishcutting number and offset value were not discussed. Amulti-objective function, which is the weighted combi-nation of surface roughness and machining speed, wasadopted as the main objective function. However, this
cannot provide the optimal machining parameters foran arbitrary desired surface roughness.
Machining-parameters setting tables, from rough tofinish cutting, help the machine-user to make decisions
Table 1Machining conditions
Item Value
SKD11 alloy steelWorkpiece (anode)Electrode (cathode) f0.25 mm brass wire
30 mmWorkpiece height95 VOpen voltage
Servo reference voltage 10 VFluid specific resistance 1–3 mA
Table 2Experimental design
Level 3Level 2Level 1Control factor
a b —His0.2 0.3Ton 0.1
3.2 8Toff 12.882Feed 5
−20 −45Dww +50.5 1.0P 1.5
Table 3Machining conditions used in rough cutting
Wire tension Wire speedCase Ton Toff Feed P
1200 5a 0.3 8 0.4 42.6 6 1000b 0.9 917.6

J.T. Huang et al. / Journal of Materials Processing Technology 87 (1999) 69–81 71
Fig. 2. The non-uniform area of a machined workpiece in thefinish-cutting operation: (a) larger Dww; (b) smaller Dww.
Fig. 3. Measurement of the white layer depth (SEM photograph).
Table 4Computed F value of Ygap, Yra and Ys
Yra F0.05,n1,n2YsFactors YdYgap
0.300 5.99His 0.177 0.002 4.031�
5.677* 1.705Ton 9.151* 47.403* 5.140.9002.753 5.142.028Toff 1.520
5.001� 0.512 0.244 5.14Feed 1.3165.145.696*Dww 39.39* 10.476* 11.641*5.142.576 0.213P 0.1630.187
* Significant factor.� Sub-significant factor.
and hard to derive. Hence, it is desirable to have abetter understanding of the characteristics of finish-cut-ting process so that an effective approach to determinefinish cutting parameters setting can be proposed. Thiscan help machine-makers to establish optimal machin-ing tables efficiently, and moreover, to achieve the goalof automatic process planning.
In this paper, the finish-cutting operation numberand parameters setting of WEDM are the main con-cern. The influence of machining parameters (pulse-ontime, table feed, flushing, distance between the wireperiphery and the workpiece surface, and machininghistory (i.e. rough cutting conducted before finish cut-ting)) on the machining performance (gap width, sur-face roughness, white layer depth and finish-cuttingarea ratio) are analyzed first. The Taguchi qualitydesign method and numerical analysis are used to findsignificant factors affecting the machining performance.Mathematical models relating the machining parameterand performance are established by regression, andnon-linear programming using the feasible-direction al-gorithm is used to obtain the optimal machiningparameters. Based on experimental data and numericalanalysis, a practical strategy of multi-cut WEDM pro-cess planning from rough to finish cutting is proposedand verified.
2. Experimental method
2.1. Experimental design
Experiments were carried out on a Wire-EDM ma-chine with an iso-energy pulse generator, developed bythe Industrial Technology Research Institute (ITRI),Taiwan. The work material, electrode and other ma-chining condition are given in Table 1.
According to the Taguchi quality design concept [7],a L18 mixed orthogonal arrays table was chosen for theexperiments (Appendix A). Based on experience andrelated literature, six machining parameters: pulse-ontime (Ton); pulse-off time (Toff); table feed (Feed); flush-ing pressure (P); distance between wire periphery andworkpiece surface (Dww, Fig. 1); and machining history(i.e. rough cutting conducted before finish cutting,(His)); were chosen for the controlling factors and eachparameter was designed to have three levels denoted by1, 2 and 3, as shown in Table 2. Levels 1 and 2 in Table2 denoted by (a) and (b), respectively, are the roughcuts conducted in advance, their conditions are given inTable 3. The finish cutting results after the WEDMedprocess are evaluated in terms of the following mea-sured machining performance: gap width (Ygap, mm)surface roughness (Yra, mm), white layer depth (Yd, mm)and finish-cutting area ratio (Ys). The finish-cuttingarea ratio is defined as the real machining area dividedby the whole area to be machined. It has a value
of the stages of machining operations, power-parame-ters settings, etc. These machining-parameters tables,based on the in-house experimentation of the manufac-turer, are quite useful but are time-consuming to build.Moreover, this kind of machining decision is too con-servative and does not lead to an optimal solution [2].In recent years, some research has focused on theoptimal determination of machining parameter inWEDM, but are still concerned mostly with the rough-cutting process [2–4]. Even with several studies, opti-mal machining-parameters setting and process planningof WEDM still encounter some difficulties [5,6]. To bemore specific, it is too costly and time-consuming; theperformance is affected by too many parameters andthe real mathematical models between machiningparameters and performance are quite sophisticated

J.T. Huang et al. / Journal of Materials Processing Technology 87 (1999) 69–8172
Fig. 4. The variation of h values with machining parameters.
between 0 and 1, the value 1 meaning that a whole areais machined. Owing to the non-uniform surface afterthe rough-cutting operation, some area may not bemachined, as shown in the black area of Fig. 2, if asmaller Dww is used. Hence, the ratio will be helpful toreflect the real finish cutting situation indirectly.
In Taguchi quality engineering [7], the characteristicthat a higher value represents better machining perfor-mance, such as the finish-cutting area ratio, is called‘higher is better, HB’. Conversely, the characteristicthat a lower value indicates better machining perfor-mance, such as the white layer depth, the gap width,and the surface roughness, is called ‘lower is better,LB’. The signal–noise ratio, denoted by S/N ratio, is arepresentation to find significant parameters from thosecontrolling machining parameters by evaluation theminimum variance. For HB and LB, the definition of
the S/N ratio for machining performance results yi of nrepeated number (in this case n=3, i=1, 2, 3) are com-puted as:
HB: S/N ratio=1/�1
n� 1
y12+
1y2
2+ ···+1yn
2
��(1)
LB: S/N ratio=1/�1
n(y1
2+y22+ ···+yn
2)�
(2)
Let h=10�log(S/N ratio): then a larger h (or largerS/N ratio equivalently) is better for both HB and LB.
2.2. Data measurements
After being machined, the specimens were cleanedand their surface roughness (Yra) were measured using aHommel T4000 Turbo-Roughness instrument. The cut-

J.T. Huang et al. / Journal of Materials Processing Technology 87 (1999) 69–81 73
Fig. 5. (a) Sparking frequency and voltage vs Dww; and (b) surfaceroughness vs Dww.
scope. As for the measurement of the white layer depth,specimens were sectioned transversely, mounted,ground, polished and etched. The etching reagent usedwas Fry’s microetching solution (5 g CuCl2, 40 ml HCl,25 ml C2H5OH, 30 ml H2O) and the etching time wasabout 10 s. Then the specimens were photographedunder a JSM-6300 scanning electron microscope (SEM),a typical microphotograph is shown in Fig. 3. The whitelayer depth is obtained by measuring the thickness ofthe top layer depicted between two arrows in Fig. 3. Thefinish-cutting area ratio (Ys) was calculated approxi-mately as the finish cutting area divided by the wholearea to be cut under the microscope. All of the abovevalues were obtained by taking the average of at least15–20 measured data.
3. The influence of finish-cutting parameters onmachining performance
The h vales of machining parameters on performanceare calculated (Appendix A). With analysis of variance(ANOVA) and the statistical F-test (Appendix B), it isfound that Ton and Dww are the two dominant factors onthe machining performance in the finish cutting process.Table 4 shows the computed F values of six machiningparameters on each performance. The sign ‘�’ indicatessignificant factors for the reason that the computedF-value is greater than F0.05, n1, n2, the upper 95% pointof the F-distribution having n1 and n2 degrees of free-dom. Furthermore, the table feed-rate and the machin-ing history also have an influence on the surfaceroughness and the white layer depth, respectively.
3.1. Pulse-on time (Ton)
Fig. 4 shows the variation of h values with respect to
off value is 0.8 mm and the transverse length is 4.8 mm.Gap width (Ygap) is measured by a short circuit systemof the WEDM machine and a Nikon Measuring Micro-
Fig. 6. Illustration of the surface generation mechanism in finish cutting.
J.T. Huang et al. / Journal of Materials Processing Technology 87 (1999) 69–8174
each machining parameter for machining performanceof interest. It is found that larger Ton results in largerYgap, Yra, Yd and Ys because larger pulse-on time meanslarger electrical discharging energy, which will producea bigger crater. This is the same for the rough cuttingprocess.
3.2. Distance between wire periphery and workpiece sur-face (Dww):
In Fig. 4, a larger Dww results in larger Ygap and Ys,and smaller Yd because the wire is closer to the work-piece. However, it causes Yra to decrease first, thensubsequently it is increased. In order to reveal the effectof Dww more comprehensively, some other experimentswere conducted. Fig. 5(a, b) show the sparking fre-quency and average gap voltage, and the surface rough-ness, respectively, against Dww. It is reasonable that thesparking frequency is increased and the voltage is de-creased with respect to the increase of Dww, as shown inFig. 5(a). In Fig. 5(b), the varying trend of the Dww
value on the surface roughness, mentioned previously,can be seen again. An idealistic finish-cutting mecha-nism is proposed in Fig. 6, which may explain thereason why a better Yra can be obtained by using anegative and medium Dww value (about −30 mm in thisresearch). From Figs. 4 and 5, a negative and mediumDww can remove the surface peak of workpiece tominimize the surface roughness but the area will not bemachined completely. There is no discharge for asmaller Dww because the distance between the work-piece surface and the wire periphery is larger than theminimum electrical discharging gap. Contrarily, thewhole surface can be machined under a larger Dww, butit will take a longer time and result in a medium Yra.Hence, in order to obtain a smaller Yra, a negative andmedium Dww is appropriate. A larger Dww should beused for a larger finish-cutting area ratio and smallerwhite layer depth.
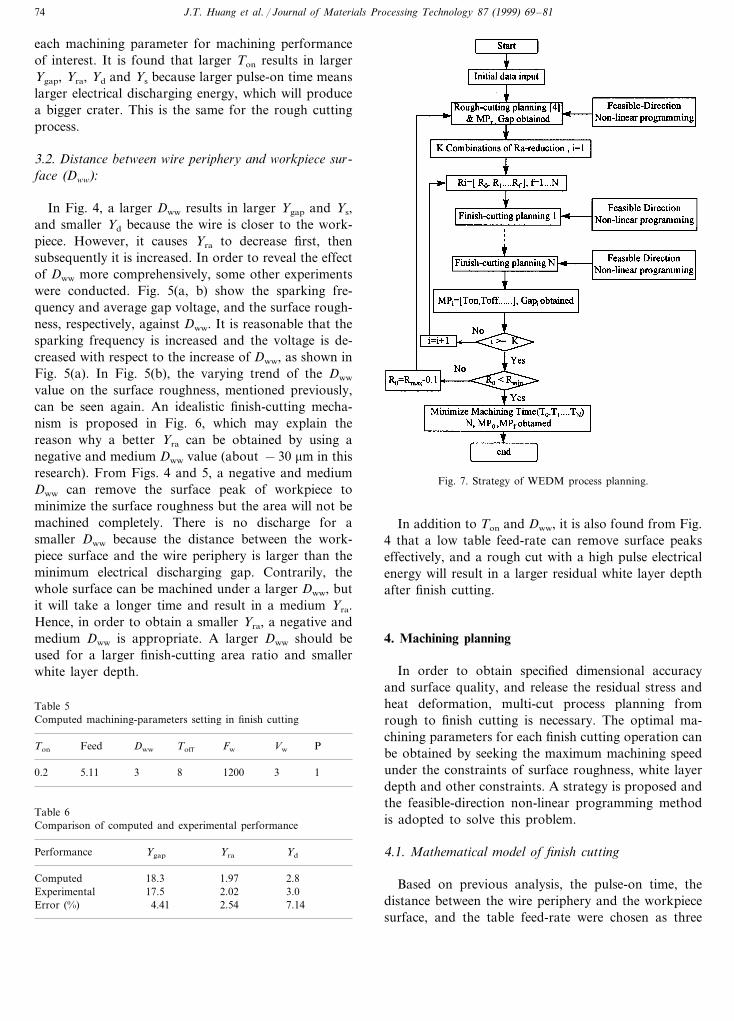
Fig. 7. Strategy of WEDM process planning.
In addition to Ton and Dww, it is also found from Fig.4 that a low table feed-rate can remove surface peakseffectively, and a rough cut with a high pulse electricalenergy will result in a larger residual white layer depthafter finish cutting.
4. Machining planning
In order to obtain specified dimensional accuracyand surface quality, and release the residual stress andheat deformation, multi-cut process planning fromrough to finish cutting is necessary. The optimal ma-chining parameters for each finish cutting operation canbe obtained by seeking the maximum machining speedunder the constraints of surface roughness, white layerdepth and other constraints. A strategy is proposed andthe feasible-direction non-linear programming methodis adopted to solve this problem.
4.1. Mathematical model of finish cutting
Based on previous analysis, the pulse-on time, thedistance between the wire periphery and the workpiecesurface, and the table feed-rate were chosen as three
Table 5Computed machining-parameters setting in finish cutting
FwToffDwwFeedTon PVw
13120085.11 30.2
Table 6Comparison of computed and experimental performance
YgapPerformance Yra Yd
1.9718.3Computed 2.817.5 2.02 3.0Experimental
Error (%) 2.544.41 7.14

J.T. Huang et al. / Journal of Materials Processing Technology 87 (1999) 69–81 75
Fig. 8. Three models of surface roughness reduction in finish cutting.
Fig. 9. Drum shape after rough cutting.
machining parameters that influence gap width, thesurface roughness, and the white layer depth. Itshould be noted that the table feed-rate cannot beincreased without constrain because retreat of thewire may occur, which will deteriorate the machinedsurface. The maximum table feed-rate is limited, sinceit should be compatible with the material removalability. Hence, it is set as a function of Ton and Dww:a larger Ton and a smaller Dww will make a largertable feed-rate possible.
A mathematical model of machining parametersand performance is obtained by regression analysis, ageneral quadratic form as give below being chosen:
Y=a+ %p
i=1
ai xi+ %p
i=1
%p
j= i
aij xi xj (3)
After numerical manipulations of the experimental
data, the mathematical models are expressed in ma-trix form as follows:
Y=XA
Y= [YgapYsrYdYmax–feed]
X= [x21 x2
2 x23 x1x2 x2x3 x1x3 x1 x2 x3]
where,
x1= log(Ton)/max(log(Ton))
x2= log(Rw−Dww)/max(log(Rw−Dww))
x3= log(Feed)/max(log(Feed))
In this expression, x1 is between 0 and 1, x2 is be-tween 0.8813 and 1, and x3 is between 0.6505 and 1,for this research. The matrix A is obtained as fol-lows:
J.T. Huang et al. / Journal of Materials Processing Technology 87 (1999) 69–8176
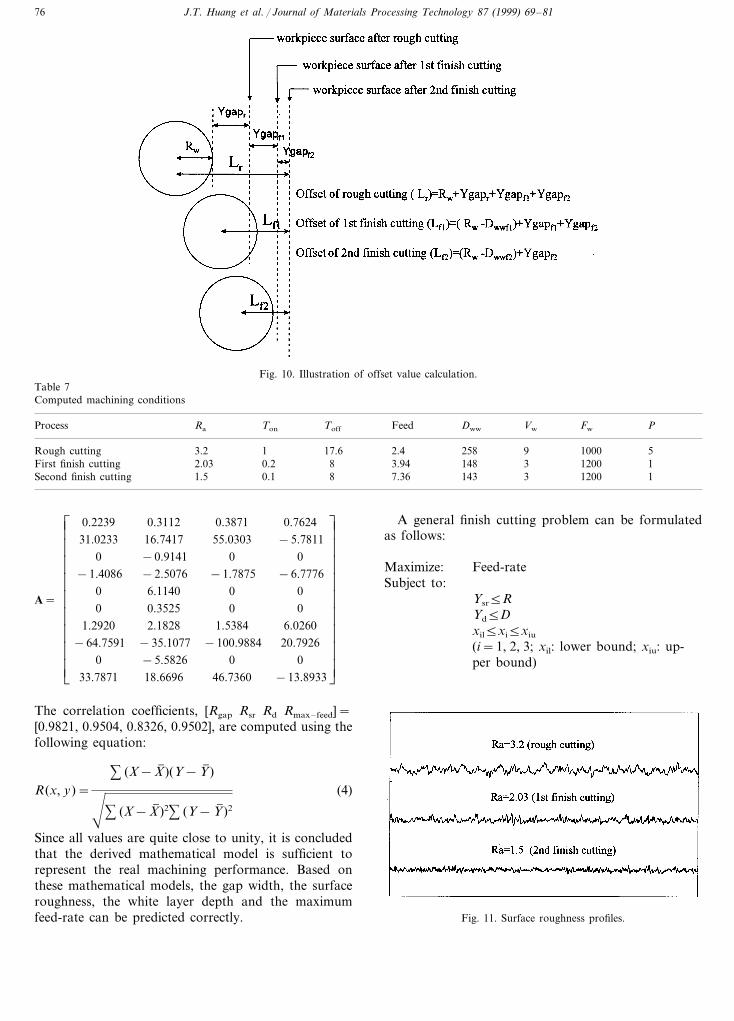
Fig. 10. Illustration of offset value calculation.Table 7Computed machining conditions
Vw FwProcess Ra Ton Toff Feed Dww P
9 1000Rough cutting 3.2 1 17.6 2.4 525812003First finish cutting 12.03 1480.2 8 3.94
143 3 1200Second finish cutting 1.5 10.1 8 7.36
A=ÃÃ
Ã
Ã
Ã
Ã
Ã
Ã
Ã
Æ
È
0.223931.0233
0−1.4086
00
1.2920−64.7591
033.7871
0.311216.7417−0.9141−2.50766.11400.35252.1828
−35.1077−5.582618.6696
0.387155.0303
0−1.7875
00
1.5384−100.9884
046.7360
0.7624−5.7811
0−6.7776
00
6.026020.7926
0−13.8933
ÃÃ
Ã
Ã
Ã
Ã
Ã
Ã
Ã
Ç
É
The correlation coefficients, [Rgap Rsr Rd Rmax–feed]=[0.9821, 0.9504, 0.8326, 0.9502], are computed using thefollowing equation:
R(x, y)=% (X−X( )(Y−Y( )
'% (X−X( )2% (Y−Y( )2
(4)
Since all values are quite close to unity, it is concludedthat the derived mathematical model is sufficient torepresent the real machining performance. Based onthese mathematical models, the gap width, the surfaceroughness, the white layer depth and the maximumfeed-rate can be predicted correctly.
A general finish cutting problem can be formulatedas follows:
Maximize: Feed-rateSubject to:
Ysr5RYd5Dxil5xi5xiu
(i=1, 2, 3; xil: lower bound; xiu: up-per bound)
Fig. 11. Surface roughness profiles.

J.T. Huang et al. / Journal of Materials Processing Technology 87 (1999) 69–81 77
Fig
.12
.Sh
owin
g:(a
)th
esu
rfac
eap
pear
ance
ofth
ew
orkp
iece
(SE
Mph
otog
raph
);an
d(b
)th
ew
hite
laye
rde
pth
(SE
Mph
otog
raph
).

J.T. Huang et al. / Journal of Materials Processing Technology 87 (1999) 69–8178
Fig. 13. Dimensional accuracy over the workpiece height.
R and D can be determined according to the desiredsurface roughness and white layer depth, respectively.By applying the feasible-direction method of non-linearprogramming with the above mathematical models[4,8], the optimal machining parameters can be ob-tained. For illustration purposes, an example with R=2 mm and D=3 mm resulted in the machining-parameters setting given in Table 5. After machining aworkpiece using the suggested machining parameters, itis found that the computed and actual experimentalmachining performance is quite close, as indicated inTable 6, the error being less than 8% and thus accept-able.
4.2. Rough and finish cutting planning
In planetary die sinking EDM, Kishi [9] proposedthree models for operation number planning and itsassociated machining-parameters determination: onefor removing surface roughness only (corresponding to
a smaller Dww in this paper); and the others for mini-mizing the heat-effected zone (a larger Dww in thepresent case). However, the three models were usednumerically and independently in all cuts. In this paper,a strategy combining the removal of the heat-effectedzone and surface roughness based on experiment isproposed and tested. A procedure of process planningto determine the machining operation number andparameters setting is shown in Fig. 7. Minimum ma-chining time is the main objective and good surfacequality and white layer depth are the constraints. To bemore specific, this procedure is divided into five steps,as described below.
4.2.1. Input initial dataThe desired final surface roughness (Rf) and machin-
ing length are specified and input.The initial surfaceroughness of rough cutting (R0) is set as Rmax.
4.2.2. Rough-cutting process planning [4]With the goal of maximizing the metal removal rate
and the constraints of RBR0, the optimal machining-parameters setting of rough cut MPr(Ton, Toff, Feed,Vw, Fw, P) is determined and the machining perfor-mance (gap width, surface roughness and machiningtime) is estimated by non-linear programming using thefeasible-direction method.
4.2.3. Surface roughness reduction algorithmThere is no definite optimal strategy in determining
the machining operation number. However, surfaceroughness is easy to measure and is used to representthe surface quality practically in WEDM. In order todetermine an optimal operation number, three Rs-re-duction models with different DRa (i.e. Ri−Ri−1), areproposed and evaluated. They are induced from:Fig. 14. Comparison of this approach with a well-skilled operation.

J.T. Huang et al. / Journal of Materials Processing Technology 87 (1999) 69–81 79
Table 8L18 table and h values for surface roughness
Ra (mm) hFactors
e2 Y(db)21His Ton Toff Feed Dww P e1
1 1.68 1.61 1 0.1 3.2 2 5 −4.2990.5 1−2.7711.331.422 1 0.1 28.0 5 −20 1.0 2
3 2.41 2.493 1 −7.7840.1 12.8 8 −45 1.5 3−4.6351.711.74 1 0.2 33.2 2 −20 1.0 3
1 2.3 2.45 −7.4615 1 0.2 8.0 5 −45 1.5 12.01 2.26 1 0.2 12.8 8 5 0.5 2 2 −6.474
2.82.957 1 −9.1760.3 33.2 5 5 1.5 22.47 2.68 1 0.3 8.0 8 −20 0.5 3 1 −8.082
−9.3392.882.989 1 0.3 212.8 2 −45 1.0 11 2 2.1810 2 −6.4110.1 3.2 8 −45 1.0 2
1.44 −3.25811 2 1.470.1 28.0 2 5 1.5 33 1.44 1.3612 −2.9262 0.1 12.8 5 −20 0.5 1
2.07 2.1813 2 0.2 3.2 5 −45 0.5 3 2 −6.5502.432.1314 2 −7.1770.2 38.0 8 5 1.0 12.04 −6.49015 2 0.2 12.8 2 −20 1.5 2 1 2.18
−8.8202.72.8216 2 0.3 23.2 8 −20 1.5 13 2.61 2.7317 2 0.3 8.0 −8.5322 −45 0.5 21 3.12 2.9918 2 0.3 12.8 −9.7025 5 1.0 3
Table 9Total h values of each level on surface roughness
PDwwToff FeedHis Ton
−36.553 −40.0861 −60.021 −27.449 −36.864−39.891−38.586 −33.7242 −59.868 −38.787 −38.282 −40.034
−42.990−44.749 −46.0783 −42.716−53.651−119.888 −119.888Sum −119.888 −119.888 −119.888 −119.888
Model 1: y=a · ebx+c (5)
Model 2: y=a ·x+b (6)
Model 3: y=a · ln(bx)+c (7)
Model 2 contains constant DRa in the whole process.Model 1 has the character of larger DRa at the begin-ning and smaller DRa in the final operation, and Model3 is the opposite of Model 1. These three surfaceroughness reduction models for a fixed number of finishcutting operations (N), surface roughness after roughcut (R0) and desired final surface roughness (Rf), areshown in Fig. 8. Generally speaking, four finish cuts aresufficient, as found from the machining-parameters set-ting table of WEDM.
4.2.4. Finish-cutting process planningIn order to ensure that the components are free from
any surface defects, the heat-effected material thatshould be removed in the finish cutting process is atleast ten times the surface roughness vale (about 30 mmin WEDM) [10]. Measurements in experiments alsoshow that the deviation of the drum shape in theworkpiece thickness direction (Fig. 9) is about 15–25
mm. In other words, a total of about 50 mm of materialshould be removed in the finish-cutting operation. Inthis strategy, the first finish cut is aimed to minimize theheat-effected zone and the drum shape caused by roughcutting whilst satisfying the desired surface roughness.From several experiments, it is found that the use ofDww]15 mm can achieve this goal. The white layerafter rough cutting should be removed in finish cutting.Since its depth is about 7–10 mm, the white layer depthconstraint (D) is chosen to be equal to or smaller than3 mm in this research. All of the surface roughnessreduction combinations of the three models have beentaken into consideration.
4.2.5. Optimal solutionFor each surface roughness reduction model, the
total machining time can be summarized as follows:
T=�length
feed�
rough−cutting+ %N
j=1
�lengthfeed
�finish
−cutting (8)
By seeking the minimum machining time, the optimaloperation number and surface roughness reduction
J.T. Huang et al. / Journal of Materials Processing Technology 87 (1999) 69–8180
model can be obtained. At the same time, the machin-ing parameters of rough and finish cuts are determined,and the performance (gap width, machining timemainly) is predicted. Each offset value for each opera-tion is calculated, as shown in Fig. 10.
After checking many cases, it is found that a rough-cutting process planning under maximum metal re-moval rate and a finish-cutting process planning usingsurface roughness reduction Model 3 can achieve theminimum machining time.
4.3. Illustrated example
To verify the proposed strategy, an example of pro-cess planning from rough to finish cutting is selected.The cutting length is 500 mm and the desired surfaceroughness is Ra=1.5 mm. The computed output showthat one rough cutting and two finish cuttings arerequired, and optimal machining-parameters setting aregiven in Table 7. The process planning results arereasonable, since similar process planning is found inthe machining-parameters setting tables of commer-cially available machines. A workpiece was machinedusing the machining parameters of Table 7. Surfaceroughness profiles for the machined surface in differentcuts were measured and are drawn in Fig. 11. It isfound that the desired surface roughness can be ob-tained in the last finish cutting. The workpiece surfaceappearance after a rough cutting and finish cuttings aregiven in Fig. 12(a). The rough cutting results in deepercraters and evident molten metal, whilst finish cuttingresults in a shallow crater and a low density of ap-pendages and pockmarks. From Fig. 12(b), it is alsofound that the final finish cutting results in a thin andstraight white layer of thickness less than 3 mm. Fig. 13shows that the dimensional accuracy over the work-piece height is within 10 mm in the final finish cut.Comparison of the proposed approach with that of awell-skilled operator is shown in Fig. 14. It is obviousthat the proposed approach can achieve a better surfacequality. It takes less machining time and, in particular,a more accurate value of the average dimension overthe workpiece height can be obtained.
5. Conclusions
An attempt has been made to determine the numberof machining operations and machining parametersefficiently in WEDM. Qualitatively, the pulse-on time(Ton) and the distance between the wire periphery andthe workpiece surface (Dww) have been found to besignificant factors in finish cutting performance (gapwidth, surface roughness, finish-cutting area ratio). It
has also been found that a medium Dww (about −30mm in this research) can achieve a better surface rough-ness, but the whole surface will not be machined. Inother words, adjusting Ton and Dww can control thefinish cutting process.
Applying the feasible-direction non-linear program-ming method, optimal machining parameters can beobtained. Experimental results show that the approxi-mate mathematical models can predict the machiningperformance within an acceptable error. Moreover, astrategy to determine the finish-cutting operation num-bers and the parameters setting has been proposed andverified. It is concluded that rough-cutting processplanning under maximum metal removal rate and finishcutting process planning using Model 3 of surfaceroughness reduction, can achieve minimum machiningtime. The proposed approach, compared with that of awell-skilled operator, can achieve a better surface qual-ity and take less machining time and, in particular,accurate dimensional accuracy can be obtained.
6. Nomenclature
Rw wire radiusFeed table feed-rate (mm min−1)Ton pulse-on time (ms)
pulse-off time (ms)Toff
flushing pressure (kg cm−2)Pwire speed (m min−1)Vw
wire tension (gf)Fw
distance between the wire periphery and theDww
workpiece surface in finish cutting (mm)(Fig. 1)machining history (rough-cutting conductedHisbefore finish cutting)removal gap width (mm)Ygap
Yra surface roughness (mm)white layer depth (mm)Yd
Ys finish-cutting area ratio (mm)
Appendix A
A L18 mixed orthogonal arrays table and the com-puted h values of surface roughness are given in Table8. Taking Ton on Yra as an example, the h values ofthree levels can be summarized as follows:
Level 1: hon1= − (4.299+2.771+7.784+6.400+3.258+2.926)= −27.449
Level 2: hon2= − (4.635+7.461+6.474+6.550+7.177+6.490)= −38.787
Level 3: hon3= − (9.176+8.082+9.339+8.820+8.532+9.702)= −53.651
J.T. Huang et al. / Journal of Materials Processing Technology 87 (1999) 69–81 81
Similarly, h values for the other parameters on othermachining performance can be evaluated. Table 9shows the total h values of the levels of six parameterson surface roughness.
Appendix B. Analysis of variance and F-test
Sm=
�% hi�2
18, ST=% hi2−Sm
SA=% hAi2
N−Sm,SE=ST−% SA
VA=SA
fA
,FA0=VA
VE
where ST is the sum of squares due to total variation;Sm is the sum of squares due to mean; SA is the sum ofsquares due to factor A (A=Feed, Ton, Toff, His, Dww,and P); SE is the sum of squares due to error; hi is theh value of each experiment (i=1–18); hAi is the sum ofi level of factor A(i=1, 2 or i=1, 2, 3); N is therepeating number of each level of factor A ; fA is thedegree of freedom of factor A ; VA is the variance offactor A ; and FAo is the F-test value of factor A.
References
[1] A.T. Krvaets, Planning of the wire-EDM process, in: Proceed-ings of the 10th International Symposium For Electro-Machin-ing, (ISEM-10), Magdeburg, Germany, 1992, pp. 218–222.
[2] D. Scott, S. Boyina, K.P. Rajurkar, Analysis and optimizationof parameter combination in wire electrical discharge machining,Int. J. Prod. Res. 29 (11) (1991) 2189–2207.
[3] Y.S. Tarng, S.C. Ma, L.K. Chung, Determination of optimalcutting parameters in wire electrical discharge machining, Int. J.Mach. Tools Manuf. 35 (12) (1995) 1693–1701.
[4] Y.S. Liao, J.T. Huang, H.C. Su, A study on the machining-parameters optimization of the wire electrical discharge machin-ing, J. Mater. Process. Technol. 71 (1997) 487–493.
[5] M.S. Phadke, Quality Engineering Using Robust Design, Pren-tice-Hall, Eaglewood, Cliffs, NJ, 1989.
[6] J. Matsuda, S. Tomishige, K. Tanaka, H. Yano, Evaluation ofperformance of WEDM by parameter design, Proceedings of the9th International Symposium For Electro-Machining, (ISEM-9),Nagoya, Japan, 1989, pp. 68–71.
[7] P.J. Ross, Taguchi Techniques For Quality Engineering, Mc-Graw-Hill, New York, 1989.
[8] G.N. Vanderplaats, Numerical Optimization Techniques for En-gineering Design: with Application, McGraw-Hill, New York,1984.
[9] M. Kishi, S. Suzuki, S. Araya, Optimization of multi-stageplanetary machining parameters in NC die sinking EDM, Pro-ceedings of the 9th International Symposium For Electro-Ma-chining, (ISEM-9), Nagoya, Japan, 1989, pp. 34–37.
[10] L.C. Lee, L.C. Lim, V. Narayanan, V.C. Venkatesh, Quantifica-tion of surface damage of tool steels after EDM, Int. J. Mach.Tools Manuf. 28 (4) (1988) 359–372.
.