determination of ethanol metabolites in hair - uva · university of amsterdam faculty of science...
TRANSCRIPT
University of Amsterdam
Faculty of Science
MSc Chemistry
Analytical Sciences
Graduation research thesis
Determination of ethanol metabolites in hair
by LC-MS(/MS) and GC-MS(/MS)
by
Liz Leenders
Supervisors:
dr. W. F. Duvivier
dhr. dr. W. T. Kok

2
List of abbreviations
ORS Outer root sheath
IRS Inner root sheath
SoHT Society of Hair Testing
EtG Ethyl glucuronide
FAEEs Fatty acid ethyl esters
FA Fatty acids
TG Triglycerides
LP Lipoproteins
PL Phospholipids
SPE Solid-phase extraction
MS(/MS) (Tandem) mass spectrometry
GC Gas chromatography
LC Liquid chromatography
m/z Mass to charge
CID Collision induced dissociation
SRM Selected reaction monitoring
MRM Multiple reaction monitoring
EI Electron ionization
LOD Limit of detection
LOQ Limit of quantitation
HS-SPME Headspace solid-phase micro extraction
BSTFA N,N-bis(trimethyl-silyl)trifluoro-acetamide
PFPA Pentafluoropropionic anhydride
HFBA Heptafluorobutyric anhydride
PBA Phenylboronic acid
PCI/NCI Positive/negative chemical ionization
ESI Electrospray ionization
HILIC Hydrophilic interaction liquid chromatography
MMS Matrix-matched standards
MMRS Matrix-matched recovery standards
CCα Decision limit
CCβ Detection capability

3
Abstract Hair analysis is increasingly used over the past years in the detection of drugs in both forensic as clinical
science. It is a sufficient and sensitive method to monitor drugs or alcohol use over a long period of time. When
compared to body fluids, compounds in hair can be detected over a longer timeframe, and segmented hair
analysis could give information about drug and alcohol abuse in a retrospective way. The problem in the case of
ethanol is the fact that ethanol itself cannot be detected in hair due to its high volatility, only its metabolites
are incorporated into hair.
In this research project, a method is developed for the detection of two ethanol metabolites in hair with LC-
and GC-MS(/MS). A method for the analysis of one of the metabolites, EtG, was developed and optimized. The
optimized method consisted of finely cutting 50 mg of hair, extraction with Milli-Q water in an ultrasonic bath
for 4 hours followed by overnight incubation, clean-up by SPE, evaporation and reconstitution for LC-MS/MS.
The method was fully validated with a mean trueness of 99.5%, recovery of 90.55%, CCα of 31.83 µg/L and CCβ
of 63.65 µg/L.
The method was further tested on 2 reference and 42 real hair samples. The method was able to measure
known, large concentrations accurately and is able to detect chronic excessive alcohol consumption (30
pg/mg), but the sensitivity is too low for the detection of regular alcohol consumption (7 pg/mg).
Also, the initial method development for the analysis of both EtG as well as FAEEs with GC-MS(/MS) was
executed. Derivatization of EtG was possible with PBA, and EtG-PBA could be detected in GC-MS/MS, however
the intensity was extremely low. For the analysis of FAEEs, ethyl palmitate is extracted from the hair matrix
with hexane and DMSO, followed by overnight incubation, than clean-up by SPE, evaporation and
reconstitution. These steps are similar to the optimized method for ethyl glucuronide for LC-MS/MS, so a
combined sample pre-treatment could be possible in the future. The method was able to analyse ethyl
palmitate with GC-MS/MS.
Samenvatting Haar analyse wordt steeds vaker gebruikt voor het detecteren van drugs in zowel forensische als klinische
scheikunde. Het is een geschikte en gevoelige methode om drugs en alcohol gebruik over een lange periode in
kaart te brengen. In haar zijn moleculen langer te detecteren dan in andere humane materialen, en door een
haar gesegmenteerd te analyseren kan informatie gewonnen worden op een retrospectieve manier. Het
probleem in het geval van ethanol, is het feit dat ethanol niet te detecteren is in haar omdat het een hele hoge
vluchtigheid heeft. Metabolieten van ethanol echter zijn wel te detecteren in haar.
In dit onderzoeksproject is een methode ontwikkeld om ethanol metabolieten in haar te detecteren aan de
hand van LC- en GC-MS(/MS). Een methode voor de analyse van een van de metabolieten, EtG, was ontwikkeld
en geoptimaliseerd tot het volgende: 50 mg haar wordt heel fijn geknipt, EtG wordt geëxtraheerd met water in
een ultrasoon bad voor 4 uur gevolgd door incubatie gedurende de nacht, de monsters worden behandeld met
SPE, gevolgd door verdamping en her-oplossing voor LC-MS/MS. De methode is vervolgens volledig
gevalideerd met een jusitheid van 99.5%, een terugvinding van 90.55%, een CCα van 31.83 µg/L en een CCβ van
63.65 µg/L.
De methode is getest aan de hand van 2 referentie en 42 echte haarmonsters. De methode was in staat om
bekende, hoge concentraties van EtG nauwkeurig te meten, chronisch alcohol gebruik te detecteren (30
pg/mg), maar had helaas een te lage gevoeligheid om regelmatig alcohol gebruik te detecteren (7 pg/mg).
Vervolgens is er geprobeerd om een methode te ontwikkelen voor het detecteren van zowel EtG als FAEEs met
GC-MS(/MS). Het derivatiseren van EtG bleek mogelijk met PBA, en een EtG-PBA complex kom gedetecteerd
worden met GC-MS/MS, echter met een extreem lage intensiteit. Voor de analyse van FAEEs is een methode
gebruikt waarin ethyl palmitaat geëxtraheerd wordt uit het haar door middel van hexaan en DMSO gevolgd
door incubatie gedurende de nacht, de monsters worden behandeld met SPE, gevolgd door verdamping en
her-oplossing voor GC-MS/MS. Deze stappen tonen veel overeenkomsten met de geoptimaliseerde methode
voor de detectie van EtG met LC-MS/MS, dus een gecombineerde monstervoorbewerking zou een mogelijkheid
kunnen zijn in de toekomst. De methode was in staat om ethyl palmitaat te detecteren met GC-MS/MS.

4
Preface The main goal of this master research project is to develop a method to detect ethanol metabolites
in human hair. Hair analysis is a relatively simple, sufficient and sensitive method to monitor alcohol
use over a long period of time. In the last few years, research in the field of hair analysis is rising, also
within RIKILT Institute of Food Safety.
Two ethanol metabolites are studied, and a method to detect these metabolites with both LC-
MS/MS and GC-MS/MS was developed. Optimization and validation of the developed method should
provide us with more insight in the possibilities of hair analysis for detection of alcohol (ab-)use.
Chapter 1 of this thesis is an introduction into hair and hair analysis, ethanol metabolites and the
techniques available for hair analysis. Also, the objectives of this project are described in this chapter.
In Chapter 2, the initial method development for the analysis of one ethanol metabolite is given.
Chapter 3 describes the optimization and validation of one of the methods developed. In Chapter 4
the initial method development of the other ethanol metabolite is described. Chapter 5 gives
recommendations for future research, and general conclusions are stated in the last chapter,
Chapter 6.
All the research described in this thesis is carried out at RIKILT Institute of Food Safety in
Wageningen, under daily supervision of dr. W.F. Duvivier.

5
Table of Contents List of abbreviations ................................................................................................................................ 2
Abstract ................................................................................................................................................... 3
Preface ..................................................................................................................................................... 4
1. Introduction ......................................................................................................................................... 6
1.1 Hair and hair analysis .................................................................................................................... 6
1.2 Detection of alcohol (ab)-use ...................................................................................................... 11
1.3 Analysis techniques ..................................................................................................................... 13
1.4 Aim of this project ....................................................................................................................... 18
2. Initial method development for the analysis of EtG in hair by GC-MS/MS and LC-MS/MS .............. 19
2.1 Introduction ................................................................................................................................. 19
2.2 Materials and methods ............................................................................................................... 19
2.3 Results and discussion ................................................................................................................. 22
2.3.1 Method development for LC-MS/MS ................................................................................... 22
2.3.2 Method development for GC-MS/MS .................................................................................. 27
2.4 Practical obstacles ....................................................................................................................... 29
3. Optimization and validation of LC-MS/MS method for EtG in hair ................................................... 32
3.1 Introduction ................................................................................................................................. 32
3.2 Materials and methods ............................................................................................................... 33
3.3 Results and discussion ................................................................................................................. 35
3.3.1 Optimization ......................................................................................................................... 35
3.3.2 Validation ............................................................................................................................. 38
3.3.3 Reference and real hair samples .......................................................................................... 42
4. Initial method development for the analysis of FAEEs in hair with GC-MS/MS ............................... 46
4.1 Introduction ................................................................................................................................. 46
4.2 Materials and methods ............................................................................................................... 46
4.3 Results ......................................................................................................................................... 47
5. Recommendations for future research ............................................................................................. 48
5.1 Sensitivity LC-MS/MS .................................................................................................................. 48
5.2 Derivatization of EtG for GC-MS/MS and sensitivity ................................................................... 48
5.3 Sensitivity FAEEs with GC-MS/MS ............................................................................................... 48
5.4 Combining sample pre-treatment steps ..................................................................................... 49
6. General conclusions .......................................................................................................................... 50
References ............................................................................................................................................. 52
Attachments .......................................................................................................................................... 56

6
1. Introduction The use of drugs is a part of human culture for decades, and attempts to ban drugs have failed
multiple times in history. Drugs are used on a social or recreational base, but also in an abusing way 1. This uncontrolled usage could have physical impact on a human being, essential organs could be
damaged, and it could play a role in crimes. So, it is important to know the effects of drugs on an
individual, and his or hers general usage of drugs, from both a forensic and a clinical point of view 1.
Hair, blood, urine and oral fluid are all human materials used for toxicological analysis. Traditional
biomarkers are mainly determined in blood (serum or plasma). Hair as a matrix for monitoring
chronic consumption is a powerful evidential tool that has been relied upon in many criminal cases
during the last decade 2. Hair analysis in forensic science is increasingly important, since the
difference between hair and the other materials is its substantially longer detection window in the
order of weeks to several months, compared to that of body fluids (hours to days). Also, the high
stability of hair samples and the fact that it can be stored at room temperature for a long time,
allows hair analysis to be performed even centuries after growth. This makes it possible to
investigate chronic or past consumption of drugs in a retrospective way 1. Hair as a testing matrix
could provide a historical overview of the individual’s exposure to drugs following chronic use, but it
is also possible to detect drugs after a single exposure, which is a great advantage above other
human materials 2. Hair collection is a simple and non-invasive procedure, and the potential for
manipulation of the results is low. Furthermore, there is little to no biosafety risk in handling the
samples, in terms of transmission of diseases 1.
1.1 Hair and hair analysis
The entire skin of the human body is covered in hair, except the outer parts of the lips, feet soles and
hand palms, and some surfaces of the external genitalia 3. Hair is used worldwide for diagnostic
purposes as testing drugs 4, and for the determination of metal concentrations related to sex and
age, for instance in poisoning cases 5. Hair can also provide information about the identity or lifestyle
of its owner, moreover it can be used in diagnosing health disorders 6.
1.1.1 Structure of the human hair
Hairs are derivatives of the epidermis, so the outermost layer of the human skin. Hairs are basically
thin and flexible tubes for 90% made of dead and keratinized cells. Inside the skin hair follicles are
alive, they grow into the dermis and hypodermic fat 7. Macroscopic, human hairs vary among ethnic
groups and individuals in length, colour, diameter and shape 4. In the human hair two different
structures could be separated; hair follicles inside the skin and the ones in the hair shaft visible on
the skin. These structures are shown in Figure 1.
As can be seen in Figure 1B, a hair shaft is made up of a medulla in the centre, surrounded by the
cortex and cuticle cells. The cortex represents most of the hair fibre composition and is an important
part in describing the strength, but also the colour and the texture of human hair. It consists for
roughly 50 to 60 percent of macro fibrils, which consist of cylinders of micro fibrils fixed into a matrix 8.
The cuticle forms the outer part of the hair shaft, its purpose is to cover the hair completely from
root to tip to protect the cortex, and to protect the inner regions of the hair 8. It consists of flat
overlapping cells 6, each cell has a thickness of approximately 0.3 – 0.5 µm. The visible length of the
cuticle is roughly 50 µm and it is made up of several substructures, for instance the epicuticle,
exocuticle and endocuticle, and the cell membrane complex, as shown in Figure 1B. The medulla is
only present in really thick hair, and is made up of empty space 9.

7
Figure 1: A: Formation of hair in a follicle from matrix cells on the basement membrane to the mature hair shaft. B: Structure and constituents of the human hair shaft. Reproduced from Ref. 10.
In Figure 1A, it is shown that hair growth is induced from the follicle. The follicle is the most
important growth structure of the hair. It is a skin organ with a bulb shape, which has two histological
structures; the outer root sheath (ORS) and the inner root sheath (IRS).
The first structure, the ORS, is a part of the epidermis that can be described as some sort of room for
stem cells, such as keratinocyte and melanocyte cells. It surrounds the IRS 7. A part of the ORS, on the
dermal site, consists of two orthogonal layers of collagen fibre, this layer is also known as the dermal
sheet 11.
The IRS consists of three layers, of which one is the cuticle layer. The cuticle layer connects to the
cuticle of the hair shaft, to make sure the hair shaft stays in the skin and the follicle will be
connected. The IRS separates the hair shaft from the ORS, and it produces hormones and keratins to
give strength to the growing hair shaft 7.
The hair bulb can be described as the part of the follicle that produces the hair; the cells in the
bottom of the hair divide just above the papilla 12. This division induces upward movements of the
cells, they are transported to the keratogenous zone in which they are synthesized and keratinized 13.
During the keratinization part, the proteins that are formed bind together, which results in long
fibres 14.
1.1.2 Hair growth cycle
A hair is developed in a dynamic and cyclic process. Many hormones and cytokines coordinate the
growth cycle of a hair. The duration of this cycle is not only dependent on the place of the body the
hair is growing, but also on other factors as age of the individual, its diet, or environmental
alterations such as day length 8. Hormones and cytokines are the particles in the human hair that
instruct the follicle to change, and each hair on the human body could be in a different stage of the
growth cycle at a time 15.
In the hair growth cycle, three phases could be noted: the anagen or growth phase, the catagen or
transitional phase, and the telogen or resting phase (Figure 2). In these phases, the hair follicle
undergoes stages of fast growth and formation of the hair shaft, followed by stages in which the hair
follicle growth is inactive 16,17.

8
Figure 2: Different phases of hair cycle. Reproduced from Ref. 3
In the anagen phase, the hair follicle is in the active growth phase. The follicle grows until it reaches
its typical onion shape, and a hair fibre is produced, as shown in Figure 2. This phase could be divided
into six small stages; the first five stages of the anagen phase are called the proanagen phase, in
which the dermal papilla grows downwards into the skin and differentiates to the hair shaft and the
IRS. Cells in the new hair shaft are divided rapidly, causing growth of the hair. In the sixth phase, the
metanagen phase, the epithelial hair bulb, which surrounds the dermal papilla, is formed, and the
hair root embeds deeply into the dermis and sub cutis 3. The new hair shaft now appears on the
surface of the skin. The anagen phase could last for 3-6 years, and 80-90% of scalp hair is in this
phase 7.
After the anagen phase comes to an end, the catagen phase starts. This phase is also called the
regression phase, and in the beginning of this phase the hair shaft production is completed and the
cell division stops. The hair follicle undergoes regression and is fully keratinized, this results in a
reduction of the follicle of about one-sixth of the diameter. During the catagen phase, a keratinized
structure of the hair looking like a brush, which is called the club hair, is formed on the base of the
hair shaft 3. The catagen phase last for 2-3 weeks, and only 1-2% of scalp hair is in this phase 7.
After the catagen phase the telogen phase starts. In this phase, the hair goes into rest and stops
growing completely. This period can last from a few weeks for eyelashes to a few months for scalp
hair 3. The root of the hair is embedded in the follicle, and approximately 10-15% of all hairs are in
the telogen phase at any given moment 7. At the end of this stage, the hair can be considered dead
and falls out, which is called the exogen phase; a few weeks later, the hair follicle starts again in the
anagen phase 14.
1.1.3 Collection of a scalp hair sample
In hair analysis, scalp hair is preferred since scalp hair has the fastest growth rate, and its follicles
have the highest percentage in the anagen, growing, phase. Therefore, in this paragraph some
features of scalp hair will be summarized, as well as the correct procedure for sampling.
The growth rate of scalp hair is reported as 1 cm per month, continuously for 3-5 years while the
hairs are in the anagen phase 18. After the anagen phase, the hair growth stops and is followed by a
short catagen phase and a telogen phase of approximately 200 months. In this phase, the old hair is
shed, and after the telogen phase the new hair starts to grow from the same follicle during the next
anagen phase.
A scalp hair fibre is approximately 60 – 80 µm in diameter. It consists of a layer of flat and imbricated
scales that point from root to tip of the hair 8.
To avoid errors in the analytical method, proper sampling techniques are required. A scalp hair

9
sample must be cut from the posterior vertex region of the head (Figure 3); this is the region with
less variation in the growth rate, and it must be cut as close as possible to the scalp 19. Locks of hair
with the thickness of a pencil must be collected, with a diameter of about 0.3 – 0.5 cm, and the root
end must be clearly indicated 19. Two locks of hair must be collected to allow initial testing, followed
by confirmatory or re-testing of the sample if necessary 3. To obtain a timeline of drug use, the hair
can be cut into segments starting from the hair root, usually 1 – 3 cm pieces, and these segments are
analysed individually, as shown in Figure 3.
Figure 3: Left: Vertex region of the scalp. Right: Retrospective timeline of drugs in hair. Reproduced from Ref. 1
1.1.4 Hair analysis
As a consequence of the advantages of hair analysis mentioned in the first part of this chapter, it is
routinely used in forensic toxicological investigations, and it could be used in both post-mortem as
alive cases. It is for instance used in drug-related crimes and deaths or child protection cases, and to
monitor drug misuse in workplace drug testing or drug rehabilitation programs. The use of hair
analysis is not limited to human samples, it is also used in veterinary control 1. More and more
laboratories offer hair testing, and the Society of Hair Testing (SoHT) recommends official guidelines
for drug testing in hair 20. Instrument sensitivity and method validity are continuously improving, but
the main challenge is interpretation of the analytical results in evidence cases 1. This challenge is due
to many factors that affect the amount of drugs present in hair, its degradation over time and the
different routes of incorporation.
Researchers were able to detect drugs in hair centuries after growth, for instance arsenic in hair
collected from Napoleon Bonaparte 21 and cocaine in the hair of Peruvian mummies 22. However, the
concentrations of drugs in hair decrease over time because of natural wash out 23, and the stability is
dependent on the physicochemical properties of the hair 24.
1.1.5 Challenges in hair analysis
Contamination is the most important issue in hair analysis; the fact that analytical results could be
interpreted as false negatives or false positives should be avoided 1. Alcohol markers are present in
several commercially available hair products. Traces of these compounds were detected in hair
samples of people who frequently used the products 25. Decontamination of the hair sample before
analysis is thus of great importance in order to avoid false positives.
Weather conditions, such as exposure to sunlight, could reduce the concentration of several drugs in
hair on a daily basis 26. Also, hair treatment could cause a reduction of the concentrations.
Shampooing was shown to not significantly affect the concentration of drugs in hair 27,28, but blow-
drying, curling or straightening can damage or destroy the cuticle, which provides routes for
contamination, and it can be responsible for removal of incorporated drugs. Harsher cosmetic
treatments could cause even more damage 19,27,29; all literature studies agree on the fact that
bleaching, dyeing or perming the hair have a destructive effect on the concentrations of drugs in hair.
10
Bleaching created the largest decrease in drug concentrations. These factors influencing the
concentration, or the incorporation of drugs into the growing hair, need to be fully understand by the
analyst, and the results of the hair analysis needs to be fully interpret in order to make the correct
conclusion in criminal cases 1.
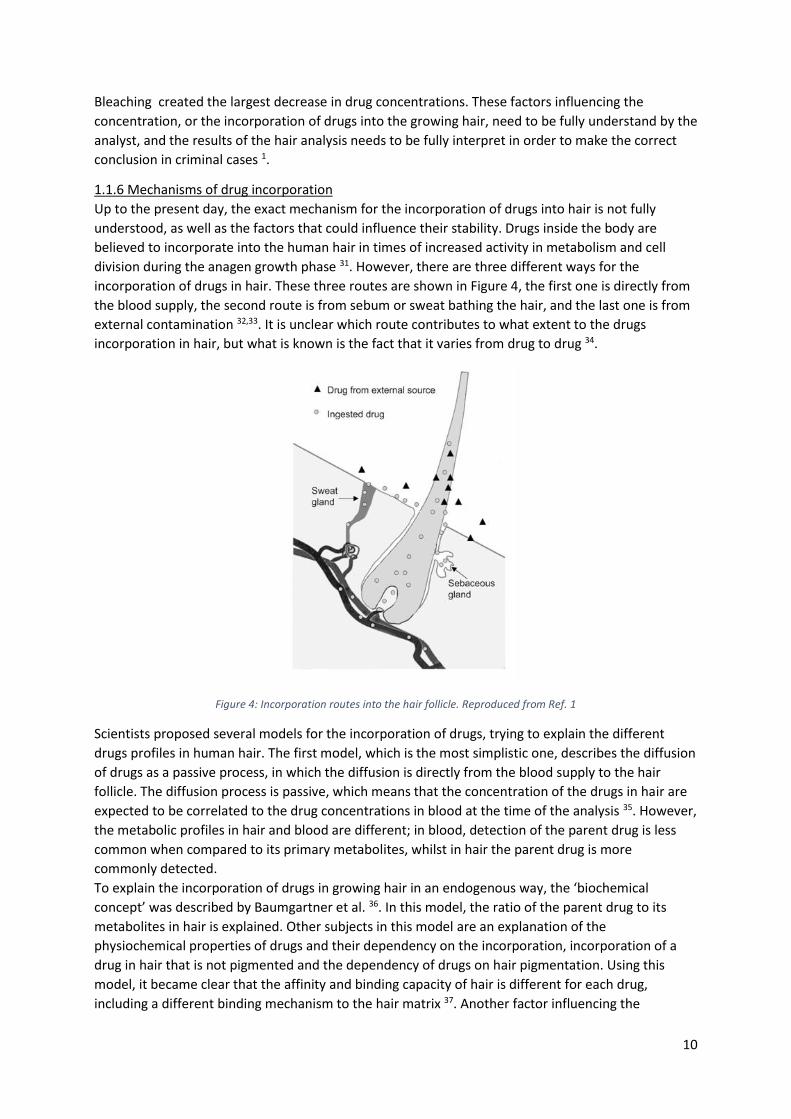
1.1.6 Mechanisms of drug incorporation
Up to the present day, the exact mechanism for the incorporation of drugs into hair is not fully
understood, as well as the factors that could influence their stability. Drugs inside the body are
believed to incorporate into the human hair in times of increased activity in metabolism and cell
division during the anagen growth phase 31. However, there are three different ways for the
incorporation of drugs in hair. These three routes are shown in Figure 4, the first one is directly from
the blood supply, the second route is from sebum or sweat bathing the hair, and the last one is from
external contamination 32,33. It is unclear which route contributes to what extent to the drugs
incorporation in hair, but what is known is the fact that it varies from drug to drug 34.
Figure 4: Incorporation routes into the hair follicle. Reproduced from Ref. 1
Scientists proposed several models for the incorporation of drugs, trying to explain the different
drugs profiles in human hair. The first model, which is the most simplistic one, describes the diffusion
of drugs as a passive process, in which the diffusion is directly from the blood supply to the hair
follicle. The diffusion process is passive, which means that the concentration of the drugs in hair are
expected to be correlated to the drug concentrations in blood at the time of the analysis 35. However,
the metabolic profiles in hair and blood are different; in blood, detection of the parent drug is less
common when compared to its primary metabolites, whilst in hair the parent drug is more
commonly detected.
To explain the incorporation of drugs in growing hair in an endogenous way, the ‘biochemical
concept’ was described by Baumgartner et al. 36. In this model, the ratio of the parent drug to its
metabolites in hair is explained. Other subjects in this model are an explanation of the
physiochemical properties of drugs and their dependency on the incorporation, incorporation of a
drug in hair that is not pigmented and the dependency of drugs on hair pigmentation. Using this
model, it became clear that the affinity and binding capacity of hair is different for each drug,
including a different binding mechanism to the hair matrix 37. Another factor influencing the

11
incorporation or binding of the drugs to human hair is the lipophilicity; molecules that are neutral
and lipophilic can penetrate the cell membrane easier than others, which results in a higher
incorporation rate 38.
Examining all existing drugs is beyond the scope of this thesis, so in this thesis the focus will be on
ethanol metabolites incorporated into hair. Different analytical techniques and approaches will be
tested and compared, and factors influencing the incorporation of the metabolites in hair are
examined.
1.2 Detection of alcohol (ab)-use 1.2.1 Ethanol metabolites in hair
For decades, the clinical and forensic research field has been searching for suitable markers for
alcohol consumption. Due to its high volatility, alcohol detection in hair is difficult. However,
metabolites of ethanol are detectable in hair 39.
An overview of possible ethanol markers in hair is given in Scheme 1. Ethanol markers could be direct
or indirect. The direct markers are the markers still containing the carbon atoms of ethanol, the
indirect ones are a product of a pathological change caused by ethanol in the metabolism. Overall,
direct markers are preferable, because of the fact that indirect markers could also be formed via
other pathologic pathways. The direct markers in hair are metabolites of ethanol which still contain
the C2H5-group, or products which were formed during a reaction of acetaldehyde with physiologic
molecules 40.
In this thesis, the focus will therefore be on direct markers. The ethanol markers most studied in
literature are ethyl glucuronide (EtG) and fatty acid ethyl esters (FAEEs). They have the advantage
that they contain the ethyl group of ethanol which is a great indication that alcohol was responsible
for the positive result 1. These markers will be discussed below in more detail including mechanisms
of drug incorporation in hair. The probability to find these ethanol markers in hair will be discussed
regarding their formation and concentrations in hair, and some of their chemical properties will be
discussed.
Scheme 1: Possible markers of chronically elevated alcohol consumption in hair. Reproduced from Ref 39.

12
1.2.2 Ethyl glucuronide (EtG)
In 1952, EtG was described by Kamil et al. as a minor metabolite of ethanol 41. Investigation of EtG as
important marker of alcohol consumption was mainly performed by Skopp et al. 42. EtG is a direct
metabolite of ethanol, and is a water-soluble and non-volatile compound with high stability 43. EtG is
more sensitive and specific than most ethanol metabolites, because of the fact that EtG is only
detectable in human hair after ethanol intake 44. In Scheme 2, the formation of EtG is shown. Ethanol
is conjugated with glucuronic acid via Uridine 5'-diphospho-glucuronosyl transferase (UDP-
glucuronosyl transferase). Glucuronic acid is located in the endoplasmic reticulum, in liver cells and in
small amounts in for instance the lungs. Glucuronic acid is formed by an enzymatic hydroxylation in
the presence of UDP-glucuronosyl transferase, and is necessary in the glucuronidation step of
ethanol 45. The molecular formula of EtG is C8H14O7, its monoisotopic molecular weight is 222.074
g/mol. The melting point or decomposition temperature is approximately 150 °C 1.
Scheme 2: Formation of ethyl glucuronide by conjugation of UDP-glucuronic acid and ethanol.
The incorporation rate of EtG in hair is low, because the molecule is an acid; EtG is a polar molecule
with a pKa of 3.21. As a consequence, EtG is only detectable in hair in very small amounts and thus
requires very powerful analytical techniques for detection 46. In order to establish universal
interpretation of analytical results for EtG in hair, the SoHT has set some cut-off values for
international use in 2010. A value of 30 pg/mg or more suggests chronic excessive consumption of
alcohol, and a second cut-off value was established in the consensus of 2012 and has not change
since; a value of ≥ 7 mg/mg strongly suggest repeated alcohol consumption. Another rule to
remember is the fact that a positive result for EtG in hair overrules a negative result for FAEEs 18.
1.2.3 Fatty acid ethyl esters (FAEEs)
In Scheme 3, the formation of FAEEs is shown. As can be seen, ethanol undergoes esterification with
free endogenous fatty acids (FA), triglycerides (TG), lipoproteins (LP) and phospholipids (PL) to form
FAEEs in the presence of two enzymes, FAEE synthase and acyl-co-enzyme A(CoA)/ethanol O-acyl-
transferase. FAEE synthase can be found in organs most likely to be damaged by alcohol
consumption; the pancreas and the liver 47. The FAEEs most likely to be formed are ethyl palmitate
and oleate 48, however, all esters are stable and can be found throughout the body 49.
In 1956 the process of the biotransformation of ethanol was described, in which FAEEs were shown
to be products of this reaction 50. However, until 2001 nobody described FAEEs as possible markers
for ethanol in hair, Pragst et al. were the first to do so 51.

13
Scheme 3: Formation of fatty acid ethyl esters (FAEEs). FA: fatty acids. TG: triglycerides. LP: lipoproteins. PL: phospholipids.
Preliminary studies revealed the fact that FAEEs can be found in human hair samples without
exposure to alcohol, which results in false positive results. The exact reason is unclear, but it can be
due to some physiological and pathological processes 1. Because ethanol is a by-product of some
physiological metabolism reactions in the human body, it is possible that some FAEEs could be
detected inside the human body without actual alcohol intake 43.
In order to interpret the results correctly, the SoHT also established cut-off values for FAEEs. The cut-
off values were based on the sum of the four major FAEEs, which are ethyl myristate, palmitate,
stearate and oleate. In 2016, the last consensus of the SoHT, a new cut-off value was established; the
sum of the four FAEEs is no longer necessary, only the FAEE most likely to be formed, which is ethyl
palmitate, is measured in the new consensus. Repeated alcohol consumption could be assumed with
a cut-off concentration of 0.12 ng/mg of ethyl palmitate in the first 0-3 cm hair, or 0.15 ng/mg in the
first 0-6 cm hair. A cut-off concentration of 0.35 ng/mg of ethyl palmitate in the 0-3 cm hair segment,
and 0.45 ng/mg in the 0-6 cm segment indicates chronic excessive alcohol consumption 52.
1.3 Analysis techniques After hair sample collection, the samples need further pre-treatment in terms of extraction of the
targeted compounds from the matrix. Hair samples are cut into small fragments of typically 1 to 3
mm, in order to obtain a larger surface area. Attentively, the samples could be pulverized.
Compounds can be extracted from the hair matrix with organic solvents or aqueous solutions. Which
specific solvent to use is dependent on the physicochemical properties of the compound 1. After
extraction, the sample needs a clean-up and concentration step like solid phase extraction (SPE),
after which the sample can be analysed. Analytical methods for the determination of EtG and FAEEs
in hair were described in several papers 53-56, and often these methods only differ in used
instruments or chromatographic parameters measured. Mass spectrometry (MS) has been widely
accepted as the detection method of choice, and is therefore used in most hair analysis methods.
Before compounds can be detected using MS, they most often are separated using gas
chromatography (GC) or liquid chromatography (LC). Analytical techniques used in hair analysis
should contain some important properties; they must be suitable for explicit identification and
quantitation of the drugs. Chromatographic techniques are powerful screening methods, by their
ability to cover a wide range of analytes in one run 1. Due to the fact that hair contains low
concentrations of drugs and the sample sizes are small, developing a general method for drug
screening in hair is difficult. This is mainly because every compound or drug class needs a specific

14
sample preparation. Therefore, the procedures described for drugs screening are typically developed
for the analysis of a limited number of drugs at the same time 57,58.
1.3.1 Mass spectrometry (MS)
In hair analysis, the mass spectrometric analyser most commonly used is the quadrupole analyser.
Movements of molecules in oscillating fields are stable, and a quadrupole analyser makes use of this
fact to separate ions according to their mass to charge (m/z) ratios. Quadrupole analysers are made
up of four rods of circular section, as shown in Figure 5. The rods must be perfectly parallel 59.
Figure 5: Schematic overview of a quadrupole analyser. Reproduced from Ref 60.
A positive ion entering the space between the rods will be drawn towards a negative rod, and the
other way around. If the potential changes from sign before the ion comes in contact with the rod
and discharges itself, the ion will change direction. An ion without resonance will not reach the
detector in the end, an ion with resonance does 59.
Figure 6: Diagram of a triple quadrupole instrument. Reproduced from Ref. 61
In hair analysis, a triple quadrupole spectrometer is often used. In this spectrometer, three
quadrupoles are next to each other, as shown in Figure 6. The first and last quadrupole (Quad 1 and
Quad 3) are mass analysers. The quadrupole in the centre, Quad 2, is used as a collision cell in which
the dissociation takes place. In Quad 1 the precursor ion is selected and afterwards dissociated into
product ions in Quad 2, followed by a mass scan in Quad 3 61.
In tandem mass spectrometry (MS/MS), a product ion scan could be used to determine the fragment
ions of a compound. The product ion scan, also called daughter scan, selects a precursor or parent
ion of a specific m/z ratio, and afterwards the product or daughter ions are determined based on
collision-induced dissociation (CID) 59, as shown in Figure 7A.

15
Figure 7: Product ion scan (A) and selective reaction monitoring (B) in MS/MS. Reproduced from Ref. 59
Usually, for sensitive and targeted analysis, the detection mode selected reaction monitoring (SRM)
is used. In this mode, ions with a specific m/z ratio are selected and isolated through the collision
cell, as shown in Figure 7B. After CID only fragment ions with a certain m/z ratio are lead into the
detector. This way, the ions selected by the first mass analyser are only detected if they produce this
fragment ion with a certain m/z ratio, by a selected reaction. This means that no time is wasted on
data that is not relevant for the analysis, so the sensitivity comes to a maximum 59.
SRM can also be performed by selecting multiple fragment ions before analysis, this technique is
known as multiple reaction monitoring (MRM).
1.3.2 Gas chromatography – mass spectrometry (GC-MS)
One of the methods frequently used in hair analysis is gas chromatography coupled to mass
spectrometry (GC-MS). GC makes use of a capillary column, this is one of the reasons it is a method
with a high resolution 73. A GC-MS electron ionization (EI) mass spectrum has a really high specificity;
especially if SRM mode is used in the measurement. High specificity can also be achieved by using
internal standards that are deuterated 73. All these features combined make GC-MS a very specific
and sensitive analysis technique for the detection of many drugs and its metabolites. If the
chromatogram is divided into several time windows with different SRM masses, a large number of
compounds can be measured at the same time in one run. Usually, the limit of detection (LOD) of GC-
EI/MS is around 0.03 ng/mg for most drugs 1.
If GC-MS/MS is used, the sensitivity and specificity will be increased when compared to GC-MS.
These advantages lead to the fact that GC-MS/MS is used more often nowadays in hair analysis 62-65.
The sensitivity of the method can also be increased by making use of headspace solid-phase micro
extraction (HS-SPME), in which a derivatized sample is cleaned up by headspace extraction instead of
regular SPE, increasing the analysed amount of sample by accumulation on the fibre 66.
1.3.3 Analysis of ethyl glucuronide using GC-MS
To perform GC-MS, it is essential that the compound of interest is volatile enough and stable at very
high temperatures. If a compound contains free amino (NH2), hydroxyl (OH), or carboxyl (COOH)
groups, these groups are able to form hydrogen bonds inside the compound so that the volatility
goes down and it does not interact with, for example, the column packing 67. These chemical

16
properties are reasons why it is necessary to derivatize the compound before performing GC-MS.
Derivatization reactions used for GC-MS fall into three general reaction types namely; (i) alkylation of
which the general process is esterification, (ii) acylation and (iii) silylation 68. Acylation and silylation
are the two processes used in derivatization of EtG samples.
Silylation
N,N-bis(trimethyl-silyl)trifluoro-acetamide (BSTFA) is a derivatization agent used often for
derivatization of EtG samples. BSTFA is a silyl reagent, which reacts with both hydroxyl as carboxyl
groups in a compound, in order to form trimethylsilyl ethers and trimethylsilyl esters respectively.
BSTFA contains a trifluoroacetyl group, which makes a reaction with BSTFA fast and complete. The
derivatives formed with BSTFA have high volatility and can be easily separated 69. In Scheme 4, the
derivatization of EtG with BSTFA is shown.
Scheme 4: Derivatization of EtG with BSTFA.
Due to the high volatility of derivatives formed with BSTFA, they will elute early, and the derivatives
of BSTFA result in a low detector noise and pollution, since BSTFA is able to derivatize all OH-groups
of EtG 70. No water must come in contact with the samples, as this will lead to hydrolysis of BSTFA,
which leads to the fact that none of the targeted analytes will undergo derivatization.
Acylation
Another type of derivatization used often for EtG samples is acylation. It is a type of reaction in which
an acyl group is introduced to an organic compound. In case of a carboxyl group, the reaction
involves the introduction of the acyl group and loss of the OH - group 71. The two most often used
acylation derivatization agents are fluorinated anhydrides such as pentafluoropropionic anhydride
(PFPA) and heptafluorobutyric anhydride (HFBA). Fluorinated anhydrides such as PFPA and HFBA
could react with amines, alcohols and phenols, producing stable derivatives with high volatility 72.
Scheme 5 and 6 show the derivatization of EtG with PFPA and HFBA, respectively.
Scheme 5: Derivatization of EtG with PFPA.

17
Scheme 6: Derivatisation of EtG with HFBA.
Using GC-MS in chemical ionization mode, both positive and negative (GC-PCI/MS and GC-NCI/MS),
could increase the sensitivity of the method to an LOD between 0.2 and 15 pg/mg for compounds as
benzodiazepines 73, or derivatized,perfluorinated carboxylic acid anhydrides compounds such as EtG 74. Overall, for EtG, NCI delivers better results, but the consequence is the fact that the specificity will
be less due to missing fragmentation.
1.3.4 Analysis of fatty acid ethyl esters using GC-MS
FAEEs also need some sample pre-treatment before performing GC-MS, in the forms of SPE or
headspace solid-phase micro-extraction (HS-SPME). GC-EI/MS is the method most often used in the
analysis of FAEEs in hair, leading to an LOD as low as 0.01 ng/mg for the sum of all four FAEEs, though
nowadays only ethyl palmitate is used. In Scheme 5, the formation of fragment ions of FAEEs is
shown. Molecular ions are used as qualifiers, the quantifiers are the fragment ions from McLafferty
rearrangement (m/z 88) or from β-cleavage (m/z 101) 1, as shown in Scheme 7.
Scheme 7: Formation of fragment ions of fatty acid ethyl esters (FAEEs).
1.3.5 Liquid chromatography – mass spectrometry (LC-MS) Since GC-MS is dependent on derivatization of the compound to avoid issues with volatility and
stability, a promising alternative is liquid chromatography – mass spectrometry (LC-MS) 1. However,
LC-MS is still not used as often as GC-MS because of the fact that it is a very expensive technique. LC-
MS has a lower chromatographic resolution compared to GC-MS for several compound classes. This
is the reason why LC is only possible if coupled to tandem MS/MS in hair analysis, in order to reach a
high sensitivity 1. Liquid chromatography is normally used for compounds that are not volatile and
are not suitable for gas chromatography 59.
18
1.3.6 Analysis of ethyl glucuronide using LC-MS
Several publications describe the use of LC-MS/MS in hair analysis, including the detection of several
drugs as methadone and metabolites 75, benzodiazepines 73, neuroleptics 76, sildenafil 77 and EtG78.
EtG is an anion, so the most often used ionization technique is electrospray ionization (ESI) in
negative ion mode. The transitions most often used are m/z 221 – 75 as quantifier and m/z 221 – 85
as qualifier. If reversed phase columns are used, EtG is eluted in the first part of the chromatogram,
with large interfering signals and matrix effects 79. Further optimization of the chromatography
showed that a high water content in the mobile phase was necessary to retain EtG, as well as post
column addition of acetonitrile to enhance a low ESI yield 80. It was found that these difficulties can
be solved by making use of other columns, such as hydrophilic interaction liquid chromatography
(HILIC) columns 79,81, or silica columns with a mobile phase containing a high content of acetonitrile 82. Many papers perform hair analysis by directly injecting the hair extract on the column, but in
order to avoid false negative results caused by ion suppression, a clean-up by SPE is recommended 1.
1.4 Aim of this project Hair analysis is increasingly used over the past years in the detection of drugs in both forensic as
clinical science. The detection window of hair is longer when compared to body fluids, and if a hair is
analysed in a segmented way, it could give information about drug and alcohol abuse in a
retrospective way, so it is a sufficient and sensitive method to monitor drugs or alcohol use over a
long period of time. The problem in the case of ethanol is the fact that ethanol itself cannot be
detected in hair due to its high volatility, only its metabolites are incorporated into hair.
In this project, a method is developed for the detection of two ethanol metabolites in hair with LC-
and GC-MS(/MS). A method for the analysis of one of the metabolites, EtG, was developed,
optimized and validated. Validation of the method is important to make sure the method has a
sufficient limit of detection and quantification (LOD and LOQ), accuracy and repeatability. Therefore,
a validation protocol following the quality system of RIKILT is used, in which the used method is
evaluated.
Also, the initial method development for the analysis of both EtG as well as FAEEs with GC-MS(/MS)
was executed. Analysis of both metabolites at the same time is not possible, since the clean-up is
different for each of them. It was tried to combine some steps of the analysis, so that it takes less
time when compared to a separate analysis of each metabolite.

19
2. Initial method development for the analysis of EtG in hair by GC-
MS/MS and LC-MS/MS
2.1 Introduction First step in this project was to develop a method for the detection of EtG with GC-MS/MS and LC-
MS/MS.
EtG is a compound which contains three hydroxyl (OH) and one carboxyl (COOH) groups; these
functional groups are able to form hydrogen bonds inside a compound, and could affect its volatility
and the tendency to interact with, for example, column packing material 82. These chemical
properties are reasons why it is necessary to derivatize the EtG samples before performing GC-
MS/MS. As already mentioned in the introduction, acylation and silylation are the two processes
used in derivatisation of EtG samples. Three derivatization agents could be used for these processes,
namely BSTFA for the silylation and HFBA and PFPA for the acylation. To develop a method for the
analysis of EtG with GC-MS/MS, first the derivatization step of the GC-MS/MS method needs to be
optimized. The three derivatization agents discussed in the introduction were tested under different
conditions, in order to find the optimal derivatization process.
Also, another derivatization agent, phenylboronic acid, was tested. Derivatization with phenylboronic
acid (PBA) is done often in analysis that include glucose-like compounds, since it derivatizes two OH-
groups at once 82. In Scheme 8, the derivatization of EtG with PBA is shown.
Scheme 8: Derivatization of EtG with PBA
Since GC-MS/MS is really dependent on these derivatization steps, another promising and upcoming
technique in the analysis of EtG is LC-MS/MS. To avoid false positives in the analysis, the sample can
be washed before analysis. Since decontamination is not a big issue in case of alcohol use, in this
research the samples are not washed before analysis. To avoid false negatives the samples are
usually cleaned-up by SPE, which is also done in this research 1. Different SPE methods were tested
and compared, as well as the reconstitution solvents and different LC-MS/MS systems.
2.2 Materials and methods 2.2.1 Hair samples
The analysis of EtG in hair was performed on blank hair samples provided by children or abstaining
adults.
2.2.2 Chemicals and reagents
Ethyl glucuronide and ethyl glucuronide-d5 were purchased from Cerilliant (USA). Milli-Q water was
obtained from a Millipore system of Merck (Germany). SPE Oasis MAX 3 cc cartridges were
purchased from Waters (Ireland), Isolute NH2 (aminopropyl) cartridges were purchased from Biotage

20
(Sweden). HFBA, PFPA, PBA, ammonium formate and sodium sulfate were purchased from Sigma-
Aldrich (Germany). BSTFA was purchased from Grace Davison, Discovery Science (USA). Methanol, n-
hexane, ethyl acetate, heptane, isooctane, acetone, HCl and acetonitrile were purchased from Actu-
All chemicals (Netherlands). Formic acid and 25% ammonia solution were purchased from Merck
(Germany).
2.2.3 Sample preparation and clean-up procedure for LC-MS
Approximately 50 mg of the blank hair samples were exactly weighed and cut into pieces (1-2 mm)
with scissors. The hair samples were then spiked with different concentrations of the standard
solution of EtG, which was evaporated to air for 30 min. 20 µL of internal standard solution (EtG-d5,
10 ppm) and 2 mL of Milli-Q water were added, and the extraction was performed by 4h
ultrasonication at 50 °C. After centrifugation for 7 min at 4000 rpm, three different clean-up methods
were performed:
(i) Solid phase extraction using Oasis MAX 3cc cartridges (Waters, Ireland) were conditioned with 2
mL of methanol and 2 mL of Milli-Q water. The extract was transferred on the SPE column and the
columns were dried for 5 min. The samples were washed with 2 mL of Milli-Q/5% ammonia solution
and 2 mL of methanol, and dried for 10 min. EtG was eluted with 2 mL of methanol/2% formic acid in
glass tubes and evaporated to dryness under a nitrogen stream at approximately 50 °C.
(ii) Solid phase extraction using Oasis MAX 3cc cartridges (Waters, Ireland) were conditioned with 2
mL of methanol and 2 mL of Milli-Q water. The extract was transferred on the SPE column and the
columns were dried for 5 min. The samples were washed with 2 mL of n-hexane, and dried for 10
min. EtG was eluted with 2 mL of methanol/2% formic acid in glass tubes and evaporated to dryness
under a nitrogen stream at approximately 50 °C.
(iii) Solid phase extraction using Isolute NH2 (aminopropyl) cartridges (Biotage, Sweden) were
conditioned with 3 mL of methanol, 3 mL of Milli-Q water and 3 mL of acetonitrile. Care was taken to
ensure that the columns did not dry between these conditioning steps. The extract was transferred
on the SPE column and the columns were dried for 5 min. The samples were washed with 3 mL of
Milli-Q/5% ammonia solution, and dried for 15 min under a strong vacuum. EtG was eluted with 3 mL
of methanol/2% ammonia solution in glass tubes and evaporated to dryness under a nitrogen stream
at approximately 50 °C.
Three reconstitution solvents were tested, namely methanol, acetonitrile and mobile phase A (see
below). All residues were reconstituted in 200 µL and 10 µL were injected for measurement by LC-
MS.
2.2.4 Instrumentation for LC-MS/MS
Liquid-chromatography was performed on a Waters Acquity UPLC system, and a Zorbax Eclipse XDB-
C8 column (5 µm, 4.6 x 150 mm) with the mobile phases A = 5mM NH4-formate and 0.01% formic
acid in Milli-Q water and B = acetonitrile, with the following gradient: 0-3 min 100% solvent A, linear
to 90% B in 2 min for 3 min, linear to 100% A in 0.10 min for 2 min. The flow rate was 0.5 mL/min.
The detection was performed on Micromass Quattro Ultima Pt, Waters Xevo TQ-S and AB-SCIEX
QTRAP-6500 mass spectrometer instruments with ESI in negative mode using the following
transitions for EtG: m/z 221 – 95, 221 – 85, 221 – 75, 221 – 57, and for EtG-d5: m/z 226 – 85, 226 –
75.
2.2.5 Method calibration
A standard calibration curve was obtained by preparing EtG solutions in mobile phase A in the
following concentrations: 0, 1, 2.5, 5, 12.5, 25, 50, 125, 250, 500, 1250, 2500, 5000 and 9000 pg/µL
and 100 µL internal standard (EtG-d5, 10 ppm).

21
2.2.6 Derivatization procedure for GC-MS
Two derivatization procedures were tested, one procedure for derivatization with PFPA, HFBA and
BSTFA, and a second procedure for derivatization with phenylboronic acid (PBA).
(i) An EtG solution of 10.000 pg/µL (10 ppm) was prepared in methanol, and 50 µL were evaporated
under a nitrogen stream at 60 °C in MS vials. In order to optimize the derivatization of EtG, several
derivatization agents were tested. Standard solutions of these agents were added to the vials as
mentioned in Table 2. The derivatization time and temperature varied according to Table 2. 2 µL of
some of the samples were injected into the GC-MS/MS after the derivatization, others were
evaporated under a nitrogen stream at 60 °C and reconstituted as mentioned in the table, before
injection of 2 µL into the GC-MS/MS.
# Derivatization agent Derivatization temp./time
Reconstitution Reconstitution solvent
1 50 µL HFBA/acetone (1:4) 1 h, 60°C + 50 µL isooctane 2 50 µL BSTFA/acetone (1:4) 1 h, 60°C + 50 µL isooctane 3 20 µL ethyl acetate/BSTFA (1:1) 20 min, 80°C - - 4 50 µL BSTFA/methanol (1:4) 30 min, 80°C + 50 µL isooctane 5 100 µL PFPA 30 min, 80°C + 50 µL heptane 6 100 µL PFPA/methanol (1:5) 30 min, 80°C + 50 µL heptane 7 100 µL PFPA/methanol (1:5) 30 min, 80°C + 50 µL ethyl acetate 8 20 µL ethyl acetate/HFBA (1:1) 20 min, 80°C - - 9 20 µL ethyl acetate/PFPA (1:1) 20 min, 80°C - -
10 20 µL ethyl acetate/HFBA (1:1) 1 h, 80°C - - 11 20 µL ethyl acetate/PFPA (1:1) 1 h, 80°C - - 12 20 µL ethyl acetate/BSTFA (1:1) 1 h, 80°C - - 13 20 µL ethyl acetate/HFBA (1:1) 20 min, 80°C + 50 µL isooctane 14 20 µL ethyl acetate/PFPA (1:1) 20 min, 80°C + 50 µL isooctane 15 20 µL ethyl acetate/BSTFA (1:1) 20 min, 80°C + 50 µL isooctane
(ii) A PBA solution was prepared by weighing 1g of PBA in a 5 mL vial, 4 mL of an acetone/Milli-Q
water mixture (19/1, v/v) was added and the mixture was shaken vigorously. A sodium sulfate
solution was prepared by weighing 0.25g of sodium sulfate in a 5 mL vial, 5 mL of Milli-Q water was
added and the mixture was placed in an ultrasonic bath to ensure the reagent was completely
dissolved. EtG solutions of 10.000 pg/µL (10 ppm) were prepared in methanol, and 500 µL was put in
a 5 mL vial. 2 mL of the sodium sulfate solution was added, followed by addition of 250 µL of the PBA
solution. The mixture was vortexed for 10s and incubated in an ultrasonic bath at room temperature
for 5min. 250 µL of a HCL (37%)/Milli-Q water solution (1/9, v/v) was added. The PBA derivatives of
EtG were extracted by addition of 1 mL of n-heptane, vortexing the mixture for 10s and transfer of
the upper layer to an empty glass test tube. The extraction was repeated with 1 mL of n-heptane and
the two extracts were combined and evaporated to dryness under a nitrogen stream at 50 °C. The
residue was dissolved in 400 µL of n-heptane and the supernatant was transferred to an empty GC-
MS vial, 2µL were injected in GC-MS/MS in both full scan as well as SIM mode.
2.2.7 Instrumentation for GC-MS/MS
A Varian CP-3800 gas chromatography – 1200L Quadrupole MS/MS system operating in EI mode was
used for analysis. Compounds were separated on a fused silica column (Agilent, DB-35MS) with a
(35%-phenyl)-methylpolysiloxane stationary phase (30 m length x 0.25 mm I.D. x 0.25 µm film
thickness). The carrier gas was helium with a constant flow of 1 mL/min. The injector temperature
was 250 °C, the initial column oven temperature of 75 °C was kept for 1 min and subsequently

22
increased at a rate of 20°C/min to 300 °C. The GC-MS/MS analysis was performed in full scan mode,
as well as SIM mode for derivatives with BSTFA and PBA. The precursor ions of EtG (261) and EtG-d5
(266) were selected for BSTFA, before fragmentation in the collision cell at an energy of 10.0 eV,
giving product ions of 143 for both EtG and EtG-d5. The precursor ions of EtG (308) and EtG-d5 (313)
were selected for PBA.
2.2.8 Data processing
Data was processed using the software MassLynx V4.1 and MS Workstation V6.9.2.
2.3 Results and discussion
2.3.1 Method development for LC-MS/MS Comparison of clean-up methods
To begin with, three different clean-up methods described in literature 83-85 were tested, as explained
in Chapter 2.2. In the method in which Isolute NH2 (aminopropyl) cartridges were used, no EtG was
detected in all chromatograms. The SPE cartridges are anion exchange cartridges, which should work
for an acidic compound as EtG, so the problem has to originate elsewhere. A possibility is that all
sample is already removed from the column by the washing solvent, which was a Milli-Q/5%
ammonia solution. Unfortunately, the washing solvents were not collected in glass tubes, so this
needs some further research later on in the project.
Clean-up method 1 and 2 made use of the same SPE cartridges, only the washing steps were
different. The suspicious part about method 1 is the fact that one of the washing solvents is
methanol, in which many compounds dissolve easily. Therefore, during the analysis, also the washing
step with methanol was collected in glass tubes, evaporated under a nitrogen stream and
reconstituted. In Figure 8, the chromatograms of a 5000 pg/µL sample treated with method 1, both
of the washing step with methanol as of the reconstitution, are shown. The intensities of the peaks
are in the right corner.
Figure 8: Chromatograms of EtG samples in a concentration of 5000 pg/µL with clean-up method 1. A: washing step with methanol. B: reconstituted samples. Chromatograms were recorded with a Micromass Quattro Ultima Pt mass-
spectrometer.

23
As can be seen in the figure, the clean-up method does not work properly. In the washing-step
(Figure 8A) EtG is detected, the amount of EtG that gets lost in the analysis is even bigger than the
amount detected after reconstitution (Figure 8B), which was the case for all concentrations
measured.
In Figure 9 the chromatograms of the clean-up method 2 are shown, with the intensity of the signal
in the right corner. As can be seen in this Figure, this method shows slightly better results, but the
intensities still don’t show a relation as expected. For example, the intensity of the peak for the 2000
pg/µL sample (Figure 9D) should be twice as high as the 1000 pg/µL sample (Figure 9C), but the
intensities are almost the same; even the signal for the 1000 pg/µL signal is slightly higher. Note that
the chromatograms of 5000 and 10000 pg/µL (Figure 9E and 9F) are recorded on a different day,
which could be the reason why the chromatograms are slightly offset. Still it is unusual, since EtG
normally elutes after 2.2 min, not after 2.5 min. Therefore, it can be said the method does not work
properly, since there is a variance in peak elution times and intensities of the peaks in the
chromatogram.
Figure 9: Chromatograms of EtG samples in different concentrations with clean-up method 2. Chromatograms were recorded with a Micromass Quattro Ultima Pt mass-spectrometer.
Overall, none of the clean-up methods worked perfectly. Method 3 was not able to detect EtG
signals, the Oasis MAX 3cc SPE cartridges did show some EtG signals in the chromatograms, but the
results were not as expected. Overall, method 2 in total showed the best results, but all methods
need further improvement in order to work sufficiently. Also, the intensities of the peaks are really
low. For this reason, after these experiments, the MS/MS-spectrometer was replaced by two other,
more sensitive machines, namely Waters Xevo TQ-S and SCIEX QTRAP-6500.

24
Comparison of reconstitution solvents
The EtG samples were reconstituted in methanol, acetonitrile and mobile phase A in order to
compare peak shapes and intensity of the peaks. In Figure 10, the chromatograms of these samples
are shown, with the intensities of the peaks in the right corner.
Figure 10: Chromatograms of EtG samples reconstituted in 200 µL of respectively A: acetonitrile, B: mobile phase A and C: methanol. Chromatograms were recorded with a Waters Xevo TQ-S mass spectrometer.
As can be seen in the figure, acetonitrile (Figure 10A) is not sufficient as reconstitution solvent, since
no peak appeared in the chromatogram. This is not as expected, since acetonitrile is also a polar
solvent such as methanol and water (mobile phase A). A solution could be the fact that the samples
in acetronitrile needed a longer time to reconstitute as in methanol and water (mobile phase A),
since the reconstitution times were all equal it could be that EtG did not have time to dissolve in the
acetonitrile. Both methanol (Figure 10C) and mobile phase A (Figure 10B) are sufficient as
reconstitution solvents, however the peak shape of the sample reconstituted in methanol is tailing.
The peak of the sample in mobile phase A (Figure 10B) is sharper, and the intensity of the peak is
slightly higher, though in the same order of magnitude. Since this peak looked really sufficient, it was
decided to continue with mobile phase A as reconstitution solvent.
Different amounts of reconstitution solvents were also tested, 100, 200 and 400 µL, but the
intensities and shapes of the peaks remained the same. Based on these observations, mobile phase A
was chosen as reconstitution solvent, in an amount of 200 µL, to make sure several measurements
could be performed with LC-MS/MS.
Calibration
In Figure 11A, the calibration curves for EtG are shown. As can be seen, the coefficient of
determination R2 for the method with Waters Xevo TQ-S is 0.9755, the R2 for the method with SCIEX
QTRAP-6500 is 0.9916, which is almost equal to the perfect situation, which is an R2 of 1.

25
Figure 11: Calibration curves of EtG corrected with EtG-d5, recorded with blue: SCIEX QTRAP-6500 mass spectrometer, orange: Xevo TQ-S mass spectrometer. A: calibration curve 0 to 9 ppm. B: calibration curve zoomed in, 0 to 0.0125 ppm.
In Figure 11B, the same calibration curves are shown, but zoomed in on the smaller concentrations of
EtG. As can be seen, the values for R2 become a little smaller, since the first measurements (0 to
0.0025 ppm) give quite similar results, especially when a Xevo TQ-S mass spectrometer is used.
However, since the R2 value and peak areas are still higher with the SCIEX QTRAP-6500 mass
spectrometer, it was chosen to use this machine in further experiments.
Control of evaporation-step in sample preparation and clean-up
Since all clean-up methods with SPE did not work properly, this experiment was done without SPE.
The same sample preparation steps as described in Chapter 2.2.3 were followed. After
centrifugation, 100 µL of the supernatant was collected into vials for LC-MS/MS. The rest of the
supernatant was transferred to glass tubes and evaporated under a nitrogen stream at 40 °C, and
reconstituted in 200 µL of mobile phase A. The resulting peak areas are shown in Figure 12.
Figure 12: Peak areas of EtG for 100µl supernatant (blue) and evaporation and reconstitution in 200 µl mobile phase A (orange).
As can be seen in the Figure, the peak areas for the method in which 100 µL of the supernatant was
collected and immediately measured are much smaller than for the method with evaporation and
reconstitution in 200 µL of mobile phase A. This could be due to the fact that the samples in 100µL
supernatant, in which the hair matrix is still present in the tubes while collecting the sample, are less
concentrated than the reconstituted samples. This leads to the fact that evaporation after clean-up is
a necessary step in the analysis.

26
The peak areas for all samples are according to the concentrations of EtG in the sample, they become
higher with higher concentrations. However, also the blank sample with a concentration of 0 ppm
gave a peak at 2.1min, as can be seen in Figure 13. Since all samples, including the blank one, contain
the internal standard EtG-d5, the internal standard was examined to check for contamination with
EtG.
Figure 13: Chromatogram of blank hair sample with internal standard EtG-d5. Chromatogram was recorded with a SCIEX QTRAP-6500 mass spectrometer.
Testing internal standard EtG-d5 and evaluation of the blank hair samples
In order to examine for contamination, a 10.000 pg/μL (10 ppm) solution of the internal standard in
mobile phase A was analysed.
As can be seen in Figure 14, a chromatogram of a 10.000 pg/μL (10 ppm) internal standard solution
EtG-d5 shows a peak of EtG between 2.1 and 2.2 min. The intensities are quite low, in the same
range as was seen in Figure 13 of a blank hair sample containing only the internal standard solution
EtG-d5, so it is possible that the internal standard EtG-d5 contains a small amount of EtG, leading to
these peaks in the chromatogram.
Figure 14: Chromatograms of 10 ppm EtG-d5 in methanol. A: MRM of 2 channels (EtG-d5). B: MRM of 4 channels (EtG). Chromatograms were recorded with a SCIEX QTRAP-6500 mass spectrometer.
Another possibility is the fact that the blank hair samples are in fact not really blank for EtG. Another
possibility could be the fact that the blank hair samples are not blank for EtG. To test this, the
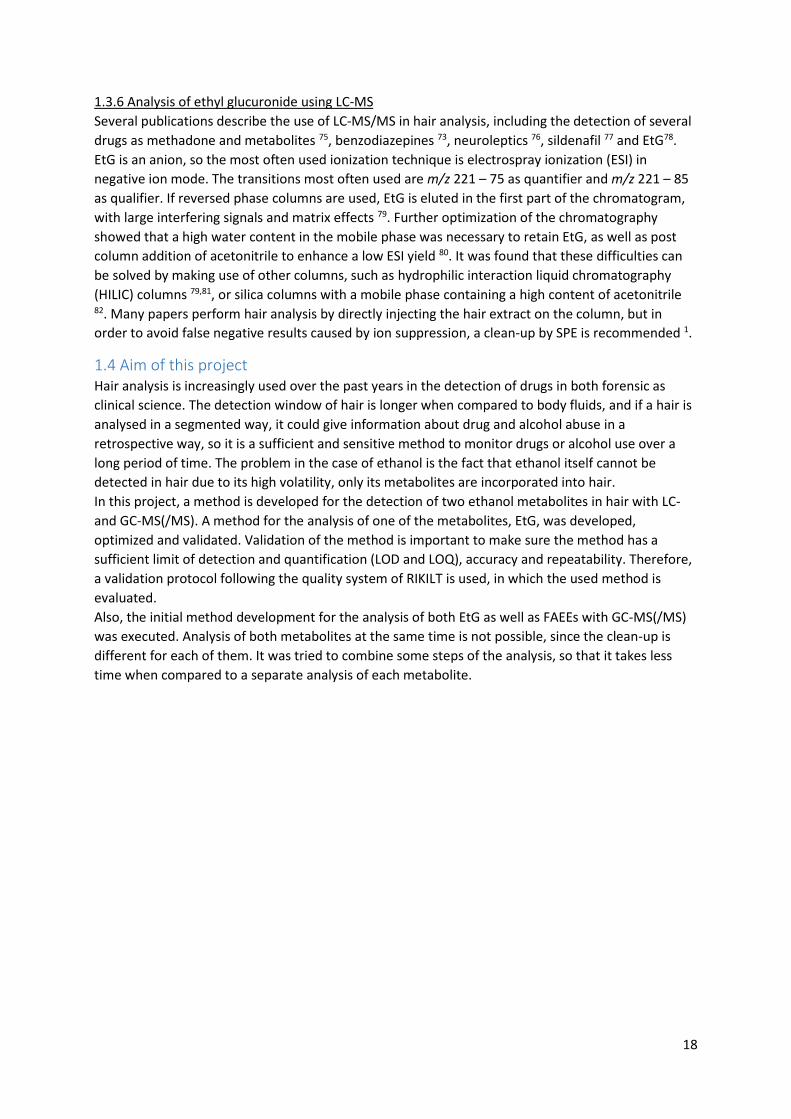
measurements are repeated with cow hair, which should be blank for EtG. In Figure 15, the
chromatograms for the blank cow hair samples are shown.
27
Figure 15: Chromatogram of a blank cow hair sample. Chromatogram was recorded with a SCIEX QTRAP-6500 mass spectrometer.
As can be seen in the Figure, the blank cow hair sample shows a small peak at 2.1min, which could be
originating from EtG. The intensity of the peak is in the same range as was seen in Figures 13 and 14.
This leads to the fact that the internal standard, EtG-d5, contains a small amount of EtG. However,
because it is such a small amount, it will still be used in further experiments, but it will be kept in
mind while interpreting the results that the results are in fact slightly lower than shown in the
chromatogram.
2.3.2 Method development for GC-MS/MS Since the LC-MS method for detection of EtG in hair did not work sufficiently enough, next step in the
project was to develop a method to analyse EtG in hair with GC-MS/MS.
At first, reaction 1 to 7 in Table 2 were performed and tested. Unfortunately, analysis of the
derivatization products did not show any signals for EtG. Reaction number 3 showed some peaks in
the chromatogram, but the spectra belonging to these peaks were not originating from EtG.
Since some signal was visible in reaction number 3, this reaction was investigated further with
reactions 8 to 15. The three derivatization reagents were tested in a mixture with ethyl acetate, and
the temperature/time varied. The last three reactions (13-15) were evaporated after derivatization
and reconstituted in isooctane. Unfortunately, none of the reactions showed any signal for EtG,
including a repetition of reaction number 3 on a different day.
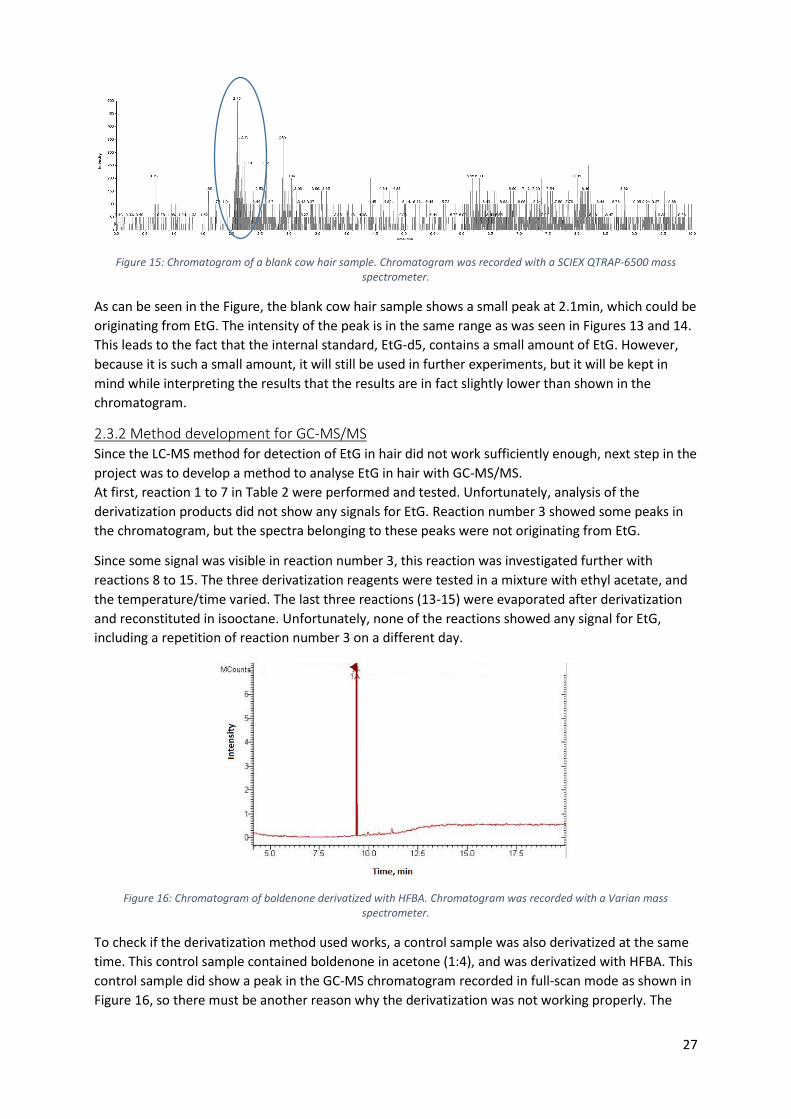
Figure 16: Chromatogram of boldenone derivatized with HFBA. Chromatogram was recorded with a Varian mass spectrometer.
To check if the derivatization method used works, a control sample was also derivatized at the same
time. This control sample contained boldenone in acetone (1:4), and was derivatized with HFBA. This
control sample did show a peak in the GC-MS chromatogram recorded in full-scan mode as shown in
Figure 16, so there must be another reason why the derivatization was not working properly. The

28
fact that none of the derivatization reactions worked, could be due to the fact that there might be
some water present in the samples or the solvents used; in this case the derivatization agent is
hydrolysed, so no derivatization takes places at all.
Lastly, another derivatization method was tested, method (ii) in Chapter 2.2.6. In Figure 17, the
chromatogram and spectrum of this derivatization, recorded in SIM mode in the range from 305-315
m/z, is shown.
Figure 17: Chromatogram (A) of 10 ppm EtG solution derivatized with PBA, and spectrum (B) of EtG-PBA. Chromatogram was recorded with a Varian mass spectrometer.
As can be seen in this Figure, several peaks show up. The first peak, eluting at 4min., could be
originating from the EtG-PBA complex, since this complex has got an m/z ratio of 308.
When derivatizing with PBA, PBA can also react with itself to form a large complex, as shown in
Figure 18. Its mass, an m/z ratio of 311, shows a peak eluting at 5min.
Figure 18: Chromatogram (A) of 10 ppm EtG solution derivatized with PBA, and spectrum (B) of PBA complex formed during derivatization. Chromatogram was recorded with a Varian mass spectrometer.
In Figure 19A, the full chromatogram is once again shown, with the filtered chromatogram for m/z
311 in Figure 19B, and the filtered chromatogram for m/z 308 in Figure 19C. As can be seen, the
intensity in Figure 19C is extremely low, and the largest signal in the chromatogram originated from
m/z 311, which originates from the PBA complex formed by a reaction of PBA with itself. Since this
signal is much larger than the signal originating from EtG-PBA, it is possible that PBA reacts quickly
with itself, leaving less PBA for derivatization of EtG.

29
Figure 19: (A) Full chromatogram and chromatogram of (B) m/z 311 of the PBA complex and (C) m/z 308 of EtG-PBA.
Due to time limitations, unfortunately the derivatization of EtG was not investigated any further, but
the derivatization of EtG with PBA is promising.
2.4 Practical obstacles 2.4.1 Evaluation of the transitions used in the LC-MS/MS method
In Figure 20, the mass spectrum of EtG with its transitions is shown. In the LC-MS/MS measurements
four transitions for EtG were used, namely m/z 221 – 95, 221 – 85, 221 – 75 and 221 – 57, because
they showed the highest intensity peaks in the mass spectrum, as shown in the daughter ion scan
chromatogram in Attachment 1.
Figure 20: Transitions for ethyl glucuronide. Reproduced from Ref 78.
30
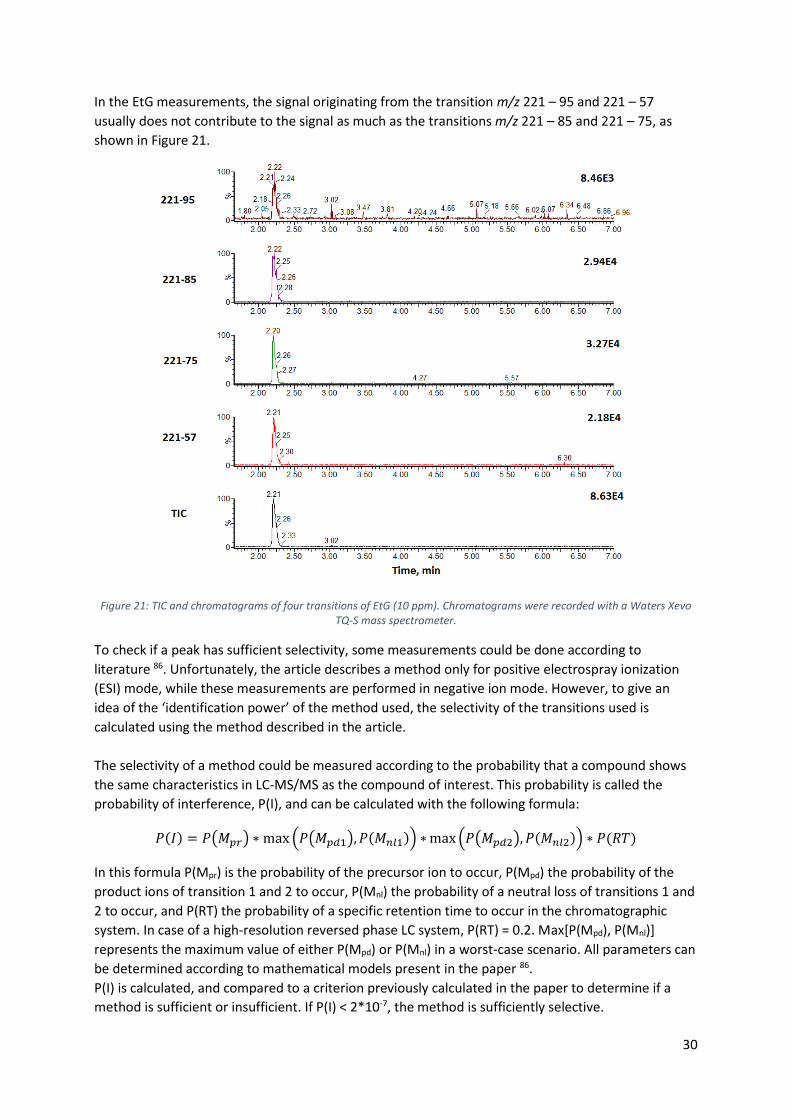
In the EtG measurements, the signal originating from the transition m/z 221 – 95 and 221 – 57
usually does not contribute to the signal as much as the transitions m/z 221 – 85 and 221 – 75, as
shown in Figure 21.
Figure 21: TIC and chromatograms of four transitions of EtG (10 ppm). Chromatograms were recorded with a Waters Xevo TQ-S mass spectrometer.
To check if a peak has sufficient selectivity, some measurements could be done according to
literature 86. Unfortunately, the article describes a method only for positive electrospray ionization
(ESI) mode, while these measurements are performed in negative ion mode. However, to give an
idea of the ‘identification power’ of the method used, the selectivity of the transitions used is
calculated using the method described in the article.
The selectivity of a method could be measured according to the probability that a compound shows
the same characteristics in LC-MS/MS as the compound of interest. This probability is called the
probability of interference, P(I), and can be calculated with the following formula:
𝑃(𝐼) = 𝑃(𝑀𝑝𝑟) ∗ max (𝑃(𝑀𝑝𝑑1), 𝑃(𝑀𝑛𝑙1)) ∗ max (𝑃(𝑀𝑝𝑑2), 𝑃(𝑀𝑛𝑙2)) ∗ 𝑃(𝑅𝑇)
In this formula P(Mpr) is the probability of the precursor ion to occur, P(Mpd) the probability of the
product ions of transition 1 and 2 to occur, P(Mnl) the probability of a neutral loss of transitions 1 and
2 to occur, and P(RT) the probability of a specific retention time to occur in the chromatographic
system. In case of a high-resolution reversed phase LC system, P(RT) = 0.2. Max[P(Mpd), P(Mnl)]
represents the maximum value of either P(Mpd) or P(Mnl) in a worst-case scenario. All parameters can
be determined according to mathematical models present in the paper 86.
P(I) is calculated, and compared to a criterion previously calculated in the paper to determine if a
method is sufficient or insufficient. If P(I) < 2*10-7, the method is sufficiently selective.

31
Table 1: Precursor Ion Mass, Product Ion Mass and Retention Time, and calculation of P(I) of several transitions of EtG
Transitions ethyl glucuronide
Precursor ion (m/z) 221.18 221.18 221.18 221.18 221.18 221.18 221.18 P(Mpr) 6.5*10-4 6.5*10-4 6.5*10-4 6.5*10-4 6.5*10-4 6.5*10-4 6.5*10-4 Product ion 1 (m/z) 75.12 85.13 95.2 85.13 95.2 95.2 203.2 P(Mpd1) 0.015 0.019 0.023 0.019 0.023 0.023 0.019 Neutral loss 1 146.06 136.05 125.98 136.05 125.98 125.98 17.98 P(Mnl1) 0.027 0.030 0.031 0.030 0.031 0.031 0.1 Product ion 2 (m/z) 57.24 57.24 57.24 75.12 75.12 85.13 75.12 P(Mpd2) 0.007 0.007 0.007 0.015 0.015 0.019 0.015 Neutral loss 2 163.94 163.94 163.94 146.06 146.06 136.05 146.06 P(Mnl2) 0.021 0.021 0.021 0.027 0.027 0.030 0.027 P(RT) 0.2 0.2 0.2 0.2 0.2 0.2 0.2 P(I) 7.47*10-8 8.16*10-8 8.60*10-8 1.04*10-7 1.10*10-7 1.20*10-7 3.52*10-7
In Table 1, the calculations for several transitions of ethyl glucuronide related to each other are
given. The transitions m/z 221.18 – 95.2, 221.18 – 85.13, 221.18 – 75.12 and 221.18 – 57.24 are the
transitions used in the EtG sample measurements. They all have a value of P(I) lower than 2*10-7,
which leads to the fact that the method used for the measurements should be sufficiently selective.
As a comparison, the transition m/z 221.18 – 203.2 is calculated related to the most characteristic
transition of EtG. The transition to 203.2 stands for loss of H2O, which is not a characteristic
transition for ethyl glucuronide. The P(I) value for this transition is larger than 2*10-7, so this
transition leads to an insufficient selectivity and can’t be used in the method.
2.4.2 Limits of detection (LODs) with LC-MS/MS
As can be seen in the calibration curves in Figure 11A and B, the peak areas of solutions with a small
concentration of EtG show a similar result. In the case of a Xevo TQ-S mass spectrometer,
chromatograms of solutions with a concentration higher than 0.005 ppm (5 μg/L) of EtG really show
a relation between concentration and signal intensity. For this reason, the LOD of the samples used
for the calibration of EtG with this mass spectrometer was set to 5 µg/L. In the case of a SCIEX
QTRAP-6500 mass spectrometer, solutions with a concentration higher than 0.0025 ppm (2.5 µg/L) of
EtG show a relation between concentration and signal intensity, which is a factor 2 smaller than the
Xevo TQ-S mass spectrometer.
However, these solutions were stock solutions, no hair matrix was present in the sample. If these
concentrations were converted to a theoretical concentration in pg/mg, which is the unit the SoHT is
working with, in combination with the method used (50 mg of hair, reconstituted in 200µL) it would
be a concentration of 20 pg/mg for the Xevo TQ-S and a concentration of 10 pg/mg for the SCIEX
QTRAP-6500. This is higher than the cut-off value of 7 pg/mg given by the SoHT, and it would be even
higher if a real hair matrix is present and all sample preparation and clean-up steps are involved.

32
3. Optimization and validation of LC-MS/MS method for EtG in hair
3.1 Introduction The LC-MS/MS methods tested in Chapter 2 did work, but the SPE methods did not work properly
and the detection limits were too high according to the guidelines of the SoHT. Since the
derivatization steps for GC-MS did not work, it was decided to optimize the LC-MS method including
the sample preparation and clean-up steps to as sensitive as possible, and to validate this optimized
method.
In the extraction step of the procedure, selecting the best extraction solvent plays an important role.
In previous research, methanol, a mixture of methanol and water (1:1), water and a mixture of water
and trifluoroacetic acid (9:1) were tested as extraction solvent; water was found to be the best
suitable solvent for the extraction of EtG 1 and is therefore applied in most procedures, including the
procedure used in this research. The extraction is performed in an ultrasonic bath for several hours
often followed by an incubation overnight, but previous research showed that the extraction with
water and ultra-sonication is enough to complete the extraction 1. This was tested in this
optimization.
The first step performed in the optimization was selection of the right conditions for SPE. Clean-up
by SPE is often done in hair analysis, since it removes impurities and matrix interferences and
concentrates the analytes of interest to increase the sensitivity 1. Optimization of the SPE method is
crucial to increase the sensitivity of the full method as much as possible. After sample treatment and
clean-up with SPE, the extracts will be more concentrated and contain less impurities, so the
detectability will be increased 87. SPE is done in five steps, as shown in Figure 22. All steps can be
optimized, excluding step 3.
Figure 22: SPE is a five-step process. Step 1: Selection of the proper SPE tube or disk, step 2: conditioning the SPE tube or disk, step 3: addition of the sample, step 4: washing of the packing material, step 5: elution of the compounds of interest.
Reproduced from Ref 87.
SPE columns are available in many varieties, so selecting the most appropriate product for the clean-
up of EtG samples is important; the column can be for instance an anion exchange (reversed phase)
cartridge because of the fact that EtG is highly acidic, or a carbon-based cartridge, for example EtG
cartridges especially developed for the detection of EtG in urine 1. Before the sample is added to the
column, the column needs to be conditioned. In the case of a reversed phase column, the
conditioning contains two steps. At first, the sorbent-surface needs to be wetted by an organic
solvent, so that the bonded alkyl phase gets permeated. The silica-surface also needs to be wetted,
this is done with water or an aqueous buffer 87.

33
Another important step in optimizing the SPE method is selecting the right washing solvent. Washing
the sample is a necessary step in SPE, since it removes impurities from the sample. Washing is
performed with a solvent that is stronger than the extraction solvent. At the same time, the washing
solvent must be weaker than the solvent necessary to remove the compound of interest, since you
want that compound to stay on the column 87. In Table 2 characteristics of solvents commonly used
in SPE are shown. Solvents with a different polarity than the elution solvent used in the end of the
SPE, could be useful as washing solvents.
Table 2: Characteristics of solvents commonly used in SPE. Reproduced from Ref. 87
Polarity Solvent Miscible in water? Nonpolar Strong reversed
phase Weak normal phase
Hexane
No Isooctane No Carbon tetrachloride No Chloroform No Dichloromethane No Tetrahydrofuran Yes Diethyl ether No Ethyl acetate Poorly Acetone Yes Acetonitrile Yes Isopropanol Yes Methanol Yes Water Yes
Polar Weak reversed phase
Strong normal phase Acetic acid
Yes
Since the sample matrix is water, and reversed phase SPE columns are used, all solvents besides
acetic acid are stronger than the extraction solvent. Several washing solvents covering the entire
range in Table 2 will be tested to optimize the washing step of the SPE method.
Lastly, the compounds of interest must be eluted. During the elution step, the compound of interest
must be removed from the extract and the column, but any impurities that were not removed during
the washing step must be left behind in the column. Previous research showed that methanol/2%
formic acid is a sufficient elution solvent for EtG 78,79, so this solvent is used in the SPE method.
3.2 Materials and methods 3.2.1 Hair samples
The analysis of EtG in hair was performed on blank hair samples provided by children or abstaining
adults. Reference hair samples were purchased from Medichem (Germany).
3.2.2 Chemicals and reagents
Ethyl glucuronide and ethyl glucuronide-d5 were purchased from Cerilliant (USA). Milli-Q water was
obtained from a Millipore system of Merck (Germany). SPE Oasis MAX 3cc cartridges were purchased
from Waters (Ireland), Isolute NH2 (aminopropyl) cartridges were purchased from Biotage (Sweden),
Strata-X cartridges were purchased from Phenomenex (USA). Ammonium formate was purchased
from Sigma-Aldrich (Germany). Methanol, n-hexane, ethyl acetate and acetonitrile were purchased
from Actu-All chemicals (Netherlands). Formic acid and 25% ammonia solution were purchased from
Merck (Germany).

34
3.2.3 Sample preparation and clean-up procedure for LC-MS/MS
Approximately 50 mg of the blank hair samples were exactly weighed and cut into pieces (1-2 mm)
with scissors. The hair samples were then spiked with different concentrations of the standard
solution of EtG, which was evaporated to air for 30 min. 20 µL of internal standard solution (EtG-d5,
10 ppm) and 2 mL of Milli-Q water were added, and the extraction was performed by ultrasonication.
Different ultrasonication times were tested in order to optimize this step in the procedure. After
centrifugation for 7 min at 4000 rpm, the SPE method was optimized using the following procedures:
(i) Solid phase extraction using Isolute NH2 (aminopropyl) cartridges (Biotage, Sweden) were
conditioned with 2 mL of methanol and 2 mL of Milli-Q water. Care was taken to ensure that the
columns did not dry between these conditioning steps. The extract was transferred on the SPE
column and the columns were dried for 5 min. The samples were washed with 3 mL of n-hexane, and
dried for 5 min under a strong vacuum. EtG was eluted with 3 mL of methanol/2% ammonia solution
in glass tubes and evaporated to dryness under a nitrogen stream at approximately 50 °C.
(ii) Solid phase extraction using Strata X cartridges (Phenomenex, USA) were conditioned with 2 mL
of methanol and 2 mL of Milli-Q water. Care was taken to ensure that the columns did not dry
between these conditioning steps. The extract was transferred on the SPE column and the columns
were dried for 5 min. The samples were washed with 2 mL of n-hexane, and dried for 5 min under a
strong vacuum. EtG was eluted with 2 mL of methanol/2% formic acid solution in glass tubes and
evaporated to dryness under a nitrogen stream at approximately 50 °C.
(iii) Solid phase extraction using Oasis MAX 3cc cartridges (Waters, Ireland) were conditioned with 2
mL of methanol and 2 mL of Milli-Q water. The extract was transferred on the SPE column and the
columns were dried for 5 min. Several washing solvents were tested for this procedure, namely
Milli-Q/5% ammonia solution, hexane, Milli-Q water, acetonitrile and ethyl acetate, 2 mL of the
washing solvent was used, and the column was dried for 10 min. EtG was eluted with 2 mL of
methanol/2% formic acid in glass tubes and evaporated to dryness under a nitrogen stream at
approximately 50 °C.
All residues were reconstituted in 200 µL of mobile phase A and 10 µL were injected for
measurement by LC-MS.
3.2.4 Instrumentation for LC-MS/MS
Liquid-chromatography was performed on a Waters Acquity UPLC system, and a Zorbax Eclipse XDB-
C8 column (5 µm, 4.6 x 150 mm) with the mobile phases A = 5mM NH4-formate in Milli-Q water and
B = acetonitrile, with the following gradient: 0-3 min 100% solvent A, linear to 90% B in 2 min for 3
min, linear to 100% A in 0.10 min for 2 min. The flow rate was 0.5 mL/min. The detection was
performed on an AB-SCIEX QTRAP-6500 mass spectrometer instrument with ESI in negative mode
using the following transitions for EtG: m/z 221 – 95, 221 – 85, 221 – 75, 221 – 57, and for EtG-d5:
m/z 226 – 85, 226 – 75.
3.2.5 Validation
A validation plan was written and executed according to Commission Decision 2002/657/EC 88, also
described in RIKILT SOP A0400 and F0052. The validation plan for the detection of EtG in human hair
is shown in Attachment 2.
Three validation days were executed. Every day, 8 different blank human hair samples were used;
samples A to H on day 1, samples I to P on day 2, and samples Q to X on day 3. Samples A, I and Q
were used for determination of the linearity by preparing a matrix-matched standards (MMS) series
of 0, 0.25, 0.5, 1.0, 2.0 and 3.0 times the permitted level, and for the determination of the recovery
by spiking the sample with 1.0 times the permitted level after clean-up.
Samples B to H, J to P and R to X were used to determine trueness, within-laboratory reproducibility,
repeatability, CCα/CCβ, and selectivity. The determination of the trueness, within-laboratory

35
reproducibility, repeatability*, and CCα/CCβ was done by spiking 7 different hair samples at 0.5, 1.0
and 1.5 times the permitted level. The selectivity was determined with 7 blank samples, without
spiking.
Samples B, J and R are used for the determination of the repeatability. From each batch, 7 hair
samples are spiked at 1.0 times the permitted level. The matrix effect was determined by comparison
of the matrix-matched recovery standards (MMRS) of samples A, I and Q, and the stock solution at
the same level.
Additional criteria is stated in the validation plan displayed in Attachment 2, including a brief
summary of each of the performance characteristics.
3.2.6 Data processing
Data was processed using the software MassLynx V4.1, Multiquant 3.0.2 and the ‘ResVal’ template
provided by RIKILT.
3.3 Results and discussion
3.3.1 Optimization First step in the optimization of the sample preparation was the optimization of the ultrasonication
time. A blank hair sample was spiked with a solution of 10.000 pg/μL (10 ppm) EtG and placed in an
ultrasonic bath. Every hour, the 2 mL of extraction solvent was transferred to a glass tube, and 2 mL
of fresh extraction solvent was added to the hair sample. In Figure 23, the peak areas of both EtG and
its internal standard EtG-d5 are shown for different times in an ultrasonic bath, varying from 1 to 7
hours. As can be seen, during the first three hours most of the EtG present in the hair matrix is
extracted. After four hours, the amount of EtG that is extracted every hour is an equal, small amount.
Therefore, in order to make the sample preparation step sufficient, but at the same time as quick as
possible, the ultrasonication time was set at four hours.
Figure 23: Peak areas of EtG (blue) and EtG-d5 (orange) in ultrasonication testing.
After finding the optimum ultrasonication time, it was tested if extra overnight incubation is
necessary. This was tested by spiking eight blank hair samples with a solution of 10.000 pg/μL (10
ppm) EtG, and placing them in an ultrasonic bath. Every hour, two samples were removed from the
ultrasonic bath; one sample was transferred to a clean glass tube, the other one was set aside for
overnight incubation with the hair matrix still present in the sample.

36
Figure 24: Peak areas of EtG in overnight incubation testing. Blue represents samples directly transferred to a clean glass tube after ultrasonication, orange represents samples with overnight incubation with hair matrix still present.
As can be seen in Figure 24, the amount of EtG removed from the sample matrix is higher if the
ultrasonication time is longer. However, overnight incubation also increases the amount of EtG
removed from the hair matrix. It was therefore decided to perform the incubation by placing the
samples in an ultrasonic bath for four hours, followed by overnight incubation in order to remove as
much EtG from the hair matrix as possible.
To show the effect of using SPE as sample clean-up step, a hair sample was prepared and extracted in
duplicate, and half of the extract was directly evaporated and reconstituted, while the other half was
submitted to SPE clean-up. The SPE method used was an Oasis MAX 3cc column, the washing solvent
was 2 mL of n-hexane and the elution solvent was 2 mL methanol/2% formic acid. Figure 25 shows
the area of the EtG peaks in the chromatograms.
Figure 25: Peak areas in the chromatograms of a procedure with (blue) and without (orange) SPE.
As can be seen in Figure 25, the peak areas are higher in a procedure which includes clean-up with
SPE, especially when the concentration of EtG becomes higher. In the case of a concentration of 10
ppm, the area with SPE is approximately 2 times higher than without SPE, which means SPE is a
crucial step in order to make the method as sensitive as possible.
First step in the optimization of the clean-up step with SPE was testing different SPE columns, the
four different procedures tested in triplicate are listed in Table 3.

37
Table 3: Conditions for SPE column testing.
# SPE column Washing solvent Elution solvent
1 Oasis MAX 3cc (1) 2mL n-hexane 2mL methanol/2% formic acid 2 Oasis MAX 3cc (1) 2mL n-hexane 2mL methanol/2% formic acid 3 Oasis MAX 3cc (1) 2mL n-hexane 2mL methanol/2% formic acid 4 Oasis MAX 3cc (2) 2mL Milli-Q/5% ammonia 2mL methanol/2% formic acid 5 Oasis MAX 3cc (2) 2mL Milli-Q/5% ammonia 2mL methanol/2% formic acid 6 Oasis MAX 3cc (2) 2mL Milli-Q/5% ammonia 2mL methanol/2% formic acid 7 Isolute NH2 (aminopropyl) 3mL n-hexane 3mL methanol/2% ammonia 8 Isolute NH2 (aminopropyl) 3mL n-hexane 3mL methanol/2% ammonia 9 Isolute NH2 (aminopropyl) 3mL n-hexane 3mL methanol/2% ammonia
10 Strata X33 2mL n-hexane 2mL methanol/2% formic acid 11 Strata X33 2mL n-hexane 2mL methanol/2% formic acid 12 Strata X33 2mL n-hexane 2mL methanol/2% formic acid
As can be seen, three different SPE columns were tested, all with solutions of 10 ppm EtG. The
Isolute NH2 (aminopropyl) column is a anion exchange column, and the Strata X is a reversed phase
column. The Oasis MAX 3cc is a column that contains both of these properties; it is a reversed phase,
strong anion exchange column. This column was tested with two different washing solvents. The
results of both washing and elution step are shown in Figure 25.
Figure 26: Peak areas of washing (A) and elution (B) steps with four different procedures including three different SPE columns.
As can be seen in the Figure 26A, the peak areas of the washing step in procedure Oasis MAX 3cc (2)
are extremely high. This means a lot of sample gets lost during the washing step in the procedure.
For this reason, procedure Oasis MAX 3cc (2) was not followed anymore; the washing solutions were
further tested and evaluated in the next step of the optimization. In Figure 26B, the peak areas of the
elution step are shown. As can be seen, the area is highest for procedure Oasis MAX 3cc (1). Since
EtG is a highly acidic compound with a pKa of 3.21, an anion exchange column is likely to give the
highest results for the elution of EtG, especially in combination with the reversed phase feature if the
column, since the sample matrix is water. The Oasis MAX 3cc column is both a reversed phase, as
well as an anion exchange column, so for this reason the Oasis MAX 3cc columns in combination with
methanol/2%formic acid as elution solvent were chosen to use in further experiments. The washing
step was further investigated, because in the procedure Oasis MAX 3cc (1), still some sample gets
lost during analysis, as can be seen in the Figure.
The next step was optimization of the washing solvent. Five different washing solvents were tested,
namely hexane, acetonitrile, Milli-Q water, ethyl acetate and Milli-Q/5% ammonia solution, in order
to cover the entire solvent range showed in Table 2. All washing solvents were stronger than or equal
to the extraction solvent, Milli-Q water, except for Milli-Q/5% ammonia. Since ammonia is a polar

38
molecule, mixing water with ammonia makes the solution more polar, which leads to the fact that
Milli-Q/5% ammonia should be listed in Table 2 below water.
In Figure 27, the results of the area of the peaks originating from the washing and elution steps are
shown. The linearity (R2) belonging to the five washing solvents are as follows: 0.4066 for hexane,
0.9941 for acetonitrile, 0.8654 for Milli-Q, 0.9930 for ethyl acetate and 0.9749 for Milli-Q/5%
ammonia solution, respectively. As can be seen, the peak areas of the washing steps with the Milli-
Q/5% ammonia solution are extremely high, same as seen in Paragraph 2.3.1 during the initial
method testing and Figure 26A during the selection of the SPE column. The statement made above
could thus be true regarding the polarity of Milli-Q/5% ammonia solution; since the washing solvent
should be stronger than the extraction solvent in reversed phase columns, and a mixture of Milli-Q
with 5% ammonia is more polar than just Milli-Q, EtG can be removed from the column during the
washing step. The areas of the washing steps with the other four procedures are small, so all four
methods work properly. Since acetonitrile (R2 = 0.9941) and ethyl acetate (R2 = 0.9930) gave the most
linear relationship between the area and the concentration of EtG, acetonitrile was chosen as the
washing solvent to use in further experiments because the peak areas with acetonitrile were higher.
Figure 27: Peak areas of the washing and elution steps of five different procedures.
3.3.2 Validation
The validation of EtG in human hair was executed with 24 blank hair samples (A to X) with known
concentrations of EtG added to these samples. The theoretical detection limit calculated based on
the calibration curve, from measurements with the most sensitive machine available in previous
research, was 10 µg/L (10 pg/mg). Since no hair matrix, no sample preparation and no clean-up steps
were involved, the real detection limit will be higher. In order to make sure the validation can be
successfully executed and all samples can be measured, the validation level, or permitted level, for
the validation of EtG was set at 100 µg/L. This means all samples are spiked with concentrations of
0.25, 0.5, 1.0, 2.0 and 3.0 times the permitted level (25, 50, 100, 200 and 300 µg/L) before or after
sample preparation and clean-up. The validation consisted of three validation days, the hair samples
were prepared and cleaned-up according to the optimized method shown before. In Attachment 2
the validation plan is shown, the results of the measured performance characteristics are shown in
Table 4.
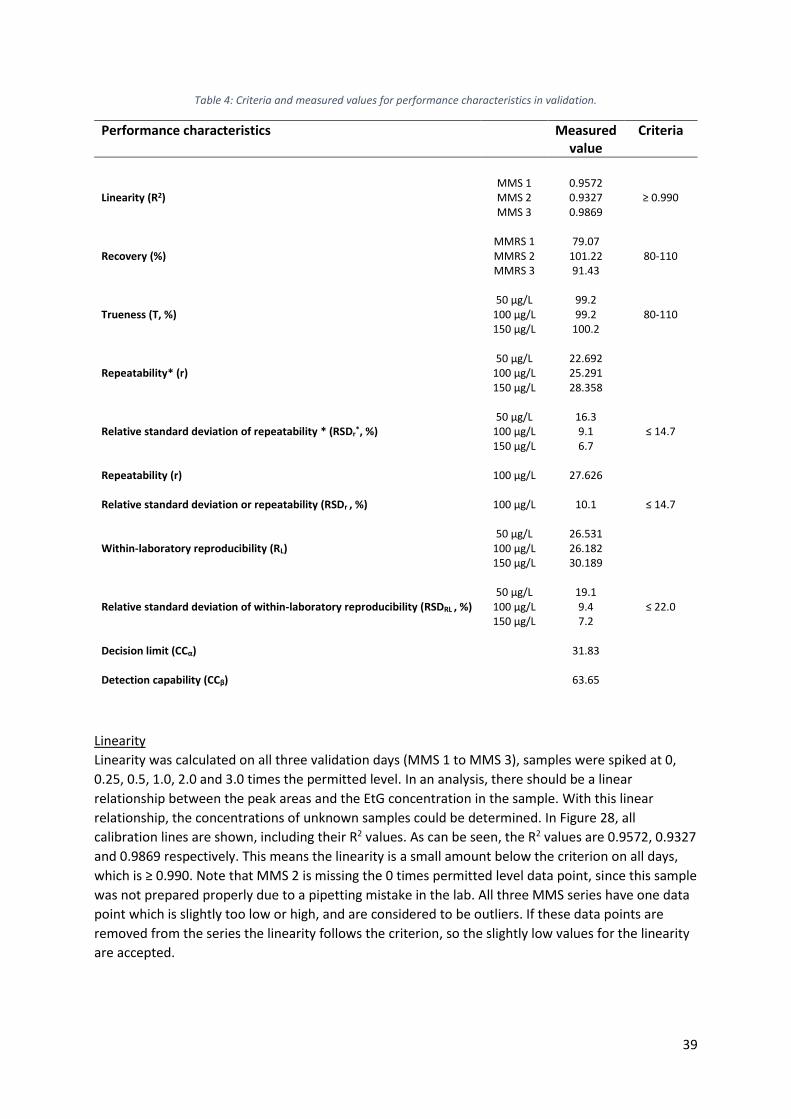
39
Table 4: Criteria and measured values for performance characteristics in validation.
Performance characteristics Measured value
Criteria
MMS 1 0.9572 Linearity (R2) MMS 2 0.9327 ≥ 0.990 MMS 3 0.9869 MMRS 1 79.07 Recovery (%) MMRS 2 101.22 80-110 MMRS 3 91.43 50 µg/L 99.2 Trueness (T, %) 100 µg/L 99.2 80-110 150 µg/L 100.2 50 µg/L 22.692 Repeatability* (r) 100 µg/L 25.291 150 µg/L 28.358 50 µg/L 16.3 Relative standard deviation of repeatability * (RSDr
*, %) 100 µg/L 9.1 ≤ 14.7 150 µg/L 6.7 Repeatability (r) 100 µg/L 27.626 Relative standard deviation or repeatability (RSDr , %) 100 µg/L 10.1 ≤ 14.7
50 µg/L 26.531 Within-laboratory reproducibility (RL) 100 µg/L 26.182 150 µg/L 30.189 50 µg/L 19.1 Relative standard deviation of within-laboratory reproducibility (RSDRL , %) 100 µg/L 9.4 ≤ 22.0 150 µg/L 7.2 Decision limit (CCα) 31.83 Detection capability (CCβ) 63.65
Linearity
Linearity was calculated on all three validation days (MMS 1 to MMS 3), samples were spiked at 0,
0.25, 0.5, 1.0, 2.0 and 3.0 times the permitted level. In an analysis, there should be a linear
relationship between the peak areas and the EtG concentration in the sample. With this linear
relationship, the concentrations of unknown samples could be determined. In Figure 28, all
calibration lines are shown, including their R2 values. As can be seen, the R2 values are 0.9572, 0.9327
and 0.9869 respectively. This means the linearity is a small amount below the criterion on all days,
which is ≥ 0.990. Note that MMS 2 is missing the 0 times permitted level data point, since this sample
was not prepared properly due to a pipetting mistake in the lab. All three MMS series have one data
point which is slightly too low or high, and are considered to be outliers. If these data points are
removed from the series the linearity follows the criterion, so the slightly low values for the linearity
are accepted.

40
Figure 28: MMS series of all three validation days.
Recovery
The recovery was also calculated on all three validation days. It was determined by comparing the
sample in the MMS spiked with 1.0 times the permitted level, with a sample originating from the
same batch with addition of the same concentration after sample preparation and clean-up. The
percentage of the recovery can be calculated with the formula:
𝑅𝑒𝑐𝑜𝑣𝑒𝑟𝑦 = (𝑝𝑒𝑎𝑘 𝑎𝑟𝑒𝑎 𝐸𝑡𝐺 𝑀𝑀𝑆 (1.0 ∗ 𝑝𝑒𝑟𝑚𝑖𝑡𝑡𝑒𝑑 𝑙𝑒𝑣𝑒𝑙)
𝑝𝑒𝑎𝑘 𝑎𝑟𝑒𝑎 𝐸𝑡𝐺 𝑟𝑒𝑐𝑜𝑣𝑒𝑟𝑦 𝑠𝑎𝑚𝑝𝑙𝑒) ∗ 100%
The recovery shows the percentage of added EtG, recovered in the analysis; in other words the
efficiency of the sample preparation. The criterion for an analysis of samples with a concentration
around 100 µg/L is 80-110%. As can be seen in Table 4, the percentages of the recovery are 79.07,
101.22 and 91.43 respectively. Only the first percentage is slightly below the criteria, but since it is
less than 1% and all other percentages are within the criteria, this is accepted.
Trueness / Within-laboratory reproducibility / Repeatability* / Repeatability
Within RIKILT, two measurements for the repeatability are used; repeatability* and repeatability.
The trueness, within-laboratory reproducibility, repeatability*, CCα and CCβ were calculated based on
spiking seven hair samples from seven different batches with concentrations of 0.5, 1.0 and 1.5 times
the permitted level, the repeatability was calculated based on spiking seven hair samples from the
same batch at 1.0 times the permitted level.
The criterion for the trueness for an analysis of samples with a concentration around 100 µg/L is 80-
110%. The percentage of the trueness can be calculated with the formula:
𝑇𝑟𝑢𝑒𝑛𝑒𝑠𝑠 (𝑇) = (𝑀𝑒𝑎𝑛 𝑚𝑒𝑎𝑠𝑢𝑟𝑒𝑑 𝑙𝑒𝑣𝑒𝑙
𝑃𝑒𝑟𝑚𝑖𝑡𝑡𝑒𝑑 𝑙𝑒𝑣𝑒𝑙) ∗ 100%
The trueness, or accuracy, of the method shows the percentage or the deviation of the measured
concentration of a sample compared to the spiked concentration. As shown in the Table, the
percentages for the trueness are 99.2, 99.2 and 100.2 % respectively, which means they follow the
criterion.
The repeatability* is the similarity between separate analyses, according to the same conditions, as
the same method, laboratory or test material. It is used for the calculation of the relative standard
deviation of the repeatability*, RSDr*, using the following formulas:
𝑅𝑒𝑝𝑒𝑎𝑡𝑎𝑏𝑖𝑙𝑖𝑡𝑦∗ (𝑟∗) = 2.8 ∗ 𝑠𝑟 (𝑠𝑟 = 𝑖𝑛𝑡𝑟𝑎 − 𝑑𝑎𝑦 𝑠𝑡𝑎𝑛𝑑𝑎𝑟𝑑 𝑑𝑒𝑣𝑖𝑎𝑡𝑖𝑜𝑛)
𝑅𝑆𝐷𝑟∗ = (
𝑠𝑟
𝑀𝑒𝑎𝑛 𝑚𝑒𝑎𝑠𝑢𝑟𝑒𝑑 𝑙𝑒𝑣𝑒𝑙) ∗ 100%

41
The criterion for the RSDr* for concentrations below 120 µg/kg is a maximum of 14.7%. As can be
seen in the Table, the percentages for the RSDr*
are 16.3, 9.1 and 6.7 % respectively. The last two
follow the criterion, the first one is slightly too high.
The repeatability was calculated with the same formulas as the repeatability*, however, all samples
originated from the same hair sample batch and were spiked at 1.0 times the permitted level. The
criterion for the RSDr is the same as the criterion for the RSDr*, which was a maximum of 14.7%. As
can be seen in the Table, the percentage for the RSDr is 10.1%, which is within the criterion.
The within-laboratory reproducibility is the similarity between separate analyses performed under
different conditions in the same laboratory during a sufficiently long period. It can be used for the
calculation of the relative standard deviation of within-laboratory reproducibility, according to the
formulas:
𝑊𝑖𝑡ℎ𝑖𝑛 − 𝑙𝑎𝑏𝑜𝑟𝑎𝑡𝑜𝑟𝑦 𝑟𝑒𝑝𝑟𝑜𝑑𝑢𝑐𝑖𝑏𝑖𝑙𝑖𝑡𝑦 (𝑅𝐿) = 2.8 ∗ 𝑠𝑅𝐿 (𝑆𝑅𝐿 = 𝑤𝑖𝑡ℎ𝑖𝑛 − 𝑙𝑎𝑏𝑜𝑟𝑎𝑡𝑜𝑟𝑦 𝑠𝑡𝑎𝑛𝑑𝑎𝑟𝑑 𝑑𝑒𝑣𝑖𝑎𝑡𝑖𝑜𝑛)
𝑅𝑆𝐷𝑅𝐿 = (𝑠𝑅𝐿
𝑀𝑒𝑎𝑛 𝑚𝑒𝑎𝑠𝑢𝑟𝑒𝑑 𝑙𝑒𝑣𝑒𝑙) ∗ 100%
The criterion for the RSDRL for concentrations below 120 µg/kg is a maximum of 22.0%. As can be
seen in the Table, the percentages for the RSDRL are 19.1, 9.4 and 7.2 % respectively. All three values
are within the criterion. Since the RSDRL percentage follows the criterion for all concentrations, the
slightly too high value for the RSDr* for the spiked hair samples with 0.5 times the permitted level is
accepted.
CCα / CCβ
The decision limit (CCα) and the detection capability (CCβ) can be calculated using the following
formulas:
𝑚𝑝𝑒𝑟𝑚𝑖𝑡𝑡𝑒𝑑 𝑙𝑒𝑣𝑒𝑙 = ∑ 𝑦𝑝𝑒𝑟𝑚𝑖𝑡𝑡𝑒𝑑 𝑙𝑒𝑣𝑒𝑙,𝑖
𝑛
𝑠𝑝𝑒𝑟𝑚𝑖𝑡𝑡𝑒𝑑 𝑙𝑒𝑣𝑒𝑙 = √(∑ 𝑦𝑝𝑒𝑟𝑚𝑖𝑡𝑡𝑒𝑑 𝑙𝑒𝑣𝑒𝑙,𝑖 − 𝑚𝑝𝑒𝑟𝑚𝑖𝑡𝑡𝑒𝑑 𝑙𝑒𝑣𝑒𝑙)2
𝑛 − 1
𝐶𝐶𝛼 = 𝑀𝑅𝐿 + 1.64 ∗ 𝑠𝑝𝑒𝑟𝑚𝑖𝑡𝑡𝑒𝑑 𝑙𝑒𝑣𝑒𝑙
𝐶𝐶𝛽 = 𝐶𝐶𝛼 + 1.64 ∗ 𝑠𝑝𝑒𝑟𝑚𝑖𝑡𝑡𝑒𝑑 𝑙𝑒𝑣𝑒𝑙
These formulas are used in the ‘ResVal’ calculation program provided by RIKILT. As can be seen in
Table 4, the found values for CCα and CCβ are 31.83 and 63.65 respectively. This means the limit at
and below which it can be concluded with an error probability of α that the concentration of EtG in
hair is divergent, is 31.83 µg/L, and the smallest concentration of EtG in hair that may be quantified
in a sample with an error probability of β of 63.65 µg/L.
Selectivity / Specificity
The selectivity was determined according to the following procedure:
(i) A statistical approach according to Berendsen et al.86
(ii) The chromatograms of the blank hair samples must be free of interferences on the retention time
of EtG.
The transitions m/z 221.18 – 95.2, 221.18 – 85.13, 221.18 – 75.12 and 221.18 – 57.24 are the
transitions used in the EtG sample measurements. As shown in Chapter 2.4.1, they all have a value of
P(I) lower than 2*10-7.

42
When looking at the retention time of EtG of 2.1 min in Figure 29, no interfering signals are observed
which could originate from the hair matrix. These two observations lead to the fact that that the
method used is sufficiently selective.
Figure 29: Chromatogram of a blank hair sample without internal standard EtG-d5. Chromatogram was recorded with a SCIEX QTRAP-6500 mass spectrometer.
Ruggedness
The ruggedness is a measure for the sensitivity of the method in case of small changes in the
method. Three changes were tested during the validation:
(i) Incubation for 5h at 50 0C instead of 4h
(ii) 4 mL washing solvent instead of 2 mL
(iii) 10 min longer evaporation after the residue is dry
All measurements were evaluated in the ResVal sheet, their concentrations were calculated and are
shown in Table 5.
Table 5: Values for measured concentrations and trueness for three changes in the method
Spiked concentration (µg/L)
Measured concentration (µg/L)
Trueness (%)
(i) 100
102.8 95.4
102.8 95.4
(ii) 100
68.7 86.3
68.8 86.3
(iii) 100
75.3 95.6
75.3 95.6
Since the criterion for the trueness is 80-110%, the percentages for the trueness for the first change
are all still within this criterion. One measured concentration for the second change (68.6%) and for
the third change (75.3%) has a too low percentage for the trueness, which means the amount of
sample detected was a bit smaller than before the change. Since the second change was more
washing solvent, this means more sample is washed away during the washing step. While
evaporating longer than necessary, the sample becomes extremely dry which means it is harder to
dissolve it again in the reconstitution solvent. However, the differences were not extremely big and
other percentages for these changes are within the criteria, so it can be said the ruggedness of the
method is sufficient if the protocol is followed.
3.3.3 Reference and real hair samples After the validation, reference hair samples with concentrations of 100 and 200 pg/mg of EtG were
tested to see if the method works properly. In Attachment 3, the certificate and instruction sheets of
the reference hair samples are shown.
In Table 6, the gravimetric and target values as well as the confidence interval and the control range
of the reference hair material is shown. In the last column, the measured value is given. These values

43
are measured according to the calibration curve measured with the SCIEX QTRAP-6500 mass
spectrometer shown in Figure 11. The reference hair material was prepared and cleaned-up in
duplicate according to the optimized method.
Table 6: Reference hair material for ethyl glucuronide in hair. Concentrations 100 and 200 pg/mg.
Unit Gravimetric value
Target value Confidence interval
Control range Measured value
Ethyl glucuronide 100
pg/mg 105.4 107.7 ± 1.9 105.8 – 109.6 60.4 – 155.1 106.3 108.9
Ethyl glucuronide 200
pg/mg 203.6 201.1 ± 2.5 198.6 – 203.6 118.4 – 283.9 199.4 206.1
As can be seen in the Table, the confidence interval for the reference hair material with a
concentration of 100 pg/mg is 105.8 - 109.6. The measured values, 106.3 and 108.9, fall within this
range. The confidence interval for the reference hair material with a concentration of 200 pg/mg is
198.6 – 203.6. The measured value of 199.4 falls within this range, the measured value of 206.1 does
not. Since the value is slightly higher than the confidence interval and the other measured value is
within the interval, it can be assumed that the reference hair material is cleaned-up and measured
properly.
The method was further tested by measuring real hair samples. During the collection of the hair
samples, the individuals were asked to answer a question sheet regarding their drinking habits and
cosmetic hair treatment. This question sheet is shown in Attachment 4. People were requested to
rate their drinking habits according to the following scale:
- Teetotaller: No drinking of alcohol for at least three months before hair sampling
- Limited: No strict abstinence of alcohol use, but only drinking alcohol at for instance a
birthday party or a wedding, so really low doses at once and usage with a mean of maximum
two alcoholic consumptions a month.
- Tolerable: Consuming alcohol up to 6 standard glasses a day (60g alcohol/day).
- Excessive: Alcohol use equal to or more than 6 standard glasses a day (60g alcohol/day).
Further questions according to hair colour, usage of shampoo, hair gel, conditioner, paint etcetera
were also answered by the individuals. Results are shown in Attachment 5.
Hair samples of 42 individuals were tested. The lowest concentrations were measured in the
teetotallers group, followed by the limited group, which is according to the classification.
However, when the concentrations measured in all groups were compared to the cut-off value stated
by the SoHT to discriminate between teetotallers or social drinkers, and excessive alcohol abusers,
which is 30 pg/mg, some positive signals were detected. In Table 7, this comparison between self-
reported drinking behaviour and the measured results for EtG is shown.
Table 7: Comparison of self-reported drinking behaviour with measured results for EtG in hair. N: number of hair samples. Positive / %: number of positive samples with a EtG concentration ≥ 30 pg/mg / percentage.
Self-reported behaviour Ethyl glucuronide
N Positive / %
Teetotaller 7 0 / 0% Limited 4 1 / 25%
Tolerable 29 3 / 10.3% Excessive 2 2 / 100%

44
As can be seen, the self-reported drinking behaviour is not necessarily suitable or trustworthy for
evaluation, since the percentages for the limited and tolerable categories are positive, which means
in these categories people are present with a measured concentration of EtG above the cut-off value
of 30 pg/mg.
Effects of cosmetic hair treatments were also tested on these 42 individuals. People were asked
questions about bleaching or dying hair, and the use of hair sprays, waxes, gels, oils and conditioners.
All individuals used shampoo, so this hair product was not included in the measurements. The hair
samples were analysed under the assumption that the drinking behaviour of an individual is
independent of its hair products use. The measured values for all hair products were compared to
the individuals who reported themselves as no treatment users. Results are shown in Table 8.
Table 8: Measured concentrations of EtG in hair with cosmetic treatment.
Treatment N Mean measured EtG concentration (pg/mg)
Effect
No treatment used 20 30.8 -
Conditioner 10 29.1 No effect
Hair spray 4 31.2 No effect
Bleaching 1 10.1 Decrease
Dying 8 18.2 Decrease
Hair gel,wax,oil 7 30.5 No effect
As can be seen in the Table, bleaching and dying the hair sample leads to a decrease in the EtG
concentration in human hair. The mean measured values are below the LOD of the method, which
means they could vary a bit in practice, but it is clear that there is a decrease in the amount of EtG
detected. In many hair dyes an oxidizing compound such as H2O2 is present, which could oxidize EtG,
and make its concentration in hair lower. These findings were already shown in previous research 19,27,29. Several studies showed that the use of conditioners and hair sprays, gels, waxes and oils had
no effect for the measured concentration of EtG 27,28, so this experiment confirms this.
Lastly, a retrospective timeline was created by dividing a hair sample of an individual reported as
excessive alcohol user, drinking more than 4 days in a row during weekends, and almost every day on
vacations. The hair sample was cut into pieces of 1cm, and each cm was analysed individually, to
show the ability of the method for the creation of a retrospective timeline of alcohol use. The results
are shown in Figure 30.

45
Figure 30: Retrospective timeline of a regular alcohol user.
As can be seen, the hair samples 5,6 and 10 cm from the scalp show a really high alcohol content,
some above the chronic excessive alcohol consumption border of 30 pg/mg. Note that the smaller
corrected areas, so the smaller alcohol contents, might vary since these values are below the
calculated CCα and CCβ, but chronic excessive alcohol consumption could be detected with this
method. The hair was sampled in the beginning of October, and the individual was on vacation
during April and May, which is 5-6 months before sampling, in the cms of hair with the really high
alcohol content. Also, 10 months before sampling, it was December/January, so the high alcohol
content in this cm of hair could be due to partying during Christmas. To conclude, the retrospective
timeline is quite accurate when it comes to drinking behaviour.

46
4. Initial method development for the analysis of FAEEs in hair with
GC-MS/MS
4.1 Introduction Fatty acid ethyl esters are formed via FAEE synthase, as shown in Scheme 3. Since FAEE synthase is
present in organs that are damaged by alcohol consumption, the pancreas and the liver 47, signals of
FAEEs in human hair are a good indication for alcohol (ab-)use. Often the analysis of FAEEs is used in
combination with EtG to detect chronic excessive alcohol consumption in human hair. All esters are
stable and can be found throughout the body, but the esters most likely to be formed are ethyl
palmitate and ethyl oleate 48. This is the reason why the SoHT reconsidered their consensus in 2016,
instead of using all four FAEEs for the detection of chronic excessive alcohol consumption, only ethyl
palmitate,which is most present inside the body and gives the largest signal in a GC-MS/MS
chromatogram, is used for detection 52.
Scheme 9: Beta-cleavage of ethyl palmitate, leading to transition m/z 101.
FAEEs need sample pre-treatment before performing GC-MS/MS to clean-up the sample and to
remove the unwanted compounds. This is usually done in the forms of SPE or HS-SPME. In this
Chapter, the pre-treatment of a hair sample containing ethyl palmitate by SPE is tested, a method
already performed in literature is used 89. In this method, the molecular ion of ethyl palmitate, 284
m/z, is used as quantifier, the transition 101 m/z will be used as quantifier, since it is the β-cleavage
of ethyl palmitate, as shown in Scheme 9.
4.2 Materials and methods 4.2.1 Hair samples
The analysis of ethyl palmitate in hair was performed on blank hair samples provided by children or
abstaining adults.
4.2.2 Chemicals and reagents
Ethyl palmitate and DMSO were purchased from Sigma-Aldrich (Germany). Isolute NH2 (aminopropyl)
cartridges were purchased from Biotage (Sweden). Methanol, n-hexane and dichloromethane were
purchased from Actu-All chemicals (Netherlands).
4.2.3 Sample preparation and clean-up procedure for GC-MS/MS
An ethyl palmitate solution of 10.000 pg/µL (10 ppm) was prepared in methanol. Blank hair samples
were spiked with 50 µL of this solution and evaporated to air for approximately 30 min. To each
spiked hair sample, 4 mL of hexane and 0.5 mL of dimethyl sulfoxide were added and overnight
incubation followed. The incubation layer of hexane was extracted with Isolute NH2 (aminopropyl)
SPE cartridges, that were initially conditioned with 3 mL dichloromethane, followed by 3 mL hexane.
After elution of the incubation solvent, the analytes were extracted by 3 mL of hexane and,
subsequently, 3 mL dichloromethane, and the resulting extract was evaporated under a nitrogen

47
stream at 50 °C. The residue was dissolved in 50 µL of hexane and 2 µL were injected into the GC-
MS/MS.
4.2.4 Instrumentation for GC-MS/MS
A Varian CP-3800 gas chromatography – 1200L Quadrupole MS/MS system operating in EI mode was
used for analysis. Compounds were separated on a fused silica column (Agilent, DB-35MS) with a
(35%-phenyl)-methylpolysiloxane stationary phase (30 m length x 0.25 mm I.D. x 0.25 µm film
thickness). The carrier gas was helium with a constant flow of 1 mL/min. The injector temperature
was 300 °C, the initial column oven temperature of 100 °C was kept for 0.5 min, then increased to
200 °C at a rate of 12 °C/min, to 300 °C at 8 °C/min, and held at 300 °C for 3 min. Identification was
performed in SIM mode with the following transitions for ethyl palmitate: 101 and 284 m/z
(quantifier was 101).
4.2.5 Data processing
Data was processed using MS Workstation V6.9.2.
4.3 Results The method used was a method from literature 89, to test if ethyl palmitate is detectable with GC-
MS/MS. As can be seen in Figure 31, ethyl palmitate does show a signal in GC-MS/MS. In Figure 31A,
the full chromatogram is shown, recorded for the transitions 101 and 284 m/z. Since m/z 101 was
used as quantifier, in Figure 31B the chromatogram for this transition is shown. As can be seen, the
largest peak in the chromatogram, eluting at 12 min., originates from ethyl palmitate.
Figure 31: Chromatograms of ethyl palmitate. A: full chromatogram, and B: chromatogram from transition m/z 101. Chromatograms were recorded with a Varian mass spectrometer.
This result is a promising indication for the method tried to actually work, but the intensity of the
peaks in the chromatogram is still quite low. Due to time limitations, no further investigation was
performed.

48
5. Recommendations for future research Since there were still some parts in this research that did not work according to plan, in this Chapter
some recommendations for future research are given.
5.1 Sensitivity LC-MS/MS The main problem in this project was the fact that the sensitivity was quite low. By switching from
TQ-S to QTRAP-6500 mass spectrometer, the sensitivity already got 2-3 times higher and we were at
least able to detect chronic excessive alcohol consumption. Measuring with a more sensitive machine
could thus in the future be promising to make sure the sensitivity is another 3-4 times higher, in
order to be able to detect the cut-off value of 7 pg/mg.
Another possibility to make the sensitivity of the method higher, is to change some steps in the
analysis. The sample pre-treatment was optimized in this research, but only with the resources
available in the lab. SPE cartridges especially designed for EtG are available, which are UCT Clean
Screen ETG SPE cartridges. They are especially designed for detection in urine, but it might work for
the detection in hair as well, so using these cartridges in the sample pre-treatment could work in the
future.
Until now, the method was tested with a C8 column for LC-MS/MS, with a high acetonitrile amount
in the mobile phase, to overcome interfering signals and to make sure the EtG eluted a bit later in the
chromatogram, which gave nice results for EtG. HILIC columns could also be used and solve the same
difficulties as the C8-column did. An Acquity BEH HILIC column was tried during the initial method
development, but did not change the sensitivity of the method. Using a different HILIC column could
also be tested in future research, or the addition of post-column acetonitrile for solving the same
difficulties.
5.2 Derivatization of EtG for GC-MS/MS and sensitivity The derivatization process of EtG was a difficult step in this research. Several derivatization agents
such as BSTFA, PFPA and HFBA were tested, but none of them showed a reasonable result. All
solvents need to be completely clean of water during the derivatization, otherwise the derivatization
agents will hydrolyse and no derivatization takes place. In this research, only isooctane and acetone
were completely free of water due to an addition of salt to the solvent, ethyl acetate, methanol and
hexane were not. In future experiments, the derivatization processes could be tried again, but with
different solvents that are clear of water.
Derivatization with PBA did show a result in the chromatogram, but the intensity was extremely low.
During derivatization with PBA, also a PBA complex is formed by a reaction of PBA with itself. The
peak in the chromatogram for this complex was way higher than the peak originating from EtG-PBA,
so it could be that all PBA already reacted with itself, so no PBA was left to derivatize EtG. In future
experiments it could be tried to add more PBA to the EtG during the derivatization, just to make sure
there is still some PBA left for derivatization of EtG.
5.3 Sensitivity FAEEs with GC-MS/MS The signal of ethyl palmitate in the GC-MS/MS spectrum was low, so the use of another machine
could be a solution. Since the Varian CP-3800 gas chromatography – 1200L Quadrupole MS/MS
system is an old machine with insufficient sensitivity.
Another possibility to increase the signal is changing the clean-up method. In the analysis in Chapter
4, SPE is used. Another possible clean-up method is HS-SPME. HS-SPME is a technique based on the
fact that the analytes present in the head space, the gas phase that lies upon the sample, could be
absorbed by a fibre 1. This fibre consists of a very thin polymeric film, which is attached to a fused

49
silica core. This polymeric film is than exposed to the head space of the sample 1. Steps in the analysis
by HS-SPME are shown in Figure 32.
Figure 32: Steps in the analysis by HS-SPME. Reproduced from Ref. 90
If analytes used are volatile enough at the temperature at which the extraction is performed, HS-
SPME is an ideal technique since it is non-destructive, and samples at different experimental
conditions could be evaluated. Another advantage is the fact that HS-SPME makes sure the extract is
protected from impurities, since the vial is closed at all-time 90. Especially this last feature is useful,
since the solutions of ethyl palmitate are volatile, and could evaporate quickly.
5.4 Combining sample pre-treatment steps In the goal it was stated that it would be nice of the sample pre-treatment steps for the two ethanol
metabolites could be combined, in order to make a more sufficient overall method for the detection
of both metabolites.
It would be nice to perform the analysis of both EtG and FAEEs with the same technique. The
problem in this case is the fact that FAEEs are usually determined with GC-MS/MS, since they are
highly volatile which could be a problem in LC-MS/MS. EtG is usually determined with LC-MS/MS,
since the derivatization of EtG could be a problem, as experienced in this project.
However, even if two analysis techniques are used, the sample pre-treatment steps could be
combined. The optimized method for EtG includes ultrasonication and overnight incubation, clean-up
with SPE, evaporation and reconstitution. The sample pre-treatment of FAEEs used in Chapter 4 also
includes overnight incubation, clean-up with SPE, evaporation and reconstitution. In future research,
the sample pre-treatment of the two ethanol metabolites could thus be performed at te same time,
which makes the method more sufficient. Also, if the sample pre-treatment for FAEEs is changed
with HS-SPME included, the samples still need overnight incubation and clean-up, but this time with
HS-SPME, so this does not change much in the sample pre-treatment steps and a combination of the
two methods is still possible.

50
6. General conclusions To conclude, a method was developed and optimized for the detection of EtG in human hair with LC-
MS/MS. The fully optimized method was as follows; 50 mg of hair was finely cut, 2 mL of milli-Q
water as extraction solvent was added, 50 μL of a 10 ppm solution of the internal standard was
added. The samples were placed in an ultrasonic bath at 50 °C for 4 hours, followed by overnight
incubation. The next day, the samples were cleaned-up by SPE, previously conditioned with 2 mL of
methanol and 2 mL of Milli-Q water, samples were washed with acetonitrile and eluted with 2 mL
methanol/2% formic acid solution. Finally, the extract was evaporated under a nitrogen stream at 40
degrees and reconstituted in 200μL of mobile phase A for LC-MS/MS.
The method was fully validated according to a permitted level of 100 pg/mg. The recovery and
trueness/accuracy are nicely within the criteria set by RIKILT. The relative standard deviation of the
repeatability for 0.5 times the permitted level (50 pg/mg) is slightly too high, but since the relative
standard deviation of the within-lab reproducibility for 0.5 times the permitted level is within the
criteria, and all other values for 0.5, 1.0 and 1.5 times the permitted level are within, this was
accepted. The only thing that did not match the criteria, is the linearity. The values for all three
validation days were slightly below the criteria of 0.990. In all MMS series, one point was way above
the calibration line, and when these points were removed, the measured value was above the
criteria of 0.990. These three points were therefore considered outliers, and the linearity was also
accepted.
The method was further tested on reference hair samples of 100 and 200 pg/mg, and the measured
concentrations were within the confidence interval given by the company, so it can be stated that
the method works accurately.
Also, some real hair samples were tested, and the method was able to detect chronic excessive
alcohol consumption. A retrospective timeline was obtained to show the ability of the method for an
historical overview of alcohol (ab-)use. The sensitivity of the method was unfortunately too low for
the detection of regular alcohol consumption, the limit of detection for the method is around 30
pg/mg, which is the cut-off value of the SoHT for chronic excessive alcohol consumption.
It was also tried to develop a GC-MS/MS method for the detection of both EtG as well as the FAEE
ethyl palmitate. Derivatization of EtG was quite difficult, since BSTFA, PFPA as well as HFBA did not
give any signals for a derivatized EtG in GC-MS/MS. This could be due to the fact that all solvents
used need to be completely clean of water, otherwise the derivatization agents will hydrolyse and no
derivatization takes place. Since for some of the solvents used, no precaution steps were taken, it
could be that the sample was not completely dry.
Derivatization with PBA did work and gave signals in GC-MS/MS at m/z of 308, which is the mass of
the derivatized EtG-PBA. However, the largest signal in the spectrum originated from m/z 311, which
is a PBA complex formed by a reaction of PBA with itself. This signal was much larger than the signal
originating from EtG-PBA, so it is possible that PBA reacts quickly with itself, leaving less PBA for
derivatization of EtG.
Ethyl palmitate was also analysed with GC-MS/MS. The sample pre-treatment steps tried were quite
similar to the optimized method for EtG with LC-MS/MS, which is a promising feature for combining
these steps in future research, in order to make the method as sufficient as possible. A GC-MS/MS
signal was visible for m/z 101, which originates from beta cleavage of ethyl palmitate. Also in this
case the signal was quite low, so further research in the future is necessary before it can be used as
analysis method.

51
Acknowledgements Here, I would like to thank Andries Koops for the opportunity to work on my project in his research
group at RIKILT. Also, very special thanks to Wilco Duvivier, Saskia Sterk and Marco Blokland for their
daily supervision and Wim Kok for helping me over the course of this project. Last but not least, a
thank you note for the entire BU Veterinary Drugs and all other employees at RIKILT for all sociability
and helping me out with anything over the past 9 months.

52
References
1. Kintz, P.; Salomone, A.; Vincenti, M., ‘Hair analysis in clinical and forensic toxicology’, Academic Press (Elsevier),
Oxford, UK, 2015.
2. Kintz, P., ‘Value of the concept of minimal detectable dosage in human hair’, Forensic Sci. Int., 2012, 218, 28-30.
3. Buffoli, B.; Rinaldi, F.; Labanca, M.; Sorbellini, E.; Trink, A.; Guanziroli, E.; Rezzani, R.; Rodella, L.F., ‘The human
hair: from anatomy to physiology’, Int. J. Dermatol., 2014, 53 (3), 331-341.
4. Kelly, R.C.; Mieczkowski, T.; Sweeney, S.A., ‘Hair analysis for drugs of abuse. Hair colour and race differentials or
systematic differences in drug preferences?’, Forensic Sci. Int., 2000, 107, 63-86.
5. Khalique, A.; Kim, K.S.; Lee, G.J., ‘Investigation of aging effects in human hair using atomic force microscopy’, Skin
Res. Technol., 2011, 17, 63-68.
6. Gurden, S.P.; Monteiro, V.F.; Longo, E., ‘Quantitative analysis and classification of AFM images of human hair’, J.
Microsc., 2004, 215, 13-23.
7. Randall, V.A.; Botchkareva, N.V., ‘The biology of hair growth’, In: Ahluwalia, G.S., ‘Cosmetic Application of Laser
and Light-Based System’, William Andrew (Elsevier), Norwich (NY), USA, 2009, p. 3-35.
8. Swift, J.A., ‘Human hair cutticle: biologically conspired to the owners advantage’, J. Cosmet. Sci., 1999, 50, 23-47.
9. Wolfram, L.J., ‘Human hair: a unique physicochemical composite’, J. Am. Acad. Dermatol., 2003, 48, 106-114.
10. Pragst, F.; Balikova, M.A., ‘State of the art in hair analysis for detection of drug and alcohol abuse’, Clin. Chim.
Acta, 2006, 370, 17-49.
11. Rogers, G.E., ‘Electron microscope observations on the glassy layer of the hair follicle’, Exp. Cell Res., 1957, 13,
521-528.
12. Peus, D.; Pittelkow, M.R., ‘Growth factors in hair organ development and the hair growth cycle’, Dermatol. Clin.,
1996, 14, 559-572.
13. Blume-Peytavi, U.; Vogt, A., ‘Human hair follicle: reservoir function and selective targeting’, Br. J. Dermatol., 2011,
165, 13-17.
14. Wosicka, H.; Cal, K., ‘Targeting to the hair follicles: current status and potential’, J. Dermatol. Sci., 2010, 57, 83-89.
15. Paus, R., ‘Principles of hair cycle control’, J. Dermatol., 1998, 25, 793-802.
16. Bull, J.J.; Pelengaris, S.; Hendrix, S., ‘Ectopic expression of c-Myc in the skin affects the hair growth cycle and
causes an enlargement of the sebaceous gland’, Br. J. Dermatol., 2005, 152, 1125-1133.
17. Kloepper, J.E.; Sugawara, K.; Al-Nuaimi, Y., ‘Methods in hair research: how to objectively distinguish between
anagen and catagen in human hair follicle organ culture’, Exp. Dermatol., 2010, 19, 305-312.
18. Cooper, G.A.A.; Kronstrand, R.; Kintz, P., ‘Society of Hair Testing guidelines for drug testing in hair’, Forensic Sci.
Int., 2012, 218, 20-24.
19. Kintz, P., ‘Segmental hair analysis can demonstrate external contamination in post-mortem cases’, Forensic Sci.
Int., 2012, 215, 73-76.
20. Society of Hair Testing, ‘Statement of the society of hair testing concerning the examination of drugs in human
hair’, Forensic Sci. Int., 1997, 84, 3-6.
21. Smith, H.; Forshufvud, S.; Wassen, A., ’Distribution of arsenic in Napoleon’s hair’, Nature, 1962, 194, 725-726.
22. Springfield, A.C.; Cartmell, L.W.; Aufderheide, A.C.; Buikstra, J.; Ho, J., ‘Cocaine and metabolites in the hair of
ancient Peruvian coca leaf chewers’, Forensic Sci. Int., 1993, 63, 269-275.
23. Chatterton, C.; Kintz, P., ‘Hair analysis to demonstrate administration of amitriptyline, temazepam, tramadol and
dihydrocodeine to a child in a case of kidnap and false imprisonment’, J. Forensic Legal Med., 2014, 23, 26-31.
24. Pötsch, L.; Moeller, M.R., ‘On pathways for small molecules into and out of human hair fibers’, J. Forensic Sci.,
1996, 41, 121-125.
25. Skopp, G.; Pötsch, L.; Mauden, M., ‘Stability of cannabinoids in hair exposed to sunlight’, Clin. Chem., 2000, 46,
1846-1848.
26. Arndt, T.; Schröfel, S.; Stemmerich, K., ‘Ethyl glucuronide identified in commercial hair tonics, Forensic Sci. Int.,
2013, 231, 195-198.
27. Favretto, D.; Tucci, M.; Monaldi, A.; Ferrara, S.D.; Miolo, G., ‘A study on photodegradation of methadone, EDDP,
and other drugs of abuse in hair exposed to controlled UVB radiation’, Drug Test Anal., 2014, 6, 78-84.
28. Röhrich, J.; Zorntlein, S.; Pötsch, L.; Skopp, G.; Becker, J., ‘Effect of the shampoo Ultra Clean on drug
concentrations in human hair’, Int. J. Legal Med., 2000, 113, 102-106.
29. Skopp, G.; Pötsch, L.; Moeller, M.R., ‘On cosmetically treated hair – aspects and pitfalls of interpretation’, Forensic
Sci. Int., 1997, 84, 43-52.
30. Dawber, R., ‘Hair: its structure and response to cosmetic preparations’, Clin. Dermatol., 1996, 14, 105-112.
31. Jurado, C.; Kintz, P.; Menedez, M., Repetto, M., ‘Influence of cosmetic treatment of hair on drug testing’, Int. J.
Legal Med., 1997, 110, 159-163.

53
32. Ryder, M.L., ‘Nutritional factors influencing hair and wool growth’, In: Montagna, W.; Ellis, R.A., ‘The biology of
hair growth’, Academic Press (Elsevier), New York, USA, 1958, p. 305-334.
33. Harkey, M.R., ‘Anatomy and physiology of hair’, Forensic Sci. Int., 1993, 63, 9-18.
34. Chittleborough, G.; Steel, B.J., ‘Is human hair a dosimeter for endogenous zinc and other trace elements?’, Sci.
Total Environ., 1980, 15, 25-35.
35. Kronstrand, R.; Scott, K., ‘Drug incorporation into hair’, In: Kintz, P., ‘Analytical and practical aspects of drugs
testing in hair’, CRC Press, Boca Raton (FL), USA, 2007, p. 1-23.
36. Baumgartner, W.A.; Hill, V.A.; Bland, W.H., ‘Hair analysis for drugs of abuse’, J.Forensic Sci., 1993, 34, 1433-1453.
37. Pötsch, L.; Skopp, G.; Moeller, M.R., ‘Biochemical approach on the conservation of drug molecules during hair
formation’, Forensic Sci. Int., 1997, 84, 25-35.
38. Kikura, R.; Nakahara, Y.; Mieczkowski, T.; Tagliaro, F., ‘Hair analysis for drug abuse XV. Disposition of 3,4-
methylenedioxy-methamphetamine (MDMA) and its related compounds into rat hair and application to hair
analysis for MDMA abuse’, Forensic Sci. Int., 1997, 84, 165-177.
39. Pötsch, L., ‘A discourse on human hair fibres and reflections on the conservation of drug molecules’, Int. J. Legal
Med., 1996, 108, 285-293.
40. Pragst, F.; Spiegel, K.; Sporkert, F.; Bohnenkamp, M., ‘Are there possibilities for the detection of chronically
elevated alcohol consumption by hair analysis? A report about the state of investigation’, Forensic Sci. Int., 2000,
107, 201-223.
41. Kamil, I.A.; Smith, J.N.; Williams, R.T., ‘A new aspect of ethanol metabolism: isolation of ethyl glucuronide’,
Biochem., 1952, 51, 32-33.
42. Skopp, G.; Schmitt, G.; Pötsch, L.; Drönner, P.; Aderjan, R.; Mattern, R., ‘Ethyl glucuronide in human hair’, Alcohol
Alcoholism, 2000, 35(3), 283-285.
43. Cabarcos, P.; Álvarez, I.; Taberno, M.J.; Bermejo, A.M., ’Determination of direct alcohol markers: a review’, Anal.
Bioanal. Chem., 2015, 407, 4907-4925.
44. Tarcomnicu, I.; Van Nuijs, A.; Aerts, K.; De Doncher, M.; Covaci, A.; Neels, H., ‘Ethyl glucuronide determination in
meconium and hair by hydrophilic interaction liquid chroamtography-tandem mass spectrometry’, Forensic Sci.
Int., 2010, 196, 121-127.
45. Foti, R.S.; Fisher, M.B., ‘Assessment of UDP-glucuronosyltransferase catalyzed formation of ethyl glucuronide in
human liver microsomes and recombinant UGTs’, Forensic Sci. Int., 2005, 153, 109-116.
46. Kharbouche, H.; Steiner, N.; Morelato, M.; Staub, C.; Boutrel, B.; Mangin, P.; Sporkert, F.; Augsburger, M.,
‘Influence of ethanol dose and pigmentation on the incorporation of ethyl glucuronide into rat hair’, Alcohol,
2010, 44(6), 507-514.
47. Lapasota, E.A.; lange, L.G., ‘Presence of nonoxidative ethanol metabolism in human organs commonly damaged
by ethanol abuse’, Science, 1986, 231, 497-499.
48. Dan, L.; Lapasota, M., ‘Ethyl palmitate and ethyl oleate are the predominant fatty acid ethyl esters in the blood
after ethanol ingestion and their synthesis is differentially influenced by the extracellular concentrations of their
corresponding fatty acids’, Alcohol Clin. Exp. Res., 1997, 21, 286-292.
49. Cabarcos, P.; Álvarez, I.; Bermejo, A.M.; Tabernero, M.J.; López, P.; Fernández, P., ‘Analysis of fatty acid ethyl
esters in hair by headspace solid-phase microextraction and gas chromatography-mass spectrometry’, Anal. Lett.,
2009, 42, 2962-2977.
50. Brodie, B.B., ‘Pathways of drug metabolism’, J. Pharm. Pharmacol., 1956, 8, 1-17.
51. Pragst, F.; Auwärter, V.; Sporkert, F.; Spiegel, K., ‘Analysis of fatty acid ethyl esters in hair as possible markers of
chronically elevated alcohol consumption by headspace solid phase microextraction and gas chromatography-
mass spectrometry’, Forensic Sci. Int., 2001, 121, 76-88.
52. Society of Hair Testing, ‘Consensus for the use of alcohol markers in hair for assessment of both abstinence and
chronic excessive alcohol consumption’, 2016.
53. Paul, R.; Tsanaclis, L.; Kingston, R.; Berry, A.; Guwy, A., ‘Simultaneous determination of GHB and EtG in hair using
GC-MS/MS’, Drug Test. Analysis, 2011, 3, 201-205.
54. Concheiro, M.; Cruz, A.; Mon, M.; de Castro, A.; Quintela, O.; Lorenzo, A.; López-Rivadulla, M., ‘Ethyl glucuronide
determination in urine and hair from alcohol withdrawal patients’, J. Anal. Toxicol., 2009, 33, 155-161.
55. Auwarter, V.; Sporkert, F.; Hartwig, S.; Pragst, F.; Vater, H.; Diefenbacher, A., ’Fatty acid ethyl esters in hair as
markers of alcohol consumption. Segmental hair analysis of alcoholics, social drinkers, and teetotalers’, Clin.
Chem., 2001, 47(12), 2114-2123.
56. Albermann, M.E.; Musshoff, E.; Madea, B., ‘Comparison of ethyl glucuronide (EtG) and fatty acid ethyl esters
(FAEEs) concentrations in hair for testing abstinence’, Anal. Bioanal. Chem., 2011, 400, 175-181.
57. Gaillard, Y.; Pepin, G., ‘Screening and identification of drugs in human hair by high-performance liquid
chromatography – photodiode-array UV detection and gas chromatography – mass spectrometry after solid-
phase extraction. A powerful tool in forensic medicine’, J. Chromatogr. A, 2002, 958, 231-238.

54
58. Pragst, F.; Balikova, M.A.,’State of the art in hair analysis for detection of drug and alcohol abuse’, Clin. Chim.
Acta, 2006, 370, 17-49.
59. De Hoffman, E.; Stroobant, V., ‘Mass spectrometry – principles and applications’, John Wiley & Sons, West Sussex,
UK, 2007.
60. Kicman, A.T.; Parkin, M.C.; Iles, R.K., ’An introduction to mass spectrometry based proteomics – detection and
characterization of gonadotropins and related molecules’, Moll. Cell. Endocrinol., 2007, 260-262, 212-227.
61. https://www.biologie.hu-berlin.de/de/gruppenseiten/oekologie/meth/massspec/mass_sp
Visited July 7, 2017.
62. Uhl, M.,’Determination of drugs in hair using GC-MS/MS’, Forensic Sci. Int., 1997, 84, 281-294.
63. Sachs, H.; Uhl, M.; Hege-Scheuing, G.; Schneider, E., ‘Analysis of fentanyl and sufentanil in hair by GC-MS/MS’, Int.
J. Leg. Med., 1996, 109, 213-215.
64. Pichini, S.; Pacifici, R.; Altieri, I.; Pellegrini, M.; Zuccaro, P., ‘Determination of opiates and cocaine in hair as
trimethylsilyl derivatives using gas chromatography – tandem mass spectrometry’, J. Anal. Toxicol., 1999, 23, 343-
348.
65. Uhl, M., ‘Tandem mass spectrometry: a helpful tool in hair analysis for the forensic expert’, Forensic. Sci. Int.,
2000, 107, 169-179.
66. Agius, R.; Nadulski, T.; Kahl, H.G.; Schräder, J.; Dufaux, B.; Yegles, M., ‘Validation of headspace solid-phase
microextraction-GC-MS/MS for the determination of ethyl glucuronide in hair according to forensic guidelines’,
Forensic Sci. Int., 2010, 196, 3-9.
67. Zaikin, V.G.; Halket, J.M., ‘Derivatization in mass spectrometry – 2. Acylation’, Eur. J. Mass Spectrum., 2003, 9(5),
421-434.
68. Blau, K.; Halket, J., ‘Handbook of derivatives for chromatography’, John Wiley and Sons, Chichester, UK, 1997.
69. Scott, R.P.W., ‘Gas chromatography. Book 2 Chrom-Ed Book Series.’ The Reese-Scott Partnership, Chesire, UK,
2003.
70. Orata, F., ‘Derivatization reactions and reagents for gas chromatography analysis’, In: Advanced gas
chromatography – progress in agricultural, biomedical and industrial applications, Intech, Croatia, 2012, 83-108.
71. Schauer, J.J.; Kleeman, M.J.; Cass, G.R.; Simoneit, B.R.T., ‘Measurement of emissions from air pollution sources’,
Environ. Sc. Technol., 2002, 36, 1169-1180.
72. Lin, D.L.; Wang, S.M.; Wu, C.H.; Chen, B.G.; Liu, R.H., ‘Chemical derivatization for the analysis of drugs by GC-MS –
a conceptual review’, J. Food Drug Anal., 2008, 16(1), 1.
73. Negrusz, A.; Moore, C.M.; Hinkel, K.B., ‘Deposition of 7-aminoflunitrazepam and flunitrazepam in hair after a
single dose of Rohypnol’, J. Forensic Sci., 2001, 46, 1143-1151.
74. Yegles, M.; Labarthe, A.; Auwarter, V., ‘Comparison of ethyl glucuronide and fatty acid ethyl ester concentrations
in hair of alcoholics, social drinkers and teetotallers’ Forensic Sci. Int., 2004, 145, 167-173.
75. Kelly, T.; Doble, P.; Dawson, M., ‘Chiral analysis of methadone and its major metabolites (EDDP and EMDP) by
liquid chromatography – mass spectrometry’, J. Chromatogr. B, 2005, 814, 315-323.
76. Muller, C.; Vogt, A.; Goerke, R.; Kordon, A.; Weinmann, W., ‘Identification of selected psychopharmaceuticals and
their metabolites in hair by LC/ESI-CID/MS and LC-MS/MS’, Forensic Sci. Int., 2000, 113, 415-421.
77. Dumestre-Toulet, V.; Cirimele, V.; Gromb, S., ’Last performance with VIAGRA: post mortem identification of
sildenafil and its metabolites in biological specimens including hair sample’, Forensic Sci. Int., 2002, 126, 71-76.
78. Janda, I.; Weinmann, W.; Kuehnle, T.; Lahode, M.; Alt, A., ‘Determination of ethyl glucuronide in human hair by
SPE and LC-MS/MS’, Forensic Sci. Int., 2002, 128, 59-65.
79. Tarcomnicu, I.; van Nuijs, A.L.; Aerts, K.; de Doncker, M.; Covaci, A.; Neels, H., ‘Ethyl glucuronide determination in
meconium and hair by hydrophilic interaction liquid chromatography – tandem mass spectrometry’, Forensic Sci.
Int., 2010, 196, 121-127.
80. Williams, J.; Patsalos, P.N.; Wilson, J.F., ‘Hair analysis as a potential index of therapeutic compliance in the
treatment of epilepsy’, Forensic Sci. Int., 1997, 84, 113-122.
81. Shi, Y.; Shen, B.; Xiang, P.; Yan, H.; Shen, M., ‘Determination of ethyl glucuronide in hair samples of Chinese
people by protein precipitation (PPT) and large volume injection – gas chromatography – tandem mass
spectrometry (LVI-GC-MS/MS)’, J. Chromatogr. B Analyt. Technol. Biomed. Life Sci., 2010, 878, 3161-3166.
82. Imbert, L.; Gaulier, J.M.; Dulaurant, S.; Morichon, J.; Bevalot, F.; Izac, P., ‘Improved liquid chromatography –
tandem mass spectrometric method for the determination of ethyl glucuronide concentrations in hair:
Applications to forensic cases’, Int. J. Legal. Med., 2014, 128, 53-58.
83. Kintz, P.; Villain, M.; Vallet, E.; Etter, M.; Salquebre, G.; Cirimele, V., ‘Ethyl glucuronide: Unusual distribution
between head hair and pubic hair’, Forensic Sci. Int., 2008, 176, 87-90.
84. Cabarcos, P.; Hassan, H.M.; Tabernero, M.J.; Scott, K.S., ‘Analysis of ethyl glucuronide in hair samples by liquid
chromatography – electrospray ionization – mass spectrometry (LC-ESI-MS/MS), J. Appl. Toxicol., 2013, 33, 638-
643.

55
85. Suesse, S.; Pragst, F.; Mieczkowski, T.; Selavka, C.M.; Elian, A.; Sachs, H.; Hastedt, M.; Rothe, M.; Campbell,
J.,’Practical experiences in application of hair fatty acid ethyl esters and ethyl glucuronide for detection of chronic
alcohol abuse in forensic cases’, Forensic Sci. Int., 2012, 218, 82-91.
86. Berendsen, B.A.; Stolker, L.A.; Nielen, M.W.F., ‘The (un)certainty of selectivity in liquid chromatography tandem
mass spectrometry’, J. Am. Soc. Mass Spectrom., 2013, 24, 154-163.
87. Sigma-Aldrich Co., ‘Bulletin 910: Guide to solid phase extraction’, Supelco, USA, 1998.
88. Commission Decision 2002/657/EC, ‘Implementing council directive 96/23/EC concerning the performance of
analytical methods and the interpretation of results’, Official Journal of the European Communities, 2002.
89. Politi, L.; Mari, F.; Furlanetto, S.; Del Bravo, E.; Bertol, E., ‘Determination of fatty acid ethyl esters in hair by GC-MS
and application in a population of cocaine users’, J. Phar. Biomed. Anal., 2011, 54, 1192-1195.
90. Valduga, E.; Valerio, A.; Treichel, H.; Nascimento Filho, I.; Furigo Junior, A.; Di Luccio, M., ‘Head space solid phase
micro-extraction (HS-SPME) of volatile organic compounds produced by sporidiobolus salmonicolor’, Cienc.
Technol. Alliment., 2010, 30(4), 987-992.

56
Attachments

57
Attachment 1
Daughter ion scan of EtG
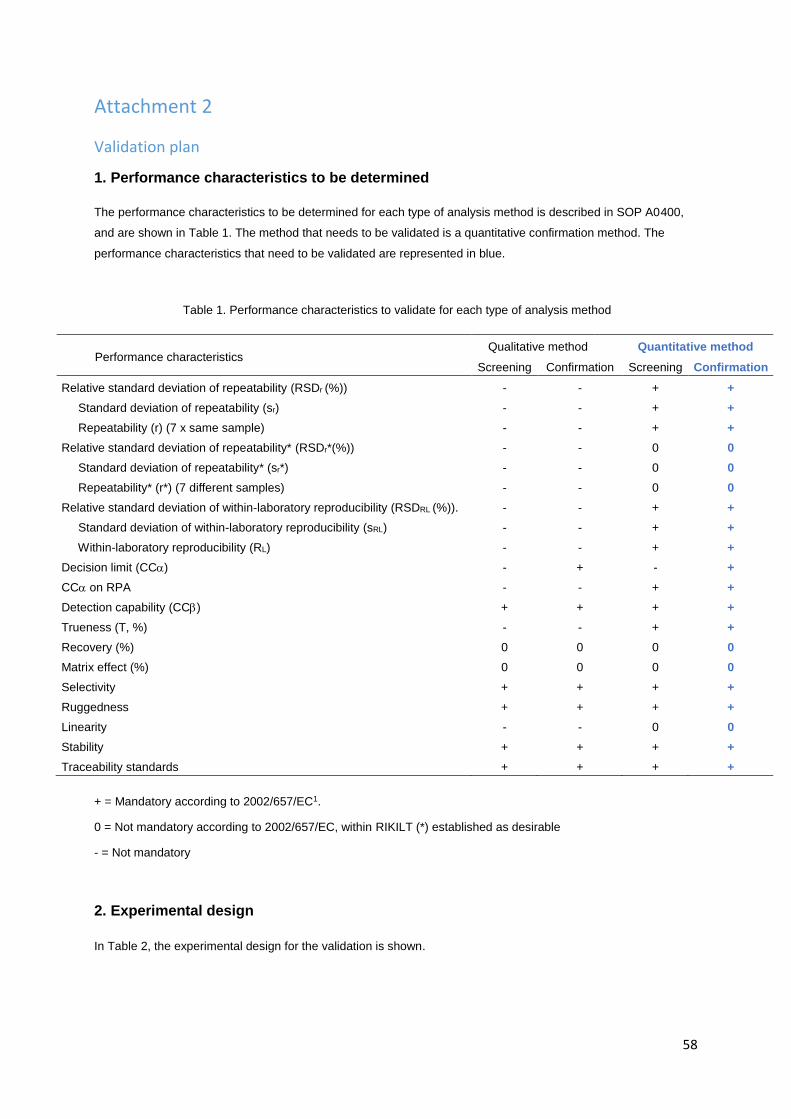
58
Attachment 2
Validation plan
1. Performance characteristics to be determined
The performance characteristics to be determined for each type of analysis method is described in SOP A0400,
and are shown in Table 1. The method that needs to be validated is a quantitative confirmation method. The
performance characteristics that need to be validated are represented in blue.
Table 1. Performance characteristics to validate for each type of analysis method
Performance characteristics Qualitative method Quantitative method
Screening Confirmation Screening Confirmation
Relative standard deviation of repeatability (RSDr (%)) - - + +
Standard deviation of repeatability (sr) - - + +
Repeatability (r) (7 x same sample) - - + +
Relative standard deviation of repeatability* (RSDr*(%)) - - 0 0
Standard deviation of repeatability* (sr*) - - 0 0
Repeatability* (r*) (7 different samples) - - 0 0
Relative standard deviation of within-laboratory reproducibility (RSDRL (%)). - - + +
Standard deviation of within-laboratory reproducibility (sRL) - - + +
Within-laboratory reproducibility (RL) - - + +
Decision limit (CC) - + - +
CC on RPA - - + +
Detection capability (CC) + + + +
Trueness (T, %) - - + +
Recovery (%) 0 0 0 0
Matrix effect (%) 0 0 0 0
Selectivity + + + +
Ruggedness + + + +
Linearity - - 0 0
Stability + + + +
Traceability standards + + + +
+ = Mandatory according to 2002/657/EC1.
0 = Not mandatory according to 2002/657/EC, within RIKILT (*) established as desirable
- = Not mandatory
2. Experimental design
In Table 2, the experimental design for the validation is shown.

59
Table 2. Experimental design for validation
Day Linearity
Recovery
(MMS and
MMRS)
Trueness
Within-laboratory reproducibility
Repeatability*
CCα CCß
Repeatability
Selectivity
Ruggedness
Total
1 7 (A) 7*3 (B-H) 7 (B) 7 (B-H) 42
2 7 (I) 7*3 (J-P) 7 (J) 7 (J-P) 42
3 7 (Q) 7*3 (R-X) 7 (R) 7 (R-X) 6 (Q) 48
Every day, 8 different hair samples will be used; 1 for linearity (MMS) and recovery (MMRS), 7 different ones for
trueness, repeatability*, within-laboratory reproducibility, selectivity, CCα, CCß and 7 hair samples, from the same
batch as used for linearity, for repeatability. In Attachment 1 the used hair samples are listed.
Linearity (MMS): 6 samples originating from the same batch, spiked at 0 – 0.25 – 0.5 – 1.0 – 2.0 – 3.0 * PL on 3
different days.
Recovery (MMRS): 1 sample originating from the batch used for linearity, spiked after clean-up at 1.0 * PL on 3
different days.
Trueness: 7 different hair samples spiked at 0.5 – 1.0 – 1.5 * PL on 3 different days.
Within-laboratory reproducibility: 7 different hair samples spiked at 0.5 – 1.0 – 1.5 * PL on 3 different days.
Repeatability*: 7 different hair samples spiked at 0.5 – 1.0 – 1.5 * PL on 3 different days.
Repeatability: 7 hair samples originating from the same batch, spiked 1.0 * PL on 3 different days.
CCα / CCß: 7 different hair samples spiked at 0.5 – 1.0 – 1.5 * PL at 3 different days.
Selectivity: 7 blank hair samples at 3 different days.
Matrix effect: Comparing MMRS and stock solution at the same level at 3 different days.
Stability: Stability is already tested by preliminary investigation.
Ruggedness: Three changes in the clean-up procedure will be compared in duplicate with the standard procedure.
3. Components to be validated
Ethyl glucuronide
4. Overview permitted level (PL)
For ethyl glucuronide in hair, no maximum residual limit (MRL) or reference point of action (RPA) is established by
authorities. Based on guidelines created by the Society of Hair Testing (SoHT), the cut-off value for ethyl
glucuronide in hair is 7 pg/mg of hair for repeated alcohol consumption, and 30 pg/mg for chronic excessive alcohol
consumption. Based on previous research, the permitted level (PL) was set at 100 µg/L (100 pg/mg with the used
procedure), since the cut-off values could not be reached due to sensitivity issues with the mass spectrometer.
Component Permitted level (µg/l)
Ethyl glucuronide 100 *
* In final extract (200 µL). 50 mg of human hair is used, so the concentration will be 100 pg/mg.

60
5. Choice sample material
Samples used are blank human hair samples of both children and abstaining adults. The used hair samples are
listed in Table 3.
Table 3. Blank hair samples
Hair Gender
(M/W)
Child (C) /
Adult (A)
Hair color
A W C Brown
B W A Brown
C W A Blonde
D W C Blonde
E M C Brown
F M C Brown
G W C Blonde
H W C Blonde
I W C Blonde
J W A Blonde
K W C Brown
L M A Brown
M W C Blonde
N W C Blonde
O W C Black
P W C Black
Q M C Blonde
R W C Brown
S M C Blonde
T M C Black
U M C Black
V W C Blonde
W W C Blonde
X M C Blonde
6. Criteria performance characteristics
6.1 Trueness (T) / Repeatability (r) / Within-laboratory reproducibility (RL)
Repeatability r = 2.8 * sr (sr = intra-day standard deviation)
Within-laboratory reproducibility RL = 2.8 * sRL (sRL = within-lab standard deviation)
Trueness T = mean measured level / permitted level * 100%
RSDT RSDT = RSDRL = sRL / mean measured level * 100%
RSDr RSDr = sr / mean measured level * 100%
Table 4. Design for performance characteristics
Level**
7x
Level***
7x
Day 1 0.5 – 1.0 – 1.5 * PL 1.0 * PL
Day 2 0.5 – 1.0 – 1.5 * PL 1.0 * PL
Day 3 0.5 – 1.0 – 1.5 * PL 1.0 * PL
** = 7 different hair samples
*** = 7 hair samples from the same batch

61
In Table 4, the experimental design for the performance characteristics trueness, repeatability and within-laboratory
reproducibility is shown. The values for the trueness, RSDr and RSDRL must follow some criteria during the
validation, these criteria are listed in Table 5.
Table 5. Criteria for trueness, RSDr and RSDRL as described in SOP F0052
Component PL Range Criteria
(µg/l) T (%) RSDr (%)* RSDRL (%)*
Ethyl glucuronide
50 80-110 14,7 22,0
100 100 80-110 14,7 22,0
150 80-110 14,7 22,0
*The RSDRL, and resulting from that the RSDr that is calculated based on Horwitz2, is very large at low
concentrations. Thompson et al.3 prescribed that, if concentrations are below 120 µg/kg, a maximum RSDRL of 22%
may be used. It follows that the maximum RSDr will be 14,7%.
The maximum RSDr of 14,7% applies for the repeatability of 7 hair samples originating from the same batch, spiked
at 1.0 * PL at 3 different days. The repeatability* (7 different hair samples, spiked at 0.5 – 1.0 – 1.5 * PL at 3 different
days) has the same maximum RSDr of 14,7%.
6.2 CCα / CCß
Seven different hair samples will be spiked at 0.5 – 1.0 – 1.5 * PL at 3 different days, and cleaned-up. CCα and CCβ
are calculated with the ResVal sheet according to ISO 118434 and 2002/657/EC.
6.3 Selectivity / Specificity
The selectivity will be determined according to the following procedure:
(i) A statistical approach according to Berendsen et al.5 (ii) The chromatograms of the blank hair samples must be free of interferences on the retention time of ethyl
glucuronide.
6.4 Ruggedness
Information about the ruggedness of the method was obtained during the development of the method. Different
temperature of the ultrasonic bath (40 – 50 0C) and the evaporation temperature (40 – 55 0C) were tested. These
variations did not influence the final outcome. Additional features were tested by spiking 6 hair samples from the
same batch at 1.0 * PL, and using the variations in the method as shown in Table 5 during the sample preparation
and clean-up steps.
Table 5. Variations in the method to test ruggedness
Level Procedure (SOP #) Variations
1.0 * PL Incubation 4h, 50 0C Incubation 5h, 50 0C
1.0 * PL Incubation 4h, 50 °C Incubation 5h, 50 0C
1.0 * PL 2 mL washing solvent 4 mL washing solvent
1.0 * PL 2 mL washing solvent 4 mL washing solvent
1.0 * PL Evaporation till dryness 10 min longer evaporating
1.0 * PL Evaporation till dryness 10 min longer evaporating

62
The mean value as well as the trueness are calculated for every condition. The trueness needs to follow the criteria
for the trueness, as they are determined for the normal trueness.
6.5 Stability
Preliminary investigation showed that the standard stays stable for at least 6 months at -20 0C. Hair samples are
expected to be stable for several months when stored at room temperature in the dark, based on segmented hair
analysis used in literature. Extracts can be kept at -20 0C for at least a week, without losing their stability.
6.6 Linearity (MMS)
To obtain the linearity, matrix-matched standards (MMS) are produced by spiking a hair sample once at every level
prior to the clean-up, according to Table 6.
Table 6. MMS levels and criteria for the validation
Level Criteria
Day 1-3 0 – 0.25 – 0.5 – 1.0 – 2.0 – 3.0 * PL R2 0.990
6.7 Recovery (MMRS)
To obtain the recovery of an analyte during the clean-up, matrix-matched recovery standards (MMRS) are produced
by spiking a hair sample after the clean-up. This sample will be compared to a sample spiked at the same level (1.0
* PL), but before clean-up. The recovery will be determined with a different hair sample on each validation day
(MMRS A, MMRS I and MMRS Q, all prepared on the validation day itself).
6.8 Matrix effect
The matrix effect will be obtained by comparing a sample with spike after clean-up (MMRS) with a standard solution
of the same level. The matrix effect will be obtained on every validation day, all days for a different batch.
6.9 Confirmation
According to the decisions made in 2002/657/EC, at least 95% of the samples must follow the criteria listed in this
validation plan. The mass spectrometric detection shall be carried out by employing the MS-technique multiple
reaction monitoring (MRM). The ratio of the chromatographic retention time of the analyte to that of the internal
standard, i.e. the relative retention time of the analyte, shall correspond to that of the calibration solution at a
tolerance of ± 2.5 % for LC.
The relative intensities of the detected ions, expressed as a percentage of the intensity of the most intense ion or
transition, shall correspond to those of the calibration standard, either from calibration standard solutions or from
spiked samples, at comparable concentrations, measured under the same conditions, within tolerances described
in Table 7.
Table 7. Maximum permitted tolerances for relative ion intensities using LC-MSn
Relative intensity (% of base peak) LC-MSn (relative)
> 50 % ± 20 %
> 20 % to 50 % ± 25 %
> 10 % to 20 % ± 30 %
≤ 10 % ± 50 %

63
6.10 Traceability
The traceability of the standard could be tested by checking if other suppliers also deliver the standard used in order
to compare them. Unfortunately, no second supplier of ethyl glucuronide was found.
Standard Supplier Second supplier
Ethyl glucuronide Sigma-Aldrich E-015 ?
The Society of Hair Testing (SoHT) organizes proficiency tests for ethyl glucuronide two times a year, so
participation in these tests is a possibility.
References
1. Commission decision 2002/657/EC, ’Implementing council directive 96/23/EC concerning the performance of analytical methods and the interpretations of results’, Official Journal of the European Communities, 2002.
2. Horwitz, W.; Kamps, L.R.; Boyer, K.W., ‘Quality assurance in the analysis of foods for trace constituents’ , J. Assoc. Off. Anal. Chem., 1980, 63, 1344-1354.
3. Thompson, M., ‘Recent trends in inter-laboratory precision at ppb and sub-ppb concentrations in relation to fitness for purpose criteria in proficiency testing’, Analyst, 2000, 125, 385-386.
4. ISO 11843, ‘Capability of detection – Part 1: Terms and definitions, Part 2: Methodology in the linear calibration case’, 1997.
5. Berendsen, B.J.A.; Stolker, A.A.M.; Nielen, M.W.F., ‘The (Un)Certainty of Selectivity in Liquid Chromatography Tandem Mass Spectrometry’, J. Am. Soc. Mass Spectrom., 2013, 24, 154-163.

64
Attachment 3
Certificates and instruction sheets of reference hair material of 100 and 200 pg/mg

65

66
Attachment 4
Personal data information for the analysis of hair samples on alcohol consumption
1. Name (optional): .................................................................................... #: .....
2. Gender:
□ Male
□ Female
3. Age: ..........
4. Hair colour:
□ Blond
□ Brown
□ Black
□ Red
□ Grey
5. Hair sample length:
□ 0-3 cm
□ 0-6 cm
□ > 6 cm
6. Hair sample originates from:
□ As close as possible to the scalp
□ End parts of the hair (cutting by hairdresser for instance)
7. Is the hair sample:
- Bleached □ yes □ no if the answer is yes, brand (optional): ................................
- Dyed □ yes □ no if the answer is yes, brand (optional): ................................
8. Use of hair cosmetics:
- Shampoo
□ yes, every day
□ yes, 3-4 times a week
□ yes, 1-2 times a week
□ yes, a couple of times a month/year
□ no
if the answer is yes, brand (optional): ............................
- Conditioner
□ yes, every day
□ yes, 3-4 times a week
□ yes, 1-2 times a week
□ yes, a couple of times a month/year
□ no
if the answer is yes, brand (optional): ............................

67
- Hairspray
□ yes, every day
□ yes, 3-4 times a week
□ yes, 1-2 times a week
□ yes, a couple of times a month/year
□ no
if the answer is yes, brand (optional): ............................
- Hair gel, wax or oil
□ yes, every day
□ yes, 3-4 times a week
□ yes, 1-2 times a week
□ yes, a couple of times a month/year
□ no
if the answer is yes, brand (optional): ............................
9. Over the last six months, how do you evaluate your drinking behaviour?
□ Teetotaller: No drinking of alcohol for at least three months before sampling.
□ Limited: No strict abstinence of alcohol use, but only drinking alcohol at for instance a birthday party
or a wedding, so really low doses at once and usage with a mean of maximum two alcoholic
consumptions a month.
□ Tolerable: Consuming alcohol up to 6 standard glasses a day (60g alcohol/day).
□ Excessive: Alcohol use equal or more than 6 standard glasses a day (60g alcohol/day).
10. What was the last time you consumed alcohol before hair sampling?
□ ............. days
□ ............. weeks
□ ............. months
□ I am a teetotaler for the period: ..........
11. How many glasses of alcohol do you consume in a week on a regular base?
□ 1-2
□ 3-6
□ 7-12
□ > 12
□ N/A
12. Have you been using other drugs in the last six months?
□ yes, namely ....................... , for ............ times
□ no

68
Attachment 5
Results personal data information
The results for questions 2-5 and 7-11 in the personal data information are summarized below in charts. All hair
was cut as close as possible to the scalp, every individuals used shampoo, and none of the individuals used any
other drug in the last six months, so this is not included in the charts.