determination of carbohydrate-deficient transferrin in human ...determination of...
TRANSCRIPT
Determination of Carbohydrate-Deficient
Transferrin in Human Serum by Capillary
Zone Electrophoresis
Inauguraldissertation
zur
Erlangung der Würde eines Doktors der Philosophie
vorgelegt der
Philosophisch-Naturwissenschaftlichen Fakultät
der Universität Basel
von
Christian Lanzaus Roggwil BE
Bern, 2004
Genehmigt von der Philosophisch-Naturwissenschaftlichen Fakultät
auf Antrag von
Prof. Dr. phil. nat. Wolfgang Thormann als Dissertationsleiter
Prof. Dr. pharm. Dr. med. Stephan Krähenbühl als Fakultätsverantwortlicher
Prof. Dr. med. Jürgen Drewe als Korreferent
Basel, 4. Mai 2004
Prof. Dr. phil. Marcel Tanner

Determination of Carbohydrate-Deficient Transferrin in Human Serum by Capillary Zone Electrophoresis
Christian Lanz Inauguraldissertation, University of Basel Page I
Dedicated to my parents
and my brother Matthias

Determination of Carbohydrate-Deficient Transferrin in Human Serum by Capillary Zone Electrophoresis
Christian Lanz Inauguraldissertation, University of Basel Page II
Acknowledgements
I would like to express my sincerest thanks to Prof. Dr. Wolfgang Thormann from theDepartment of Clinical Pharmacology of the University of Bern for the opportunity ofworking on this fascinating project in the field of instrumental analysis and clinicalchemistry. I do highly appreciate his support as well as the pleasant and friendlyatmosphere in his group. I also wish to address my thanks to all my fellow researchers. Ishould like to mention in particular my appreciation of Martina Kuhn's readiness toshare her vast knowledge in the field of clinical chemistry - an invaluable contributionto my work. Furthermore, I wish to thank Dr. Francine Prost, Regula Theurillat, JitkaCaslavska, Andrea Baldacci, Dr. Michael Breadmore, Dr. Anita B. Wey and AndreasSchmid for their cooperativeness and for the countless inspiring discussions; the nursesof the hepatology outpatient clinic for their assistance in obtaining blood samples;Ursula Wanzenried and Jeannette Schiess for their warm reception at the laboratory;Prof. Dr. Franco Tagliaro, Dr. Beat Burckhardt, Dr. Stefan Russmann and Dr. UlrichMarti for the numerous stimulating discussions. I too wish to express my gratitude toProf. Dr. Dr. Stephan Krähenbühl from the Institute of Clinical Pharmacology andToxicology of the University of Basel for supporting my effort to hand in thedissertation at the University of Basel as well as his constructive suggestions regardingthe project. Also, I would like to thank Prof. Dr. Jürgen Drewe for accepting to issue therecommendation letter to the faculty of Natural Sciences. Moreover, I wish to thank myparents for their assistance and helpfulness and my brother, Matthias, for the numerousstimulating conversations.This work was funded by grants from the Liver Foundation, Bern, Switzerland and theSwiss National Science Foundation.

Determination of Carbohydrate-Deficient Transferrin in Human Serum by Capillary Zone Electrophoresis
Christian Lanz Inauguraldissertation, University of Basel Page III
Table of Contents
Abbreviations V
A. Introduction 1A.1. Alcohol Abuse and Carbohydrate-Deficient Transferrin 1
A.2. Capillary Electrophoresis 2
A.3. Goals of the Dissertation 3
B. Results and Discussion 5
B.1. Evaluation and optimization of capillary zone electrophoresis withdifferent dynamic coatings for the determination of carbohydrate-deficienttransferrin in human serum (J. Chromatogr. A, 979 (2002) 43-57) 6
B.2. Capillary zone electrophoresis with a dynamic double coating foranalysis of carbohydrate-deficient transferrin in human serum: precisionperformance and pattern recognition (J. Chromatogr. A, 1013 (2003)131-147) 35
B.3. Capillary zone electrophoresis with a dynamic double coating foranalysis of carbohydrate-deficient transferrin in human serum: impact ofresolution between disialo- and trisialotransferrin on reference limits(Electrophoresis, 24 (2003) 4272-4281) 65
B.4. Improved capillary electrophoresis method for the determaintaion ofcarbohydrate-deficient transferrin in patient sera (Electrophoresis, 25 (2004)2309-2318) 89
C. Conclusions 112
D. References 114
E. Publications 116

Determination of Carbohydrate-Deficient Transferrin in Human Serum by Capillary Zone Electrophoresis
Christian Lanz Inauguraldissertation, University of Basel Page IV
Abbreviations
Alb AlbuminALT Alanine aminotransferaseAST Aspartate aminotransferaseCDT Carbohydrate-deficient transferrinCE Capillary electrophoresisCIEF Capillary isoelectric focusingCRP C-reactive proteinCZE Capillary zone electrophoresisDAB 1,4-diaminobutaneEDTA Ethylenediamine tetra-acetic acidEO ElectroosmosisEOF Electroosmotic flowGC Gas chromatographyGGT γ-glutamyltransferaseHCl Hydrochloric acidHPLC High-performance liquid chromatographyI.D. Inner diameterIFCC International federation of clinical chemistrymAU Milli absorbance unitMCV Erythrocyte mean corpuscular volumemeo Electroosmotic mobilityNaCl Sodium chlorideNaOH Sodium hydroxideO.D. Outer diameterpI Isoelectric pointpsi pound per square inchr Correlation coefficientROC Receiver operating characteristicRs ResolutionRSD Relative standard deviationSD Standard deviationSPE Serum protein electrophoresisTf TransferrinU UnitUV Ultraviolet
Determination of Carbohydrate-Deficient Transferrin in Human Serum by Capillary Zone Electrophoresis
Christian Lanz Inauguraldissertation, University of Basel Page 1
A. Introduction
A.1. Alcohol Abuse and Carbohydrate-Deficient Transferrin
Alcohol abuse and alcoholism are two widespread problems in practically allethnic groups with major medical, social, economic and legal consequences forindividuals and societies [1-4]. In 1996, 27 % of men and 14 % of women in GreatBritain were estimated to drink more than the recommended safe limits of 168 g and112 g pure ethanol per week for men and women, respectively. 7.5 % of men and 2.1 %of women were considered to be alcohol dependent [3]. In 1981, 9 % of the malepopulation and 0.5 % of the females in Switzerland between 15 and 74 years of agestated to drink more than 80 g pure ethanol daily [5]. In 1998, the overall costsassociated with alcohol consumption in Switzerland were estimated at 6.5 billion Swissfrancs [6,7]. Because of the known ability of alcoholics to hide their addiction for a longtime period and because of the importance of an early diagnosis of alcohol abuse, thesearch for endogenous markers for identifying high risk drinking has attracted greatinterest for many years. Most of the markers currently used, like alanineaminotransferase, aspartate aminotransferases, erythrocyte mean corpuscular volume,and γ-glutamyltransferase, suffer from two major drawbacks. They are either indicatorsof diseases in a particular organ without sufficient relation to a specific etiology, or theylack sensitivity of detecting alcohol abuse before organ damage has occurred [8]. Withthe description of carbohydrate-deficient transferrin (CDT) by Stibler et al. [9-11], apotent and specific endogenous marker for the detection of chronic excessive alcoholintake and relapse drinking was introduced.
CDT encompasses isoforms of the iron transporting glycoprotein transferrin (Tf,a protein with two iron binding sites) that lack one or both of the carbohydrate sidechains. The two N-glycans of the Tf molecule are composed of neutral sugars and zeroup to eight terminal, negatively charged sialic acid residues. Thus Tf isoforms differ incharge and pI values. CDT includes the Tf isoforms with zero (asialo-Tf), one(monosialo-Tf) and two (disialo-Tf) sialic acid residues. CDT is considered to be themost specific and reliable indicator of a chronic, excessive alcohol intake. However, thepathophysiologic and biochemical mechanisms responsible for the CDT elevation uponchronic alcohol intake are still not known [12-17].

Determination of Carbohydrate-Deficient Transferrin in Human Serum by Capillary Zone Electrophoresis
Christian Lanz Inauguraldissertation, University of Basel Page 2
Various analytical approaches have been developed for the qualitative andquantitative determination of CDT. Most of them are suffering from some majordrawbacks. Originally, Tf isoform analysis was performed by isoelectric focusing ongels and, due to the high resolution achieved, this principle remains the referencemethod for qualitative Tf investigations. However, quantitation of Tf isoforms by gelisoelectric focusing is difficult to perform and too complex for routine purposes [1,2, 8-10,17]. The most commonly used principle for the quantitative analysis of CDT,introduced by Stibler et al. [18,19], is based on the immunochemical determination ofCDT. No CDT specific antibodies are available, thus requiring the separation of CDTand non-CDT Tf isoforms. This separation, achieved by anion exchangechromatography on minicolumns, is crucial, difficult and thereby prone to analyticalinaccuracy [2,17,20]. Jeppsson et al. developed and optimized a high-performanceliquid chromatography (HPLC) method which enabled the separation and quantitationof the Tf isoforms. Time consuming sample preparation and low sample throughput arethe major disadvantages of this chromatographic approach [21-23].
A.2. Capillary Electrophoresis
Capillary electrophoresis (CE) is a relatively new separation technique comparedto the well known chromatographic procedures, such as HPLC and gas chromatography(GC). Over the past two decades, it has become a powerful analytical tool for theseparation of a large variety of compounds, including macromolecules like proteins. Incapillary zone electrophoresis (CZE), charged analytes are separated in the electric fieldaccording to differences in electrophoretic mobilities [24,25]. Because of its highresolution power, considerable interest has been directed to the analysis of peptides andproteins [26,27], including the analysis of serum proteins, urinary proteins andhemoglobins in clinical laboratories [24]. The main obstacle to overcome is the strongtendency of the highly charged polymers to adsorb to the inner surface of fused silicacapillaries, resulting in insufficient separation of the proteins and poor reproducibility.Several strategies have been adopted to reduce the interaction of the proteins with thecapillary walls. Simple protocols consisted in the employment of electrolyte solutions atextreme pH values, suppressing the dissociation of the silanol groups of the capillarysurface in an acidic medium, or inducing negative charged surfaces for both, thecapillary wall and the proteins, in an alkaline environment. Other strategies are based onthe use of buffers of high ionic strength. Alternatively, permanent capillary coatingswere employed to selectively modify the surface of the capillary similarly to thederivatized capillaries used in GC. The most promising approach, however, appeared to

Determination of Carbohydrate-Deficient Transferrin in Human Serum by Capillary Zone Electrophoresis
Christian Lanz Inauguraldissertation, University of Basel Page 3
be the introduction of dynamic capillary coatings or polyelectrolyte multilayers forminimizing or abolishing the direct interaction of the proteins with the fused-silicacapillaries [28-36].
A.3. Goals of the Dissertation
The overall goal of this thesis was to develop and evaluate a CZE-based methodfor the separation and quantitation of CDT in human serum with the ultimate goal ofintroduction of the assay into routine analysis. To achieve these aims, several aspectshad to be considered. First, a procedure minimizing the adsorption of serum proteins tothe inner surface of the fused-silica capillary had to be developed. Because of thegenerally poor long-term performance characteristics of permanently coated capillaries,the investigation of dynamic capillary coatings formed by buffer additives wasundertaken. For the determination of CDT in serum, this principle was first investigatedby Landers et al. [37,38] and Tagliaro et al. [39,40], whose publications served as thebasis for the first project of this dissertation. The goals of this study was to investigatethe suitability of two amine-based coatings (1,4-diaminobutane (DAB) and N,N’-bis(3-aminopropyl)1,4-butanediamine (spermine)) and the use of commercial reagentsproducing a dynamic double coating (CEofix-CDT kit, Analis, Namur, Belgium). In thelatter approach, a bilayer is formed by noncovalent adsorption. The fused-silicacapillary is first rinsed with an initiator buffer containing a polymeric polycation (suchas Polybrene) that is adsorbed to the wall surface followed by introduction of therunning buffer containing a polymeric polyanion (such as dextran sulfate) that isforming a second layer and thus providing the negative charge for a strongelectroosmotic flow towards the cathode [35].
An important prerequisite of an accurate determination of analytes is a techniquethat allows the interference-free, selective determination of the compounds of interest.Thus, baseline resolution of the analytes has to be achieved in CZE employing UVdetection in order to avoid the necessity of sophisticated data evaluation procedures ormass spectrometry. After selection of the dynamic coating with the best overallperformance characteristics, the aim of the further investigations was therefore toimprove the method, with special emphasis on the separation between disialo-Tf andtrisialo-Tf (i.e. the resolution between CDT and non-CDT Tf isoforms) and to assess theprecision performance of the assay. The interpretation of clinical laboratory data and theconclusions drawn from these data are based on the comparison of a test result with areference interval. Thus, the elucidation of a reliable reference interval is an important

Determination of Carbohydrate-Deficient Transferrin in Human Serum by Capillary Zone Electrophoresis
Christian Lanz Inauguraldissertation, University of Basel Page 4
task that has to be done before a test can be introduced into the routine arena. Therefore,the goal of the third project of this thesis was to establish the reference interval for CDTanalyzed by CZE and to investigate the impact of instrumental parameters and dataintegration schemes on the reference limits for CDT. The last part of this dissertationwas to evaluate the final, optimized assay under routine conditions via analysis of alarge number of sera from patients of the hepatology outpatient clinic. Special emphasiswas directed towards the identification of atypical Tf patterns obtained with rare geneticTf variants and the investigation of abnormal non-Tf peaks in the γ- and β-regions of theelectropherograms.

Determination of Carbohydrate-Deficient Transferrin in Human Serum by Capillary Zone Electrophoresis
Christian Lanz Inauguraldissertation, University of Basel Page 5
B. Results and Discussion
The content of this dissertation is subject of four publications. Thus, the followingchapters contain these papers that describe the evolution of the project, starting with theevaluation of different dynamic capillary coatings and ending with the application of thefinal method in the routine arena.

Determination of Carbohydrate-Deficient Transferrin in Human Serum by Capillary Zone Electrophoresis
Christian Lanz Inauguraldissertation, University of Basel Page 6
B.1. EVALUATION AND OPTIMIZATION OFCAPILLARY ZONE ELECTROPHORESIS WITH
DIFFERENT DYNAMIC CAPILLARY COATINGS FORTHE DETERMINATION OF CARBOHYDRATE-DEFICIENT TRANSFERRIN IN HUMAN SERUM
Published in: Journal of Chromatography A, 979 (2002) 43 - 57

Determination of Carbohydrate-Deficient Transferrin in Human Serum by Capillary Zone Electrophoresis
Christian Lanz Inauguraldissertation, University of Basel Page 7
EVALUATION AND OPTIMIZATION OF CAPILLARYZONE ELECTROPHORESIS WITH DIFFERENTDYNAMIC CAPILLARY COATINGS FOR THE
DETERMINATION OF CARBOHYDRATE-DEFICIENTTRANSFERRIN IN HUMAN SERUM
Christian Lanz1, Martina Kuhn1, Federica Bortolotti2, Franco Tagliaro2 and Wolfgang
Thormann1
1 University of Bern, Department of Clinical Pharmacology,
3010 Bern, Switzerland.2 University of Verona, Department of Public Medicine and Health - Unit of Forensic
Medicine, Verona, Italy.

Determination of Carbohydrate-Deficient Transferrin in Human Serum by Capillary Zone Electrophoresis
Christian Lanz Inauguraldissertation, University of Basel Page 8
Abstract
Serum transferrin (Tf) comprises several isoforms with up to two complexoligosaccharide chains containing 0 to 8 sialic acid residues and neutral sugars. Themajor glycoform, known as tetrasialo-Tf, contains 4 sialic acid residues and accounts forabout 80 % of whole Tf in human serum. Carbohydrate-deficient transferrin (CDT)encompasses isoforms that are deficient in carbohydrate chains and consequently insialic acid residues (including asialo-, monosialo- and disialo-Tf) and is a well knownmarker for chronic alcohol abuse. Recently capillary zone electrophoresis (CZE) hasbeen reported as a tool extremely effective for the simultaneous, individual, quantitativedetermination of CDT isoforms. Three CZE methods that feature different dynamiccapillary coatings were evaluated and optimized for CDT determination in human serumof alcohol abusers and control subjects. CZE separation was performed in alkalineborate buffers after serum sample saturation with iron, electropherograms were detectedat 200 nm, data were evaluated as area % of disialo-Tf in relation to tetrasialo-Tf andpeak identification was accomplished via relative migration times to tetrasialo-Tf,immunosubtraction and enzymatic sequential cleavage of sialic acid residues. Dynamiccapillary coatings with diaminobutane, spermine and a double coating produced bycommercially available proprietary agents were investigated and found to be suitable fordetermination of CDT in human serum. For all three approaches, best results wereobtained in 50 µm I.D. fused-silica capillaries of 50 cm effective length and a capillarycartridge temperature of 20 - 25 °C. Using 3 mM 1,4-diaminobutane (DAB) or 0.02 mMspermine in a pH 8.3 borate-based running buffer provided data of remarkable similaritywith resolution of di-, tri-, tetra- and pentasialo-Tf within 15 to 18 min. With the doublecoating, asialo-Tf and Tf isoforms with 2 to 6 sialic acid residues were baselineseparated. Compared to the two amine-based procedures, the run times were found to besomewhat shorter, the detector signals higher, the applied power level significantlylower and the reproducibility better.

Determination of Carbohydrate-Deficient Transferrin in Human Serum by Capillary Zone Electrophoresis
Christian Lanz Inauguraldissertation, University of Basel Page 9
1. Introduction
Alcohol misuse and alcohol dependence are common in many different culturesand there are no doubts that among the substances active on the central nervous system,ethanol has the heaviest medical, social and economic impact. Alcohol abuse cangenerally be divided in ”high risk drinking” that means a regular daily intake of about60 g or more of ethanol in males (about ≥ 40 g in females), and ”alcohol dependence”which encompasses excessive drinking with consequential physical and psychologicalharm. Therefore, early diagnosis of alcohol abuse has become a very important topic notonly in clinical medicine, but also in psychiatry, occupational, traffic and forensicmedicine. In these fields, different questionnaires and biological markers like alanineaminotransferase (ALT), aspartate aminotransferases (AST), erythrocyte meancorpuscular volume (MCV), γ-glutamyltransferase (GGT), serum urate and triglyceridesare currently used in assisting the effort of an objective and reliable diagnosis ofalcoholism [1,2]. In the 1970s, Stibler et al. proposed carbohydrate-deficient transferrin(CDT) as a new biological marker for chronic or repeated excessive alcohol intake [3-5]. Transferrin (Tf), the most important iron transporting protein, is a glycoprotein witha molecular mass of about 79'570 daltons that consists of a single peptide chain of 679amino acids. The N-terminal (amino acids 1-336) and C-terminal (amino acids 337-679)domains are globular and encompass an iron binding site each. Tf has two N-linkedcarbohydrate chains at the positions 413 and 611 that are composed of a bi-tetraantennary carbohydrate chain containing N-acetylglucosamine, mannose, galactoseand terminal sialic acid residues [6,7]. Based on a different content of end standingsialic acid residues (zero up to eight), human serum comprises different isoforms of Tf[1,7]. At alkaline pH, sialic acid residues are negatively charged and the Tf isoformsthus differ in their isoelectric points and their electrophoretic behavior. The major Tfisoform in humans consists of four sialic acid residues (tetrasialo-Tf) with an isoelectricpoint of 5.4 (after complete iron saturation). Following chronic alcohol ingestion of 50 -80 g ethanol per day over a period of one to two weeks, the amounts of some lessglycosilated forms with isoelectric points of 5.7 (disialo-Tf) and 5.9 (asialo-Tf) arereported to increase [1,2]. The majority of these isoforms were found to comprise oneand no carbohydrate chain, respectively [8,9]. Isoforms with pI values ≥ 5.7,corresponding to molecules with two or less sialic acid residues, are collectively namedCDT. CDT is considered to be the most specific marker available today for the detectionof chronic, excessive alcohol intake [1].

Determination of Carbohydrate-Deficient Transferrin in Human Serum by Capillary Zone Electrophoresis
Christian Lanz Inauguraldissertation, University of Basel Page 10
CDT was first monitored by isoelectric focusing combined with immunofixation,zone immunoelectrophoresis or Western blotting. Later on, assays based upon ion-exchange and other forms of high-performance liquid chromatography were developed[1,2,10,11]. Sensitivity and specificity of these procedures were reported to be good.Productivity, however, is too low for routine use. Thus, various two-step assay kitsbased on the removal of non-CDT isoforms by ion exchange chromatography ondisposable microcolumns followed by immunochemical determination of the remainingTf isoforms were developed. The commercially available kits differ mainly in theefficiency of the chromatographic separation step and in the immunochemical detectionmethod (radioimmunoassay, enzyme immunoassay, immunoturbidimetric assay, etc),whereas the antisera used are in any case directed towards whole human Tf (nospecificity for CDT). Because of insufficient resolution between isoforms with similarpI’s in the microcolumn chromatographic step, the composition of the collected CDTfraction not only encompasses CDT according to the above stated definition, but mayalso contain an unspecified amount of trisialo Tf. Another problem is the well-knownsusceptibility of specific (abnormal genetic Tf variants) and nonspecific interferences ofthe immunometric determination. CDT immunoassays are therefore prone to analyticalinaccuracy [1,2,12-14].
During the last decade, a great deal of interest was focused on the determinationof Tf isoforms and particularly CDT by capillary electrophoresis (CE) [15-29].Capillary isoelectric focusing (CIEF) was found to be capable of resolving the majorforms of human [15,16] and bovine [19] Tf. Due to the complexity and insufficientreproducibility of these approaches, however, CIEF could not be adopted for thedetermination of CDT in human serum. The use of free solution capillary zoneelectrophoresis (CZE) was more successful. Kilàr and Hjertén reported the resolution ofthe Tf isoforms with zero and up to six sialic acid residues in polyacrylamide-coatedcapillaries and with a pH 8.4 borate/Tris buffer containing 0.3 mM EDTA [17]. Oda andLanders published a detailed study on the CZE separation of Tf isoforms from purifiedTf of different species, including humans. Resolution of the major Tf isoforms wasstudied in bare fused-silica capillaries with borate and phosphate buffers containingdifferent cationic buffer additives for column conditioning, including 1,4-diaminobutane(DAB) also referred to as putrescine or tetramethylenediamine, decamethonium andhexamethonium [18]. Employing bare fused-silica capillaries and a Tris/glutamic acidbuffer at pH around 8.6, a CZE study of abnormal glycoforms of serum Tf incarbohydrate-deficient glycoprotein syndrome type I was published by Iourin et al. [20].Prasad et al. [21] and Oda et al. [22] studied the CZE determination of CDT in DB-17

Determination of Carbohydrate-Deficient Transferrin in Human Serum by Capillary Zone Electrophoresis
Christian Lanz Inauguraldissertation, University of Basel Page 11
coated capillaries using borate buffers with different alkylated celluloses as additives.Significant improvement was achieved with respect to analysis time, but the procedurerequired immunopurification of serum before CZE. Furthermore, Trout et al. [27] andBeisler et al. [28] used fluorocarbon-coated capillaries achieving good resolution of theTf isoforms. However, longevity of the covalently-coated capillary was too short andthe separation performance was affected by an aging process of the capillary.Independently, Tagliaro et al. published a detailed investigation of the CZE separationof human Tf isoforms in bare fused-silica capillaries with I.D.’s of 20 – 100 µmcombined with different buffers. Good separation within reasonable time and withoutcomplicated sample preparation was obtained with a short capillary (30 cm to thedetector) of 20 µm I.D. [23]. Elongation of the capillary length and addition of 1.5 mMor 3 mM of DAB to a 100 mM borate buffer lead to further improvements [24,25] suchthat the assay could be introduced in Verona (Italy) for forensic confirmation of serathat were found to be positive using CDT immunoassays. The efficacy of DAB inpreventing proteins to adhere to the capillary wall was also demonstrated by Giordano etal. who investigated the effect of increasing DAB concentrations (0 – 4 mM) added to aborate buffer in a 50 µm I.D. bare fused-silica capillary [26]. In agreement with thework from the laboratory in Verona, good separation of the Tf isoforms was achieved inpresence of 3 mM DAB. Finally, Wuyts et al. [29] investigated the analysis of CDTwith proprietary reagents that provide a dynamic double coating of the capillaryproduced by adsorption of a polycation prior to application of a second layer composedof a polyanion. This coating procedure is comparable to that described by Katayama etal. [30]. Unfortunately, as disialo- and trisialo Tf were not separated with the bufferused, this assay cannot be employed for the determination of CDT [31].
The main problem in CZE of proteins is the interaction of the highly chargedproteins with the silanol groups of the capillary wall, resulting in a strong impairment ofseparation performance. Different approaches to overcome protein adsorption have beenproposed, including the use of electrolyte solutions at extreme pH values, buffers ofhigh ionic strength, buffer additives that dynamically coat the capillary wall andcovalently coated capillaries [32,33]. Based upon the recent literature [15-29], the use ofbuffer additives that provide dynamic capillary coatings appears to be the mostpromising approach for analysis of CDT in human serum. The aim of this work was (i)to revisit and thereby optimize the use of DAB [24-26] as capillary conditioner, (ii) totest the employment of spermine (N,N’-bis(3-aminopropyl)1,4-butanediamine) asalternative buffer additive, an oligoamine that is known to be an effective quencher ofprotein adsorption [32,34] and that has been successfully employed for CZE analysis of
Determination of Carbohydrate-Deficient Transferrin in Human Serum by Capillary Zone Electrophoresis
Christian Lanz Inauguraldissertation, University of Basel Page 12
ovalbumin glycoforms [35], and (iii) to evaluate a newly developed commercial kit thatprovides a dynamic double coating (CEofix CDT-kit of Analis, Namur, Belgium). Theperformance of the three dynamic coatings were studied in terms of resolution of Tfisoforms, run times, signal magnitudes and reproducibility. For optimization, capillarydimensions, buffer composition, amount of sample injected, applied power and capillarycartridge temperature were varied. The ultimate goal of this study was to find the mostsuitable approach for the routine arena.
2. Experimental
2.1 Chemicals
If not stated otherwise, chemicals were of analytical grade. Disodium tetraboratedecahydrate and sodium hydrogen carbonate were from Merck (Darmstadt, Germany).Caffeine was obtained from Inselspital-Apotheke (Bern, Switzerland).Ferric(III)chloride hexahydrate and spermine tetrahydrochloride (≥ 99.5 %) werepurchased from Fluka (Buchs, Switzerland). DAB (approx. 98 %), neuraminidase typeX from clostridium perfringens (210 units/mg solid, 240 units/mg protein) and ironsaturated holo-Tf (minimum 98 %) were from Sigma (St. Louis, MO, USA). Rabbitanti-human Tf antibody (titer: 2’800 mg/l) was obtained from Dako (Glostrup,Denmark). Buffers and reagents of the Analis CEofix-CDT-kit for quantitation of CDTwith the Beckman Coulter P/ACE MDQ (Kit No. 10-004740) were kindly provided byAnalis (Namur, Belgium). It is important to note that this kit comprises a similar but notidentical buffer than that used by Wuyts et al. [29].
2.2 Serum samples
Patient sera were obtained from the departmental analytical laboratory wherethey were received for determination of CDT. Our own sera were used as sera of healthypersons. All blood samples were drawn by venipuncture and collected in native plastictubes without additives (Monovette, white cap, Sarstedt, Sevelen, Switzerland). Afterclotting the blood samples were centrifuged for 10 min at 3500 rpm at roomtemperature. The supernatant was transferred into 8.0 ml polypropylene tubes. All serawere stored at –20 ° C until use.

Determination of Carbohydrate-Deficient Transferrin in Human Serum by Capillary Zone Electrophoresis
Christian Lanz Inauguraldissertation, University of Basel Page 13
2.3 Sample preparation
Sera were slowly defrosted and vortex mixed at room temperature. For theexperiments with DAB and spermine, 200 µl of serum was combined with 5 µl of anaqueous 10 mM ferric(III)chloride solution and 5 µl of a 500 mM solution of sodiumhydrogen carbonate in a plastic vial. After vortex mixing for 30 s the sample wasincubated at room temperature for 30 min. Then, 5 or 10 µl of the sample wastransferred into a sample vial and, if not stated otherwise, diluted ten-fold with water.The solution was gently mixed by aspiration and release of part of the fluid with aplastic pipette. For the determination of the electroosmotic flow (EOF), an aqueouscaffeine (100 µg/ml) solution was used to dilute the iron saturated serum. For theexperiments with the Analis CDT-kit, 60 µl of serum and 60 µl of the ferric solution ofthe kit were mixed directly in the microtiter plate (Beckman Coulter, Fullerton, USA)according to the manufacturer’s instructions. The sample was mixed gently byaspiration and release of part of the fluid with a pipette. No incubation time wasrequired to saturate the serum with iron.
2.4 Buffer preparation
For the experiments with DAB, borate stock solutions with concentrations of12.5 – 200 mM tetraborate and a pH of 8.3 (adjusted via addition of 6 M HCl) and a 90mM stock solution of DAB containing 0.05 mM HCl were prepared and kept at 4 °C.The running buffers with the desired concentrations of tetraborate and DAB wereprepared daily. Similarly, for the experiments with spermine, pH 8.3 borate stocksolutions (25, 50 and 100 mM tetraborate) and two stock solutions comprising 50 and 1mM spermine, respectively, were prepared and stored at 4°C. The running buffers wereprepared daily. The higher concentrated stock solution of spermine was used forpreparing buffers with spermine concentrations from 3.0 – 0.1 mM, whereas the 1 mMstock solution was employed to obtain spermine concentrations between 0.05 and 0.01mM. For the experiments with the double coating, the buffers were employed assupplied in the kit.

Determination of Carbohydrate-Deficient Transferrin in Human Serum by Capillary Zone Electrophoresis
Christian Lanz Inauguraldissertation, University of Basel Page 14
2.5 Instrumentation and running conditions for theexperiments with DAB and spermine
CZE measurements were performed on a P/ACE MDQ capillary electrophoresissystem (Beckman Coulter) which was equipped with fused-silica capillaries (PolymicroTechnologies, Phoenix, AZ, USA) of 15, 25, 50 and 75 µm I.D. and 60.2, 50.2 and 40.2cm (50.0, 40.0 and 30.0 cm to the detector) total length. All capillaries had an O.D. ofabout 375 µm. If not stated otherwise, the temperature controls of the capillary cartridgeand the sample tray were set to 25 °C and 20 °C, respectively, samples were introducedby positive pressure and the applied voltage was 20 kV. Reversed polarity (cathode atthe injection end) was used for the experiments with spermine concentrations ≥ 0.5 mM.UV detection was effected by using a 200 nm interference filter. Data registration,evaluation and storage were carried out with the 32 Karat Software, version 4.01(Beckman).
New capillaries were sequentially rinsed with 1 M NaOH, 0.2 M NaOH, waterand running buffer (90 min each for capillaries of 15 and 25 µm I.D., 20 - 30 min eachfor capillaries 50 and 75 µm I.D.) by applying a pressure of 60 psi at the inlet end. Thenthe capillaries were filled with running buffer and kept at room temperature for 60 minfollowed by application of 20 kV for 30 min. At the beginning of a day, capillaries weretypically rinsed for 5-6 min with 1 M NaOH with a pressure of 60 psi from the inletside, followed by rinsing for 10 min with 0.2 M NaOH and for 12-15 min with runningbuffer with a pressure of 60 psi from the outlet side. The conditioning step at thebeginning of the day was completed by application of 20 kV for 10-15 min. Betweenruns, capillaries were rinsed from the outlet side with 0.2 M NaOH at 60 psi for 4 min(15 and 25 µm I.D.) or 2 min (50 and 75 µm I.D.) and with running buffer at 30 to 40psi for 6 min (15 and 25 µm I.D.) or 3 min (50 and 75 µm I.D.). At the end of the day,the capillaries were first washed with 1 M NaOH from the outlet side followed by rinsesfrom the inlet side with 1 M NaOH, 0.2 M NaOH and water (60 psi, 10 min each with15 and 25 µm I.D., 5 min each with 50 and 75 µm I.D.). Capillaries and their ends werekept in water during storage.

Determination of Carbohydrate-Deficient Transferrin in Human Serum by Capillary Zone Electrophoresis
Christian Lanz Inauguraldissertation, University of Basel Page 15
2.6 Instrumentation and running conditions for theexperiments with the double coating
If not stated otherwise, CZE measurements were performed according to theinstructions of the manufacturer of the CEofix CDT-kit (Analis) on the P/ACE MDQinstrument (Beckman Coulter). The system was equipped with a fused-silica capillary(Analis) of 50 µm I.D. and 60.2 cm (50.0 cm length to the detector) total length. TheO.D. was 360 µm. The temperature controls of the cartridge and sample tray were set to40 °C and 15 °C, respectively. New capillaries were rinsed for 10 min with 0.2 MNaOH by applying a pressure of 40 psi at the inlet end. The same washing step wasemployed at the beginning of each day. At the end of a day the capillary was rinsed for5 min with 0.2 M NaOH and for 5 min with water by applying a pressure of 60 psi at theinlet end. Capillaries were stored wet with the ends kept in water. Between runscapillaries were rinsed with 0.2 M NaOH for 1 min with a pressure of 60 psi from theinlet end and then for 1.5 min with 0.2 M NaOH by applying simultaneously a constantcurrent of 80 µA and a pressure of 20 psi at the inlet end. At the beginning of a new run,the capillary was rinsed from the inlet to the outlet side for 1.5 min with the initiatorbuffer and for 2 min with the run buffer of the CDT kit by applying a pressure of 15 psi.Sample was introduced by applying a vacuum of 0.3 psi for 10 s at the outlet side. Avoltage of 28 kV was applied (anode at the injection end) and the current was about 26µA. Detection and data processing was performed as in Section 2.5. Selectedexperiments were performed with lower cartridge temperature and/or increased capillarylength.
2.7 Evaluation of electropherograms
Data evaluation was based upon peak area measurements. For comparison of allapproaches described in this manuscript, the amount of CDT was evaluated as area % ofdisialo-Tf in relation to tetrasialo-Tf and referred to as Tf-index [25]. Resolution (Rs)was calculated with the 32 Karat Software (Beckman Coulter) using Rs = 1.18(t2-t1)/((Wh/2)1+(Wh/2)2) where ti and (Wh/2)i represent the detection time and peak width athalf height of firstly (i=1) and secondly (i=2) detected peak, respectively. An Rs valueof ≥1.4 represents baseline resolution. Peak asymmetry (tailing factor, defined as half ofthe peak width at 5 % of peak height divided by the distance from the peak maximum to

Determination of Carbohydrate-Deficient Transferrin in Human Serum by Capillary Zone Electrophoresis
Christian Lanz Inauguraldissertation, University of Basel Page 16
the leading edge of the peak at the position of 5% peak height) and efficiency expressedin plates/m were also determined with this software.
2.8 Immunosubtraction and enzymatic digestion
For immunosubtraction of Tf, 80 µl of serum was vortex mixed in a plastic vialwith 160 µl of anti-human Tf immunoglobulins and incubated at room temperature for1.5 h. After centrifugation at 10’000 g for 25 min at 4°C, the supernatant was collectedimmediately and measured without further preparation. For data comparison withuntreated sample, serum was equally diluted with water after iron saturation andanalyzed under the same conditions. For digestion with neuraminidase, the enzyme wasreconstituted to 1 U/ml with 50 mM sodium acetate (pH 5.0, adjusted with acetic acid).160 µl of serum was saturated in a plastic vial with 160 µl of the ferric solution of theCEofix CDT-kit and combined with 160 µl of the enzyme solution. After vortex mixing,the sample was first incubated at room temperature for 5 h and then at 37 °C until about72 h. Aliquots were analyzed with the double coating method.
2.9 CDT determination with the %CDT TIA test
CDT was determined with the turbidimetric immunoassay %CDT TIA of Axis-Shield (distributed through Bio-Rad, Hercules, CA, USA) according to therecommendations of the kit manufacturer using the Cobas Mira Plus (RocheDiagnostics, Rotkreuz, Switzerland). A CDT value < 2.6 % of total Tf was considered tobe within the normal range.
3. Results and Discussion
3.1 Experiments with DAB
The basis for the experiments with DAB was the work of Tagliaro et al. [24,25]in which CDT was analyzed in 20 µm I.D. capillaries employing a borate pH 8.3 buffercontaining 1.5 to 3 mM DAB. The performance of DAB was further investigated incapillaries of different inner diameters (15, 25, 50 and 75 µm, Fig. 1) and by varyingborate concentration, applied voltage, operational temperature and amount of sample

Determination of Carbohydrate-Deficient Transferrin in Human Serum by Capillary Zone Electrophoresis
Christian Lanz Inauguraldissertation, University of Basel Page 17
injected. Peak identification of the minor isoforms was accomplished by calculating therelative migration times to tetrasialo-Tf. Iron saturated sera were diluted ten-fold withwater or an aqueous caffeine solution (100 µg/ml). Selected electropherograms obtainedfor the serum of a healthy subject and using capillaries of 50 cm effective length arepresented in Fig. 1.
Using a 25 µm I.D. capillary, 2.25 mM DAB in a 100 mM borate buffer, avoltage of 20 kV (current about 30 µA) and a cartridge temperature of 25 °C, niceresolution of the major Tf isoforms, including di- and trisialo-Tf, was obtained within18 min, whereas pentasialo-Tf was only partially separated from tetrasialo-Tf (secondgraph from top in Figs. 1A and 1B, Table 1). Asialo-Tf, present in sera from alcoholabusers, was not detected (data not shown), and hexasialo-Tf could not be identified.Depending on the injection time which was varied between 13.5 s and 30 s (0.5 psipressure, plug ≤ 0.76 % of capillary volume), the height of the tetrasialo-Tf peak was2.5 – 7 mAU and the signal to noise ratio for disialo-Tf (smallest peak) was ≤ 6. Theeffect of cartridge temperature on the separation of Tf isoforms was investigatedbetween 20 °C and 45 °C (steps of 5 °C). The temperature has an influence on theviscosity and conductivity of the buffer system and thus the mobilities of the analytesand electroosmosis. With increased temperature, the power dissipation in the capillary(expressed in W/m, for selected values refer to Table 1) and the intracapillarytemperature become higher and therefore may require lowering the voltage ordecreasing the electrolyte concentration of the buffer. Detection time could be reducedfrom about 21 min at 20 °C to about 11 min at 45 °C (electropherograms not shown).For the entire temperature interval, the applied power and current increased from 0.93 to1.48 W/m and 28 to 44 µA, respectively. The separation characteristics did not altermuch except that the resolution between di- and trisialo-Tf was found to deteriorate asfunction of temperature. A similar effect on the migration times was observed byincreasing the voltage from 20 kV to 30 kV (steps of 5 kV, temperature of 25 °C). Thedetection time could thereby be reduced from about 18 min to about 11.5 min. Thecurrent increased from 30 to 48 µA and the power applied changed from 1.02 to 2.38W/m, indicating that the intracapillary temperature is increasing as well [36]. Despite ofthe relatively high power level associated with the application of 30 kV, the separationwas found to be almost as good as that obtained with 20 kV and 25 °C and was clearlybetter than with 20 kV and 45 °C (data not shown). No further improvement of peakresolution was obtained by varying the borate concentration up to 200 mM and bydilution of the iron saturated sera five-fold or twenty-fold. Increased peak resolution

Determination of Carbohydrate-Deficient Transferrin in Human Serum by Capillary Zone Electrophoresis
Christian Lanz Inauguraldissertation, University of Basel Page 18
between disialo- and trisialo-Tf was noted after reducing the I.D. of the capillary to 15µm (top graphs in panels A and B of Fig. 1, Table 1). However, much smaller signalswere observed and the signal-to-noise ratio for disialo-Tf became very low. Thus, nofurther work with 15 µm I.D. capillaries was undertaken.
Figure 1: Optimized CZE electropherograms of a serum from a healthy individual using pH 8.3 borate
buffers with DAB in capillaries of 15, 25, 50 and 75 µm I.D. (graphs from top to bottom) and 50 cm
effective length. The entire electropherograms and the sections with the Tf pattern on an elongated x-axis
scale are presented in panels A and B, respectively. The DAB concentrations were 2.25, 2.25, 3.0 and 3.0
mM, respectively, and the borate concentrations were 100, 100, 50 and 25 mM, respectively. The
injection times (applied pressure) were 70 s (0.5 psi), 19 s (0.5 psi), 4 s (0.5 psi) and 5 s (0.2 psi),
respectively. The applied voltages were 20 kV (I.D. < 75 µm) and 18 kV (I.D = 75 µm) and the currents
were 10.0, 30.6, 57.4 and 78.0 µA, respectively. The temperature of the cartridge was 25 °C in all cases.
Other conditions are listed in Table 1. For the sake of clarity, electropherograms are presented with y-
scale offsets. Key: 2: disialo-Tf, 3: trisialo-Tf, 4: tetrasialo-Tf, 5: pentasialo-Tf, C: caffeine, γ: gamma
region, EO: electroosmosis.
TIME (min)15 16 17 18 19 20
A
B
EO
Tf
C
TfC
Tf
Tf
4
5
2
32
0 4 8 12 16 20
AB
SO
RB
ANC
E (m
AU
)
EO
EO
15 µm
25 µm
50 µm
75 µm
2 mAU γ
γγ
γ
32
2 3
3
4
4
4
5
5
5
2 mAU

Table 1: E
xperimental conditions and resolution data of selected electropherogram
s
Experim
ental conditionsR
esolutionFig.
coating agentagentconc.(m
M)
capillaryI.D
. a)
(µµµ µm)
sample
plug b)
(%)
cartridgetem
p. c)
(°C)
power
level(W
/m)
run temp.
d)
(°C)
di-/tri-sialo-T
ftri-/tetra-sialo-T
fTetra- /
pentasialo-T
f
1D
AB
2.2515
0.6325
0.3427.2
2.4721.870
0.9771
DA
B2.25
250.48
251.02
31.51.755
1.5830.958
1,2AD
AB
3.0050
0.4025
1.9137.2
1.4931.847
1.2071
DA
B3.00
750.45
252.35
40.01.585
2.3801.571
4sperm
ine0.02
250.68
251.00
31.41.820
1.7771.079
5Asperm
ine0.02
500.40
251.89
37.11.334
1.8981.335
6Adouble coating
-50
0.8240
1.2147.7
1.3682.715
1.9357A
double coating-
500.82
401.21
47.70.781
2.4211.640
7Bdouble coating
-50
0.5420
0.7324.7
1.4212.706
1.7348
double coating-
500.58
200.42
22.71.332
2.7151.736
a) Effective capillary lengths w
ere 50 cm (Figs. 1, 4, 5, 6, and 7) and 70 cm
(Fig. 8).b)
Theoretical sample plug length (expressed in %
of capillary length) calculated with the C
E Expert, version 1, software (B
eckman).
c) Tem
perature of the circulating cooling fluid.d)
Intracapillary temperature estim
ated based upon a 6.4 °C tem
perature increase per applied 1 W/m
[36].

Determination of Carbohydrate-Deficient Transferrin in Human Serum by Capillary Zone Electrophoresis
Christian Lanz Inauguraldissertation, University of Basel Page 20
Enlargement of the capillary I.D. lead to electropherograms with increased signalmagnitudes (Fig. 1) and increased operational temperatures (Table 1). Best results wereobtained with a 50 µm I.D capillary, an effective capillary length of 50 cm, a 50 mM pH8.3 borate buffer containing 3.0 mM DAB, an applied voltage of 20 kV and anoperational temperature of 25 °C (second graph from bottom in Fig. 1, Fig. 2). For apressure of 0.5 psi, the injection time was optimized to 4 s, corresponding to atheoretical plug length of 0.40 % of the capillary length. The electroosmotic mobility(meo) and applied power levels were calculated to be 2.24 x 10⁻⁴ cm2/Vs and 1.91 W/m,respectively, and the estimated intracapillary temperature was estimated to be 37.2 °C.Under these conditions, all Tf isoforms were detected within 17 min. Baseline separationof di- and trisialo-Tf was achieved and the resolution between tetrasialo-Tf andpentasialo-Tf was good (Table 1). The height of the tetrasialo-Tf peak was about 7 mAUand the signal to noise ratio for disialo-Tf in the pattern of healthy individuals (Figs. 1and 2A) was between 10 and 15. Except for peak resolution, no further improvementwas obtained by enlarging the I.D. of the capillary to 75 µm (bottom graphs in Fig. 1,Table 1).
TIME (min)14.0 14.6 15.2 15.8 16.4 17.03
5
7
9
0 5 10 15 20
3
6
9
12
14.0 14.6 15.2 15.8 16.4 17.0
ABS
OR
BAN
CE
(mA
U)
4
6
8
10
12
2-Si
alo-
Tf
3-Si
alo-
Tf
4-Si
alo-
Tf5-
Sial
o-Tf
∗
∗
Tf
EOγ
A
B
2-Si
alo-
Tf
3-Si
alo-
Tf
4-Si
alo-
Tf5-
Sial
o-Tf
Figure 2: Electropherograms in presenceof 3.0 mM DAB obtained with (A) aserum of a healthy individual and (B) aserum of an alcohol abuser in a 50 µmI.D. capillary of 50 cm effective length.Other experimental conditions as for the50 µm I.D. electropherogram of Fig. 1.The insert in panel A depicts the entireelectropherogram. Key as for Fig. 1

Determination of Carbohydrate-Deficient Transferrin in Human Serum by Capillary Zone Electrophoresis
Christian Lanz Inauguraldissertation, University of Basel Page 21
The data presented in Fig. 2 represent typical serum Tf patterns of a healthyindividual (Fig. 2A) and an alcohol abuser (Fig. 2B). Data were evaluated as area % ofdisialo-Tf in relation to tetrasialo-Tf and referred to as Tf-index, the normal valueassessed in 20 µm I.D. capillaries being ≤ 2.27 % [25]. The two Tf-indices were therebycalculated to be 1.35 % and 12.06 %, respectively. Thus, CZE with DAB as capillaryconditioner was found to correctly classify the two sera. The same was found to be truefor the %CDT TIA test that revealed values of 2.0 and 6.3 %, respectively. It isimportant to note, that asialo-Tf could not be detected with the CZE assay (Fig. 2B).Furthermore, hexasialo-Tf could not be identified. The peaks marked with asterisks areof unknown origin and were present in most electropherograms (for exceptions refer toFig. 1). Typical reproducibility data for peak efficiency, peak shape and resolutionobtained via analysis of a serum of a healthy individual are summarized in Table 2,whereas corresponding RSD values for detection time, peak area and Tf-index arepresented in Table 3.
3.2 Experiments with spermine
The effect of varying spermine concentrations on electroosmosis and theseparation of Tf isoforms was investigated in capillaries of 25 µm I.D., 50 cm effectivelength and a cartridge temperature of 25 °C. First, a solution of purified human holo-Tf(0.5 mg/ml in water) and iron saturated serum of a healthy person that was diluted withan aqueous solution of caffeine (100 µg/ml) were analyzed employing 100 mM boratebuffers of a pH 8.3 comprising spermine concentrations between 3.0 to 0.02 mM.Selected electropherograms are presented in Figs. 3 and 4. For monitoring ofelectroosmosis in absence of proteins, caffeine (1 mg/ml in water) was injected. Withspermine concentrations between 3.0 and 0.5 mM and application of 20 kV, caffeinecould not be detected within 90 min of current flow. This means that under theseconditions the EOF was markedly reduced, abolished or even reversed. The datasuggested that meo < 0.28 x 10⁻⁴ cm2/Vs. Similarly, from experiments with reversedpolarity, it could be concluded that meo > - 0.40 x 10⁻⁴ cm2/Vs. For detection of Tf thepolarity had to be reversed (-20 kV, first and second graphs from top of Fig. 3, top graphof Fig. 4). Under these conditions highly charged anions are reaching the detector first.For analysis of serum in presence of 3.0 mM spermine, a large splitted peak representingalbumin was detected at 18 min, followed by several small peaks probablyencompassing α1- and α2 globulins and finally Tf at about 27 min (top graph of Fig. 4).No separation between disialo- and trisialo-Tf was obtained. Shortening of the capillary

Determination of Carbohydrate-Deficient Transferrin in Human Serum by Capillary Zone Electrophoresis
Christian Lanz Inauguraldissertation, University of Basel Page 22
or application of a higher voltage did not lead to improved Tf isoform separation (datanot shown). The same was found to be true with a 0.5 mM spermine concentration(second graph from top in Fig. 3).
Having a spermine concentration of 0.1 mM, normal polarity (detector at thecathode) and otherwise identical experimental conditions as described above, it waspossible to detect the EOF within about 30 min (meo = 0.84 x 10⁻⁴ cm2/Vs), but Tf didnot reach the detector within 70 min (second graph from bottom in Fig. 3). Thus, foranalysis of Tf, electroosmosis appears to be to too weak. With 0.05 to 0.02 mMspermine, electroosmosis was observed to increase as the spermine concentration wasdecreased, and almost fully resolved Tf patterns were noted. Best results were obtainedwith 0.02 mM spermine (meo = 1.71 x 10⁻⁴ cm2/Vs) and having an effective capillarylength of 50 cm (bottom graphs in Figs. 3 and 4). With an injection time of 27 s(pressure: 0.5 psi), the observed separation characteristics were found to be similar tothose obtained with 2.25 mM DAB in a fused-silica capillary of the same length and I.D.
Figure 3: Electropherograms obtained with Tf standard (0.5 mg/ml in water) using pH 8.3, 100 mMborate buffers with spermine in a capillary of 25 µm I.D. and 50 cm effective length. The spermineconcentration varied between 3.0, 0.5, 0.1 and 0.02 mM (graphs from top to bottom, respectively). Theapplied voltages were –20 kV, -20 kV, 20 kV and 20 kV, respectively, and the currents were about 30 µAin all four cases. Injection was effected for 27 s at 0.5 psi and the cartridge temperature was 25 °C in allcases. For the sake of clarity, electropherograms are presented with y-scale offsets. Key as for Fig. 1.
TIME (min)0 20 40 60 80
ABSO
RBA
NC
E (m
AU)
2
6
10
14
18
Tf
Tf
C
Tf
EOEO
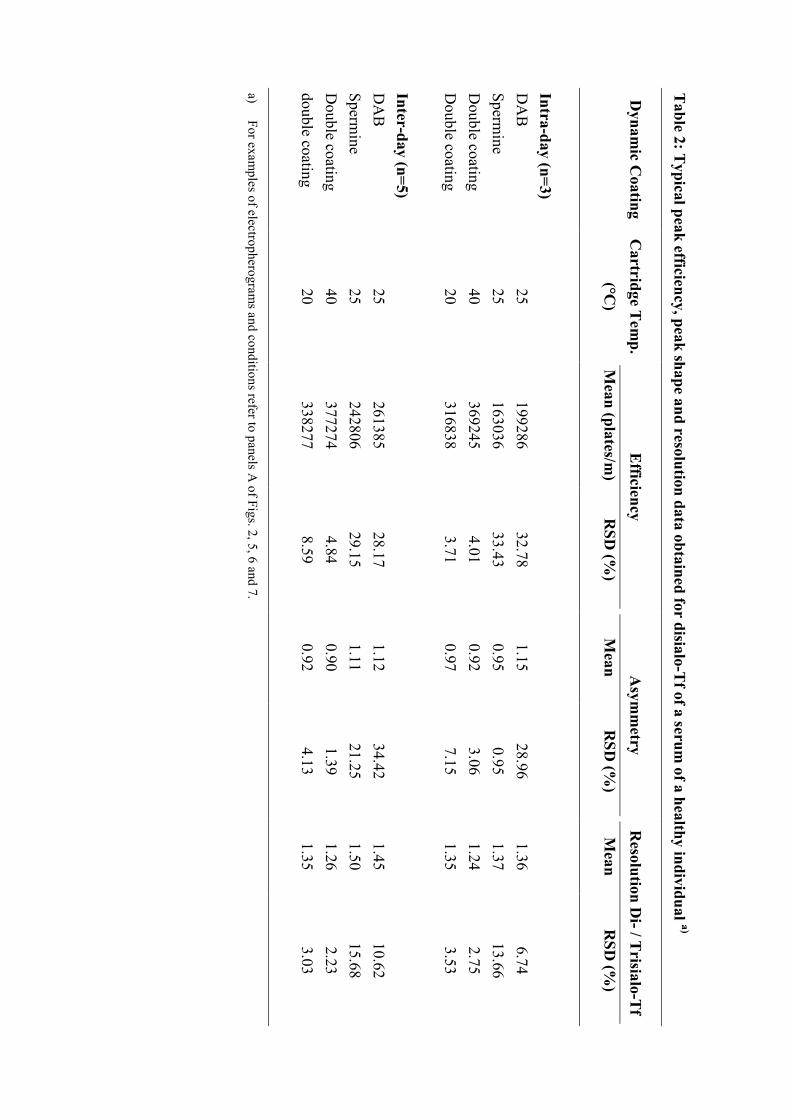
Table 2: T
ypical peak efficiency, peak shape and resolution data obtained for disialo-Tf of a serum
of a healthy individual a)
Dynam
ic Coating
Cartridge Tem
p.E
fficiencyA
symm
etryR
esolution Di- / T
risialo-Tf(°C
)M
ean (plates/m)
RSD
(%)
Mean
RSD
(%)
Mean
RSD
(%)
Intra-day (n=3)D
AB
25199286
32.781.15
28.961.36
6.74Sperm
ine25
16303633.43
0.950.95
1.3713.66
Double coating
40369245
4.010.92
3.061.24
2.75D
ouble coating20
3168383.71
0.977.15
1.353.53
Inter-day (n=5)D
AB
25261385
28.171.12
34.421.45
10.62Sperm
ine25
24280629.15
1.1121.25
1.5015.68
Double coating
40377274
4.840.90
1.391.26
2.23double coating
20338277
8.590.92
4.131.35
3.03
a) For exam
ples of electropherograms and conditions refer to panels A
of Figs. 2, 5, 6 and 7.

Table 3: T
ypical reproducibility data obtained for disialo-Tf and tetrasialo-T
f of a serum of a healthy individual a) (R
SD values in %
)
Dynam
icC
oatingC
artridge Tem
p.(°C
)D
etection time
(min)
Relative detection
time
Relative peak area
c)T
f-indexb)
Disialo-T
fT
etrasialo-Tf
Di-/T
etra-sialo-Tf
Disialo-T
fT
etrasialo-Tf
Intra-day (n=3)D
AB
251.11
1.130.11
14.654.50
14.91Sperm
ine25
8.088.50
0.4143.60
43.819.93
Double coating
400.04
0.060.04
3.736.57
3.37D
ouble coating20
0.020.02
0.023.68
2.632.53
Inter-day (n=5)D
AB
252.32
2.400.12
16.3018.20
20.00Sperm
ine25
7.457.84
0.4751.87
43.2222.28
Double coating
400.33
0.360.03
17.0919.53
4.42D
ouble coating20
1.381.46
0.0813.39
10.295.87
a) For exam
ples of electropherograms and conditions refer to panels A
of Figs. 2, 5, 6 and 7.b)
Area %
of disialo-Tf relative to the area of the tetrasialo-Tf peak.
c) Peak area divided by detection tim
e.

Determination of Carbohydrate-Deficient Transferrin in Human Serum by Capillary Zone Electrophoresis
Christian Lanz Inauguraldissertation, University of Basel Page 25
(Table 1). The analysis time, however, was somewhat longer with spermine. Baselineseparation of di- and trisialo-Tf was obtained within 27 min and pentasialo-Tf was notfully separated from tetrasialo-Tf (Table 1). No improvements were noted with shortercapillaries (tested with 30 cm effective length) and with 15 µm I.D. capillaries.However, increased detector signals and an overall better separation was obtained with50 µm I.D. capillaries of 50 cm total length (Fig. 5, Table 1). As was the case with DAB(Fig. 2), the borate concentration had to be reduced to 50 mM. With a voltage of 20 kV,the temperature control of the cartridge being set to 25 °C, an injection time of 4 s(pressure: 0.5 psi) and a spermine concentration of 0.020 mM, Tf with its highlyresolved isoforms reached the detector within about 16.0 to 17.5 min (Fig. 5). Theconcentration of the capillary conditioner was found to be critical. With 0.025 mMspermine, all Tf isoforms were detected within 20 – 26 min, whereas with 0.01 mM
Figure 4: Electropherograms obtained with a serum of a healthy individual (10-fold diluted after ironsaturation) in presence of 3.0 mM spermine (upper graph, reversed polarity) and of 0.02 mM spermine(lower graph, normal polarity). Other conditions as for top and bottom graphs, respectively, of Fig. 3. Albrefers to albumin.
TIME (min)0 6 12 18 24 30
AB
SO
RB
AN
CE
(mA
U)
0
3
6
9
12
Tf
TfC
Alb
EO
γ

Determination of Carbohydrate-Deficient Transferrin in Human Serum by Capillary Zone Electrophoresis
Christian Lanz Inauguraldissertation, University of Basel Page 26
spermine, incompletely resolved Tf isomers reached the detector within about 12 min.Furthermore, within a set of experiments, a tendency to shorter analysis times was notedusing this capillary conditioning agent.
The data presented in Fig. 5 represent typical serum Tf patterns of a healthyindividual (Fig. 5A) and an alcohol abuser (Fig. 5B), samples that were also analyzedwith DAB (Fig. 2). The Tf-indices were calculated to be 1.34 % and 9.04 %,respectively, indicating that the separation performance for di- to pentasialo-Tf was thesame as with 3 mM DAB (Fig.2). It is important to note, that asialo-Tf and hexasialo-Tfcould not be detected as well (Fig. 5B). The peaks marked with an asterisk are ofunknown origin and were present in most electropherograms. Typical reproducibilitydata for peak efficiency, peak shape and resolution obtained via analysis of a serum of a
TIME (min)14.8 15.4 16.0 16.6 17.2 17.8
4
5
6
7
8
0 4 8 12 16
4
8
12
16
13.4 14.0 14.6 15.2 15.8 16.4
ABSO
RB
ANC
E (m
AU)
5
9
13
17
2-Si
alo-
Tf
3-Si
alo-
Tf
4-Si
alo-
Tf5-
Sial
o-Tf
∗
∗
Tf
EOγ
A
B
2-Si
alo-
Tf
3-Si
alo-
Tf
4-S
ialo
-Tf
5-Si
alo-
Tf
Figure 5: Electropherograms inpresence of 0.02 mM spermineobtained with (A) a serum of ahealthy individual and (B) a serumof an alcohol abuser in a 50 µmI.D. capillary of 50 cm effectivelength. The borate bufferconcentration was 50 mM, theinjection time (pressure) was 4 s(0.5 psi), the voltage was 20 kVand the currents were about 57 µA.The temperature of the cartridgewas set to 25 °C. The insert inpanel A depicts the entireelectropherogram. Key as for Fig.1.

Determination of Carbohydrate-Deficient Transferrin in Human Serum by Capillary Zone Electrophoresis
Christian Lanz Inauguraldissertation, University of Basel Page 27
healthy individual are summarized in Table 2, whereas corresponding RSD values forpeak detection time, peak area and the Tf-index are presented in Table 3. Compared tothe configuration with DAB, imprecision of detection times, relative detection time andpeak areas were found to be larger. The RSD of the Tf-index, however, was comparable.Furthermore, it was interesting to find that the electroosmotic mobility and power levelfor the data of Fig. 5A were almost identical to those of the data with 3 mM DABpresented in Fig. 2A (2.24 x 10⁻⁴ cm2/Vs and 1.9 W/m, respectively).
3.3 Experiments with dynamic double coating
Experiments with the proprietary double coating were primarily performedaccording to the instructions of the manufacturer of the CEofix CDT-Kit (see section2.6). For analysis of a serum of a healthy individual, resolution of Tf isoforms with 2 to6 sialic acid residues was obtained within 7 min (Fig. 6A, Table 1). Additionally, asialo-Tf could be nicely detected in selected sera from alcohol abusers (Fig. 6B). Theelectroosmotic mobility was calculated to be 3.73 x 10⁻⁴ cm2/Vs, a value that is 66.5 %higher compared to those characteristic for the corresponding assays with DAB (Fig. 2)and spermine (Fig. 5). The power level was significantly lower, namely 1.21 W/mcompared to 1.9 W/m. The peak height of the main peak (tetrasialo-Tf) was about 40mAU, i.e. the signal was about 4 – 6 times higher than the signal of the correspondingpeak when analyzed with the assays comprising DAB or spermine as capillaryconditioning agents (compare with Figs. 2 and 5).
The data presented in Fig. 6 represent typical serum Tf patterns of a healthyindividual (Fig. 6A) and an alcohol abuser (Fig. 6B). The two Tf-indices werecalculated to be 1.30 % and 20.06 %, respectively. Thus, CZE with the double coatingwas found to correctly classify the two sera. The same was found to be true for the%CDT TIA test that revealed values of 2.0 and 13.6 %, respectively. It is important tonote the serum of the alcohol abuser whose data are shown in Fig. 6B is not the same aswas used to produce the patterns shown in Figs. 2B and 5B. The latter serum lead to aTf-index of 7.7 % and a very small asiolo-Tf peak and was thus not depicted. Typicalreproducibility data for peak efficiency, peak shape and resolution obtained via analysisof a serum of a healthy individual are summarized in Table 2, whereas correspondingRSD values for peak detection time, peak area and the Tf-index are presented in Table3. Compared to the assays with DAB and spermine, RSD values for all parameters werefound to be significantly lower. Thus, the double coating appears to abolish the protein

Determination of Carbohydrate-Deficient Transferrin in Human Serum by Capillary Zone Electrophoresis
Christian Lanz Inauguraldissertation, University of Basel Page 28
wall interactions more efficiently and/or provides improved resurfacing for eachanalysis.
Although not visible for the data presented in Fig. 6A and with the calculatedresolution value given in Table 1, resolution between di- and trisialo-Tf was typicallynoted to be lower compared to the cases with DAB and spermine (Table 2). For selectedpatient sera with high amounts of trisialo-Tf (Fig. 7B), this was found to become aproblem. For analysis under normal conditions, incomplete separation of di- andtrisialo-Tf was noted (Fig. 7A, Rs = 0.78, Tf-index = 0.35 %). The amount of trisialo-Tfrelative to tetrasialo-Tf was determined to be 12.5 %, a value that is about 2.5-foldhigher compared to the 4.9 % determined for the serum of Fig. 6A. Analysis of the sameserum with the cartridge temperature reduced to 20 °C (electroosmotic mobility of 2.56
TIME (min)5.5 5.8 6.1 6.4 6.7 7.0
10
15
20
25
30
0.0 1.8 3.6 5.4 7.2
5
15
25
35
45
5.5 5.8 6.1 6.4 6.7 7.0
ABSO
RB
ANC
E (m
AU)
5
15
25
35
45
2-Si
alo-
Tf3-
Sial
o-Tf
4-Si
alo-
Tf5-
Sial
o-Tf
6-Si
alo-
Tf
Tf
EO γ
A
B
2-Si
alo-
Tf3-
Sial
o-Tf
4-S
ialo
-Tf
5-Si
alo-
Tf
6-Si
alo-
Tf
0-Si
alo-
Tf
Figure 6: Electropherogramsobtained with the dynamic doublecoating for analysis of (A) a serumof a healthy individual and (B) aserum of an alcohol abuser having a50 µm I.D. capillary of 50 cmeffective length. The injection timewas 10 s (0.3 psi, vacuum), thevoltage was 28 kV and the currentswere 26.0 µA. The temperature ofthe cartridge was 40 °C. The insertin panel A depicts the entireelectropherogram. Key as for Fig. 1.

Determination of Carbohydrate-Deficient Transferrin in Human Serum by Capillary Zone Electrophoresis
Christian Lanz Inauguraldissertation, University of Basel Page 29
x 10-4 cm2/Vs, power level of 0.73 W/m) and otherwise identical conditions, revealed arun time of about 10.5 min, a resolution between di- and trisialo-Tf of 1.42, a Tf-indexof 0.75 % and a relative amount of trisialo-Tf of 12.6 % (Fig. 7B). Furthermore, thispatient serum was also analyzed in an elongated capillary (70 cm instead of 50 cmeffective length) held at 20 °C which resulted in a run time of about 20 min and a Tf-index of 0.82 % (Fig. 8, upper graph). Using immunosubtraction as described in section2.9, all assigned peaks were determined to represent Tf (Fig. 8, lower graph). Forcomparison of the electropherograms it is important to note that the immunosubtractedsample was monitored with a time shift of about 10 s, an effect that originates from thedifference of the sample matrix. Furthermore, misinterpretation of theelectropherograms was prevented with incubation of serum with neuraminidase forincreasing times and analysis of a range of samples with which the sequential cleavage
TIME (min)9.0 9.3 9.6 9.9 10.2 10.5
5
10
15
20
25
30
0.0 1.8 3.6 5.4 7.2
5
15
25
35
45
5.5 5.8 6.1 6.4 6.7 7.0
ABSO
RBA
NC
E (m
AU)
5
15
25
35
45
0.0 2.5 5.0 7.5 10.0
0
10
20
30
2-Si
alo-
Tf
Tf
EO
γ
EO
Tf
γ
A
B
3-Si
alo-
Tf
5-Si
alo-
Tf4-
Sial
o-Tf
2-Si
alo-
Tf
4-Si
alo-
Tf
3-S
ialo
-Tf
6-S
ialo
-Tf
6-Si
alo-
Tf5-
Sial
o-Tf
Figure 7: Electropherogramsobtained with a patient serumcontaining a high amount oftrisialo-Tf after analysis with thedynamic double coating at (A) 40°C and (B) 20 °C and otherwiseidentical conditions as for Fig. 6.The current for panel B was 15.7µA. The inserts depict the entireelectropherograms. Key as for Fig.1.

Determination of Carbohydrate-Deficient Transferrin in Human Serum by Capillary Zone Electrophoresis
Christian Lanz Inauguraldissertation, University of Basel Page 30
of the sialic acid moieties could be visualized (data not shown). Elongation of thecapillary provided no significant improvement of separation (Table 1). Thus, basedupon the resolution increase (Table 2) and the excellent reproducibility (Table 3)obtained for operation at 20 °C, it can be concluded that the use of the 50 cm capillaryshould be sufficient for monitoring CDT in clinical and forensic practice.
According to the CZE data presented in Figs. 7 and 8, the analyzed serum withincreased trisialo-Tf was classified as having a normal Tf-index (< 2.27 % [25]).However, the %CDT TIA test revealed a CDT value of 3.6 % which is considered to bepositive according to the reference values proposed in the instruction manual of the testkit (< 2.6 %) and used in clinical practice (< 3.0 % [12]). The inaccuracy of the %CDTturbidimetric immunoassay appears to be obvious for such cases. Thus, should apositive immunoassay test result lead to serious consequences, it should always beconfirmed by a more specific method, such as CZE [25] or HPLC [12,14].
TIME (min)13.5 15.0 16.5 18.0 19.5
ABS
OR
BAN
CE
(mA
U)
0
10
20
30
40
50
2-Si
alo-
Tf 3-S
ialo
-Tf
4-S
ialo
-Tf
5-Si
alo-
Tf
6-Si
alo-
Tf
EO
γ Figure 8: Electropherogramsobtained with a patient serumcontaining a high amount oftrisialo-Tf before (upper graph)and after (lower graph)immunosubtraction for analysiswith the dynamic double coating ina 50 µm I.D. capillary of 70 cmeffective length and a cartridgetemperature of 20 °C. Injectionwas performed by applying avacuum of 0.6 psi for 10 s. Thecurrent was 12.1 µA. Otherconditions as for Fig. 6. For thesake of presentation, the uppergraph is depicted with a 9 mAU y-axis shift.

Determination of Carbohydrate-Deficient Transferrin in Human Serum by Capillary Zone Electrophoresis
Christian Lanz Inauguraldissertation, University of Basel Page 31
4. Conclusions
The major problems in analyzing CDT with CZE are the interaction of themacromolecules with the capillary wall and the maintenance of the capillary surface toguarantee reproducibility. As permanently coated capillaries are expensive and werefound to deteriorate with time, the use of plain capillaries together with buffer additivesthat provide a dynamic coating appears to be the most effective approach in terms ofboth analytical performance and cost. In our work with the P/ACE MDQ instrument,configurations with two amine modifiers, DAB and spermine, and a proprietarycommercially available double coating were investigated and found to be suitable fordetermination of CDT in human serum. For all three approaches, bestelectropherograms in terms of Tf isoform resolution, detection signals and run timeswere obtained in 50 µm I.D. capillaries of 50 cm effective length, application of normalpolarity (electroosmosis towards the cathode) and a capillary cartridge temperature of20 - 25 °C. Having 3 mM DAB or 0.02 mM spermine in a pH 8.3 borate based runningbuffer provided data of remarkable similarity. With these approaches and having anapplied power of 1.9 W/m at 20 kV, di-, tri-, tetra- and pentasialo-Tf can be separatedand detected within 15 to 18 min. Asialo-Tf and hexasialo-Tf, however, cannot bemonitored. Data evaluated based upon area % of disialo-Tf in relation to tetrasialo-Tfwere found to be comparable and reproducible. Furthermore, the use of DAB was notedto provide better reproducibility of detection times and higher temperatures lead toreduced run times but insufficient separability in both cases. With the double coatingand the buffers provided in the commercial CDT-kit, asialo-Tf and Tf isoforms with 2 to6 sialic acid residues are monitored. The capillary is first rinsed with an initiator(containing a proprietary polycation in a malic acid/arginine buffer at pH 4.8) followedby introduction of the running buffer (containing a proprietary polyanion in a Tris/boricacid buffer at pH 8.5) and analysis of the iron saturated sample. Using the recommendedcartridge temperature of 40 °C, excellent reproducibility and short run times of about 7min were noted. Compared to the assays based upon DAB and spermine, signalmagnitudes were determined to be significantly higher and the applied power levellower (1.21 W/m at 28 kV). The resolution of di- and trisialo-Tf, however, wasincomplete with sera containing high amounts of trisialo-Tf. To obtain complete Tfisoform resolution for these cases, the cartridge temperature had to be lowered to 20 °Cwhich provided run times of about 10 min (power level of 0.73 W/m) and excellentreproducibility. Based upon the evaluations reported in this paper, the use of the doublecoating at 20 °C together with the commercially available CEofix-CDT-kit currentlyappears to be the best approach for CZE analysis of CDT in a routine arena.
Determination of Carbohydrate-Deficient Transferrin in Human Serum by Capillary Zone Electrophoresis
Christian Lanz Inauguraldissertation, University of Basel Page 32
Acknowledgements
The authors acknowledge the receipt of the Analis CEofix CDT kits from itsmanufacturer (Analis, Namur, Belgium). This work was supported by the LiverFoundation, Bern, Switzerland, the Swiss National Science Foundation and MIUR(Italian Ministry of Education, University and Research, project # 2001065132).
Determination of Carbohydrate-Deficient Transferrin in Human Serum by Capillary Zone Electrophoresis
Christian Lanz Inauguraldissertation, University of Basel Page 33
References[1] T. Arndt, Clin. Chem. 47 (2001) 13-27.
[2] F. Tagliaro, F. Bortolotti, F. Crivellente, F. Cittadini, Forensic Sci. Rev. 12(2000)
134-148.
[3] H. Stibler, K.G. Kjellin, J. Neurol. Sci. 30 (1976) 269-285.
[4] H. Stibler, C. Allgulander, S. Borg, K.G. Kjellin, Acta med. Scand. 204 (1978)49-56
[5] H. Stibler, S. Borg, C. Allgulander, Acta med. Scand. 206 (1979) 275-281.
[6] P. Sillanaukee, N. Strid, J.P. Allen, R.Z. Litten, Alcohol. Clin. Exp. Res. 25(2001) 34-40.
[7] G. de Jong, H.G. van Ejik, Electrophoresis 9 (1988) 589-598.
[8] E. Landberg, P. Påhlsson, A. Lundblad, A. Arnetorp, J.-O. Jeppsson, Biochem.Biophys. Res. Commun. 210 (1995) 267-274.
[9] T. Inoue, M. Yamauchi, K. Ohkawa, Electrophoresis 20 (1999) 452-457.
[10] J.-O. Jeppsson, H. Kristensson, C. Fimiani, Clin. Chem. 39 (1993) 2115-2120.
[11] E. Werle, G.E. Seitz, B. Kohl, W. Fiehn, H.K. Seitz, Alcohol Alcohol. 32 (1997)71-77.
[12] A. Helander, M. Fors, B. Zakrisson, Alcohol Alcohol. 36 (2001) 406-412.
[13] M. Lipowski, L. Dibbelt, M. Seyfarth, Clin. Biochemistry, 33 (2000) 635-641.
[14] U. Turpeinen, T. Methuen, H. Alfthan, K. Laitinen, M. Salaspuro, U.-H.Stenman, Clin. Chem. 47 (2001) 1782-1787.
[15] S. Molteni, W. Thormann, J. Chromatogr. 638 (1993) 187-193.
[16] F. Kilàr, S. Hjertén, Electrophoresis 10 (1989) 23-29.
[17] F. Kilàr, S. Hjertén, J. Chromatogr. 480 (1989) 351-357.
[18] R.P. Oda, J.P. Landers, Electrophoresis 17 (1996) 431-437.
[19] L. Yang, Q. Tang, A.K. Harrata, C.S. Lee, Anal. Biochem. 243 (1996) 140-149.
[20] O. Iourin, T.S. Mattu, N. Mian, G. Keir, B. Winchester, R.A. Dwek, P.M. Rudd,Glycoconj. J. 13 (1996) 1031-1042.
[21] R. Prasad, R.L. Stout, D. Coffin, J. Smith, Electrophoresis 18 (1997) 1814-1818.
[22] R.P. Oda, R. Prasad, R.L. Stout, D. Coffin, W.P. Patton, D.L. Kraft, J.F.O’Brien, J.P. Landers, Electrophoresis 18 (1997) 1819-1826.
[23] F. Tagliaro, F. Crivellente, G. Manetto, I. Puppi, Z. Deyl, M. Marigo,Electrophoresis 19 (1998) 3033-3039.

Determination of Carbohydrate-Deficient Transferrin in Human Serum by Capillary Zone Electrophoresis
Christian Lanz Inauguraldissertation, University of Basel Page 34
[24] F. Crivellente, G. Fracasso, R. Valentini, G. Manetto, A.P. Riviera, F. Tagliaro,J. Chromatogr. B 739 (2000) 81-93.
[25] F. Tagliaro, F. Bortolotti, M. Zuliani, F. Crivellente, G. Manetto, V.L. Pascali,M. Marigo, J. Cap. Elec. 6 (1999) 137-143.
[26] B.C. Giordano, M. Muza, A. Trout, J.P. Landers, J. Chromatogr. B 742 (2000)79-89.
[27] A.L. Trout, R. Prasad, D. Coffin, A. DiMartini, T. Lane, C. Blessum, N. Khatter,J.P. Landers, Electrophoresis 21 (2000) 2376-2383.
[28] A.T. Beisler, R..H. Kelly, J.P. Landers, Anal. Biochem. 285 (2000) 143-150.
[29] B. Wuyts, J.R. Delanghe, I. Kasvosve, A. Wauters, H. Neels, J. Janssens, Clin.Chem. 47 (2001) 247-255.
[30] H. Katayama, Y. Ishihama, N. Asakawa, Anal. Chem. 70 (1998) 2254-2260.
[31] F. Tagliaro, F. Bortolotti, R.M. Dorizzi, M. Marigo, Clin. Chem. 48 (2002) 208-209.
[32] P.G. Righetti, C. Gelfi, B. Verzola, L. Castelletti, Electrophoresis 22 (2001) 603-611.
[33] J. Horvath, V. Dolník, Electrophoresis 22 (2001) 644-655.
[34] B. Verzola, C. Gelfi, P.G.Righetti, J. Chromatogr. A 868 (2000) 85-99.
[35] M.E. Legaz, M.M. Pedrosa, J. Chromatogr. A 719 (1996) 159-170.
[36] M.E. Lacey, A.G. Webb, J.V. Sweedler, Anal. Chem. 72 (2000) 4991-4998.

Determination of Carbohydrate-Deficient Transferrin in Human Serum by Capillary Zone Electrophoresis
Christian Lanz Inauguraldissertation, University of Basel Page 35
B.2. CAPILLARY ZONE ELECTROPHORESIS WITH ADYNAMIC DOUBLE COATING FOR ANALYSIS OFCARBOHYDRATE-DEFICIENT TRANSFERRIN IN
HUMAN SERUM: PRECISION PERFORMANCE ANDPATTERN RECOGNITION
Published in: Journal of Chromatography A, 1013 (2003) 131 - 147
Determination of Carbohydrate-Deficient Transferrin in Human Serum by Capillary Zone Electrophoresis
Christian Lanz Inauguraldissertation, University of Basel Page 36
CAPILLARY ZONE ELECTROPHORESIS WITH ADYNAMIC DOUBLE COATING FOR ANALYSIS OFCARBOHYDRATE-DEFICIENT TRANSFERRIN IN
HUMAN SERUM: PRECISION PERFORMANCE ANDPATTERN RECOGNITION
Christian Lanz1, Ulrich Marti2, Wolfgang Thormann1
1 Department of Clinical Pharmacology, University of Bern, ,3010 Bern, Switzerland.
2 Department of Clinical Chemistry, Inselspital, Bern, CH-3010 Bern, Switzerland.

Determination of Carbohydrate-Deficient Transferrin in Human Serum by Capillary Zone Electrophoresis
Christian Lanz Inauguraldissertation, University of Basel Page 37
Abstract
Capillary zone electrophoresis (CZE) with a dynamic double coating permits thesimultaneous, individual, quantitative determination of transferrin (Tf) isoforms inhuman serum and thus carbohydrate deficient transferrin (CDT), the most specificmarker available today for the detection of chronic, excessive alcohol intake. CZE ofserum Tf was carefully evaluated using the P/ACE MDQ with fused-silica capillaries of50 µm I.D. and 60.2 cm total length, the CEofix CDT kit and the instrumentalconditions recommended by the kit manufacturer. The precision performance assessedover a 20-day period according to the internationally accepted NCCLS EP5-Aguidelines revealed the CZE assay as being highly reproducible with within-run andtotal precision being dependent on the Tf isoform level and RSD values rangingbetween 2.2 and 17.6 %. Inter-day RSD values for asialo-Tf were noted to be between9.8 and 11.5 % and for disialo-Tf between 3.8 and 8.6 %, whereas those for CDT levelsof 0.87 and 4.31 % of total Tf were determined to be 8.6 and 3.4 %, respectively. TheRSD values for trisialo-Tf, tetrasialo-Tf, pentasialo-Tf and hexasialo-Tf were found tobe between 0.4 and 4.1 %. Tf patterns are recognized and identified via detection timesof Tf isoforms (intra-day and inter-day RSD values < 1.0 % and < 1.7 %, respectively),immunosubtraction of Tf and enzymatic sequential cleavage of sialic acid residues.Furthermore, heterozygous Tf BC and Tf CD variants are assigned via spiking with aknown mixture of Tf isoforms (e.g. the serum of a healthy Tf C homozygote). Amongthe non-Tf peaks monitored, the CRP peak detected shortly before disialo-Tf wasidentified by immunosubtraction and peak magnitudes were found to correlate well withimmunochemically determined CRP serum levels. The CZE assay with dynamic doublecoating could thereby be shown to be sensitive enough to determine elevated CRP levelsin human serum. Furthermore, unusual peaks in the γ-region were identified bycustomary serum protein CZE, immunosubtraction CZE and immunofixation.

Determination of Carbohydrate-Deficient Transferrin in Human Serum by Capillary Zone Electrophoresis
Christian Lanz Inauguraldissertation, University of Basel Page 38
1. Introduction
In the 1970s Stibler et al. observed an increase of transferrin (Tf) isoforms withisoelectric points ≥ 5.7 in the serum and cerebrospinal fluid from patients with a chronicor repeated excessive alcohol intake [1-3]. Tf, the most important iron transportingprotein, consists of 679 amino acids forming two iron binding sites and bears two N-linked carbohydrate chains that are composed of neutral sugars and of zero up to eightend-standing, negatively charged sialic acid residues. The major Tf isoform, accountingfor about 80 % of whole Tf in human serum, contains four sialic acid residues and isknown as tetrasialo-Tf with an isoelectric point of 5.4 [4,5]. Isoforms with pI values ≥5.7 encompass Tf molecules with two or less sialic acid residues and are thereforecollectively named carbohydrate-deficient Tf (CDT). CDT is widely accepted as themost specific marker available today for the detection of chronic, excessive alcoholintake [6]. Different analytical approaches – based on isoelectric focusing,immunochemical determination of fractionated Tf isoforms and high performance liquidchromatography (HPLC) - have been employed for the investigation of Tf isoforms andthe determination of CDT. Many of the developed methods are either time consumingor, due to possible interferences, prone to analytical inaccuracy [7,8]. During the lastdecade, capillary zone electrophoresis (CZE) has been extensively applied to thedetermination of Tf isoforms and thus also CDT. Among the various methodsdeveloped, CZE in dynamically coated fused-silica capillaries proved to be the mostpromising approach [8-16].
Dynamic capillary coatings are obtained with buffer additives that are beingadsorbed onto the capillary via formation of a dynamic equilibrium. Macromoleculeinteractions with the capillary wall can thereby be prevented or at least minimized andthe capillary is newly resurfaced for each analysis [17]. For the determination of CDT inhuman serum, our group recently compared three CZE methods with different dynamiccapillary coatings, employing diaminobutane, spermine and a commercial doublecoating [9]. During that work, the double coating approach was identified as being thebest. In this approach, the fused-silica capillary is first rinsed with an initiator buffercontaining a polymeric polycation that is adsorbed to the wall surface followed byintroduction of the running buffer containing a polymeric polyanion that is forming asecond layer and thus providing the negative charge for a strong electroosmotic flow(EOF) towards the cathode. The CEofix CDT-kit of Analis (Namur, Belgium) comprises

Determination of Carbohydrate-Deficient Transferrin in Human Serum by Capillary Zone Electrophoresis
Christian Lanz Inauguraldissertation, University of Basel Page 39
proprietary ionic polymers [18] that form a bilayer by noncovalent adsorption, such asthe bilayers producedby Polybrene/dextran sulfate [19],poly(diallyldimethylammonium)/poly(styrene sulfonate) [20] andPolybrene/poly(vinylsulfonate) [21]. The EOF in these systems was determined to beessentially independent of pH and highly reproducible.
CZE of Tf in human serum allows the quantitative determination of CDT[8,9,16]. Moreover, it also provides information about the whole Tf pattern and otheranionic serum compounds that are migrating slower than Tf and are thus detected aheadof Tf. Abnormalities in the Tf pattern [13,14] and the γ-region [15] can thereby bevisualized also. There are currently major efforts being undertaken with the aim of awidespread adoption of the CZE assays for CDT into the routine arena, both forscreening and confirmation in clinical and forensic analysis [8,9,14-16]. During the pastyear, the performance of the newly introduced commercial CZE kit for CDT (CEofixCDT-kit of Analis, Namur, Belgium) on the P/ACE MDQ capillary electrophoresissystem of Beckman Coulter (Fullerton, CA, USA) was carefully evaluated using theinstrumental conditions recommended by the kit manufacturer. We now wish to report(i) the precision performance data that were established according to internationallyaccepted NCCLS EP5-A guidelines [22], (ii) investigations of the nature of differentabnormalities in the Tf pattern and the γ-region, and (iii) the identification of the C-reactive protein (CRP) peak present in many sera in varying amounts and migratingdirectly in front of disialo-Tf.
2. Experimental
2.1 Chemicals
If not stated otherwise, chemicals were of analytical grade. Rabbit anti-human Tfantibody (titer: 2’800 mg/l) and rabbit anti-human C-reactive protein antibody (titer: 900mg/l) were purchased from Dako (Glostrup, Denmark). Neuraminidase type X fromclostridium perfringens (209 units/mg solid, 240 units/mg protein) and neuraminidasetype III from vibrio cholerae (3 mg protein/ml, 3 units/mg protein) were obtained fromSigma (St. Louis, MO, USA). N-glycosidase F (100 units) was purchased from RocheDiagnostics (Rotkreuz, Switzerland). Buffers and reagents of the Analis CEofix-CDT-kit for quantitation of CDT with the Beckman Coulter P/ACE MDQ (Kit No. 10-004740) were kindly provided by Analis (Namur, Belgium). It is important to note that

Determination of Carbohydrate-Deficient Transferrin in Human Serum by Capillary Zone Electrophoresis
Christian Lanz Inauguraldissertation, University of Basel Page 40
this kit comprises a buffer similar but not identical to that employed by Wuyts et al [14].It is, however, believed to be the same as that now furnished for the Beckman CoulterP/ACE 5500 recently employed by Legros et al [16].
2.2 Serum samplesPatient sera were obtained from the departmental analytical laboratory where
they were received for determination of CDT. Our own sera were used as sera of healthypersons. All blood samples, drawn by venipuncture, were collected in native plastictubes without additives (Monovette, white cap, Sarstedt, Sevelen, Switzerland). Afterclotting, the blood samples were centrifuged at room temperature for 10 min at 2’000 g.The supernatant was transferred into 8.0 ml polypropylene tubes. All sera were stored at–20 ° C until use.
2.3 Sample preparation
Sera were slowly defrosted and vortex mixed at room temperature. According tothe manufacturer’s instructions, 60 µl of serum and 60 µl of the ferric solution of the kit(Analis) were mixed directly in the microtiter plate (Beckman Coulter, Fullerton, USA).The sample was mixed gently by aspiration and release of part of the fluid with a plasticpipette. No incubation time was required for iron saturation of the serum. Foridentification of Tf isoforms in the presence of genetic Tf variants, 30 µl serum wascombined with 30 µl of a control serum of a healthy person prior to the addition of the60 µl of the ferric solution.
2.4 Instrumentation, running conditions and data evaluation
All CZE measurements and data evaluation were performed according to theinstructions of the manufacturer of the CEofix CDT-kit (Analis). Briefly, a P/ACEMDQ capillary electrophoresis system (Beckman Coulter) that was equipped with afused-silica capillary (Polymicro Technologies, Phoenix, AZ, USA) of 50 µm I.D. and60.2 cm (50.0 cm to the detector) total length was employed. The O.D. of the capillarywas about 360 µm. For the evaluation of the precision performance capillaries with thesame length and identical inner and outer diameter as described above were receivedfrom Analis. New capillaries were rinsed for 10 min with 0.2 M NaOH with a pressureof 40 psi applied from the inlet end. The same procedure was employed at the beginning
Determination of Carbohydrate-Deficient Transferrin in Human Serum by Capillary Zone Electrophoresis
Christian Lanz Inauguraldissertation, University of Basel Page 41
of each day. At the end of a day the capillary was washed with 0.2 M NaOH and water(5 min each with 60 psi from the inlet to the outlet end). The capillary was stored wetand the ends were kept in water. Between runs the capillary was rinsed for 1 min with0.2 M NaOH and a pressure of 60 psi from the inlet end and then with 0.2 M NaOH for1.5 min by applying simultaneously a pressure of 20 psi at the inlet end and a constantcurrent of 80 µA. At the beginning of a new run, the capillary was conditioned byapplying a pressure of 15 psi from the inlet to the outlet side with the initiator buffer for1.5 min followed by the run buffer of the CDT kit for 2 min. The iron saturated samplewas introduced from the microtiter plate by applying a vacuum of 0.3 psi for 10 s at theoutlet end. The temperature controls of the cartridge and sample tray were set to 40 °Cand 15 °C, respectively. The voltage applied was 28 kV (anode at the inlet side)resulting in a current of about 26 µA and a power level of about 1.21 W/m. UVdetection was effected by using a 200 nm interference filter. Data registration,evaluation and storage were carried out with the 32 Karat Software, version 4.01(Beckman). Data evaluation was based upon corrected peak areas of single isoforms(peak areas determined by valley-to-valley integration and divided by detection time)and are presented as area% in relation to the sum of the peak areas of all detected Tfisoforms. In contrast to the previous work from our laboratory [9], the amount of CDTwas not evaluated as Tf index (area % of disialo-Tf in relation to tetrasialo-Tf) but asarea % of the sum of asialo-Tf and disialo-Tf in relation to the sum of the peak areas ofall Tf isoforms.
2.5 Evaluation of precision performance
The precision performance of the Analis CEofix-CDT-kit was evaluatedaccording to the EP5-A protocol from NCCLS [22]. A serum with a low level of CDTand one with a high amount of CDT, referred to as “sample low” and “sample high”,respectively, and two corresponding controls referred to as “control low” and “controlhigh”, were analyzed over a period of twenty working days. The “sample low” wasprepared from about 8 ml serum of a healthy volunteer. The serum was homogenizedand a total of 120 60 µl aliquots were stored in 0.5 ml polypropylene vials at –20 °Cuntil use. The “control low” stemmed from another healthy person and was prepared inthe same way. The “sample high” was prepared from 16 patient sera that werecombined, vortex mixed, divided into 90 aliquots of 60 µl each, and stored at – 20 °Cuntil use. The “control high” was a serum pool of 4 patient samples and was stored as 45aliquots of 60 µl each.

Determination of Carbohydrate-Deficient Transferrin in Human Serum by Capillary Zone Electrophoresis
Christian Lanz Inauguraldissertation, University of Basel Page 42
The evaluation was performed by one operator and started after the operator wasfamiliar with the handling of all processes. Two separate sets of runs were analyzed oneach day and the time period between the end of the first and beginning of the secondset was at least two hours. Each sample in each set was analyzed in duplicates, resultingin a total of eight measurements per set or a total of 16 runs per day. For each set, thetwo aliquots of the “sample low”, “sample high” and “control low” were preparedseparately. For the “control high”, one aliquot was prepared only and sample injectionoccurred twice from the same vial. The order of analysis was determined randomly foreach set and the initiator and run buffers were changed every 100 analyses. All kits andreagents had the same lot number and capillaries from one lot were employed.Electropherograms were evaluated by valley-to-valley integration and the values ofasialo-Tf and disialo-Tf were reported for all samples.
The values of the controls were reported on control charts including the meanvalue with two, three (warning limit) and four (out-of-control limit) standard deviations(SD). Every five days the mean value and the corresponding SD were recalculated ofeach chart from all acceptable data collected thus far. At day five, an additional set ofruns was performed comprising twenty separately prepared aliquots of the “samplelow”. From these data a preliminary within-run precision was calculated according tothe procedure stated in the protocol. All unexpected events and problems and theirsolutions were reported in detail. After collection of the data of 20 acceptable operatingdays, the within-run precision and the total precision of the CZE method for thedetermination of CDT was calculated according to the statistics described in detail in theprotocol. In addition, relative standard deviations (RSD) for total precision of all foursamples and controls, respectively, were calculated by dividing the SD by thecorresponding mean value of the 80 measurements and multiplication with 100.
2.6 Immunosubtraction of Tf and CRP
For immunosubtraction of Tf, 100 to 400 µl of serum was incubated in a plasticvial with varying relative volumes of anti-human Tf antibody. The smallest relativeamount of anti-human Tf antibody was a quarter of the volume of the investigatedserum, and the largest relative volume of antibody corresponded to four times thevolume of serum. The sample was incubated at room temperature for 15 min to 2 h.Then, the incubate was centrifuged at 8000 g for 20 min at 4 °C and the supernatant wascollected immediately and measured without further preparation. For data comparison

Determination of Carbohydrate-Deficient Transferrin in Human Serum by Capillary Zone Electrophoresis
Christian Lanz Inauguraldissertation, University of Basel Page 43
with untreated sample, serum was equally diluted with water after iron saturation andanalyzed under the same conditions. For immunosubtraction of CRP 60 – 200 µl ofserum was vortex mixed in a plastic vial with a volume of anti-human CRP antibodycorresponding to 1 % of the volume of the serum up to a volume of antibody that wastwice the volume of the investigated serum. After incubation at room temperature for0.5 -2 h, the sample was centrifuged at 8000 g for 20 min at 4 °C. The supernatant wasremoved immediately and analyzed after saturation with an equal volume of the ferricsolution of the CDT-kit (Analis). For some experiments the incubation of serum withanti-human CRP antibody was performed in the presence of the ferric solution. Forinvestigation of the antibody solution, the reagent was diluted in water (2- to 20-fold)prior to analysis.
For sequential immunosubtraction of CRP and Tf in the same serum sample, 190or 180 µl of serum were incubated in a plastic vial with 10 or 20 µl, respectively, ofanti-human CRP antibody at room temperature for 1 h. Then, the precipitate wasremoved via centrifugation at 8000 g for 20 min at 4 °C. 50 µl of the collectedsupernatant was saturated with 50 µl of the ferric solution of the kit (Analis) asdescribed in section 2.3 and analyzed. The Tf immunosubtraction was performed with60 µl of the supernatant via addition of 120 µl of the anti-human Tf antibody. Thesample was incubated for 1 h at room temperature. After centrifugation for 20 min at8000 g and 4 °C, the supernatant was collected immediately and analyzed withoutfurther preparation.
2.7 Digestion with neuraminidase and N-glycosidase F
For digestion with neuraminidase type X, the enzyme was reconstituted to 1U/ml with 50 mM sodium acetate (pH 5.0, adjusted with acetic acid). 60 µl of serumwas saturated in a plastic vial with 60 µl of the ferric solution of the CEofix CDT-kitand combined with 60 µl of the enzyme solution. After vortex mixing, the sample wasfirst incubated at 15 °C for 20.5 h with the microtiter plate sitting in the garage of theCE instrument, then at 30 °C for 2 h and then at 37 °C for 6 h. This sample was analyzedat various time points between 0 and 28.5 h. Prior to the measurements at 26 h and 28.5h, 90 µl and 50 µl, respectively, of water was added to the sample. For digestion withneuraminidase type III, 360 µl of serum was combined with 3 µl of the purchasedenzyme solution. After vortex mixing, the sample was first incubated at 37 °C for 120 h.

Determination of Carbohydrate-Deficient Transferrin in Human Serum by Capillary Zone Electrophoresis
Christian Lanz Inauguraldissertation, University of Basel Page 44
For each analysis, a 30 µl aliquot was withdrawn from the sample and combined with 30µl of the ferric solution of the CEofix CDT-kit. For digestion with N-glycosidase F, 50µl of serum was combined with 10 µl of the reconstituted solution (100 U/100 µl water).After vortex mixing, the sample was first incubated at 37 °C for 3.5 h. Then, 40 µl of theferric solution was added and aliquots were analyzed at various time intervals during thefollowing 24 h incubation at 37 °C.
2.8 Routine assays for CRP, serum proteins and CDT
CRP was determined in the routine laboratory with the CRP Tina-quant kit(Roche Diagnostics) on a Hitachi 917 Analyzer (Roche Diagnostics). CZE serumprotein analyses and immunosubtraction CZE analyses were performed according to themanufacturer instructions using the Paragon CZE 2000 Clinical CapillaryElectrophoresis System (Beckman, Brea, CA, USA) and the provided reagents(Beckman). Immunofixation analysis of serum proteins on agarose gels was performedwith Hydrasis (Sebia, Issy-les-Moulineux, France). For other serum protein patternsobtained with these techniques refer to [23]. CDT of older sera were determined with the%CDT turbidimetric immunoassay (Bio-Rad, Hercules, CA, USA) whose CDT values <6.0 % were considered to be within the normal range. Newer sera were monitored withthe %CDT TIA turbidimetric immunoassay of Axis-Shield (Bio-Rad), an assay with aCDT cutoff value of 2.6 %.
3. Results and discussion
3.1 Precision performance
Analytical methods have to be investigated carefully before use in a routine arena andtheir capability of generating useful results has to be evaluated. They are fully describedby their reliability criteria encompassing specificity, accuracy, precision anddetectability, and their practicability criteria summarizing information about speed, cost,technical skill requirements and dependability. These criteria describe the performancecharacteristics of an analytical method [24]. In this manuscript, the precisionperformance, as an important part of the reliability of a method, of the commerciallyavailable CDT-kit is reported. It has been evaluated according to the NCCLS EP5-Aguideline, an internationally accepted protocol that provides guidance and procedures

Determination of Carbohydrate-Deficient Transferrin in Human Serum by Capillary Zone Electrophoresis
Christian Lanz Inauguraldissertation, University of Basel Page 45
for the evaluation of the precision of in vitro diagnostic devices. The variability of adevice when used over a long period of time is of highest interest for the description ofthe precision performance. Several time-related components contribute to this totalprecision and can be characterized as within-run, between-run, within-day and day-to-day precision. The NCCLS document is designed to estimate the total precision andwithin-run precision [22]. Typical electropherograms for all four samples analyzed arepresented in Fig. 1 and Table 1 summarizes the performance data obtained in our study.Standard deviations and the corresponding values of the degrees of freedom werecalculated according to the protocol. Additionally, the mean of all data collected overthe 20 day period (n = 80) was determined and used to calculate RSD values. Except forasialo-Tf of the “sample high”, RSD values are shown to be below 10 %. For the within-run precision and the total precision, RSD values were determined to be as low as 2.19% and 3.57 %, respectively. For both, RSD values are becoming smaller as the isoformlevel is increasing. The detection limit for asialo-Tf and any other Tf isoform wasestimated to be about 0.05 % of total Tf, whereas the limit of quantification was taken as0.10 % of total Tf.
The precision performance evaluation according to the NCCLS EP5-A guidelineis based upon duplicate analyses that are performed twice a day. Routine analyses aretypically run once only which prompted us to evaluate the customary intra-day andinter-day precision data as well. The intra-day data correspond to the preliminary within-run precision data obtained with the “sample low” on day five (for an electropherogramrefer to Fig. 1A) and are summarized in the top line of Table 2. Corresponding data forthe other Tf isoforms and the detection times for all isoforms are also included in Table2. RSD values for detection times and isoform quantitation were found to be smallerthan 1.0 % and 5.1 %, respectively, values that correspond well to the preliminary datapublished previously [9]. Similar data were obtained for a sample with detectable asialo-Tf that was assessed outside the NCCLS EP5-A protocol (lower part of Table 2).Furthermore, the inter-day data presented in Table 3 are those obtained after evaluationof the results of the first aliquots of the four samples analyzed each day during the 20day period. Again, RSD values for isoform quantitation were found to be dependent onpeak size. For asialo-Tf, RSD was < 12 % whereas for all other isoforms < 8.6 %. RSDvalues of detection times were determined to be < 1.7 % in all cases (Table 4). For thequantitation of asialo-Tf and disialo-Tf, the values presented in Tables 2 and 3 werefound to correspond well with those of Table 1. RSD values for CDT were determinedto be between 5.07 % and 8.55 % for samples containing normal amounts of CDT.Corresponding values for samples with elevated CDT levels were between 1 and 4 %

Determination of Carbohydrate-Deficient Transferrin in Human Serum by Capillary Zone Electrophoresis
Christian Lanz Inauguraldissertation, University of Basel Page 46
Figure 1: Typical CZE Tf patterns obtained with (A) “sample low”, (B) “sample high”, (C) “control low”
and (D) “control high”. Mean area% values of the Tf isoforms are listed in Tables 1 and 3. Key: 0:
asiaolo-Tf, 2: disialo-Tf, 3: trisialo-Tf, 4: tetrasialo-Tf, 5: pentasialo-Tf, 6: hexasialo-
TIME (min)
5.8 6.1 6.4 6.7 7.0
AB
SO
RB
AN
CE
(mA
U)
5
15
25
35
45
55
TIME (min)
5.8 6.1 6.4 6.7 7.0
AB
SO
RB
AN
CE
(mA
U)
5
15
25
35
45
55 A B
TIME (min)
5.8 6.1 6.4 6.7 7.0
ABS
OR
BA
NC
E (m
AU
)
5
15
25
35
45
55 C
TIME (min)
5.8 6.1 6.4 6.7 7.0
ABS
OR
BA
NC
E (m
AU
)
5
15
25
35
45
55 D
2 3
4
5
62 3
4
5
6
02 3
4
5
6
4
23
5
6
0

Table 1: W
ithin-run and total precision data according to the NC
CL
S EP5-A
protocol
Sample
IsoformIsoform
level a)W
ithin-Run Precision
Total Precision
[area%]
SD[area%
]D
egrees offreedom
b)R
SD[%
]SD
[area%]
Degrees of
freedomc)
RSD
[%]
Sample low
Disialo-Tf
0.880.044
405.03
0.06461
7.28Sam
ple highA
sialo-Tf0.68
0.09840
14.390.120
6617.64
Disialo-Tf
3.200.090
402.80
0.12457
3.87C
ontrol lowD
isialo-Tf0.93
0.04040
4.260.062
536.72
Control high
Asialo-Tf
0.750.065
408.68
0.06863
9.08D
isialo-Tf3.59
0.07940
2.190.128
543.57
a) M
ean of all 80 measurem
ents performed during the 20 day evaluation. D
ata expressed in area% of total Tf.
b) N
umber of series (degrees of freedom
for SD).
c) D
egrees of freedom for total standard deviation estim
ate (rounded to nearest integer).

Table 2: Intra-day precision data (n=20)
Tf isoform
(s)detection tim
eisoform
or CD
T am
ountm
ean[m
in]SD
[min]
RSD
[%]
mean
a)
[area%]
SD[area%
]R
SD[%
]
Sample low
b)
Disialo-Tf
6.3290.057
0.900.914
0.0465.07
Trisialo-Tf6.399
0.0580.91
3.8480.047
1.23Tetrasialo-Tf
6.5380.061
0.9479.930
0.2810.35
Pentasialo-Tf6.644
0.0640.96
12.6030.200
1.59H
exasialo-Tf6.752
0.0660.98
2.7060.096
3.53C
DT (A
siolo-Tf + disialo-Tf)-
--
0.9140.046
5.07
Sample high
c)
Asialo-Tf
6.1750.023
0.380.442
0.0306.85
Disialo-Tf
6.4390.027
0.413.650
0.0411.13
Trisialo-Tf6.516
0.0280.43
4.2500.146
3.43Tetrasialo-Tf
6.6670.030
0.4475.938
0.2470.32
Pentasialo-Tf6.781
0.0310.46
13.1640.100
0.76H
exasialo-Tf6.897
0.0330.48
2.5570.038
1.47C
DT (A
siolo-Tf + disialo-Tf)-
--
4.0910.044
1.07a)
Isoform or C
DT am
ount expressed in area% of total Tf.
b)D
ata assessed at day 5 of the precision evaluation and thus represent the preliminary w
ithin-run precision of the EP5A protocol.
c)D
ifferent serum pool as em
ployed for the precision evaluation (Table 1) and inter-day precision data (Tables 3 and 4).

Table 3: Inter-day precision data for quantitation of single transferrin isoform
s and CD
T (n=20) a)
Tf isoform
(s)Sam
ple lowSam
ple highC
ontrol lowC
ontrol highm
ean[area%
]R
SD[%
]m
ean[area%
]R
SD[%
]m
ean[area%
]R
SD[%
]M
ean[area%
]R
SD[%
]
Asialo-Tf
ND
ND
0.67911.54
ND
ND
0.7619.82
Disialo-Tf
0.8738.55
3.1734.41
0.9236.65
3.5503.81
Trisialo-Tf3.769
3.135.863
2.134.912
1.505.178
2.37Tetrasialo-Tf
80.2190.44
72.7860.58
77.3200.40
72.3610.62
Pentasialo-Tf12.524
1.7614.303
1.0113.836
1.7414.639
1.62H
exasialo-Tf2.615
2.692.881
2.863.009
4.133.206
2.73C
DT (A
sialo-Tf+ D
isialo-Tf)0.873
8.553.852
3.750.923
6.654.311
3.43
a) D
ata of first aliquot of the four samples analyzed each day during the 20 day evaluation period. N
D refers to not detected.

Table 4: Inter-day reproducibility data for the detection tim
es of transferrin isoforms (n=20) a)
Tf isoform
(s)Sam
ple lowSam
ple highC
ontrol lowC
ontrol highm
ean[m
in]R
SD[%
]m
ean[m
in]R
SD[%
]m
ean[m
in]R
SD[%
]m
ean[m
in]R
SD[%
]
Asialo-Tf
ND
ND
6.1281.35
ND
ND
6.1261.16
Disialo-Tf
6.3651.42
6.3791.45
6.4101.47
6.3771.25
Trisialo-Tf6.434
1.416.452
1.486.483
1.486.450
1.27Tetrasialo-Tf
6.5761.45
6.5961.52
6.6261.53
6.5931.32
Pentasialo-Tf6.684
1.486.703
1.556.735
1.576.670
1.36H
exasialo-Tf6.794
1.506.813
1.606.848
1.626.808
1.38
a) D
ata of first aliquot of the four samples analyzed each day during the 20 day evaluation period. N
D refers to not detected.

Determination of Carbohydrate-Deficient Transferrin in Human Serum by Capillary Zone Electrophoresis
Christian Lanz Inauguraldissertation, University of Basel Page 51
(Tables 2 and 3). These data indicate that the CE method is highly reproducible andprecise.
During the execution of the precision performance study, reagents were changedon days 5, 11 and 17 and the data of all 20 days were found to be acceptable. The study,i.e. the stability of the system, was surveyed with control charts that included the meanvalue with two, three (warning limit) and four (out-of-control limit) SDs and every fivedays the mean value and the corresponding SD were recalculated of each chart from allacceptable data collected thus far. The study, however, could not be carried out withoutunexpected events. A total of three capillaries were used. Due to sticking of the cap ofthe waste vial to the interface block, the capillary broke on days 3 and 9 and had to bereplaced. Mechanical problems with the sample garage led to the restart of sequences,namely on days 11 (three times), 12 (once), 13 (once), 17 (twice), 18 (once), 19 (once)and 20 (twice). The garage was replaced after completion of the study. There was afailure of current during the analysis of three samples, a current leakage during theanalysis of one sample and higher detection times of the Tf isoforms for one sample.These five samples were reanalyzed at the end of the sequence, i.e. the same day.Furthermore, isoform values were somewhat lower than usual on day 16 (the values ofthe two controls were between –2 SD and –4 SD), but no intervention was necessary.
3.2 Recognition and identification of the transferrin pattern
Recognition and identification of the peaks in the electropherograms thatoriginate from Tf isoforms can be accomplished via assessment of the relative migrationtimes of the Tf isoforms (particularly in relation to tetrasialo-Tf), analysis of the sampleprior and after spiking with a known mixture of Tf isoforms and/or prior and afterimmunosubtraction of Tf, and enzymatic sequential cleavage of sialic acid residues withanalysis of the whole range of samples [9,14,16]. Detections times of Tf isoforms werefound to vary within a very small range only (Tables 2 and 4, [9,16]) and can thustypically be employed for peak assignment. Unambiguous recognition of Tf peaks wasaccomplished via immunosubtraction in free solution using an anti-human Tf antibody.For that purpose, the ratio of the volumes of serum and antibody solution and theincubation conditions had to be optimized. A relative amount of antibody solution thatwas 25 % of the investigated serum was found to be insufficient for a complete removalof the Tf isoforms. Small peaks of tetrasialo- and pentasialo-Tf were detected (Fig. 2A,

Determination of Carbohydrate-Deficient Transferrin in Human Serum by Capillary Zone Electrophoresis
Christian Lanz Inauguraldissertation, University of Basel Page 52
fourth electropherogram from top). The same was true employing equal amounts ofantibody solution and serum (Fig. 2A, third electropherogram from top). Completeimmunosubtraction of Tf isoforms could be obtained using 80 µl of serum and 160 µl ofantibody solution (Fig. 2A, second graph from the top) whereas a further increase of therelative amount of antibody solution did not provide any advantage (Fig. 2A, topelectropherogram). To the contrary, higher amounts of antibody solutions led toelectropherograms that were overloaded with γ-globulins. The impact of the incubation
Figure 2: Immunosubtraction of Tf. A) Electropherogram obtained for a serum of a healthy individual
without Tf antibody pretreatment (bottom graph) and after immunosubtraction using the serum/antibody
solution proportions of 1:4, 1:2, 1:1 and 4:1 (v/v, from top to center, electropherograms plotted with
different y-axis offsets). γ refers to the gamma region and EO marks the electroosmotic flow. B)
Electropherogram of a three-fold diluted serum (top graph, presented with a y-axis shift of 7 mAU; serum
dilution with two aliquots of ferric solution) of a healthy subject (CZE CDT value of 0.88 %) compared to
the data obtained after immunosubtraction of Tf with the reagent volume being twice that of the serum
(bottom graph). C) Electropherogram of an alcohol abuser (CZE CDT value of 13.3 %, presented with a
y-axis shift of 20 mAU) together with data obtained after immunosubtraction of Tf and the experimental
conditions as for panel B. The numbers of all graphs refer to the detected Tf isoforms (for key see Fig. 1).
TIME (min)
5.5 6.0 6.5 7.0
ABSO
RBA
NC
E (m
AU)
0
10
20
30
40
50
TIME (min)
5.0 5.5 6.0 6.5 7.0
ABSO
RBA
NC
E (m
AU)
0
20
40
60
80
100
A B
TIME (min)
5.5 6.0 6.5 7.0
ABSO
RBA
NC
E (m
AU)
-10
0
10
20
30
40
C
62
EO
35
4
γ
4
γ
EO
γ
γ
γ
325
4
6
γ
γ
γ
γ
62
3
4
50

Determination of Carbohydrate-Deficient Transferrin in Human Serum by Capillary Zone Electrophoresis
Christian Lanz Inauguraldissertation, University of Basel Page 53
time interval was studied with the optimized serum/antibody solution ratio. Anincubation time of 1 h was found to be sufficient. No improvement was obtained withlonger incubation times. However, an incubation of 15 min led to incompleteimmunosubtraction (data not shown). Thus, Tf isoforms were immunosubtracted byhaving twice the volume of antibody solution compared to serum, an incubation at roomtemperature for 1 h and centrifugation for 20 min at 8000 g and 4 °C. Fig. 2B and Cdepict electropherograms obtained before and after immunosubtraction of Tf from thesera of a healthy subject and an alcohol abuser, respectively. The identification of thepeak labeled as hexasialo-Tf was found to be somewhat difficult. In some sera thepossibility of an interference in this part of the beta-region cannot be excluded (see Fig.2B, bottom graph).
As has been discussed previously for the P/ACE 5500 [14,16] and also brieflyfor the P/ACE MDQ [9], neuramidase can be employed for the enzymatic cleavage ofthe terminal sialic acid residues of Tf. During hydrolysis, the higher sialylated Tfisoforms are gradually disappearing with time and new peaks are arising around andbefore the position of asialo-Tf as well as between asialo- and disialo-Tf (Fig. 3). Thetransient peak marked with “a” is presumably monosialo-Tf. It is shown to graduallyincrease within the first 20 h and 24 h for the cases of Figs. 3A and 3B, respectively.Then this peak is decreasing and finally vanishing. Peaks “b” and “c” are assumed to beglycosylated and asialylated Tf isoforms. All these peaks can be immunosubtractedusing an antibody against Tf and the patterns observed in our work are comparable tothose reported by Legros et al. [16]. Asialo-Tf is not affected by the neuraminidasehydrolysis. This is nicely illustrated with the 0.33 h to 2.66 h time points of Fig. 3B.According to our data, asialo-Tf gradually becomes part of the growing peak “b”. It is,however, not identical to the isoform of peak b. Using N-glycosidase F to cleave theglycans present in the isoforms of Tf, including those of peaks “b” and “c”, and therebyproducing asialo-Tf did not yet provide the anticipated data. Incubation of serumresulted in small amounts of asiolo-Tf being formed only. Further efforts are required toinvestigate the processes leading to this final proof.
The screening of about 200 sera revealed five electropherograms with two majorand a total of more than six Tf peaks (center graphs of Fig. 4), i.e. patterns that areclearly different compared to those normally observed with the sera of healthy subjectsor alcohol abusers (Figs. 1, 2B and 2C). The area and heights of the two major peaksdetected were found to be about half of the area and height of the tetrasialo-Tf peak of anormal serum pattern, thus supporting the hypothesis that the observed abnormalpatterns belonged to genetic Tf variants. Human Tf is known to show genetic

Determination of Carbohydrate-Deficient Transferrin in Human Serum by Capillary Zone Electrophoresis
Christian Lanz Inauguraldissertation, University of Basel Page 54
polymorphism caused by the substitution of one or more amino acids in the primarystructure of the protein. Up to now, at least 38 genetic Tf variants could be identifiedand only four of these occur with a prevalence of > 1%. Tf variants can be divided intothree groups. Tf-C, the most common phenotype in all populations, encompasses 16distinct subtypes with slightly different isoelectric points, Tf-C1 being that with thehighest prevelance (> 95 %) in Caucasians. Tf-B variants with lower pI values than Tf-Coccur with lower frequencies, whereas genetic Tf-D variants having higher pI values arereported to be rare in Caucasians, but not in some other populations [6,25-27]. Closerinspection of the monitored electropherograms revealed the overall pattern as being a
Figure 3: Electropherograms obtained after enzymatic sequential cleavage of sialic acid residues from
sera of A) a healthy subject with a CZE CDT level of 0.76 % and B) an alcohol abuser with a CZE CDT
value of 8.91 % using A) neuraminidase type X and B) neuraminidase type III. The bottom graphs depict
the patterns obtained without enzyme using the same amount of water instead of the enzyme solution.
Consecutive elecropherograms monitored at the indicated time intervals after commencement of the
enzymatic incubation are presented with y-axis offsets of the x-axis adjusted for equal appearance of the
corresponding peaks. The numbers of the bottom graphs refer to the detected Tf isoforms (for key see Fig.
1).
TIME (min)5.5 6.0 6.5 7.0
ABS
OR
BA
NC
E (m
AU)
0
20
40
60
80
TIME (min)5.5 6.0 6.5 7.0
ABS
OR
BA
NC
E (m
AU
)
0
30
60
90
120
150A B
02
3 45
6
no enzyme
0.33 h
0.66 h
1.66 h
2.66 h
5.0 h
24.0 h
120.0 h
2 3 45
6
no enzyme
0.0 h
0.57 h
2.33 h
4.0 h
20.0 h
21.0 h
23.0 h
26.0 h
28.5 h
ab
c
c
b
ab
a
a
b
c
c
b0

Determination of Carbohydrate-Deficient Transferrin in Human Serum by Capillary Zone Electrophoresis
Christian Lanz Inauguraldissertation, University of Basel Page 55
composite of two Tf patterns with an anodic time shift (shift to the right, center graph ofFig. 4A) or with a cathodic time shift (shift to the left, center graph of Fig. 4B).Immunosubtraction with the anti-human Tf antibody led to electropherograms with nopeaks in the β-region (bottom graphs of Fig. 4) thereby proving the Tf origin of all themonitored peaks. Furthermore, in order to distinguish between the Tf isoforms normallyobserved and those shifted to the right or to the left, the sera were spiked with thecontrol serum of a healthy individual and reanalyzed (top graphs of Fig. 4). B and D Tfvariants could thereby be identified. In four of the five cases, the major peak of theatypical Tf isoforms, considered to be tetrasialo-Tf, eluted about 7 s after thecorresponding peak of the common C-tetrasialo-Tf, thus indicating a shift to the anodicside due to an increase of the electrophoretic mobility (decrease of pI) of the unexpectedisoforms (Fig. 4A, top graph) and the presence of genetic Tf-B variants in these casesoriginating from Tf-BC heterozygote individuals. All peaks present in the
Figure 4: Electropherograms obtained for A) a heterozygous Tf-BC variant and B) a heterozygous Tf-CD
variant monitored without pretreatment (center graphs), after immunosubtraction of Tf (bottom graphs)
and after spiking with the serum of a healthy individual (top graphs). Center and top graphs are presented
with y-axis offsets of A) 8 mAU and 27 mAU, respectively, and B) 7 mAU and 27 mAU, respectively.
TIME (min)5.5 6.0 6.5 7.0
AB
SO
RB
AN
CE
(mA
U)
0
20
40
60
TIME (min)5.5 6.0 6.5 7.0
AB
SO
RB
AN
CE
(mA
U)
0
20
40
60
A B
0C 0B2C
3C
2B
3B+4C 4B+5C
5B+6C6B 2D
3D
2C+3C+4D 4C+6D
5D
5C6Cγ
γ
γγ
γ
γ

Determination of Carbohydrate-Deficient Transferrin in Human Serum by Capillary Zone Electrophoresis
Christian Lanz Inauguraldissertation, University of Basel Page 56
electropherograms could beunambiguously assigned either to a single isoform of one ofthe two genetic Tf alleles (B- or C-Tf variant) or to comigrating isoforms of the two Tfvariants (Fig. 4A). In one case, a shift of the unusual Tf isoforms of about 10 s to thecathodic side was observed (top graph of Fig. 4B). Tf isoforms with shorter migrationtimes compared to those of the common Tf-C can be attributed to the presence of a raregenetic Tf-D variant with isoforms having higher isoelectric points. All peaks could beallocated to single or unresolved isoforms of the Tf-C and Tf-D alleles (Fig. 4B).Although the number of selected individuals in our investigation is too small andheterogeneous to report the prevalence of Tf-BC (about 2 %) and Tf-CD (about 0.5 %)heterozygotes, it can be stated that the occurrence of Tf variants is not negligible. Thesefindings are in agreement with the literature [6,26,27] and of importance for thedetermination of CDT for identification of alcohol abusers.
In [27] it was shown that BC and CD heterozygotes regularly led to low and highCDT results, respectively, when analyzed by any of the commercially availableimmunoassays, with the consecutive possibility of incorrect classification andmisinterpretation of the test result. This is also true for the two samples depicted in Figs.4A and 4B for which the %CDT TIA assay revealed CDT values of 4.6 % and 2.9 %,respectively. These values are higher than the reference value of 2.6 %. Using CZE, theelevated CDT value of the serum of Fig. 4A could be confirmed. The CZE CDT levelwas estimated to be 8.28 %, a value that was composed of the peaks of 0C and 0B andtwice the peak 2C (0C + 0B + 2 x 2C). For the serum of Fig. 4B, however, the CZECDT value of 0.84 % (estimated to represent twice the peak value of 2D) is clearlycomparable to those of individuals without elevated CDT levels (Figs. 1,2,3). In analogyto HPLC [27], CZE is thereby shown to permit proper classification of the CDT patternsof BC and CD heterozygotes alike.
3.3 Recognition and identification of non-transferrin peaks
From the about 200 sera analyzed, selected electropherograms were found tocomprise a peak of varying magnitude that was detected just prior to disialo-Tf (Fig.5A). Immunosubtraction of Tf isoforms and reanalysis revealed that this peak did notbelong to Tf (Fig. 5B, second graph from bottom). The manufacturer of the CEofixCDT-kit indicated that CRP could be responsible for that peak. Thus,immunosubtraction experiments with an anti-human CRP antibody were performed. In a

Determination of Carbohydrate-Deficient Transferrin in Human Serum by Capillary Zone Electrophoresis
Christian Lanz Inauguraldissertation, University of Basel Page 57
first approach, 135µl serum containing a large amount of CRP (120 mg/l, top graph ofFig. 5B) was incubated with 15 µl anti-CRP antibody solution for 30 min at roomtemperature. After centrifugation, 60 µl supernatant was saturated with 60 µl of ferricsolution. Analysis of this sample revealed a decreased peak of interest and an increase ofthe peak of disialo-Tf (Fig. 5B, second graph from top). The cause for the latter factcould be revealed as originating from a component in the anti-CRP antibody solutionthat was found to comigrate with disialo-Tf. The use of a higher amount of antibodysolution led to a complete removal of the CRP peak together with an increasedinterference with disialo-Tf. For sera with smaller amounts of CRP, 5 % (v/v) antibodysolution was found to provide a complete removal, whereas with 2 % (v/v) or less
Figure 5: Electropherograms before and after immunosubtraction of CRP. A) Patterns of sera havingundetectable CRP, 10 mg/l, 34 mg/l, 120 mg/l and 141 mg/l CRP (from bottom to top, respectively; datapresented with y-axis offsets of x-axis adjusted for equal appearance of tetrasialo-Tf). B)Electropherograms of a patient serum containing 120 mg/l CRP, of the same serum afterimmunosubtraction of CRP using 10 % antibody solution, of the same serum after immunosubtraction ofTf, and of the same serum after immunosubtraction of CRP and Tf (from top to bottom, respectively; datapresented with y-axis offsets). The CRP values are those determined with the immunoassay.
TIME (min)5.0 5.5 6.0 6.5 7.0
AB
SO
RB
AN
CE
(mA
U)
0
20
40
60
TIME (min)6.0 6.3 6.6 6.9 7.2
AB
SO
RB
AN
CE
(mA
U)
0
20
40
60
A B
CRP
2
33
γ
CRP
2
5
6
5
6
32
5
6
32
53
3
2 6
5
6
4
CRP
CRP
CRP
γ
γ
γ
2 3
4
5
6
2
4
5
6
CRP
0
4
Determination of Carbohydrate-Deficient Transferrin in Human Serum by Capillary Zone Electrophoresis
Christian Lanz Inauguraldissertation, University of Basel Page 58
insufficient immunosubtraction of CRP was obtained. No improvement was notedwithincubation times longer than 1 h and by incubating the serum with anti-CRPantibody in the presence of iron (data not shown). A procedure for the sequentialremoval of CRP and Tf isoforms in the same serum was developed. In the first step,CRP was removed employing 5 or 10 % (v/v) of the anti-human CRP antibody solution,depending on the amount of CRP present in the serum. One part of the supernatant (50µl) was saturated with an equal amount of ferric solution and analyzed (Fig. 5B, secondgraph from top). The other part of the supernatant (60 µl) was used forimmunosubtraction of Tf (as described in section 2.6). After sequentialimmunosubtraction, CRP and Tf were no longer detected (Fig. 5B, bottom graph).
The CRP peaks in the electropherograms amounted up to 5756 area units (topgraph of Fig. 5A). The CRP level in the four patient sera of Fig. 5A and 14 other serawas determined using a commercial immunoassay with a detection limit of 3 mg/l(normal CRP range: < 5 mg/l) and revealed CRP levels between 4 and 141 mg/l.Regression analysis of the peak areas in the electropherograms (between 433 and 5756area units) with the immunoassay data resulted in a linear relationship (y = 289.1 +43.5x where x represents the immunoassay CRP data) with the correlation coefficient rbeing 0.962. Furthermore, for four sera whose CRP levels could not be determined withthe immunoassay (CRP < 3 mg/l), small peaks (peak areas: 176-831) were detected inthe electropherograms. Thus, the CZE assay appears to be sensitive enough to determineelevated CRP levels in human serum. Based on our current experience, CRP levels up toabout 70 mg/l were found not to interfere with CDT determination. With higher values,resolution between CRP and disialo-Tf was noted to become < 1.24 and thus somewhathampered the exact determination of disialo-Tf. Nevertheless, for the data presented inFig. 5A, classification by CZE revealed data that were in agreement with those assessedby the immunoassays. Elevated CDT values were noted for the sera containing 34 mg/land 120 mg/l CRP (CZE CDT values of 2.36 % and 2.06 %, respectively, and %CDTvalues with the older immunoassay of 9.1 % and 8.0 %, respectively) and normal CDTvalues were obtained for the sera with 10 mg/l and 141 mg/l CRP (CZE CDT values of1.03 % and 0.50 %, respectively, and %CDT values with the newer immunoassay of 1.4% and 1.9 %, respectively).
Four patient sera analyzed with the CZE assay revealed an abnormal pattern inthe γ-region in that a large peak (15 to 35 mAU) was detected in the time windowbetween about 5.2 to 6.0 min (Fig. 6). In one case, the unexpected peak was interfering

Determination of Carbohydrate-Deficient Transferrin in Human Serum by Capillary Zone Electrophoresis
Christian Lanz Inauguraldissertation, University of Basel Page 59
Figure 6: Electropherograms with large, unusual peaks in the γ-region. The insets depict the
immunofixation data.
TIME (min)
5.0 5.4 5.8 6.2 6.6 7.0
AB
SO
RB
AN
CE
(mA
U)
5
15
25
35
45
55
65
75
85
TIME (min)
5.0 5.4 5.8 6.2 6.6 7.0
AB
SO
RB
AN
CE
(mA
U)
5
15
25
35
45
55
65
75
85A B
TIME (min)
5.0 5.4 5.8 6.2 6.6 7.0
AB
SO
RB
AN
CE
(mA
U)
5
15
25
35
45
55
65
75
85
C
TIME (min)
5.0 5.4 5.8 6.2 6.6 7.0
AB
SO
RB
AN
CE
(mA
U)
-5
5
15
25
35
45
55
65
75
D
23
4
56
IgG lambda
γ
5
4
2 63
IgG lambda
532
IgM kappa
4
66
4
325
IgG lambda
γγ
γ
IgG lambda

Determination of Carbohydrate-Deficient Transferrin in Human Serum by Capillary Zone Electrophoresis
Christian Lanz Inauguraldissertation, University of Basel Page 60
Figure 7: CZE electropherograms for the serum of Fig. 6A without immunosubtraction (SPE trace, upper
left panel) and with immunosubtraction prior to analysis (type of subtraction is mentioned in upper right
corner of each panel). Alb, Tf and γ refer to albumin, transferrin and γ-region, respectively.

Determination of Carbohydrate-Deficient Transferrin in Human Serum by Capillary Zone Electrophoresis
Christian Lanz Inauguraldissertation, University of Basel Page 61
with a possible asialo-Tf (Fig. 6B). In another case, a broad peak encompassing thewhole region of γ-globulins from 4.9 to 5.6 min was noted (Fig. 6C). Serum proteinelectrophoresis (Fig. 7) and immunofixation (see insets in Fig. 6) was performed in allcases for further investigation of the nature and the origin of the observed peaks. In twocases, the abnormal serum pattern could be attributed to a monoclonal gammopathie ofan immunoglobulin of the type IgG. Subtype specification revealed IgG lambda for both(Figs. 6A, 6B and Fig. 7). The broad double peak in the serum of Fig. 6C could beidentified as a biclonal gammopathie of two distinct immunoglobulins of the type IgGlambda (see small arrows in the inset), whereas the serum whose electropherogram isdepicted in Fig. 6D was found to represent a monoclonal gammopathie of animmunoglobulin of the type IgM kappa. For the four sera, CZE is predicting a normalCDT value (0.63 %, 0.51 %, 0.67 % and 0.52 % for the data of panels A to D,respectively). Furthermore, a fair number of sera stemming from patients treated at thedepartmental hepatology outpatient clinic were found to contain a broad peakcomigrating with the Tf isoforms whose width was larger than the entire Tf pattern andwhose height is between 5 and 15 mAU. The origin of this abnormality and its influenceon the CDT determination by CZE is currently under investigation and will be thesubject of a forthcoming communication.
4 Conclusions
CZE with the dynamic CEofix double coating performed in the P/ACE MDQpermits the simultaneous, individual, quantitative determination of Tf isoforms inhuman serum and thus CDT. The precision performance assessed over a 20-day periodaccording to the internationally accepted NCCLS EP5-A guidelines revealed the assayas being highly reproducible with within-run and total precision being dependent on theTf isoform level and RSD values ranging between 2.2 and 14.4 % (within-run precision)and 3.6 and 17.6 % (total precision). Inter-day RSD values for asialo-Tf were noted tobe between 9.8 and 11.5 % and for disialo-Tf between 3.8 and 8.6 %, whereas those forCDT levels of 0.88 and 4.31 % of total Tf were determined to be 8.6 and 3.4 %,respectively. RSD values for the isoforms with higher abundance, trisialo-Tf, tetrasialo-Tf, pentasialo-Tf and hexasialo-Tf, were found to be between 0.4 and 4.1 %. Tf patternsare recognized via detection times of Tf isoforms (RSD < 1.7 %) and isoformdistribution, immunosubtraction and enzymatic sequential cleavage of sialic acidresidues. Furthermore, heterozygous Tf-BC and Tf-CD variants are assigned via spikingwith a known mixture of Tf isoforms (e.g. the serum of a healthy Tf-C homozygote).

Determination of Carbohydrate-Deficient Transferrin in Human Serum by Capillary Zone Electrophoresis
Christian Lanz Inauguraldissertation, University of Basel Page 62
Among the non-Tf peaks monitored, the CRP peak detected shortly before disialo-Tfcould be identified by immunosubtraction and CRP peak magnitudes were found tocorrelate well with immunochemically determined CRP serum levels. The CZE assaywith dynamic double coating could thereby be shown to be sensitive enough todetermine elevated CRP levels in human serum. Customary serum protein CZE,immunosubtraction CZE and immunofixation analyses can be employed for theidentification of unusual peaks in the γ-region. Based on our work described in thispaper and previously [9], as well as that of other laboratories [16], it is now clear thatCZE with a dynamic double coating can reliably be employed for the determination ofCDT in human serum. This simple, rapid and highly reproducible CZE assay is anattractive alternative to HPLC and can be employed for both, screening andconfirmation analysis. In analogy to HPLC, it has a high sensitivity (few falsenegatives) and a high specificity (few false positives) [16]. It is important to note that alldata presented here were performed and evaluated according to the recommendations ofthe manufacturer of the CEofix CDT kit. Under these conditions, the separation of di-and trisialo-Tf is typically but not always >1.2 [9]. Thus, baseline resolution betweenthese two peaks was not always obtained and baseline integration with mathematicaldeconvolution would possibly be a more appropriate data evaluation procedure.Alternatively, modifications of the electrophoretic configurations will have to bestudied. Furthermore, before adoption to the routine arena, the reference limit or cutoffvalue for CDT will have to be established. Both of these aspects are currently beinginvestigated in our laboratory.
Acknowledgements
The authors acknowledge the receipt of the Analis CEofix CDT kits from itsmanufacturer (Analis, Namur, Belgium). This work was supported by the LiverFoundation, Bern, Switzerland and the Swiss National Science Foundation.

Determination of Carbohydrate-Deficient Transferrin in Human Serum by Capillary Zone Electrophoresis
Christian Lanz Inauguraldissertation, University of Basel Page 63
References[1] H. Stibler, K.G. Kjellin, J. Neurol. Sci. 30 (1976) 269-285.
[2] H. Stibler, C. Allgulander, S. Borg, K.G. Kjellin, Acta med. Scand. 204 (1978)49-56.
[3] H. Stibler, S. Borg, C. Allgulander, Acta med. Scand. 206 (1979) 275-281.
[4] G. de Jong, H.G. van Eijk, Electrophoresis 9 (1988) 589-598.
[5] H.G. van Eijk, W.L. van Noort, G. de Jong, J.F. Koster, Clin. Chim. Acta 165(1987) 141-145.
[6] T. Arndt, Clin. Chem. 47 (2001) 13-27.
[7] J.-O. Jeppsson, H. Kristensson, C. Fimiani, Clin. Chem. 39 (1993) 2115-2120.
[8] F. Tagliaro, F. Bortolotti, F. Crivellente, F. Cittadini, Forensic Sci. Rev. 12(2000)
134-148.
[9] C. Lanz, M. Kuhn, F. Bortolotti, F. Tagliaro, W. Thormann, J. Chromatogr. A979 (2002) 43-57.
[10] F. Crivellente, G. Fracasso, R. Valentini, G. Manetto, A.P. Riviera, F. Tagliaro,J. Chromatogr. B 739 (2000) 81-93.
[11] F. Tagliaro, F. Bortolotti, M. Zuliani, F. Crivellente, G. Manetto, V.L. Pascali,M. Marigo, J. Cap. Elec. 6 (1999) 137-143.
[12] R.P. Oda, J.P. Landers, Electrophoresis 17 (1996) 431-437.
[13] R.P. Oda, R. Prasad, R.L. Stout, D. Coffin, W.P. Patton, D.L. Kraft, J.F.O’Brien, J.P. Landers, Electrophoresis 18 (1997) 1819-1826.
[14] B. Wuyts, J.R. Delanghe, I. Kasvosve, A. Wauters, H. Neels, J. Janssens, ClinChem. 47 (2001) 247-255.
[15] B.C. Giordano, M. Muza, A. Trout, J.P. Landers, J. Chromatogr. B 742 (2000)79-89.
[16] F.J. Legros, V. Nuyens, E. Minet, P. Emonts, K. Zouaoui Boudjeltia, A. Courbe,J.-L. Ruelle, J. Colicis, F. de L’Escaille, J.-P. Henry, Clin. Chem. 48 (2002)2177-2186.
[17] P.G. Righetti, C. Gelfi, B. Verzola, L. Castelletti, Electrophoresis 22 (2001)603-611.
[18] J. Janssens, R. Chevigne, P. Louis, United States Patent No. 5,611,903, March18, 1997.
[19] H. Katayama, Y. Ishihama, N. Asakawa, Anal. Chem. 70 (1998) 2254-2260.
[20] T.W. Graul, J.B. Schlenoff, Anal. Chem. 71 (1999) 4007-4013.
[21] L. Bendahl, S.H. Hansen, B. Gammelgaard, Electrophoresis 22 (2001) 2565-2573.

Determination of Carbohydrate-Deficient Transferrin in Human Serum by Capillary Zone Electrophoresis
Christian Lanz Inauguraldissertation, University of Basel Page 64
[22] J.W. Kennedy, R.N. Carey, R.B. Coolen, C.C. Garber, H.T. Lee, J.B. Levine,I.M. Osberg, Evaluation of Precision Performance of Clinical ChemistryDevices; Approved Guideline. NCCLS document EP5-A, NCCLS, Wayne, PA,USA, 1999.
[23] W. Thormann, A.B. Wey, I.S. Lurie, H. Gerber, C. Byland, N. Malik, M.Hochmeister, C. Gehrig, Electrophoresis 20 (1999) 3203-3236.
[24] N.-E. Saris (Ed.), J. Clin. Chem. Clin. Biochem. 18 (1980) 69-77.
[25] M.I. Kamboh, R.E. Ferrell, Hum. Hered. 37 (1987) 65-81.
[26] R.E. Gaensslen, S.C. Bell, H.C. Lee, J. Forensic Sci. 32 (1987) 1754-1774.
[27] A. Helander, G. Eriksson, H. Stibler, J.-O. Jeppsson, Clin. Chem. 47 (2001)1225-1233.

Determination of Carbohydrate-Deficient Transferrin in Human Serum by Capillary Zone Electrophoresis
Christian Lanz Inauguraldissertation, University of Basel Page 65
B.3. CAPILLARY ZONE ELECTROPHORESIS WITH ADYNAMIC DOUBLE COATING FOR ANALYSIS OFCARBOHYDRATE-DEFICIENT TRANSFERRIN IN
HUMAN SERUM: IMPACT OF RESOLUTION BETWEENDISIALO- AND TRISIALOTRANSFERRIN ON
REFERENCE LIMITS
Published in: Electrophoresis, 24 (2003) 4272 – 4281

Determination of Carbohydrate-Deficient Transferrin in Human Serum by Capillary Zone Electrophoresis
Christian Lanz Inauguraldissertation, University of Basel Page 66
CAPILLARY ZONE ELECTROPHORESIS WITH ADYNAMIC DOUBLE COATING FOR ANALYSIS OFCARBOHYDRATE-DEFICIENT TRANSFERRIN IN
HUMAN SERUM: IMPACT OF RESOLUTION BETWEENDISIALO- AND TRISIALOTRANSFERRIN ON
REFERENCE LIMITS
Christian Lanz and Wolfgang Thormann
Department of Clinical Pharmacology, University of Bern,
3010 Bern, Switzerland.
Determination of Carbohydrate-Deficient Transferrin in Human Serum by Capillary Zone Electrophoresis
Christian Lanz Inauguraldissertation, University of Basel Page 67
Abstract
Capillary electrophoresis with a dynamic double coating formed by chargedpolymeric reagents represents a very effective tool for the separation of iron-saturatedtransferrin (Tf) isoforms and thus the determination of carbohydrate-deficient transferrin(CDT) in human serum. The resolution between di- and trisialo-Tf is dependent on theapplied voltage and capillary temperature. With a 50 µm I.D. capillary of about 60 cmtotal length mounted into the P/ACE MDQ, 28 kV and 40 °C, the resolution of the twoTf isoforms is shown to be between 1.0 and 1.4, whereas with reduced voltage and/ortemperature, increased resolution at the expense of elongated run times is observed. Bestdata with complete resolution (Rs ≥ 1.4) are obtained at 20 kV and 30 °C. For thedetermination of CDT in serum, incomplete separation of di- and trisialo-Tf isdemonstrated to have an impact on the reference limits. Analysis of the sera of 54healthy individuals with no or moderate alcohol consumption and using valley-to-valleypeak integration, the upper (lower) reference limits for CDT in relation to totaltransferrin at the two power levels are 1.33 (0.52) and 1.57 (0.81) %, respectively,representing intervals that are significantly different (P < 0.001). Furthermore, thereference intervals are shown to be strongly dependent on the peak integration approachused. Valley-to-valley peak integration should only be employed for conditions withcomplete resolution between disialo- and trisialo-Tf.

Determination of Carbohydrate-Deficient Transferrin in Human Serum by Capillary Zone Electrophoresis
Christian Lanz Inauguraldissertation, University of Basel Page 68
1. Introduction
Transferrin (Tf), the most important iron transporting protein, is a glycoproteincomprising several isoforms due to a microheterogeneity of the two carbohydrate sidechains. The two N-glycans are composed of neutral sugars, forming di-, tri-, andtetraantennary structures, and zero up to eight terminal, negatively charged sialic acidresidues [1]. The major Tf isoform, having an isoelectric point (pI) after completesaturation with iron of 5.4 and accounting for about 80 % of the whole Tf in serum,contains four sialic acid residues and is thus referred to as tetrasialo-Tf [2]. In the 1970sStibler et al. reported an increase of less glycosylated and therefore less sialylated Tfisoforms with pI values ≥ 5.7 in the serum and cerebrospinal fluid of patients with achronic, repeated alcohol misuse [3-5]. These isoforms encompass asialo-, monosialo-and disialo-Tf and are collectively referred to as carbohydrate-deficient Tf (CDT). CDTis currently considered as the most specific marker for detecting a chronic, excessivealcohol intake [1]. During the past twenty years, different analytical principles for thedetermination of CDT have been developed, including isoelectric focusing,immunochemical determinations after anion exchange chromatography, highperformance liquid chromatography (HPLC) and capillary electrophoresis (CE) [2,6].CE in fused-silica capillaries employing dynamic capillary coatings for the preventionof proteins from adsorbing to the inner surface of the capillary turned out to be a veryeffective analytical tool for the separation of the major Tf isoforms and thus thedetermination of CDT [2,7-16].
Recently, two amine-based dynamic capillary coatings and a dynamic doublecoating that is based upon proprietary commercial reagents (CEofix-CDT kit suppliedby Analis, Namur, Belgium) were compared and, for the determination of CDT, thelatter approach was determined to provide the best reproducibility and highest detectorresponses of all three methods [15]. To produce the bilayer of the double coating, thefused-silica capillary is first rinsed with an initiator solution containing a polymericpolycation (such as Polybrene) that is adsorbed to the wall surface followed byintroduction of the running buffer with a polymeric polyanion (such aspoly(vinylsulfonate) that is forming a second layer and thus providing the negativecharge for a strong electroosmotic flow towards the cathode. Although completebaseline resolution was not always obtained for all CDT isoforms using the CEofix-CDT reagents, the outstanding precision performance of this commercial kit was shownin a comprehensive study that was based upon the NCCLS EP5-A protocol [16] and thehigh clinical sensitivity and specificity of this method was demonstrated by Legros et al.

Determination of Carbohydrate-Deficient Transferrin in Human Serum by Capillary Zone Electrophoresis
Christian Lanz Inauguraldissertation, University of Basel Page 69
using receiver operating characteristic (ROC) plots [13,14]. The bottleneck of theCEofix-CDT test was identified as being the separation between disialo- and trisialo-Tf[15], but no systematic study about the separation of these two isoforms has beenpublished. Furthermore, except for the estimation of the upper reference limit in therecent work of Legros et al. [14], no careful investigation of the reference limits forCDT has been reported. Thus, efforts were undertaken in our laboratory to improve theresolution of the two isoforms using the CEofix-CDT reagents and to investigate theimpact of their resolution and of different peak integration schemes on the referencelimits for CDT. In this paper, we wish to report our optimization strategy that includes areduction of both the applied voltage and the temperature of the cooling liquidsurrounding the capillary. Employing a reference sample group that was selectedaccording to the guidelines of the NCCLS protocol C28-A2 and the recommendations ofthe international federation of clinical chemistry (IFCC) [17-23], the reference limits ofCDT in human serum for analysis with the CEofix-CDT kit are established anddemonstrated to be dependent on instrumental and peak integration conditions.
2. Materials and Methods
2.1. Reagents, samples and sample preparationBuffers and reagents of the CEofix-CDT kit for the quantitative determination of
CDT with the Beckman Coulter P/ACE MDQ (Kit No. 10-004740) were kindlyprovided by Analis (Namur, Belgium). The initiator solution comprises a pH 4.8 malicacid/arginine buffer with the polycation and the running buffer is a pH 8.5 Tris/boricacid buffer that contains the polyanion. This kit comprises the same running buffer asthat employed by Legros et al. and furnished for the Beckman Coulter P/ACE 5500[13,14]. It is important to note, however, that the buffer is not identical to that employedby Wuyts et al. [10]. Patient sera were obtained from the departmental analyticallaboratory where they were received for determination of CDT. Blood samples (5 mL)of 64 University employees were drawn by a trained nurse or a physician of thehepatology outpatient clinic. They were collected by venipuncture using native plastictubes without additives (Monovette, white cap, Sarstedt, Sevelen, Switzerland) andcentrifuged after clotting at 2’000 g for 10 min. The supernatant was stored in 8.0 mLpolypropylene tubes and CDT was monitored directly after centrifugation or afterstorage at –20 °C. Frozen samples and control sera were defrosted in a water bath at 37°C for 15 min. All samples were vortex mixed. Then, 60 µL of serum or control serumand 60 µL of the ferric solution of the kit (Analis) were combined and vortex mixed in a0.5 mL polypropylene vial, and the vial was put into the corresponding sample tray of
Determination of Carbohydrate-Deficient Transferrin in Human Serum by Capillary Zone Electrophoresis
Christian Lanz Inauguraldissertation, University of Basel Page 70
the P/ACE MDQ (Beckman Coulter, Fullerton, USA). No incubation time for thesaturation of the sample with iron was required.
2.2. Instrumentation, data evaluation and running conditions
CZE analyses were performed on a P/ACE MDQ capillary electrophoresissystem (Beckman Coulter), which was equipped with a fused-silica capillary (PolymicroTechnologies, Phoenix, AZ, USA) of 50 µm I.D. and 60.2 cm (50.0 cm to the detector)total length. In contrast to the previous publications from our group, sample injectionwas not effected from microtiter plates [15,16], but 0.5 mL polypropylene vials with thecorresponding sample tray were used. Samples were introduced by negative pressure of0.3 psi (1 psi = 6894.76 Pa) for 8.0 – 12.5 s, resulting in calculated plug lengths between0.64 and 0.82 % of the effective capillary length. The temperature control of thecapillary cartridge was varied between 20 and 40 °C and the temperature of the sampletray was set to 15 °C. The applied voltage was 20 or 28 kV. A 200 nm interference filterwas used for UV detection.
Data registration and evaluation were carried out with the 32 Karat software,version 4.01 (Beckman). If not stated otherwise, peak areas were determined by valley-to-valley integration and the data were evaluated on the basis of corrected peak areas(peak area divided by detection time). The amount of single Tf isoforms and CDT (sumof asialo- and disialo-Tf) were expressed as area % in relation to the sum of thecorrected peak areas of all detected Tf isoforms. Resolution (Rs) between two peaks wascalculated according to Rs = 1.18 (t2 – t1)/(W0.5(1) + W0.5(2)) where ti and W0.5(i) representdetection time and peak width at half height of the firstly (i = 1) and secondly (i = 2)detected peaks, respectively. An Rs value ≥ 1.40 represents baseline separation. Forcalculation of the theoretical plug length, the CE Expert software, version 1.0(Beckman) was employed.
At the beginning of each day, the capillary was rinsed with 0.2 M NaOH for 5min with a pressure of 20 psi applied from the inlet end, followed by 0.2 M NaOH byapplying simultaneously a pressure of 20 psi from the inlet to the outlet end and aconstant current of 80 µA for 10 min. The same procedure was employed for theconditioning of new capillaries. At the end of a day the capillary was rinsed with 0.2 MNaOH and water for 5 min each with a pressure of 60 psi applied from the inlet end.Capillaries were stored wet with the ends kept in water. Between runs the capillary wasfirst rinsed with 0.2 M NaOH from the inlet to the outlet end with a pressure of 60 psifor 1 min followed by 0.2 M NaOH by simultaneous application of a pressure of 20 psiat the inlet end and a constant current of 80 µA for 1.5 min. At the beginning of a new
Determination of Carbohydrate-Deficient Transferrin in Human Serum by Capillary Zone Electrophoresis
Christian Lanz Inauguraldissertation, University of Basel Page 71
run, the capillary was conditioned by applying a pressure of 15 psi from the inlet sidefirst with the initiator buffer for 1.5 min and then with the run buffer of the CDT kit for2 min.
2.3. Study design for establishment of reference limits
All participants had to fill out a detailed questionnaire and had to sign aninformed consent confirming that they had received and understood the providedinformation and correctly answered to the questions. The questionnaire comprisedgeneral questions about ethnic background, gender, age, body mass, height, last blooddonation, smoking habits, sport and the time point of the last meal before bloodwithdrawal. Other questions dealt with the health (personal feeling, time point andnature of an illness during the three preceding days, chronic or inherited diseases,increased blood fat levels and elevated blood pressure), intake of drugs, hormones andvitamins, and the following of a special diet. Women were asked about pregnancy andlactation. All volunteers had to declare their drinking habits for the last six weeks priorto blood withdrawal. Complete abstainers and people drinking on average less or morethan 20 g pure ethanol daily could thereby be distinguished. Furthermore, allparticipants had to declare whether they wanted to be informed or not in the case of thedetection of an abnormality in their serum pattern. Blood samples and the correspondingenvelopes containing the questionnaire were blinded by the nurse. The key was given tothe physician supervising the investigation. Participants that were considered to behealthy according to the information reported in the questionnaire were included.Smokers, persons taking drugs and those who reported an elevated blood pressure orincreased blood fat levels were not a priori excluded. Exclusion criteria were diagnosisof chronic and systemic illnesses (disorders of the kidney, the liver, the heart, the lung,diabetes mellitus and other metabolic disorders, anemia), recent illnesses, subjectiveindisposition, inherited diseases, pregnancy and lactation. Volunteers reporting adrinking habit of more than 20 g pure ethanol per day were also excluded.
2.4. Statistical treatment
Statistical analyses for the establishment of the CDT reference limits wereperformed using the SPSS for windows student version software, version 10.0.5 (SPSS,Chicago, Illinois, USA). Input groups were compared with the Wilcoxon signed ranktest or the Mann-Whitney rank sum test and each set of data was subjected to theKolmogorov-Smirnov normality test. Boxplots were determined with SigmaStat for
Determination of Carbohydrate-Deficient Transferrin in Human Serum by Capillary Zone Electrophoresis
Christian Lanz Inauguraldissertation, University of Basel Page 72
Windows version 1.0 (Jandel, Corte Madera, CA, USA) and graphical presentationswere made with SigmaPlot for Windows version 4.00 (SPSS).
3. Results and Discussion
3.1. Impact of instrumental conditions on transferrin isoformseparation and precision
In a previous publication it was shown that employing the CEofix-CDT kitaccording to the manufacturer’s instructions resulted in a good but not baselineseparation of di- and trisialo-Tf. For sera of healthy individuals and alcohol abusers, theresolution between these two peaks was noted to be typically <1.3 (Fig. 1A). Loweringthe temperature with otherwise identical conditions led to a better separation betweenthe two isoforms [15]. Thus, the effect of different combinations of temperature andvoltage on run time and the resolution of di- and trisialo-Tf was investigated. Toexclude an impact of the initial sample plug length on the separation, the injection timewas varied between 8 and 12.5 s to obtain a theoretical plug length of about 0.66 % ofthe effective capillary length in all cases (Table 1). It is important to note that theinjected sample volume was somewhat smaller than that introduced using theinstrumental conditions proposed by the manufacturer of the reagent kit (10 s injectionresulting at 40 °C in a theoretical plug length of 0.82 % of the effective capillaryvolume). Table 1 summarizes the performance data obtained in our investigation. Foreach instrumental setting, three measurements with separate sample preparation wereperformed using the serum of an individual with a trisialo-Tf content of about 8 % (Fig.1, top graphs). Typical trisialo-Tf values were found to range between 3.5 and 6.5 %[16,24]. Thus, the trisialo-Tf content of the chosen sample is higher than normal anddoes somewhat hamper the separation of disialo- and trisialo-Tf. According to Helanderet al. it can be classified as a sample with a high trisialo-Tf level (> 7 % of totaltransferrin, frequency of about 1 %) [24].
The shortest detection times and thus the shortest total time of analysis (17.0min) was achieved with 28 kV and a capillary cartridge temperature of 40 C°. Theseconditions led to the highest power level (1.14 W/m) and the worst separation betweendisialo- and trisialo-Tf, with the resolution being 1.267 (95 % confidence interval: 1.230– 1.304). Increasing the migration time by lowering the temperature and / or the voltageprovided an increase of peak resolution between di- and trisialo-Tf and resulted in anaugmentation of the value of disialo-Tf (Table 1). The positive impact on peakseparation by reducing the power level was less pronounced compared to that noted by

Table 1: E
ffect of voltage and temperature on pow
er level, run time, disialo-/trisialo-T
f peak resolution and peak sizes for a serum w
ithabout 8 %
of trisialo-Tf
Instrumental conditions
Monitored param
etersV
oltage
[kV]
Tem
p. a)
[°C]
Injectiontim
e[s]
Sample
plugb)
[%]
Power
level[W
/m]
Detection tim
etetrasialo-T
f c)
[min]
Total analysis
time d)
[min]
Resolution
di-/trisialo-Tf
c)
peak area ofdisialo-Tf c)
[area%]
peak area oftrisialo-T
f c)
[area%]
28.040.0
8.00.66
1.146.61
17.01.27
0.5057.76
28.020.0
12.50.67
0.749.94
20.61.36
0.6447.98
20.040.0
8.00.66
0.579.56
20.11.31
0.7167.96
20.030.0
9.50.64
0.4811.34
22.11.39
0.7088.06
20.020.0
12.50.67
0.3714.02
24.81.39
0.7358.14
a) Temperature of the circulating cooling fluid.
b) Theoretical sample plug length (expressed in %
of effective capillary length, i.e. capillary length between inlet end and detection w
indow) calculated w
iththe C
E Expert, version 1, software (B
eckman).
c) Mean value (n=3).
d) Time interval betw
een the injection of a sample and the introduction of the follow
ing sample in a sequence.

Determination of Carbohydrate-Deficient Transferrin in Human Serum by Capillary Zone Electrophoresis
Christian Lanz Inauguraldissertation, University of Basel Page 74
increasing the migration times, thus indicating that the quality of the separation ofdisialo-Tf is essentially dependent on the time the analyte is migrating in the capillarybfore reaching the detection window. Best results in terms of separation betweendisialo- and trisialo-Tf were obtained with 20 kV and the temperature control of thecapillary cartridge set to 30°C (power level of 0.48 W/m). The resolution between thetwo isoforms was determined to be 1.391 (95 % confidence interval: 1.314 – 1.468).With this configuration baseline resolution of all Tf isoforms was essentially achievedwithin 12.1 min (Fig. 1B). Compared with the data obtained at 28 kV and 40 °C (Fig.1A), the amount of disialo-Tf detected was 40.2 % higher (Table 1). Further decrease of
Figure 1: Typical CZE Tf patterns obtained with a sample containing a low amount of CDT (bottomgraphs), a patient sample with a CDT level above the reference limit (center graphs) and a serum samplewith a normal CDT value and about 8 % trisialo-Tf (top graphs), respectively. CZE analysis wereperformed with an applied voltage of (A) 28.0 and (B) 20.0 kV, a capillary cartridge temperature of (A)40.0 and (B) 30.0 °C, and sample injection at 0.3 psi for (A) 8.0 s and (B) 9.5 s. The CDT values frombottom to top were determined to be (A) 0.90 %, 15.61 % and 0.48 %, respectively, and (B) 1.08 %,15.83 % and 0.65 %, respectively. The electropherograms are presented with y-axis offsets and the x-axisof the second and third electropherograms were adjusted for equal appearance of tetrasialo-Tf. Key: 0:asialo-Tf, 2: disialo-Tf, 3: trisialo-Tf, 4: tetrasialo-Tf, 5: pentasialo-Tf, 6: hexasialo-Tf.
TIME (min)10.2 10.7 11.2 11.7 12.2
ABSO
RB
ANC
E (m
AU
)
-5
10
25
40
55
70
TIME (min)6.0 6.3 6.6 6.9 7.2
ABSO
RB
ANC
E (m
AU)
-5
10
25
40
55
70 A B
0
2 3 45 62 3 4
5 6
32
6
56
4
5
4
23
02
35
2
3
5
6
6

Determination of Carbohydrate-Deficient Transferrin in Human Serum by Capillary Zone Electrophoresis
Christian Lanz Inauguraldissertation, University of Basel Page 75
the capillary temperature to 20 °C did not lead to a further improvement of theseparation between disialo- and trisialo-Tf.
To evaluate the precision performance at the two power levels, customary inter-day and intra-day precision data were assessed with sera containing normal and elevatedamounts of CDT (Table 2). For these experiments, the trisialo-Tf levels were between4.3 and 5.6 % and the sample injection time was 10 s as is recommended by themanufacturer of the reagent kit. For all samples analyzed, the resolution between di- andtrisialo-Tf and thus the accuracy of CDT determination could thereby be shown tobecome significantly improved with operation at reduced voltage and temperature.Complete resolution of di- and trisialo-Tf was noted only for the lower power levelwhich is in agreement with the data of Table 1. Furthermore, for the determination ofCDT at reduced power, the RSD data are shown to become less than half compared tothose obtained under the conditions recommended by the manufacturer. The modifiedinstrumental conditions led to a highly reproducible and stable method with a baselineresolution between di- and trisialo-Tf that is required for the accurate determination ofCDT. This approach with an injection time interval of 9 s is referred to as optimizedmethod in the remainder of this manuscript. Accordingly, the standard method refers tothe conditions at 28 kV, 40 °C and an injection time of 10 s.
3.2. Description of the reference sample group
Clinical chemistry data are intended to assist a diagnosis or to monitor theeffectiveness of a treatment [25] and are compared with a reference interval or areference limit derived from the statistic distribution of the reference values of areference sample group. Based on the internationally accepted guidelines provided inthe protocol NCCLS C28-A2 and the recommendations of the international federationof clinical chemistry [17-23], it was intended to elucidate health-associated referencelimits for CDT. After careful evaluation of the information reported by the 64volunteers, seven samples had to be excluded. Three volunteers reported a drinkinghabit with more than 20 g pure ethanol per day, one participant was pregnant and threepersons stated to have diseases falling under the exclusion criteria. After measurementof the sera of the remaining individuals, three additional persons had to be excluded.Two samples revealed the presence of genetic Tf-B variants from Tf-BC heterozygoteindividuals [10,16,24] and one serum contained a much higher CDT level withdetectable asialo-Tf than all other samples of the reference sample group and had thus tobe excluded after testing for outliers according to the NCCLS protocol [17]. Finally, thedata of 54 persons could be included into the statistical calculations for the

Table 2: T
ypical intra-day and inter-day precision data for CD
Ta)
Instrumental conditions
Intra-day precision (n=8)Inter-day precision (n=8)
Resolution di- / trisialo-T
fC
DT
amount b)
Resolution di- / trisialo-T
fC
DT
amount b)
Voltage
[kV]
Temp. c)
[°°° °C]
Injectiontim
e[s]
Mean (R
SD[%
])95 %
confidenceinterval of
mean
Mean
[area %]
(RSD
[%])
95 %confidenceinterval of
mean [area %
]
Mean
(RSD
[%])
95 %confidenceinterval of
mean
Mean
[area %]
(RSD
[%])
95 % confidence
interval of mean
[area %]
28.040.0
10.01.314 (2.95)
1.282 – 1.3470.939 (6.28)
0.890 – 0.9881.278 (4.15)
1.233 – 1.3220.885 (7.36)
0.831 – 0.94020.0
30.010.0
1.519 (1.88)1.495 – 1.543
1.057 (2.78)1.032 – 1.081
1.504 (1.35)1.486 – 1.521
1.054 (2.07)1.036 – 1.072
28.040.0
10.01.208 (2.24)
1.186 – 1.2314.107 (1.30)
4.062 – 4.1521.266 (2.31)
1.242 –1.2913.907 (4.09)
3.773 – 4.04120.0
30.010.0
1.398 (1.87)1.376 – 1.419
4.561 (1.15)4.517 – 4.605
1.407 (1.50)1.389 – 1.425
4.584 (1.15)4.540 – 4.628
a) O
btained with sam
ples of a healthy individual with a trisialo-Tf level of about 4.3 %
and two different sera containing elevated C
DT levels and trisialo-Tf levels of about
5.6 %.
b) C
alculated as the sum of asialo- and disialo-Tf in relation to total Tf.
c) Tem
perature of the circulating cooling fluid.

Determination of Carbohydrate-Deficient Transferrin in Human Serum by Capillary Zone Electrophoresis
Christian Lanz Inauguraldissertation, University of Basel Page 77
determination of the reference limits of CDT. 53 volunteers were Caucasians and onewas Asian. The 18 males and 36 females had a median age of 34.5 years (range: 22 – 60years) and a median body mass index of 22.5 kg/m2 (range: 17.2 – 26.8 kg/m2). 6 of 54persons reported to be smokers, and 68.5 % of the volunteers (37 people) were regularlyexercising with a median of 3.0 h per week (range: 1 – 20 h per week) and a medianintensity of 5.0 (range from 2 to 10) on a scale from 1 to 10. Blood was withdrawn in amedian 2.5 h (mean 3.9 h, range 0.5 – 17 h) after the last meal or intake of beveragesother than water and all participants reported to feel healthy on the day of bloodwithdrawal. One participant was included with elevated cholesterol, but nobodyindicated having high blood pressure. 13 persons stated to be under long term treatmentwith drugs, with 10 women taking hormones. Other drugs declared were antihistamines,preparations of ginseng and valerian. Additionally, intake of drugs in the last three daysbefore blood withdrawal was reported by seven volunteers. Drugs taken encompassedaspirin, ibuprofen, paracetamol, antiphlogistic eye drops, a combination of antibiotics,proton pump blockers and melatonin. Vitamins were taken by six people, and onevegetarian was participating in the study. 18.5 % (10 persons) of the volunteers wereabstainers and all others reported an alcohol intake of less than 20 g pure ethanol perday.
3.3. Determination of the reference limits of CDT
The reference interval is usually calculated as the central interval of referencevalues and is bracketed by two reference limit values at defined percentiles, thuscovering a defined percentage of the values observed in the reference sample group andpredicted for the reference population [17]. In the case of CDT only the upper referencelimit is important for assisting the diagnosis of an elevated alcohol intake. The referencelimit values were calculated by non-parametric methods from the 2.5th and 97.5th
percentiles of the disialo-Tf reference values of the 54 reference samples (asialo-Tf wasnot detected in these samples) and are thus independent of the underlying distribution. Itwas shown above that the instrumental conditions have an influence on the value ofdisialo-Tf and thus CDT. It was therefore considered to be useful to measure thereference samples at the two different power levels, i.e. the original instrumentalconditions proposed by the manufacturer of the kit (28 kV, 40 °C, 10 s sample injection)and with the optimized method at reduced power (20 kV, 30 °C and 9 s sampleinjection). The obtained disialo-Tf in relation to total Tf data of all 54 samples arepresented in Fig. 2 and Table 3 and are referred to as % CDT. According to theWilcoxon signed rank test, the two groups of input data were determined to be

Determination of Carbohydrate-Deficient Transferrin in Human Serum by Capillary Zone Electrophoresis
Christian Lanz Inauguraldissertation, University of Basel Page 78
statistically different (P < 0.001) and were found to represent normal distributions (P =0.159 and P = 0.084 for the conditions with higher and lower power, respectively).Linear regression analysis of the two sets of data revealed a linear relationship (r =0.904) with a correlation equation of y = 0.95x + 0.30 where x and y refer to the CDTvalues obtained with the standard and optimized methods, respectively. Under 28 kVand 40 °C, the lower and upper reference limits were determined to be 0.52 and 1.33 %,respectively. For operation at 20 kV and 30 °C, the corresponding values werecalculated to be 0.81 and 1.57 %, respectively. Not surprisingly, these values are similarto those obtained with the mean ± 2 to 3 SD (Table 3). It is important to add that thestorage of the sera at –20 °C and reanalysis within one month resulted inindistinguishable data (P=0.114). For our small set of samples and withoutconsideration of other aspects (e.g. age and gender distributions), comparison of thevalues of the teetotalers with those of the moderate drinkers using the Mann-Whitney
Figure 2: Box plots of the CDT data obtained for the 54 reference individuals using the standardconditions (28.0 kV, 40.0 °C, 10 s injection) and the optimized method (20 kV, 30 °C, 9.0 s). “% CDT”refers to area % of disialo-Tf in relation to total Tf and “Tf index” refers to area % of disialo-Tf in relationto tetrasialo-Tf. The box represents the interquartile range with the median. The whiskers extend to the
10th and 90th percentiles.
% C
DT
or T
f ind
ex [%
]
0.0
0.5
1.0
1.5
2.0
2.5
% CDT Tf index % CDT Tf index
Standard Method Optimized Method
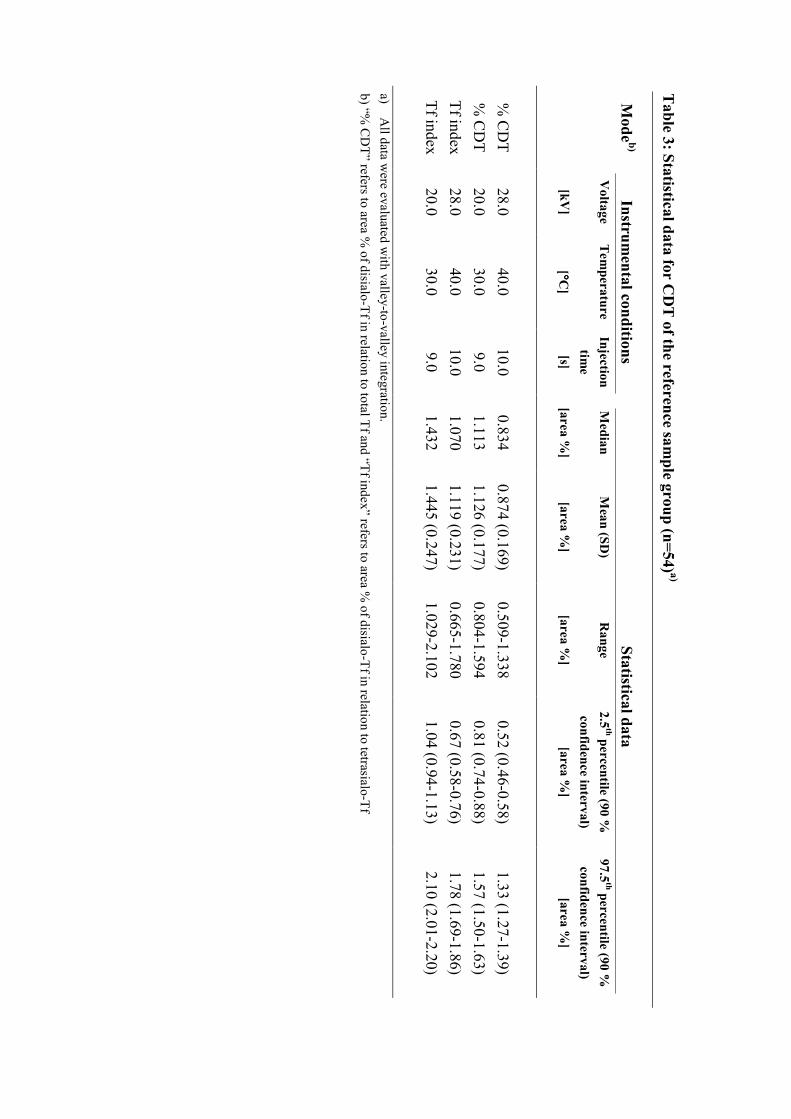
Table 3: Statistical data for C
DT
of the reference sample group (n=54) a)
Mode b)
Instrumental conditions
Statistical dataV
oltage
[kV]
Temperature
[°°° °C]
Injectiontim
e[s]
Median
[area %]
Mean (SD
)
[area %]
Range
[area %]
2.5th percentile (90 %
confidence interval)[area %
]
97.5th percentile (90 %
confidence interval)[area %
]
% C
DT
28.040.0
10.00.834
0.874 (0.169)0.509-1.338
0.52 (0.46-0.58)1.33 (1.27-1.39)
% C
DT
20.030.0
9.01.113
1.126 (0.177)0.804-1.594
0.81 (0.74-0.88)1.57 (1.50-1.63)
Tf index28.0
40.010.0
1.0701.119 (0.231)
0.665-1.7800.67 (0.58-0.76)
1.78 (1.69-1.86)Tf index
20.030.0
9.01.432
1.445 (0.247)1.029-2.102
1.04 (0.94-1.13)2.10 (2.01-2.20)
a) A
ll data were evaluated w
ith valley-to-valley integration.b) “%
CD
T” refers to area % of disialo-Tf in relation to total Tf and “Tf index” refers to area %
of disialo-Tf in relation to tetrasialo-Tf

Determination of Carbohydrate-Deficient Transferrin in Human Serum by Capillary Zone Electrophoresis
Christian Lanz Inauguraldissertation, University of Basel Page 80
rank sum test did not provide a statistical difference (P=0.680). The same was found tobe true for the comparison of the values of the females with those of the males(P=0.251). Using valley-to-valley peak integration as suggested by the manufacturer ofthe reagents, these data clearly indicate that the reference limits for CDT are dependenton the instrumental settings. Incomplete separation of di- and trisialo-Tf results invalues that are lower compared to those when the two isoforms are completely resolved.The same was found to be true for the Tf index [8,15], i.e. data evaluation based uponarea % of disialo-Tf in relation to tetrasialo-Tf (Fig. 2, Table 3).
Based on our data produced under different instrumental conditions, the upperreference limit for %CDT is shown to vary between 1.33 and 1.57 %, values that are inagreement with data produced by HPLC for which upper reference limits are reported tobe between 0.8 and 1.7 % [6,24,26]. Furthermore, corresponding values for the Tf indexwere found to be between 1.78 and 2.10 % with the latter value being close to the 2.27% reported by Tagliaro et al. [8] for a different CE-based assay. The recently reported1.2 % limit that was established on the P/ACE 5500 [14], an instrument that features thesame liquid capillary cooling as the P/ACE MDQ employed in our laboratory, with thesame reagents, indicates an insufficient resolution of di- and trisialo-Tf under theconditions used in that work. It is important to realize that the adoption of this referencelimit could lead to misinterpretation of data. E.g. for a set of 235 patient samplesanalyzed in our laboratory with the method at reduced power, 27.2 % of the patientsamples revealed CDT values between 1.21 and 1.60 %. With a reference limit of 1.60%, these data are considered to be negative, whereas using the 1.2 % reference limit,they would be classified as being positive. Similarly, 8.9 % of the CDT values werebetween 1.41 and 1.60 %.
3.4. Impact of peak integration on CDT value
The data discussed thus far were all generated using valley-to-valley integrationof all Tf isoform peaks. For elucidation of the impact of various peak integrationschemes on the CDT reference limits, the data of the 54 reference samples wereanalyzed by four different approaches that were available with the 32 Karat software ofthe P/ACE MDQ, namely valley-to-valley, baseline, extended baseline and acombination of baseline (for disialo- and trisialo-Tf only) and valley-to-valleyintegration (Fig. 3, Table 4). A sophisticated software for accurate determination of theparameters of unresolved peaks, such as the PeakFit program of Jandel, was not
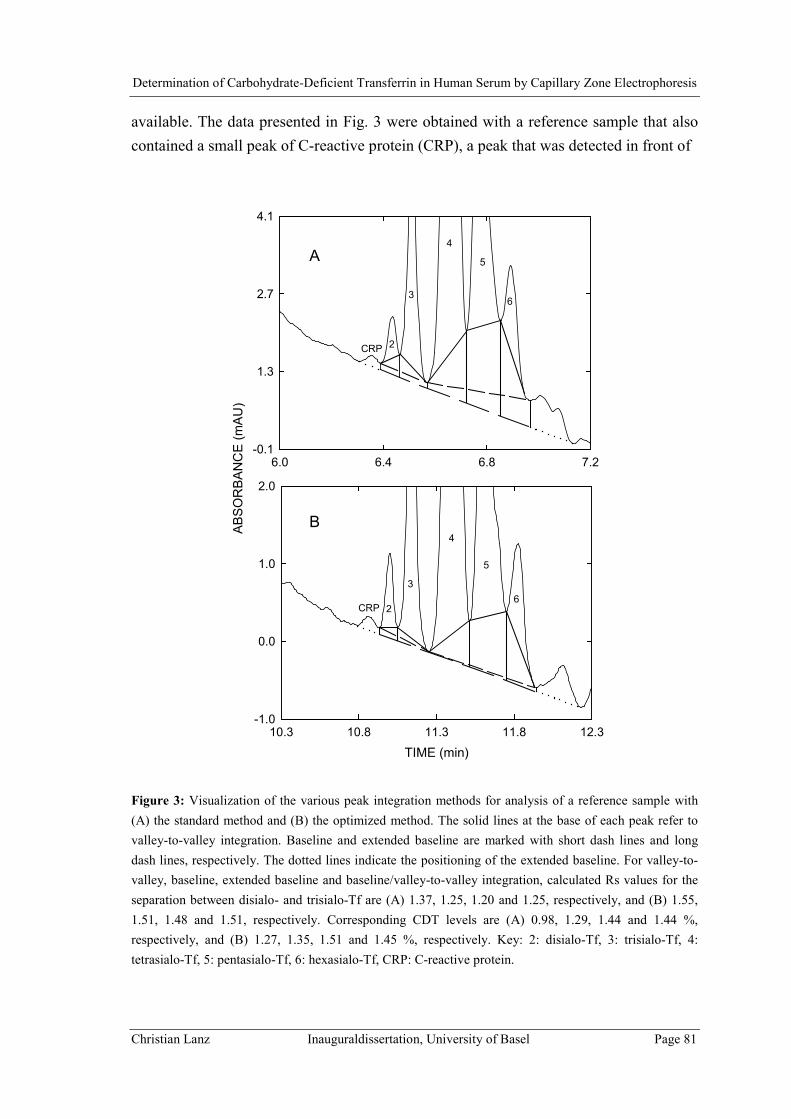
Determination of Carbohydrate-Deficient Transferrin in Human Serum by Capillary Zone Electrophoresis
Christian Lanz Inauguraldissertation, University of Basel Page 81
available. The data presented in Fig. 3 were obtained with a reference sample that alsocontained a small peak of C-reactive protein (CRP), a peak that was detected in front of
Figure 3: Visualization of the various peak integration methods for analysis of a reference sample with(A) the standard method and (B) the optimized method. The solid lines at the base of each peak refer tovalley-to-valley integration. Baseline and extended baseline are marked with short dash lines and longdash lines, respectively. The dotted lines indicate the positioning of the extended baseline. For valley-to-valley, baseline, extended baseline and baseline/valley-to-valley integration, calculated Rs values for theseparation between disialo- and trisialo-Tf are (A) 1.37, 1.25, 1.20 and 1.25, respectively, and (B) 1.55,1.51, 1.48 and 1.51, respectively. Corresponding CDT levels are (A) 0.98, 1.29, 1.44 and 1.44 %,respectively, and (B) 1.27, 1.35, 1.51 and 1.45 %, respectively. Key: 2: disialo-Tf, 3: trisialo-Tf, 4:tetrasialo-Tf, 5: pentasialo-Tf, 6: hexasialo-Tf, CRP: C-reactive protein.
6.0 6.4 6.8 7.2
AB
SO
RB
AN
CE
(mA
U)
-0.1
1.3
2.7
4.1
TIME (min)10.3 10.8 11.3 11.8 12.3
-1.0
0.0
1.0
2.0
2
3
4
5
6
CRP
3
4
26
5
A
B
CRP

Table 4: Im
pact of peak integration on the CD
T values of the reference sam
ple group (n=54) a)
Instrumental C
onditionsPeak integration
Statistical Data
Voltage
[kV]
Tem
p.
[°°° °C]
Injection tim
e[s]
Mean [area %
](95 %
confidenceinterval [area %
])
SD [area %
](R
SD [%
])2.5
th percentile(90 %
confidenceinterval) [area %
]
97.5th percentile
(90 % confidence
interval) [area %]
28.040.0
10.0V
alley-to-Valley b)
0.87 (0.83 – 0.92)0.17 (19.4)
0.52 (0.46 – 0.58)1.33 (1.27 – 1.39)
28.040.0
10.0B
aseline c)1.10 (1.06 – 1.15)
0.16 (14.8)0.76 (0.70 – 0.83)
1.52 (1.46 – 1.58)28.0
40.010.0
Extended Baseline d)
1.14 (1.08 – 1.20)0.21 (18.0)
0.85 (0.77 – 0.93)1.86 (1.78 – 1.94)
28.040.0
10.0B
aseline/Valley e)
1.24 (1.19 – 1.29)0.18 (14.7)
0.85 (0.78 – 0.92)1.70 (1.63 – 1.77)
20.030.0
9.0V
alley-to-Valley b)
1.13 (1.08 – 1.17)0.18 (15.7)
0.81 (0.74 – 0.88)1.57 (1.50 – 1.63)
20.030.0
9.0B
aseline c)1.15 (1.10 – 1.20)
0.17 (15.0)0.79 (0.72 – 0.85)
1.60 (1.53 – 1.67)20.0
30.09.0
Extended Baseline d)
1.20 (1.15 – 1.25)0.18 (15.1)
0.88 (0.81 – 0.95)1.62 (1.55 – 1.69)
20.030.0
9.0B
aseline/Valley e)
1.25 (1.20 – 1.30)0.19 (14.9)
0.86 (0.79 – 0.93)1.72 (1.65 – 1.79)
a) A
ll values refer to “% C
DT” and w
ere calculated as area % of disialo-Tf in relation to total Tf. For a graphical representation of the peak integration schem
es, refer toFig. 3.
b) V
alley-to-valley integration of all Tf isoforms.
c) B
aseline integration of all Tf isoforms.
d) B
aseline integration of all Tf isoforms w
ith extended (optimized) baseline at the beginning and the end of the Tf pattern
e) B
aseline integration of disialo- and trisialo-Tf and valley-to-valley integration of tetrasialo- to hexasialo-Tf
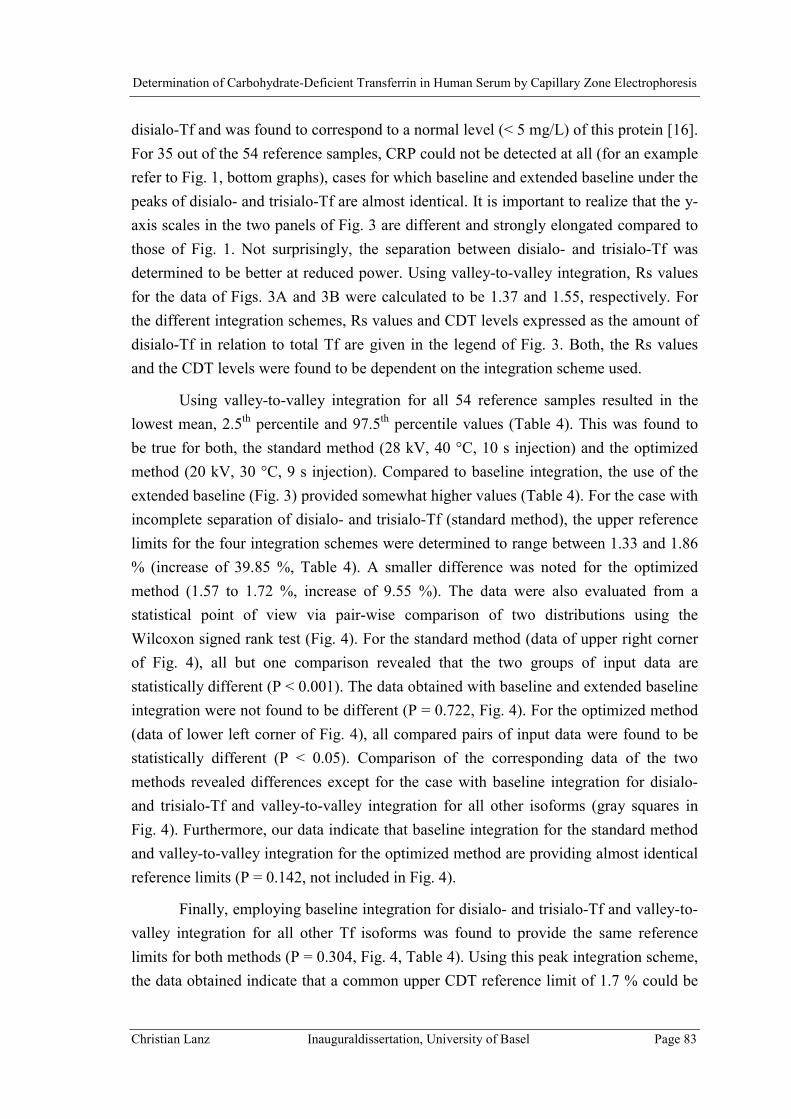
Determination of Carbohydrate-Deficient Transferrin in Human Serum by Capillary Zone Electrophoresis
Christian Lanz Inauguraldissertation, University of Basel Page 83
disialo-Tf and was found to correspond to a normal level (< 5 mg/L) of this protein [16].For 35 out of the 54 reference samples, CRP could not be detected at all (for an examplerefer to Fig. 1, bottom graphs), cases for which baseline and extended baseline under thepeaks of disialo- and trisialo-Tf are almost identical. It is important to realize that the y-axis scales in the two panels of Fig. 3 are different and strongly elongated compared tothose of Fig. 1. Not surprisingly, the separation between disialo- and trisialo-Tf wasdetermined to be better at reduced power. Using valley-to-valley integration, Rs valuesfor the data of Figs. 3A and 3B were calculated to be 1.37 and 1.55, respectively. Forthe different integration schemes, Rs values and CDT levels expressed as the amount ofdisialo-Tf in relation to total Tf are given in the legend of Fig. 3. Both, the Rs valuesand the CDT levels were found to be dependent on the integration scheme used.
Using valley-to-valley integration for all 54 reference samples resulted in thelowest mean, 2.5th percentile and 97.5th percentile values (Table 4). This was found tobe true for both, the standard method (28 kV, 40 °C, 10 s injection) and the optimizedmethod (20 kV, 30 °C, 9 s injection). Compared to baseline integration, the use of theextended baseline (Fig. 3) provided somewhat higher values (Table 4). For the case withincomplete separation of disialo- and trisialo-Tf (standard method), the upper referencelimits for the four integration schemes were determined to range between 1.33 and 1.86% (increase of 39.85 %, Table 4). A smaller difference was noted for the optimizedmethod (1.57 to 1.72 %, increase of 9.55 %). The data were also evaluated from astatistical point of view via pair-wise comparison of two distributions using theWilcoxon signed rank test (Fig. 4). For the standard method (data of upper right cornerof Fig. 4), all but one comparison revealed that the two groups of input data arestatistically different (P < 0.001). The data obtained with baseline and extended baselineintegration were not found to be different (P = 0.722, Fig. 4). For the optimized method(data of lower left corner of Fig. 4), all compared pairs of input data were found to bestatistically different (P < 0.05). Comparison of the corresponding data of the twomethods revealed differences except for the case with baseline integration for disialo-and trisialo-Tf and valley-to-valley integration for all other isoforms (gray squares inFig. 4). Furthermore, our data indicate that baseline integration for the standard methodand valley-to-valley integration for the optimized method are providing almost identicalreference limits (P = 0.142, not included in Fig. 4).
Finally, employing baseline integration for disialo- and trisialo-Tf and valley-to-valley integration for all other Tf isoforms was found to provide the same referencelimits for both methods (P = 0.304, Fig. 4, Table 4). Using this peak integration scheme,the data obtained indicate that a common upper CDT reference limit of 1.7 % could be

Determination of Carbohydrate-Deficient Transferrin in Human Serum by Capillary Zone Electrophoresis
Christian Lanz Inauguraldissertation, University of Basel Page 84
employed. Furthermore, the same was found to be true for data evaluation based uponthe Tf index. The reference intervals for the standard and optimized methods werecalculated to be 1.11 – 2.28 % and 1.11 – 2.29 %, respectively (P = 0.555). Thus, acommon upper reference limit of 2.3 % could be employed for the Tf index. This valueis identical to the 2.27 % reported by Tagliaro et al. [8] for a different CE-based assay.
Figure 4: Statistical data (P values) for data comparison of the 54 reference CDT values obtained with thefour peak integration schemes (Table 4), namely valley-to-valley integration (V/V), baseline integration(B), extended baseline integration (EB) and baseline integration for disialo- and trisialo-Tf and valley-to-valley integration for the other Tf isoforms (B/V). For the standard and optimized methods, the data arecentered around the upper right and lower left corners, respectively, of the overall square. The values inthe gray squares refer to the comparison between the two methods.
V/V B EB B/V
V/V <0.001 <0.001 <0.001 <0.001 V/V
B 0.005 <0.001 0.722 <0.001 B
EB <0.001 <0.001 <0.001 <0.001 EB
B/V <0.001 <0.001 0.020 0.304 B/V
V/V B EB B/V
OP
TIM
IZE
D M
ETH
OD
STA
ND
AR
D M
ETH
OD
STANDARD METHOD
OPTIMIZED METHOD

Determination of Carbohydrate-Deficient Transferrin in Human Serum by Capillary Zone Electrophoresis
Christian Lanz Inauguraldissertation, University of Basel Page 85
4. Concluding remarksAn important prerequisite for the accurate determination of Tf isoforms in serum
is the absence of interfering compounds. Using immunosubtraction of Tf [13-16],comigrating peaks could not be detected. Very high levels of C-reactive proteins andcertain immunoglobulins, however, were previously found to potentially interfere withthe determination of disialo-Tf and asialo-Tf, respectively [16]. For the reference datapresented in this paper, however, all samples were found to be free of theseinterferences. Employing the Analis CEofix-CDT kit on the P/ACE MDQ with therecommended 50 µm I.D. fused-silica capillary of 60.2 cm (50.0 cm to the detector)total length, the resolution between di- and trisialo-Tf was found to be dependent on theapplied voltage and temperature. With the conditions suggested by the manufacturer ofthe kit (28 kV and 40 °C, 10 s sample injection, power level of 1.14 W/m), theresolution was determined to be between 1.0 and 1.4, whereas with reduced voltageand/or temperature, increased resolution at the expense of elongated run times wasobserved. Best data with Rs ≥ 1.4 were obtained at 20 kV and 30 °C (power level of0.48 W/m) and with an injection time interval between 9.0 and 10.0 s. Furthermore,intra-day and inter-day RSD values for the determination of CDT were found to besignificantly lower at the reduced power level.
For the determination of CDT in serum, incomplete separation of di- andtrisialo-Tf is demonstrated to have an impact on the reference limits. Analyzing the seraof 54, carefully selected reference individuals (10 abstainers and 44 persons withmoderate alcohol consumption of < 20 g of ethanol per day who did not reveal anyasialo-Tf in their sera) with valley-to-valley peak integration and expression of disialo-Tf in relation to total Tf, the upper reference limits for the two power levels weredetermined to be 1.33 % and 1.57 %, respectively. The corresponding lower referencelimits were 0.52 and 0.81 %, respectively. From a statistical point of view, the two setsof data are significantly different (P < 0.001). Similarly, such a difference was alsofound for the amount of disialo-Tf in relation to tetrasialo-Tf, the so-called Tf index, forwhich the upper reference limits were determined to be 1.78 and 2.10 %, respectively (P< 0.001). Furthermore, the data obtained indicate that baseline integration for thestandard method and valley-to-valley integration for the optimized method are providingalmost identical reference limits. Using baseline integration for disialo- and trisialo-Tfand valley-to-valley integration for all other Tf isoforms was found to provide the samereference limits for both methods (1.7 % and 2.3 % for CDT data in relation to total Tfand tetrasialo-Tf, respectively).

Determination of Carbohydrate-Deficient Transferrin in Human Serum by Capillary Zone Electrophoresis
Christian Lanz Inauguraldissertation, University of Basel Page 86
Peak integration is shown to have a considerable impact on the reference limits.For the case of incomplete separation between disialo- and trisialo-Tf (such as thestandard method mentioned above) and without employing a sophisticated peakanalyzing software, baseline integration is demonstrated to provide better data thanvalley-to-valley integration. The latter, simpler approach can however be recommendedfor the conditions with complete resolution between di- and trisialo-Tf, such as theoptimized method described in this paper. It is demonstrated in this paper thatoptimization can be reached by reduction of applied electric power and capillarytemperature. Alternatively, improved resolution between di- and trisialo-Tf can also beobtained via elongation of the capillary [15] or, to a lesser degree, via an adjustment ofthe initial sample plug length. Furthermore, as the temperature was found to play a keyrole for the separation of the two isoforms in question and the intracapillary temperatureis strongly dependent on the applied power level and the effectiveness of the heatremoval [27], a method transfer from an instrument featuring liquid capillary cooling toone with forced air thermostating will require a careful selection of the majorparameters such as voltage, temperature and initial sample plug length. The same is truein case of a change of the capillary dimensions and/or material. Thus, in order to avoidthat each laboratory has to elaborate on data evaluation and establishment of referencelimits, CDT by CE should be determined using baseline integration of the disialo- andtrisialo-Tf peaks. Valley-to-valley peak integration should only be employed forconditions with complete resolution between disialo- and trisialo-Tf.
AcknowledgmentsThe authors acknowledge stimulating discussions with Dr. F. Tagliaro and the
receipt of the Analis CEofix CDT kits from its manufacturer (Analis, Namur, Belgium).This work was supported by the Liver Foundation, Bern, Switzerland and the SwissNational Science Foundation.

Determination of Carbohydrate-Deficient Transferrin in Human Serum by Capillary Zone Electrophoresis
Christian Lanz Inauguraldissertation, University of Basel Page 87
References
[1] Arndt, T., Clin. Chem. 2001, 47, 13-27.
[2] Tagliaro, F., Bortolotti, F., Crivellente, F., Cittadini, F., Forensic Sci. Rev. 2000,12, 134-148.
[3] Stibler, H., Kjellin, K.G., J. Neurol. Sci. 1976, 30, 269-285.
[4] Stibler, H., Allgulander, C., Borg, S., Kjellin, K.G., Acta med. Scand. 1978, 204,49-56.
[5] Stibler, H., Borg, S., Allgulander, C., Acta med. Scand. 1979, 206, 275-281.
[6] Jeppsson, J.O., Kristensson, H., Fimiani, C., Clin. Chem. 1993, 39, 2115-2120.
[7] Crivellente, F., Fracasso, G., Valentini, R., Manetto, G., Riviera, A.P., Tagliaro,F., J. Chromatogr. B 2000, 739, 81-93.
[8] Tagliaro, F., Bortolotti, F., Zuliani, M., Crivellente, F., Manetto, G., Pascali,V.L., Marigo, M., J. Cap. Elec. 1999, 6, 137-143.
[9] Oda, R.P., Landers, J.P., Electrophoresis 1996, 17, 431-437.
[10] Wuyts, B., Delanghe, J.R., Kasvosve, I., Wauters, A., Neels, H., Janssens, J.,Clin. Chem. 2001, 47, 247-255.
[11] Giordano, B.C., Muza, M., Trout, A., Landers, J.P., J. Chromatogr. B 2000, 742,79-89.
[12] Beisler, A.T., Kelly, R.H., Landers, J.P., Anal. Biochem. 2000, 285, 143-150.
[13] Legros, F.J., Nuyens, V., Minet, E., Emonts, P., Zouaoui Boudjeltia, K., Courbe,A., Ruelle, J.-L., Colicis, J., de L’Escaille, F., Henry, J.-P., Clin. Chem. 2002,48, 2177-2186.
[14] Legros, F.J., Nuyens, V., Baudoux, M., Zouaoui Boudjeltia, K., Ruelle, J.-L.,Colicis, J., Cantraine, F., Henry, J.-P., Clin. Chem. 2003, 49, 440-449.
[15] Lanz, C., Kuhn, M., Bortolotti, F., Tagliaro, F., Thormann, W., J. Chromatogr. A2002, 979, 43-57.
[16] Lanz, C., Marti, U., Thormann, W., J. Chromatogr. A 2003, 1013, 131-147.
[17] How to define and determine reference intervals in the clinical laboratory;approved guideline-second edition. NCCLS document C28-A2, NCCLS,Wayne, PA, USA
[18] Solberg, H.E., J. Clin. Chem. Clin. Biochem. 1987, 25, 337-342.
[19] PetitClerc, C., Solberg, H.E., J. Clin. Chem. Clin. Biochem. 1987, 25, 639-644.
[20] Solberg, H.E., PetitClerc, C., J. Clin. Chem. Clin. Biochem. 1988, 26, 593-598.
[21] Solberg, H.E., Stamm, D., Eur. J. Clin. Chem. Clin. Biochem. 1991, 29, 531-535.
Determination of Carbohydrate-Deficient Transferrin in Human Serum by Capillary Zone Electrophoresis
Christian Lanz Inauguraldissertation, University of Basel Page 88
[22] Solberg, H.E., J. Clin. Chem. Clin. Biochem. 1987, 25, 645-656.
[23] Dybkær, R., Solberg, H.E., J. Clin. Chem. Clin. Biochem. 1987, 25, 657-662.
[24] Helander, A., Eriksson, G., Stibler, H., Jeppsson, J.-O., Clin. Chem. 2001, 47,1225-1233.
[25] Approved recommendation (1978) on quality control in clinical chemistry. Part1. General principles and terminology. J. Clin. Chem. Clin. Biochem. 1980, 18,69-77.
[26] Turpeinen, U., Methuen, T., Alfthan, H., Laitinen, K., Salaspuro, M., Stenman,U.-H., Clin. Chem. 2001, 47, 1782-1787.
[27] Lacey, M.E., Webb, A.G., Sweedler, J.V., Anal. Chem. 2000, 72, 4991-4998.

Determination of Carbohydrate-Deficient Transferrin in Human Serum by Capillary Zone Electrophoresis
Christian Lanz Inauguraldissertation, University of Basel Page 89
B.4. IMPROVED CAPILLARY ELECTROPHORESISMETHOD FOR THE DETERMINATION OF
CARBOHYDRATE-DEFICIENT TRANSFERRIN INPATIENT SERA
Published in: Electrophoresis, 25 (2004) 2309-2318

Determination of Carbohydrate-Deficient Transferrin in Human Serum by Capillary Zone Electrophoresis
Christian Lanz Inauguraldissertation, University of Basel Page 90
IMPROVED CAPILLARY ELECTROPHORESIS
METHOD FOR THE DETERMINATION OF
CARBOHYDRATE-DEFICIENT TRANSFERRIN IN
PATIENT SERA
Christian Lanz1, Martina Kuhn1, Veronika Deiss2 and Wolfgang Thormann1
1) Department of Clinical Pharmacology, University of Bern,
3010 Bern, Switzerland.
2) Meditest Bulle SA, Bulle, Switzerland.

Determination of Carbohydrate-Deficient Transferrin in Human Serum by Capillary Zone Electrophoresis
Christian Lanz Inauguraldissertation, University of Basel Page 91
Abstract
Capillary electrophoresis with a dynamic double coating formed by chargedpolymeric reagents represents a very effective tool for the separation of iron-saturatedtransferrin (Tf) isoforms and thus the determination of carbohydrate-deficient transferrin(CDT, sum of asialo-, monosialo- and disialo-Tf in relation to total Tf) in human serum.Using the CEofix-CDT reagents, a 50 µm I.D. capillary of 60 cm total length and theP/ACE MDQ under optimized instrumental conditions (20 kV and 30 °C) isdemonstrated to provide outstanding assay precision for the determination of CDT inhuman serum. For CDT levels of 1.0 % and 4.5 %, precision RSD values (n = 8) weredetermined to be < 3.0 % and < 1.5 %, respectively. During the first year of operationunder routine conditions, more than 600 patient samples were analyzed in a total of 62sets of runs. Except for selected samples of patients with severe liver diseases,interference-free Tf patterns were detected. Asialo-Tf was not detected in control seraand in patient sera with a CDT level < 1.70 %, but became detectable in 89.6 % of serawith > 2.3 % disialo-Tf. Monosialo-Tf was only detected in two sera containing > 13.3% CDT. The optimized CZE assay was applied to confirm positive CDT resultsproduced by an immunoassay during long-term monitoring of a patient which led to thedetermination of the elimination kinetics of asialo-Tf, disialo-Tf and CDT after anepisode of high alcohol consumption (estimated apparent half lifes of 4.86, 7.24 and6.74 days, respectively). The optimized CZE assay with an upper reference limit forCDT of 1.70 % represents a very attractive alternative to HPLC. It features simplersample preparation, faster analysis time and higher isoform resolution compared to themost recent HPLC approach and can thus be regarded as a new candidate of a referencemethod for CDT.

Determination of Carbohydrate-Deficient Transferrin in Human Serum by Capillary Zone Electrophoresis
Christian Lanz Inauguraldissertation, University of Basel Page 92
1. Introduction
The abuse of alcohol represents one of the major public health problems in manydifferent cultures with tremendous consequences for society, medicine and economy.Selfreporting of alcohol consumption is notoriously unreliable and the diagnosis ofalcohol abuse based on clinical symptoms is difficult. Therefore, laboratory markers arestrongly required as diagnostic tools for an early and more reliable detection ofexcessive alcohol consumption and alcoholism. A big variety of compounds have beeninvestigated and some of them like gamma-glutamyl transferase, aspartateaminotransferase, alanine aminotransferase and mean corpuscular volume are widelyused in the clinical practice, however with questionable sensitivities and / orspecificities [1-4].
Since its first description in the 1970s by Stibler et. al. [5-7], carbohydrate-deficient transferrin (CDT) has gained more and more attention and importance in thedetection of chronic, heavy alcohol consumption and in the monitoring of alcoholabusers, including the detection of relapse drinking. CDT encompasses isoforms of theglycoprotein transferrin (Tf) with zero up to two sialic acid residues in the carbohydrateside chains of the molecule. Tf, the most important iron transporting protein, containstwo carbohydrate chains with a total of up to eight end-standing sialic acid residues,with the major isoform - accounting for about 80 % of total Tf - being tetrasialo-Tf withfour sialic acid residues [2,8]. Today, CDT is considered as the most specific biologicalmarker for the identification of chronic excessive alcohol intake [8-9].
In the last two decades, different analytical approaches for the quantitativedetermination of CDT in human serum have been developed, including isoelectricfocusing, anion exchange chromatography followed by immunochemicaldeterminations, high performance liquid chromatography (HPLC) and capillary zoneelectrophoresis (CZE) [1,2,4,10-12]. With the adoption of dynamic capillary coatings,preventing proteins from adsorbing to the capillary surface, CZE in fused-silicacapillaries turned out to be a very effective analytical approach for the separation andquantitative determination of the Tf isoforms and thus CDT [2, 13-16]. Recently,commercial reagents producing a dynamic double coating and serving as the separationbuffer (CEofix-CDT kit, Analis, Namur, Belgium) have been introduced and shown toprovide the best performance characteristics in terms of reproducibility, detectorresponse and analysis time [16]. To produce the bilayer of the double coating, the fused-silica capillary is first rinsed with an initiator solution containing a polymeric polycation

Determination of Carbohydrate-Deficient Transferrin in Human Serum by Capillary Zone Electrophoresis
Christian Lanz Inauguraldissertation, University of Basel Page 93
(such as Polybrene) that is adsorbed to the wall surface followed by introduction of therunning buffer with a polymeric polyanion (such as poly(vinylsulfonate) that is forminga second layer and thus providing the negative charge for a strong electroosmotic flowtowards the cathode. Further investigations with this CDT assay revealed outstandingprecision performance according to the internationally accepted National Committee forClinical Laboratory Standards (NCCLS) EP5-A protocol [17] as well as high clinicalsensitivity and specificity that were determined by receiver operating characteristic(ROC) plots [18,19]. The bottleneck of the CEofix-CDT test was identified as being theincomplete separation between di- and trisialo-Tf [16,17], a problem that was recentlyaddressed and optimized via reduction of applied voltage and temperature. In the samework, different peak integration schemes were evaluated and the health associatedreference limits of CDT were determined under different instrumental conditions [20].
In this paper, we wish to report the assessment of the precision performance ofthe optimized CEofix-CDT-based method for the quantification of CDT and to provideinsight into the first experience with this method under routine conditions for screeningand confirmation analysis of CDT in patient sera. A discussion on the occurrence ofasialo- and monosialo-Tf and the long-term monitoring of a patient revealing an episodeof relapse drinking are also presented.
2. Materials and Methods
2.1. Reagents and samplesBuffers and reagents of the CEofix-CDT kit for the quantification of CDT in
human serum with the P/ACE MDQ (Kit No. 10-004740) were obtained from Analis(Namur, Belgium). Rabbit anti-human Tf antibody (titer: 2800 mg/L) was from Dako(Glostrup, Denmark) and 0.9 % sodium chloride solution from Bichsel (Interlaken,Switzerland). Patient sera were from the departmental analytical laboratory where theywere received for determination of CDT. They were stored in 8.0 mL polypropylenetubes at –20 °C. Control sera were divided into 60 µL aliquots and stored in 0.5 mLpolypropylene vials at –20 °C.
2.2. Sample preparation
Frozen samples were defrosted in a water bath at 37 °C for 15 min and vortexmixed for a few seconds. Then, 60 µL of sample and 60 µL of the ferric solution of the

Determination of Carbohydrate-Deficient Transferrin in Human Serum by Capillary Zone Electrophoresis
Christian Lanz Inauguraldissertation, University of Basel Page 94
reagent kit (Analis) were combined in a 0.5 mL polypropylene vial and vortex mixed.No further incubation time for iron saturation of the sample was required, and the vialwas put into the corresponding sample tray of the P/ACE MDQ (Beckman Coulter,Fullerton, USA). For immunosubtraction of Tf, 80 µL of serum was incubated with 160µL of anti-human Tf antibody in a polypropylene vial for 45 min at room temperature.After centrifugation at 8’000 g and 4 °C for 20 min, 60 µL of the supernatant wascollected and combined with 30 µL of the ferric solution. For data comparison withuntreated sample, 30 µL of serum was combined with 60 µL of 0.9 % NaCl solution and45 µL of the ferric solution.
2.3. Instrumentation, data evaluation and running conditions
A P/ACE MDQ capillary electrophoresis system (Beckman Coulter), equippedwith a fused-silica capillary (Polymicro Technologies, Phoenix, AZ, USA) of 50 µmI.D. (375 µm O.D.) and 60.2 cm (50 cm to the detector) total length, was used. Sampleswere introduced from 0.5 mL polypropylene vials by applying a negative pressure of 0.3psi (1 psi = 6894.76 Pa) for 9 – 10 s. The temperature control of the circulating coolingfluid of the capillary cartridge was set to 30.0 °C and the temperature of the sample traywas kept at 15.0 °C. The applied voltage was 20.0 kV, resulting in a current of about14.4 µA and a power level of 0.48 W/m. It is important to note that these instrumentalconditions are different from those proposed by the manufacturer of the CEofix-CDT kitthat were employed in a previous publication [17] and are those found to provideoptimized resolution between disialo- and trisialo-Tf without changing capillarydimensions and running buffer [20]. UV detection was effected with a 200 nminterference filter. The 32 Karat software, version 4.01 (Beckman) was used for dataregistration and evaluation. Peak areas were determined by valley-to-valley integrationand the data were evaluated on the basis of corrected peak areas (peak area divided bydetection time). The amounts of single Tf isoforms and CDT (sum of asialo-,monosialo- and disialo-Tf) were calculated as area % in relation to the sum of thecorrected peak areas of all detected Tf isoforms.
New capillaries were rinsed for 5 min with 0.2 M NaOH with a pressure of 20psi from the inlet end to the outlet end, followed by 0.2 M NaOH by simultaneousapplication of a pressure of 20 psi from the inlet end and a constant current of 80 µA for10 min. The same procedure was employed for the conditioning at the beginning of anew day. At the end of a day, the capillary was rinsed from the inlet to the outlet side

Determination of Carbohydrate-Deficient Transferrin in Human Serum by Capillary Zone Electrophoresis
Christian Lanz Inauguraldissertation, University of Basel Page 95
with 0.2 M NaOH and water for 5 min each with a pressure of 60 psi, and the capillarieswere stored wet with the ends kept in water. Between runs the capillary was first rinsedwith 0.2 M NaOH for 1 min with a pressure of 60 psi applied at the inlet end, followedby 0.2 M NaOH with applying simultaneously a pressure of 20 psi from the inlet to theoutlet end and a constant current of 80 µA for 1.5 min. At the beginning of each run, thecapillary was first conditioned from the inlet side with the initiator buffer by applying apressure of 15 psi for 1.5 min and then with the run buffer for 2 min by applying thesame pressure. All Tf isoforms were detected within 12 min and the total time intervalrequired for analysis and conditioning was 22 min.
2.4. CDT determination with the %CDT TIA test anddetermination of serum alcohol
CDT was determined with the turbidimetric immunoassay %CDT TIA of Axis-Shield (distributed through Bio-Rad, Hercules, CA, USA) according to therecommendations of the kit manufacturer using the Cobas Mira plus (RocheDiagnostics, Rotkreuz, Switzerland). A CDT value < 2.6 % of total Tf was considered tobe within the normal range. Serum alcohol was determined on the Vitros 250 using theVitros ALC slide technology (Ortho Clinical Diagnostics, Neckargemund, Germany).
3. Results and Discussion
3.1. Precision performance and quality controlIt was shown in a previous publication that the CEofix-CDT kit, employed
according to the instructions of the manufacturer, resulted in an excellent precisionperformance. The bottleneck of the assay, however, was identified to be the incompleteseparation of disialo- and trisialo-Tf, with the resolution between these two peaks beingtypically <1.3 for sera of healthy individuals and alcohol abusers [17]. Withoutchanging the capillary dimensions and the composition of the running buffer, baselineseparation of di- and trisialo-Tf could be achieved by lowering the applied voltage andthe temperature of the capillary cartridge [20], resulting in the optimized methoddescribed in this manuscript.
The precision performance of the optimized method in regard to migration timesof Tf isoforms and quantification of single Tf isoforms and CDT was evaluated.Customary intra-day and inter-day precision data were calculated for a serum of a

Determination of Carbohydrate-Deficient Transferrin in Human Serum by Capillary Zone Electrophoresis
Christian Lanz Inauguraldissertation, University of Basel Page 96
healthy volunteer containing a CDT amount below the cut-off value, referred to as“sample low”, and for a patient serum with an elevated CDT level, referred to as“sample high”. Electropherograms of the two sera are depicted in Fig. 1. For the intra-day data, eight samples of each serum were prepared separately and analyzed in oneseries. For the gathering of the inter-day data, one sample of each serum was preparedand analyzed on eight consecutive working days. The precision data are presented inTables 1 and 2. RSD values for the intra-day precision of migration times of all Tf peakswere found to range between 0.18 and 0.29 %. Corresponding values for the inter-daydata were between 0.58 and 0.66 %, values that are more than two-fold lower comparedto those obtained employing the instrumental conditions proposed by the manufacturerreferred to as the standard method [17]. In agreement with previous findings [17], RSDvalues for the quantitative determination of single Tf isoforms and CDT were found tobe dependent on the isoform level, with the lowest RSD values (< 0.26 %) for tetrasialo-
TIME (min)9.2 10.0 10.8 11.6 12.4
-5
5
15
25
35
0.0 2.5 5.0 7.5 10.0 12.5
-10
10
30
50
9.2 10.0 10.8 11.6 12.4
ABSO
RBA
NC
E (m
AU
)
-10
10
30
50
0.0 2.5 5.0 7.5 10.0 12.5-20
-5
10
25
40
2 3 4
5
6
2 30
4
5
6
Tf
EO
γ
EO
Tf
γ
A
B
Figure 1: Typical CZE Tf
patterns obtained with a sample
containing (A) a normal CDT
level of 1.05 % and (B) an
elevated CDT level of 4.6 %. The
inserts depict the entire
electropherograms. EO and γ
refer to electroosmosis peak and
γ-region, respectively. Isoform
levels are given in Table 1 and
experimental conditions are
provided in Sections 2.2 and 2.3.
Key: 0: asialo-Tf, 2: disialo-Tf, 3:
trisialo-Tf, 4: tetrasialo-Tf, 5:
pentasialo-Tf, 6: hexasialo-Tf.
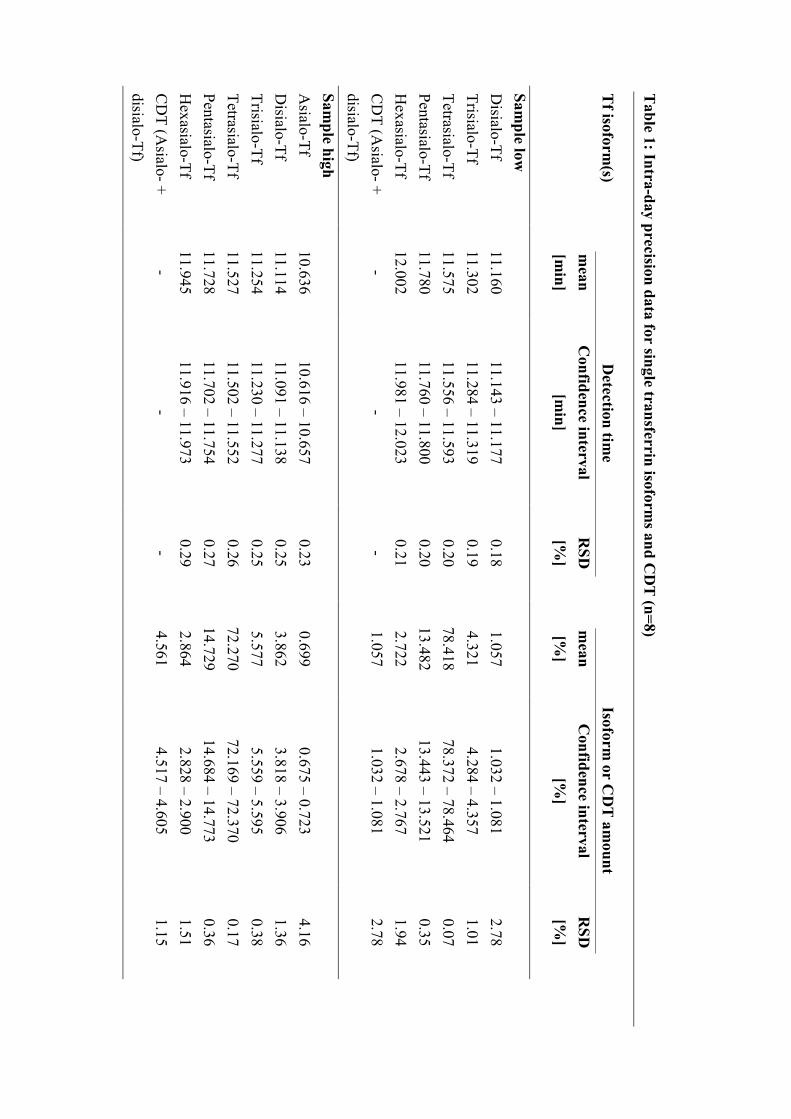
Table 1: Intra-day precision data for single transferrin isoform
s and CD
T (n=8)
Tf isoform
(s)D
etection time
Isoform or C
DT
amount
mean
[min]
Confidence interval
[min]
RSD
[%]
mean
[%]
Confidence interval
[%]
RSD
[%]
Sample low
Disialo-Tf
11.16011.143 – 11.177
0.181.057
1.032 – 1.0812.78
Trisialo-Tf11.302
11.284 – 11.3190.19
4.3214.284 – 4.357
1.01Tetrasialo-Tf
11.57511.556 – 11.593
0.2078.418
78.372 – 78.4640.07
Pentasialo-Tf11.780
11.760 – 11.8000.20
13.48213.443 – 13.521
0.35H
exasialo-Tf12.002
11.981 – 12.0230.21
2.7222.678 – 2.767
1.94C
DT (A
sialo- +disialo-Tf)
--
-1.057
1.032 – 1.0812.78
Sample high
Asialo-Tf
10.63610.616 – 10.657
0.230.699
0.675 – 0.7234.16
Disialo-Tf
11.11411.091 – 11.138
0.253.862
3.818 – 3.9061.36
Trisialo-Tf11.254
11.230 – 11.2770.25
5.5775.559 – 5.595
0.38Tetrasialo-Tf
11.52711.502 – 11.552
0.2672.270
72.169 – 72.3700.17
Pentasialo-Tf11.728
11.702 – 11.7540.27
14.72914.684 – 14.773
0.36H
exasialo-Tf11.945
11.916 – 11.9730.29
2.8642.828 – 2.900
1.51C
DT (A
sialo- +disialo-Tf)
--
-4.561
4.517 – 4.6051.15

Table 2: Inter-day precision data for single transferrin isoform
s and CD
T (n=8)
Tf isoform
(s)detection tim
eIsoform
or CD
T am
ountm
ean[m
in]confidence interval
[min]
RSD
[%]
mean
[%]
Confidence interval
[%]
RSD
[%]
Sample low
Disialo-Tf
11.04510.991 – 11.098
0.581.054
1.036 – 1.0722.07
Trisialo-Tf11.184
11.129 – 11.2390.59
4.3194.278 – 4.360
1.14Tetrasialo-Tf
11.45011.393 – 11.507
0.5978.608
78.461 – 78.7540.22
Pentasialo-Tf11.654
11.596 – 11.7110.59
13.41813.329 – 13.507
0.79H
exasialo-Tf11.873
11.814 – 11.9330.60
2.6022.534 – 2.670
3.11C
DT (A
sialo- +disialo-Tf)
--
-1.054
1.036 – 1.0722.07
Sample high
Asialo-Tf
10.55410.501 – 10.607
0.600.680
0.661 – 0.7003.43
Disialo-Tf
11.02510.967 – 11.083
0.633.904
3.857 – 3.9511.44
Trisialo-Tf11.164
11.105 – 11.2230.63
5.5745.541 – 5.606
0.70Tetrasialo-Tf
11.43211.371 – 11.493
0.6472.529
72.372 – 72.6850.26
Pentasialo-Tf11.631
11.568 – 11.6940.65
14.58114.467 – 14.695
0.94H
exasialo-Tf11.852
11.786 – 11.9170.66
2.7332.649 – 2.816
3.64C
DT (A
sialo- +disialo-Tf)
--
-4.584
4.540 – 4.6281.15

Determination of Carbohydrate-Deficient Transferrin in Human Serum by Capillary Zone Electrophoresis
Christian Lanz Inauguraldissertation, University of Basel Page 99
Tf and the highest for asialo-Tf (< 4.2 %) (Tables 1 and 2). The observed RSD valuesare 2 – 3.5 times lower than those obtained with the standard method [17,20].
The quantification and detection limits for single isoforms were assessed forasialo- and disialo-Tf and determined to be 0.10 % and 0.05 %, respectively. Peaksleading to values lower than 0.10 % were not accounted for the determination of CDT.For the “sample low” with a CDT level of about 1.06 %, no asialo- and monosialo-Tfcould be detected. Intra-day and inter-day RSD values for CDT were found to be 2.78and 2.07 %, respectively. No monosialo-Tf could be detected in the “sample high”whose CDT level was determined to be about 4.6 % and intra-day and inter-day RSDvalues were found to be 1.15 % (Tables 1 and 2).
For internal quality control, a control sample stemming from the serum of ahealthy volunteer was included in each set of runs. The monitored electropherogram didnot exhibit an asialo-Tf peak. In the first year of routine use of the assay, 62 sets ofsamples were analyzed. The same capillary was employed during the entire time periodduring which a total of about 1000 analyses (total of patient, control and researchsamples) were analyzed and there were no instrumental problems. The mean (RSD)disialo-Tf or CDT level calculated from the 62 values was determined to be 1.01 %(3.79 %). Similarly, the mean (RSD) trisialo-Tf amount in the same sample was foundto be 4.19 % (2.24 %). These data document both the excellent precision of the assayand the above discussed dependence of isoform level on the RSD value. Thus, the datagenerated thus far demonstrate that the optimized method is very robust andreproducible.
3.2. Determination of CDT in patient samples
As discussed in detail elsewhere [20], the CDT reference limits were calculatedby non-parametric methods from the 2.5th and 97.5th percentiles of the disialo-Tfreference values of 54 reference samples (asialo-Tf was not detected in these samples)that stemmed from individuals with no or moderate (≤ 20 g ethanol per day) alcoholconsumption. For the optimized separation conditions, the mean of the CDT values was1.13 % (SD: 0.18 %; median: 1.11 %; range: 0.80 – 1.59 %) and the upper (90 %confidence interval) and lower (90 % confidence interval) reference limits weredetermined to be 1.57 % (1.50-1.63 %) and 0.81 % (0.74 – 0.88 %), respectively. Basedon these data, the threshold value used for routine analysis was set to 1.7 % which isessentially the mean + 3SD.

Determination of Carbohydrate-Deficient Transferrin in Human Serum by Capillary Zone Electrophoresis
Christian Lanz Inauguraldissertation, University of Basel Page 100
The optimized CZE assay was introduced as routine method for thedetermination of CDT levels in patient sera in our departmental analytical laboratory.During the first year of operation, more than 600 samples were analyzed. The majorityof samples provided straightforward patterns such as those depicted in Fig. 1. Serawhose electropherograms showed unusual peak distributions were reanalyzed afterimmunosubtraction of Tf (Fig. 2, lower graphs) and/or identified as discussed previously[17] (Fig. 3). A total of 6 sera revealed heterozygous Tf-BC variants (Fig. 3A) and oneserum showed a heterozygous Tf-CD variant. 5 samples comprised elevated peaks in theγ-globulin region (Fig. 3B), and specimens with elevated C-reactive protein (CRP)levels were monitored with a peak detected shortly before disialo-Tf (Fig. 3C).Furthermore, for selected samples stemming from patients treated at the hepatologyoutpatient clinic, a broad interference under the Tf pattern was detected (Fig. 3D).Elevated immunoglobulin A levels are assumed to be the reason for the interference.
9.2 10.0 10.8 11.6 12.4
ABSO
RBA
NC
E (m
AU)
-10
-6
-2
2
6
TIME (min)9.2 10.0 10.8 11.6 12.4
-6.0
-1.0
4.0
9.0
14.0
A
B
0
1
2
3
4
5
6
4
5
6
3
I
Figure 2: Electropherograms
before (upper graphs) and after
(lower graphs) immunosubtraction
of Tf obtained with (A) the serum
of an alcohol abuser that revealed
the presence of monosialo-Tf and
(B) the serum of a patient
comprising an unknown, multiple-
peak interference (marked with I in
lower graph). The CDT level of the
serum whose data are depicted in
panel A was determined to be
18.77 % (14.28 % of disialo-Tf,
3.59 % of asialo-Tf and 0.90 % of
monosialo-Tf). For experimental
conditions refer to Sections 2.2 and
2.3. Key: 0: asialo-Tf, 2: disialo-Tf,
3: trisialo-Tf, 4: tetrasialo-Tf, 5:
pentasialo-Tf, 6: hexasialo-Tf.

Determination of Carbohydrate-Deficient Transferrin in Human Serum by Capillary Zone Electrophoresis
Christian Lanz Inauguraldissertation, University of Basel Page 101
Figure 3: Unusual CZE electropherograms obtained for (A) a heterozygous Tf-BC variant, (B) a sample
with a large peak in the γ-region (IgGlambda, same sample as for Fig. 6A in [15]), (C) a serum with an
elevated CRP level of 93 mg/L, and (D) a serum with a broad interference in the Tf region. For
experimental conditions refer to Sections 2.2 and 2.3. Key: 0: asialo-Tf, 2: disialo-Tf, 3: trisialo-Tf, 4:
tetrasialo-Tf, 5: pentasialo-Tf, 6: hexasialo-Tf.
TIME (min)
8.4 9.4 10.4 11.4 12.4A
BSO
RB
ANC
E (m
AU
)-5
5
15
25
35
TIME (min)
8.4 9.4 10.4 11.4 12.4
AB
SOR
BAN
CE
(mA
U)
-15.0
-7.5
0.0
7.5
15.0
A B
TIME (min)
8.4 9.4 10.4 11.4 12.4
ABSO
RB
ANC
E (m
AU
)
-10
0
10
20
30
40
C
TIME (min)
8.4 9.4 10.4 11.4 12.4
ABSO
RB
ANC
E (m
AU
)
-5
0
5
10
15
20
D
2C3C
4
23
4
5
6
23
4
5
6
4
23
5
6
γ
γ
2B
4C+3
B
5C+4
B6C
+5B
6B
IgG lambda
CRP
γ
γ

Determination of Carbohydrate-Deficient Transferrin in Human Serum by Capillary Zone Electrophoresis
Christian Lanz Inauguraldissertation, University of Basel Page 102
However, our efforts in removing the interfering compounds failed thus far and morework is required for elimination and identification of this problem. Two sera of onepatient drawn 6-month apart revealed the presence of an unknown interference thatprevented the determination of CDT with this assay (Fig. 2B).
The levels of asialo- and disialo-Tf of part of the 589 patient samples aredepicted in Fig. 4 (presented in the order of increasing disialo-Tf values) and thefrequency diagrams of disialo-Tf and CDT levels of all 589 samples are shown in Fig. 5.Disialo-Tf levels ranged between 0.31 and 14.41 % (mean: 1.52 %, median: 1.18 %),asialo-Tf was detected in 71 samples whereas asialo-Tf was quantitated in 49 sera(range: 0.14 – 3.63 %, mean: 0.85 %, median: 0.41 %). CDT levels were found to bebetween 0.31 and 18.04 % (mean: 1.59 %, median: 1.18 %). In serum samples revealingCDT levels below the upper reference limit determined for this assay (1.70 %, total of479 samples), no asialo-Tf was detected. The same was essentially found to be true forsamples with disialo-Tf levels below 2.30 % (up to sample 522). Up to this level, smallasialo-Tf peaks could be monitored in 11 (quantitated in 2) sera only (Fig. 4). Asialo-Tfwas detected in 60 (quantitated in 47) of the 67 samples with disialo-Tf levels > 2.30 %.The fact that in some cases even in sera with CDT levels up to 3.71 % no asialo-Tf was
Figure 4: Disialo-Tf (circles) and asialo-Tf (triangles for detectable peaks between 0.05 and 0.1 % and
squares for quantitated peaks ≥ 0.1 %) levels of the samples 440 to 589 presented in the order of
increasing disialo-Tf values.
SAMPLE NUMBER440 465 490 515 540 565 590
TF IS
OFO
RM
(%)
0.0
3.0
6.0
9.0
12.0
disialo-Tf
asialo-Tf

Determination of Carbohydrate-Deficient Transferrin in Human Serum by Capillary Zone Electrophoresis
Christian Lanz Inauguraldissertation, University of Basel Page 103
present may be explained by the inter-individualvariation of the response in CDTisoform formation [21,22].
In a patient sample with a CDT value of 18.77 % (14.28 % of disialo-Tf, 3.59 %of asialo-Tf), monosialo-Tf was detected with a relative amount of 0.90 % (Fig. 2A,upper graph). Based on the data obtained after immunosubtraction (Fig. 2A, lowergraph), and from the pattern change obtained after neuraminidase treatment [17], thepeak detected after 10.81 min (relative migration time compared to tetrasialo-Tf of0.939) was assigned to monosialo-Tf. Mårtensson et al. [23] reported monosialo-Tf tobe present in trace amounts in the sera of social drinkers. These monosialo-Tfconcentrations are believed to be below the detection limit of our CZE assay.Furthermore, the monosialo-Tf increase during chronic alcohol consumption is reportedto be much less pronounced compared to the increase of the other CDT isoforms [23].These data are in good agreement with our findings as no peak could be attributed tomonosialo-Tf in samples with CDT levels < 13.3 %. It can be speculated that
0.66 2.78 4.89 7.01 9.12 11.24 13.350
10
20
30
40
0.66 3.13 5.60 8.06 10.53 13.000
50
100
150
200
250
CDT (%)0.75 3.41 6.07 8.73 11.39 14.05 16.71
0
10
20
30
40
0.75 3.86 6.96 10.06 13.16 16.270
50
100
150
200
250
300
FREQ
UE
NC
Y
A
B
Disialo-Tf (%)
1.7 %
1.7 %
Figure 5: Frequency diagrams of
(A) disialo-Tf and (B) CDT levels
of the 589 patient samples. The
widths of the bars are 0.35 and 0.44
%, respectively.
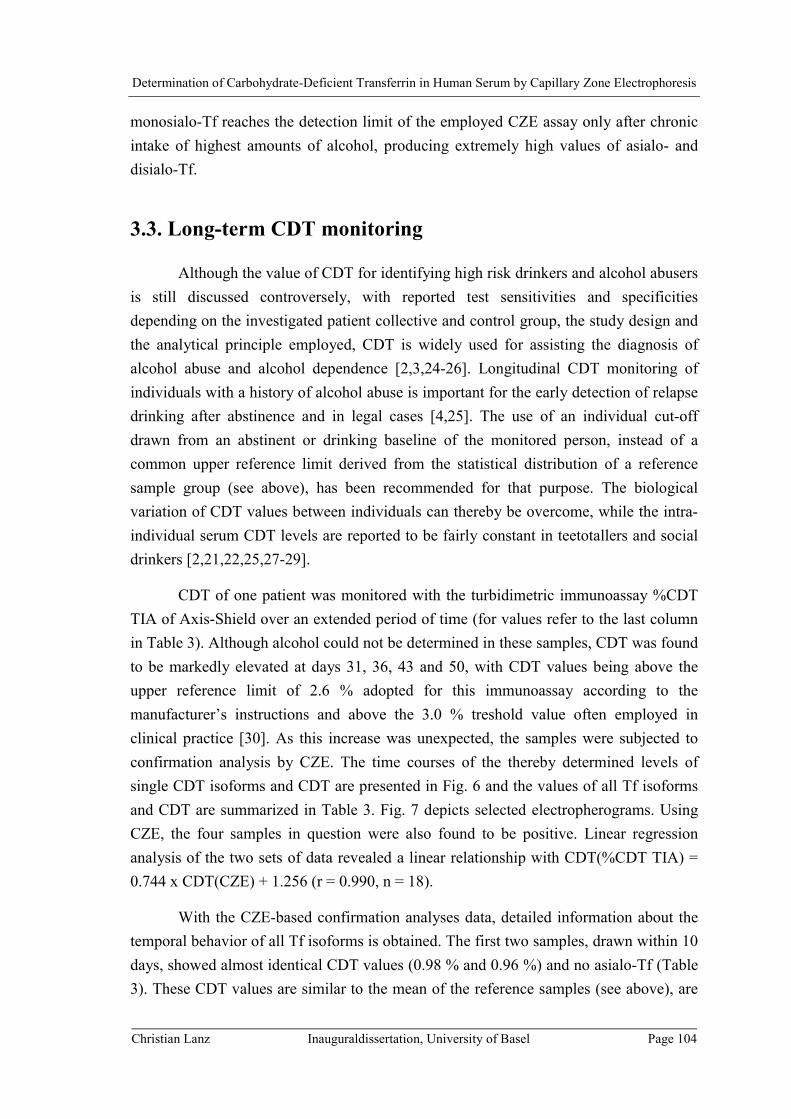
Determination of Carbohydrate-Deficient Transferrin in Human Serum by Capillary Zone Electrophoresis
Christian Lanz Inauguraldissertation, University of Basel Page 104
monosialo-Tf reaches the detection limit of the employed CZE assay only after chronicintake of highest amounts of alcohol, producing extremely high values of asialo- anddisialo-Tf.
3.3. Long-term CDT monitoring
Although the value of CDT for identifying high risk drinkers and alcohol abusersis still discussed controversely, with reported test sensitivities and specificitiesdepending on the investigated patient collective and control group, the study design andthe analytical principle employed, CDT is widely used for assisting the diagnosis ofalcohol abuse and alcohol dependence [2,3,24-26]. Longitudinal CDT monitoring ofindividuals with a history of alcohol abuse is important for the early detection of relapsedrinking after abstinence and in legal cases [4,25]. The use of an individual cut-offdrawn from an abstinent or drinking baseline of the monitored person, instead of acommon upper reference limit derived from the statistical distribution of a referencesample group (see above), has been recommended for that purpose. The biologicalvariation of CDT values between individuals can thereby be overcome, while the intra-individual serum CDT levels are reported to be fairly constant in teetotallers and socialdrinkers [2,21,22,25,27-29].
CDT of one patient was monitored with the turbidimetric immunoassay %CDTTIA of Axis-Shield over an extended period of time (for values refer to the last columnin Table 3). Although alcohol could not be determined in these samples, CDT was foundto be markedly elevated at days 31, 36, 43 and 50, with CDT values being above theupper reference limit of 2.6 % adopted for this immunoassay according to themanufacturer’s instructions and above the 3.0 % treshold value often employed inclinical practice [30]. As this increase was unexpected, the samples were subjected toconfirmation analysis by CZE. The time courses of the thereby determined levels ofsingle CDT isoforms and CDT are presented in Fig. 6 and the values of all Tf isoformsand CDT are summarized in Table 3. Fig. 7 depicts selected electropherograms. UsingCZE, the four samples in question were also found to be positive. Linear regressionanalysis of the two sets of data revealed a linear relationship with CDT(%CDT TIA) =0.744 x CDT(CZE) + 1.256 (r = 0.990, n = 18).
With the CZE-based confirmation analyses data, detailed information about thetemporal behavior of all Tf isoforms is obtained. The first two samples, drawn within 10days, showed almost identical CDT values (0.98 % and 0.96 %) and no asialo-Tf (Table3). These CDT values are similar to the mean of the reference samples (see above), are

Table 3: L
evels of Tf isoforms and C
DT
of a patient over a period of 134 days
capillary electrophoresis%
CD
T T
IAT
ime
[day]A
sialo-Tf
[%]
Disialo-T
f[%
]T
ri-sialo-Tf
[%]
Tetra-sialo-T
f[%
]Penta-sialo-T
f[%
]H
exa-sialo-Tf
[%]
CD
T[%
]C
DT
[%]
1N
D0.98
7.2675.15
13.543.07
0.982.23
10N
D0.96
7.1875.00
13.743.11
0.961.74
312.68
8.866.40
65.9213.54
2.5911.54
9.3936
1.124.94
8.4669.73
12.932.82
6.066.35
430.46
2.978.29
72.7412.86
2.683.43
4.2950
0.171.90
7.4974.90
12.972.58
2.073.29
57N
D1.64
6.9675.03
13.702.67
1.642.52
64N
D1.37
7.0775.24
13.822.50
1.372.34
71N
D1.20
7.2975.58
13.602.33
1.202.14
78N
D1.02
7.0775.77
14.072.07
1.021.92
86N
D0.97
7.4375.30
13.342.96
0.971.94
93N
D0.94
6.5076.69
13.792.08
0.941.79
100N
D1.03
7.3875.79
13.432.37
1.031.95
106N
D0.95
6.5976.38
13.632.44
0.951.81
113N
D0.97
6.7376.28
13.652.37
0.971.89
120N
D0.98
6.6276.77
13.402.24
0.981.75
127N
D0.93
6.2876.71
13.792.30
0.931.78
134N
D1.00
6.2676.68
13.522.53
1.001.80

Determination of Carbohydrate-Deficient Transferrin in Human Serum by Capillary Zone Electrophoresis
Christian Lanz Inauguraldissertation, University of Basel Page 106
far below the upper reference limit of the method (1.70 %) and are considered torepresent the baseline value of this patient (see below). Three weeks later, about atwelve-fold increase of CDT (11.54 %) with detectable asialo-Tf (2.68 %) wasmonitored. Thereafter, a continuous decrease of the levels of asialo-Tf, disialo-Tf andthus CDT was noticed during the following 7 weeks, reaching the previous baselinevalue of CDT at day 78 (Fig. 6A). CDT levels above the cutoff value of 1.70 % wereobtained up to day 50. Asialo-Tf was detected in the same time interval and monosialo-Tf could not be detected at any time. From days 57 – 71, CDT was below the upperreference limit of the assay (1.70 %) but above the individual patient’s baseline value.The level of asialo-Tf was found to decrease exponentially (Fig. 6B). Using a PCcompatible, one-compartment model for elimination of an exogenous compound (Excel97 SR2, PK functions for Microsoft Excel, www.boomer.org), the apparent half life ofthe elimination was determined to be 4.86 days. Disialo-Tf and CDT serum levels didnot decrease in the same manner (Fig. 6B) and apparent half lifes were estimated to be
Figure 6: CZE data of long-term
CDT monitoring: Disialo-Tf
(circle), asialo-Tf (square) and
CDT (diamond) levels of a patient
determined by CZE during a 134-
day period. The data in panel B are
the same as those of panel A but
presented in a semi-log format.
The straight line in panel B
represents the regression line for
asialo-Tf (y=-0.0619x + 2.3196,
r=0.9984).
0 20 40 60 80 100 120 140
Tf IS
OFO
RM
OR
CD
T (%
)
0.0
3.0
6.0
9.0
12.0
TIME (day)0 20 40 60 80 100 120 140
0.1
1.0
10.0
A
B

Determination of Carbohydrate-Deficient Transferrin in Human Serum by Capillary Zone Electrophoresis
Christian Lanz Inauguraldissertation, University of Basel Page 107
7.24 and 6.74 days, respectively. These values compare well with those reported in theliterature [1-4,31].
Figure 7: Selected electropherograms for the data of Fig. 6. The data are presented with y-axis offsetsand the x-axis being adjusted for equal appearance of tetrasialo-Tf. For experimental conditions refer toSections 2.2 and 2.3. Key: 0: asialo-Tf, 2: disialo-Tf, 3: trisialo-Tf, 4: tetrasialo-Tf, 5: pentasialo-Tf, 6:hexasialo-Tf.
TIME (min)9.2 10.0 10.8 11.6 12.4
ABS
OR
BAN
CE
(mAU
)
-10
5
20
35
50
23
45
6day 10
day 31
day 36
day 43
day 50
day 57
day 64
day 71
day 78
0
23
4
5
6

Determination of Carbohydrate-Deficient Transferrin in Human Serum by Capillary Zone Electrophoresis
Christian Lanz Inauguraldissertation, University of Basel Page 108
The mean value of the 11 baseline values (samples at days 1, 10, and 78 to 134)was calculated to be 0.98 % ± 0.03 %. The considerably smaller variation compared tothat reported by Borg et al. [28] can at least partly be attributed to the much higherreproducibility of the CZE assay (see section 3.1.) compared to that of the immunoassayfor which an assay precision of 10 % is reported. Adopting the method described in [28]for identification of relapse drinking, namely an increase of CDT from the minimum orbaseline value of three or four times the coefficient of variation of the baseline values,would lead to a cut-off level for this patient of 1.07 to 1.10 %. These findings are ingood agreement with the data of Anton et al. who reported a mean elevation of CDTlevels of 10 % among relapse drinkers during a twelve week outpatient trial [22].
Trisialo-Tf values varied between 6.26 and 8.46 % (mean: 7.07 %, RSD: 8.77%). For the 11 samples with baseline CDT values, mean and RSD were determined tobe 6.85 % and 6.28 %, respectively. The highest trisialo-Tf level was detected for thesample at day 36 with its value being 23.5 % above the mean value of the samples withbaseline CDT. Whether this small increase can be attributed to an effect related to thealcohol intake is unclear. In agreement with the literature, no significant change in thetrisialo-Tf levels could otherwise be observed [8,32,33]. Not surprisingly, compared todisialo-Tf, tetrasialo-Tf and to a much smaller extent pentasialo-Tf showed a reciprocalchange of the relative amount. The lowest value of tetrasialo-Tf (13.3% below the 76.09% mean value of the 11 samples with baseline CDT values) was noticed when CDT washighest (day 31), while the lowest value of pentasialo-Tf (5.6 % less than the 13.63 %mean value of samples revealing baseline values of CDT) was determined with a timeshift of twelve days (day 43). Hexasialo-Tf did not change significantly during theentire episode.
There is still some confusion about the daily amount of ethanol and the durationof regular alcohol intake needed to elevate CDT. Reports claiming that daily intake of50 – 80 g pure ethanol over a period of at least one week resulted in increased CDTlevels [1-4,7,34] are contradicted by drinking experiments with healthy individuals,concluding that an intake of up to 60 – 80 g ethanol per day for three weeks did notincrease CDT [35] or showed a significant but only moderate elevation withoutreaching the upper reference limit for most individuals [36]. It was speculated that theresponse of CDT to alcohol consumption of subjects with no drinking history may bedifferent from that of individuals with alcohol dependence, leading to sensitizationcaused by regular drinking [3,22,35,37,38]. The huge increase of CDT found in themonitored patient was unexpected and can only be a result of very high alcoholconsumption between days 10 and 31.
Determination of Carbohydrate-Deficient Transferrin in Human Serum by Capillary Zone Electrophoresis
Christian Lanz Inauguraldissertation, University of Basel Page 109
4. Concluding remarks
Using the CEofix-CDT reagents and the P/ACE MDQ under optimizedinstrumental conditions (20 kV and 30 °C) is demonstrated to provide outstanding assayprecision for the determination of CDT in human serum. Compared to the conditionsrecommended by the kit manufacturer (28 kV and 40 °C), resolution between diasilo-and trisialo-Tf is improved and complete such that the CDT relevant Tf isoforms can bequantitated precisely. Intra-day and inter-day precision data for asialo- and disialo-Tfwere found to be isoform level dependent. For isoform levels of about 0.7 %, 1.0 % and4.0 %, RSD values (n = 8) were determined to be < 4.2 %, < 3.0 % and < 1.5 %,respectively. During the first year of operation under routine conditions, more than 600patient samples were analyzed in a total of 62 sets of runs and without changing thecapillary. The control sample analyzed in this one-year period (n = 62) revealed RSDvalues of 3.79 % and 2.24 % for mean isoform levels of 1.01 % and 4.19 %,respectively. Except for selected samples received from patients being treated at thehepatology outpatient clinic, interference-free Tf patterns were detected. Asialo-Tf wasnot detected in control sera and in patient sera with a CDT level < 1.70 %, but becamedetectable in 89.6 % of sera with > 2.3 % disialo-Tf. Monosialo-Tf was only detected ina few sera containing > 13.3 % CDT. The optimized CZE assay was applied to confirmpositive CDT results produced by an immunoassay during long-term monitoring of apatient which led to the determination of the elimination kinetics of asialo-Tf, disialo-Tfand CDT after an episode of high alcohol consumption. Apparent elimination half lifescould thereby be estimated to be 4.86, 7.24 and 6.74 days, respectively. The optimizedCZE assay with an upper reference limit for CDT of 1.70 % represents a very attractivealternative to HPLC. It features simpler sample preparation, faster analysis time, higherisoform resolution and much simpler column reconditioning compared to the mostrecent improved HPLC approach [12]. The CZE approach can thus be employed forboth, screening and confirmation analysis alike and fulfills the requirements of areference method for CDT. The improved assay could also be used for legal cases inforensics.
AcknowledgementsThe authors acknowledge the stimulating discussions with Prof. B.H. Lauterburg
and the calculation of the kinetic data by Dr. S. Russmann. This work was supported byAnalis (Namur, Belgium), the Liver Foundation (Bern, Switzerland) and the SwissNational Science Foundation.

Determination of Carbohydrate-Deficient Transferrin in Human Serum by Capillary Zone Electrophoresis
Christian Lanz Inauguraldissertation, University of Basel Page 110
References
[1] Musshoff, F., Daldrup, Th., J. Chromatogr. B 1998, 713, 245-264.
[2] Tagliaro, F., Bortolotti, F., Crivellente, F., Cittadini, F., Forensic Sci. Rev. 2000,12, 134-148.
[3] Sharpe, P.C., Ann. Clin. Biochem. 2001, 38, 652-664.
[4] Musshoff, F., J. Chromatogr. B 2002, 781, 457-480.
[5] Stibler, H., Kjellin, K.G., J. Neurol. Sci. 1976, 30, 269-285.
[6] Stibler, H., Allgulander, C., Borg, S., Kjellin, K.G., Acta med. Scand. 1978, 204,49-56.
[7] Stibler, H., Borg, S., Allgulander, C., Acta med. Scand. 1979, 206, 275-281.
[8] Arndt, T., Clin. Chem. 2001, 47, 13-27.
[9] Meerkerk, G-J., Njoo, K.H., Bongers, I.M.B., Trienekens, P., van Oers, J.A.M.,Alcohol. Clin. Exp. Res. 1998, 22, 908-913.
[10] Jeppsson, J.O., Kristensson, H., Fimiani, C., Clin. Chem. 1993, 39, 2115-2120.
[11] Helander, A., Eriksson, G., Stibler, H., Jeppsson, J.-O., Clin. Chem. 2001, 47,1225-1233.
[12] Helander, A., Husa, A., Jeppsson, J.-O., Clin. Chem. 2003, 49, 1881-1890.
[13] Oda, R.P., Landers, J.P., Electrophoresis 1996, 17, 431-437.
[14] Crivellente, F., Fracasso, G., Valentini, R., Manetto, G., Riviera, A.P., Tagliaro,F., J. Chromatogr. B 2000, 739, 81-93.
[15] Giordano, B.C., Muza, M., Trout, A., Landers, J.P., J. Chromatogr. B 2000, 742,79-89.
[16] Lanz, C., Kuhn, M., Bortolotti, F., Tagliaro, F., Thormann, W., J. Chromatogr.A 2002, 979, 43-57.
[17] Lanz, C., Marti, U., Thormann, W., J. Chromatogr. A 2003, 1013, 131-147.
[18] Legros, F.J., Nuyens, V., Minet, E., Emonts, P., Zouaoui Boudjeltia, K., Courbe,A., Ruelle, J.-L., Colicis, J., de L’Escaille, F., Henry, J.-P., Clin. Chem. 2002,48, 2177-2186.
[19] Legros, F.J., Nuyens, V., Baudoux, M., Zouaoui Boudjeltia, K., Ruelle, J.-L.,Colicis, J., Cantraine, F., Henry, J.-P., Clin. Chem. 2003, 49, 440-449.
[20] Lanz, C., Thormann, W., Electrophoresis 2003, 24, 4272-4281.
[21] Anton, R.F., Sillanaukee, P., Alcohol. Clin. Exp. Res.1996, 20, 54A-56A.
[22] Anton, R.F., Moak, D.H., Latham, P., Alcohol. Clin. Exp. Res. 1996, 20, 841-846.

Determination of Carbohydrate-Deficient Transferrin in Human Serum by Capillary Zone Electrophoresis
Christian Lanz Inauguraldissertation, University of Basel Page 111
[23] Mårtenson, O., Härlin, A., Brandt, R., Seppä, K., Sillanaukee, P., Alcohol. Clin.Exp. Res. 1997, 21, 1710-1715.
[24] Scouller, K., Conigrave, K.M., Macaskill, P., Irwig, L., Whitfield, J.B., Clin.Chem. 2000, 46, 1894-1902.
[25] Anton, R.F., Alcohol 2001, 25, 185-188.
[26] Reynaud, M., Schellenberg, F., Loisequx-Meunier, M.-N., Schwan, R.,Maradeix, B., Planche, F., Gillet, C., Alcohol. Clin. Exp. Res. 2000, 24, 1414-1419.
[27] Voltaire Carlsson, A., Hiltunen, A.J., Beck, O., Stibler, H., Borg, S., Alcohol.Clin. Exp. Res. 1993, 17, 703-708.
[28] Borg, S., Helander, A., Voltaire Carlsson, A., Högström Brandt, A.-M., Alcohol.Clin. Exp. Res. 1995, 19, 961-963.
[29] Huseby, N.-E., Bjordal, E., Nilssen, O., Barth, T., Alcohol. Clin. Exp. Res.1997, 21, 1343-1346.
[30] Helander, A., Fors, M., Zakrisson, B., Alcohol Alcohol. 2001, 36, 406-412.
[31] Hultberg, B., Isaksson, A., Berglund, M., Alling, C., Alcohol. Clin. Exp. Res.1995, 19, 452-456.
[32] Dibbelt, L., Clin. Chem. 2000, 46, 1203-1205.
[33] Lipowski, M., Dibbelt, L., Seyfarth, M., Clin. Biochem. 2000, 33, 635-641.
[34] Stibler, H., Clin. Chem. 1991, 37, 2029-2037.
[35] Lesch, O., Walter, H., Antal, J., Heggli, D.-E., Kovacz, A., Leitner, A.,Neumeister, A., Stumpf, I., Sundrehagen, E., Kasper, S., Alcohol andAlcoholism 1996, 31, 265-271.
[36] Salmela, K.S., Laitinen, K., Nyström, M., Salaspuro, M., Alcohol. Clin. Exp.Res. 1994, 18, 228-230.
[37] Allen, J.P., Litten, R.Z., Anton, R.F., Cross, G.M., Alcohol. Clin. Exp. Res.1994 18, 799-812.
[38] Behrens, U.J., Worner, T.M., Lieber, C.S., Alcohol. Clin. Exp. Res. 1988, 12,539-544.

Determination of Carbohydrate-Deficient Transferrin in Human Serum by Capillary Zone Electrophoresis
Christian Lanz Inauguraldissertation, University of Basel Page 112
C. Conclusions
The evaluation of various dynamic capillary coatings revealed that this principle ishighly effective for the CZE separation and quantitation of Tf isoforms and thus thedetermination of CDT in human serum. For all investigated buffer additives, optimalresults were obtained employing 50 µm I.D. fused-silica capillaries of 50 cm effectivelength and a capillary cartridge temperature of 20 – 25 °C. Minimal sample preparationwas required, consisting only in the saturation of the serum Tf with iron. Using a borate-based running buffer of pH 8.3 with either 3.0 mM DAB or 0.02 mM spermine ascapillary conditioners provided results of remarkable similarity in terms of resolution,migration times and signal intensity for di-, tri-, tetra- and pentasialo-Tf. With thedouble coating asialo- to hexasialo-Tf could be separated and quantitated. Due tosomewhat shorter migration times, higher signal intensity and better reproducibility, theapproach with the double coating could be identified as being superior to the twoamine-based coatings (chapter B.1).
Further investigations of the reagents producing the double coating revealed animpressive precision performance of the system. The precision was assessed accordingto the internationally accepted guidelines of the EP5-A protocol from NCCLS (NationalCommittee for Clinical Laboratory Standards) [41]. Inter-day RSD values (n=20) formigration times were found to be < 1.7 %. RSD values for the quantitation of CDTisoforms were determined to be dependent on the isoform level and ranged between 2.2% and 17.6 % (chapter B.2). The bottleneck of the assay run at 28 kV and 40 °C wasidentified as being the separation between disialo- and trisialo-Tf, i.e. the cut betweenCDT and non-CDT Tf isoforms. Therefore, a systematic study about the separation ofthese two isoforms was undertaken. Optimization of the method without changing thebuffer composition or the capillary dimensions was achieved via reduction of thecartridge temperature and the applied voltage. The final method, run at 20 kV and 30°C, resulted in baseline separation of all Tf isoforms and exhibited outstanding precisionperformances. RSD values for CDT, calculated as the sum of asialo-, monosialo- anddisialo-Tf, were found to be < 3 % for a normal serum with a CDT value of 1.0 %, and< 1.5 % for the serum of an alcohol abuser with a CDT level of 4.5 % (n = 8). Detectiontimes were highly constant, with the RSD value being < 1 %, revealing that this assaywas robust, reproducible and reliable and thus fulfilling the criteria for the introductionof this assay into routine analysis (chapters B.3 and B.4). The health associated

Determination of Carbohydrate-Deficient Transferrin in Human Serum by Capillary Zone Electrophoresis
Christian Lanz Inauguraldissertation, University of Basel Page 113
reference interval for CDT was established and found to be dependent on theinstrumental conditions and the integration scheme. The upper reference limit for theoptimized method was determined to be 1.7 %, a value that is in good agreement withthe recent HPLC literature [21,22,42] (chapter B.3).
After introduction of the optimized assay into the routine determination of CDT, morethan 600 patient sera were analyzed in the first year and the suitability of the method forroutine application could thereby be demonstrated. The internal quality control over thistime period (n = 62) showed the outstanding reproducibility of the assay with RSDvalues of 3.8 % and 2.2 % for mean Tf isoform levels of 1.01 % and 4.19 %,respectively. Interference free patterns were monitored except for selected sera ofpatients with severe liver diseases. Tf patterns obtained with rare heterozygous geneticTf-BC and Tf-CD variants could easily be identified. Furthermore, the nature of unusualnon-Tf peaks detected in some sera was clarified, such as the presence of C-reactiveprotein and monoclonal and biclonal gammopathia. Application of the assay to confirmpositive results produced by an immunoassay during long-term monitoring of a patientshowed that the CZE method was appropriate for detecting relapse drinking. Apparentelimination half lifes for asialo-, disialo-Tf and CDT were estimated to be 4.9, 7.2 and6.7 days, respectively (chapter B.4).
The optimized CZE method for the determination of CDT in human serum represents ahighly reproducible, fast and reliable assay with simpler sample preparation, easiercolumn regeneration, faster analysis time and higher resolution of Tf isoformscompared to the most recent and optimized HPLC approach [23]. The CZE-based assaycan therefore be considered as an attractive alternative to HPLC and fulfills therequirements of a reference method. It can be employed for screening purposes,longitudinal monitoring of patients during alcohol withdrawal, detection of relapsedrinking and confirmation analyses in clinical chemistry and forensic medicine.
Determination of Carbohydrate-Deficient Transferrin in Human Serum by Capillary Zone Electrophoresis
Christian Lanz Inauguraldissertation, University of Basel Page 114
D. References
[1] Musshoff, F., Daldrup, Th., J. Chromatogr. B 1998, 713, 245-264.
[2] Tagliaro, F., Bortolotti, F., Crivellente, F., Cittadini, F., Forensic Sci. Rev. 2000,12, 134-148.
[3] Sharpe, P.C., Ann. Clin. Biochem. 2001, 38, 652-664.
[4] Musshoff, F., J. Chromatogr. B 2002, 781, 457-480.
[5] Ernst, C., Alkoholmissbrauch – Alkoholabhängigkeit – Alkoholismus, einLeitfaden für Ärzte und andere in der Alkoholismmus-Behandlung tätigePersonen, 3. neubearbeitete und erweiterte Auflage 1989, Eidg. Drucksachen-und Materialzentrale, Bern
[6] Gutjahr, E., Gmel, G., Die epidemiologischen Grundlagen zur Schätzung dersozialen Kosten des Alkoholismus in der Schweiz, 1995 – 1998, SchweizerischeFachstelle für Alkohol- und andere Drogenprobleme SFA/ISPA, Lausanne, 161-174.
[7] www.bag.admin.ch
[8] Stibler, H., Clin. Chem. 1991, 37, 2029-2037.
[9] Stibler, H., Kjellin, K.G., J. Neurol. Sci. 1976, 30, 269-285.
[10] Stibler, H., Allgulander, C., Borg, S., Kjellin, K.G., Acta med. Scand. 1978, 204,49-56.
[11] Stibler, H., Borg, S., Allgulander, C., Acta med. Scand. 1979, 206, 275-281.
[12] De Jong, G., van Ejik, H.G., Electrophoresis 1988, 9, 589-598.
[13] Van Eijk, H.G., van Noort, W.L., de Jong, G., Koster, J.F., Clin. Chim. Acta1987, 165, 141-145.
[14] Landberg, E., Påhlsson, P., Lundblad, A., Arnetorp, A., Jeppsson, J.-O.,Biochem. Biophys. Res. Commun. 1995, 210, 267-274.
[15] Inoue, T., Yamauchi, M., Ohkawa, K., Electrophoresis 1999, 20, 452-457.
[16] Sillanaukee, P., Strid, N., Allen, J.P., Litten, R.Z., Alcohol. Clin. Exp. Res.2001, 25, 34-40.
[17] Arndt, T., Clin. Chem. 2001, 47, 13-27.
[18] Stibler, H., Borg, S., Joustra, M., Alcohol. Clin. Exp. Res. 1986, 10, 535-544.
[19] Stibler, H., Borg, S., Joustra, M., Alcohol Alcohol. 1991, 1 (Suppl.), 451-454.
[20] Helander, A., Fors, M., Zakrisson, B., Alcohol Alcohol. 2001, 36, 406-412.
[21] Jeppsson, J.O., Kristensson, H., Fimiani, C., Clin. Chem. 1993, 39, 2115-2120.
[22] Helander, A., Eriksson, G., Stibler, H., Jeppsson, J.-O., Clin. Chem. 2001, 47,1225-1233.
[23] Helander, A., Husa, A., Jeppsson, J.-O., Clin. Chem. 2003, 49, 1881-1890.

Determination of Carbohydrate-Deficient Transferrin in Human Serum by Capillary Zone Electrophoresis
Christian Lanz Inauguraldissertation, University of Basel Page 115
[24] Thormann, W., Lurie, I.S., McCord, B., Marti, U., Cenni, B., Malik, N.,Electrophoresis 2001, 22, 4216-4243.
[25] Thormann, W., Ther. Drug. Monit. 2002, 24, 222-231.
[26] Kašička, V., Electrophoresis 2001, 22, 4139-4162.
[27] Hutterer, K., Dolník, V., Electrophoresis 2003, 24, 3998-4012.
[28] Rodriguez, I., Li, S.F.Y., Analytica Chimica Acta 1999, 383, 1-26.
[29] Horvath, J., Dolník, V., Electrophoresis 2001, 22, 644-655.
[30] Righetti, P.G., Gelfi, C., Verzola, B., Castelletti, L., Electrophoresis 2001, 22,603-611.
[31] Stathakis, C., Arriaga, E.A., Lewis, D.F., Dovichi, N.J., J. Chromatogr. A 1998,817, 227-232.
[32] Katayama, H., Ishihama, Y., Asakawa, N., Anal. Sci. 1998, 14, 407-408.
[33] Katayama, H., Ishihama, Y., Asakawa, N., Anal. Chem. 1998, 70, 2254-2260.
[34] Katayama, H., Ishihama, Y., Asakawa, N., Anal. Chem. 1998, 70, 5272-5277.
[35] Bendahl, L., Hansen, S.H., Gammelgaard, B., Electrophoresis 2001, 22, 2565-2573.
[36] Graul, T.W., Schlenoff, J.B., Anal. Chem. 1999, 71, 4007-4013.
[37] Oda, R., Landers, J.P., Electrophoresis 1996, 17, 431-437.
[38] Giordano, B.C., Muza, M., Trout, A., Landers, J.P., J. Cromatogr. B 2000, 742,79-89.
[39] Tagliaro, F., Bortolotti, F., Zuliani, M., Crivellente, F., Manetto, G., Pascali,V.L., Marigo, M., J. Cap. Elec. 1999, 6, 137-143.
[40] Crivellente, F., Fracasso, G., Valentini, R., Manetto, G., Riviera, A.P., Tagliaro,F., J. Chromatogr. B 2000, 739, 81-93.
[41] Kennedy, J.W., Carey, R.N., Coolen, R.B., Garber, C.C., Lee, H.T., Levine,J.B., Osberg, I.M., Evaluation of Precision Performance of Clinical ChemistryDevices; Approved Guideline. NCCLS document EP5-A, NCCLS, Wayne, PA,USA, 1999.
[42] Turpeinen, U., Methuen, T., Alfthan, H., Laitinen, K., Salaspuro, M., Stenman,U.-H., Clin. Chem. 2001, 47, 1782-1787.

Determination of Carbohydrate-Deficient Transferrin in Human Serum by Capillary Zone Electrophoresis
Christian Lanz Inauguraldissertation, University of Basel Page 116
E. Publications
Lanz, C., Kuhn, M., Bortolotti, F., Tagliaro, F., Thormann, W. Evaluation andoptimization of capillary zone electrophoresis with different dynamic capillary coatingsfor the determination of carbohydrate-deficient transferrin in human serum. J.Chromatogr. A 2002, 979, 43 – 57.
Lanz, C., Marti, U., Thormann, W. Capillary zone electrophoresis with a dynamicdouble coating for analysis of carbohydrate-deficient transferrin in human serum:Precision performance and pattern recognition. J. Chromatogr. A 2003, 1013, 131 –147.
Lanz, C., Thormann, W. Capillary zone electrophoresis with a dynamic double coatingfor analysis of carbohydrate-deficient transferrin in human serum: Impact of resolutionbetween disialo- and trisialotransferrin on reference limits. Electrophoresis 2003, 24,4272 – 4281.
Lanz, C., Kuhn, M., Deiss, V., Thormann, W. Improved capillary electrophoresismethod for the determination of carbohydrate-deficient transferrin in patient sera.Electrophoresis 2004, 25, 2309 – 2318.