determination molecular of bacterial genomic dna …aem.asm.org/content/50/4/1007.full.pdf ·...
TRANSCRIPT
Vol. 50, No. 4APPLIED AND ENVIRONMENTAL MICROBIOLOGY, Oct. 1985, p. 1007-10130099-2240/85/101007-07$02.00/0Copyright C) 1985, American Society for Microbiology
Determination of the Molecular Mass of Bacterial Genomic DNAand Plasmid Copy Number by High-Pressure
Liquid ChromatographyFRED J. GENTHNER,t LEONARD A. HOOK,: AND WILLIAM R. STROHL*Department of Microbiology, The Ohio State University, Columbus, Ohio 43210
Received 1 April 1985/Accepted 11 July 1985
Relatively rapid methods for the determination of relative genome molecular mass (Mr) and the estimationof plasmid copy number have been developed. These methods are based on the ability of the Bio-Radhigh-pressure liquid chromatography hydroxylapatite column to separate and quantify single-stranded DNA,double-stranded DNA, and plasmid DNA. Genome Mr values were calculated from reassociation kinetics ofsingle-stranded DNA as measured with the hydroxylapatite column. Bacteriophage T4 DNA was used toestablish a Cot (moles of nucleotides times seconds per liter), or standard reassociation value. From this Cotvalue, Cot values for Escherichia coli B, Beggiatoa alba B18LD, and Streptomyces coelicolor were determinedby comparative calculations. From those calculated Cot values, the Mr values of 1.96 x 10⁹ for E. coli, 2.02 x10⁹ for B. alba, and 3.28 x 10⁹ for S. coelicolor were estimated. Plasmid concentration was determined fromcleared lysates by comparing the integrated area under the phosphate buffer-eluted plasmid peak to valuesobtained with known amounts of plasmid. The plasmid copy number was estimated by multiplying the ratiobetween the amounts of plasmid and chromosomal DNA by the ratio between the Mr values of the chromosomeand the plasmid. A copy number of 29 was obtained from a culture of E. coli HB101 harboring pBR322 grownto a culture density of 1.6 x 10⁹ CFU * ml-'.
Several methods have been used to determine the relativemolecular masses (Mrs) of bacterial genomes. Autoradiogra-phy (9) and electron microscopy (32) were the first methodsto be used. Due to the difficulties of these procedures othermethods were sought. Chemical methods (42) are unsatis-factory because the number of nucleotides per cell and thestate of replication of the chromosome are difficult to deter-mine (31). A different approach to the determination ofgenome molecular masses was developed by Britten andKohne (8), in which the renaturation of single-stranded DNA(ssDNA) to double-stranded DNA (dsDNA) was used. Thisprocess was shown to follow second-order reaction kinetics(8, 48). By using this approach, the Mr values of bacterialgenomes have been calculated two ways. Britten and Kohne(8) calculated genome Mr from relative measurements ofCot1/2 (one-half of the reassociation as measured in moles ofnucleotides times seconds per liter). Wetmur and Davidson(48) calculated genome molecular masses from the second-order reaction rate constant (k2) and the Mr of the renaturingssDNA.
Several methods have been used for the measurement ofssDNA reassociation, including: immobilization of DNA onagar (6) or nitrocellulose (17); digestion by ssDNA-specificnuclease (12); an optical method, based on the hyperchro-micity of ssDNA over dsDNA (48); and separation ofdsDNA from ssDNA by hydroxyapatite columns (28).Hydroxyapatite columns offer a variety of advantages inrenaturation studies (28) and have also been used to isolateextrachromosomal DNA (11, 26, 43).We have used a hydroxylapatite (HPHT) high-pressure
liquid chromatography (HPLC) column for separation and
* Corresponding author.t Present address: US-EPA, Sabine Island, Gulf Breeze, FL
32561.t Present address: Automated Microbiology Systems, San Diego,
CA 92123.
quantitation of ssDNA, dsDNA, and plasmid DNA and haveapplied these methods to the determination of Cot values forbacteria, the measurement of genome molecular masses, andthe measurement of plasmid copy number. The advantagesand disadvantages of this system are compared with estab-lished procedures.
MATERIALS AND METHODS
Organisms and growth conditions. Escherichia coli B, aprototroph, was obtained from the culture collection in theDepartment of Microbiology at The Ohio State University,Columbus, Ohio. E. coli HB101 (pro leu thr recAl str lacYhsdM hsdR) harboring pBR322 was obtained from J. S.Lampel. E. coli strains were grown with vigorous shaking at35°C in L-broth culture medium (5) that was modified by theomission of glucose and the reduction of sodium chloride to0.5% (wt/vol). Ampicillin (50 ,g * ml-') and chloramphenicol(170 pug * ml-') were added when required. To obtain a highyield of plasmid DNA, plasmid pBR322 was amplified in thepresence of chloramphenicol by the procedure described byManiatis et al. (33).
Streptomyces coelicolor (OSU no. 686, from ISP no. 5049)was grown in yeast malt medium with vigorous aeration on ashaker at 30°C. Yeast malt medium contained (per liter): 10.0g of glucose, 5.0 g of peptone, 4.0 g of yeast extract, and 2 mlof a trace elements solution. The trace elements solutioncontained (milligrams per liter): ZnCl2, 40; FeCl3 - 6H20,200; NiCl, 5; CuC12 - 2H20, 2; MnCl2 * 4H20, 2; Na2B407 -
10H2O, 2.Beggiatoa alba B18LD has been described previously (34)
and was grown at 30°C with rotary shaking at 150 rpmessentially as described by Strohl et al. (45). The mediumcontained (per liter): 500 mg of sodium acetate, 250 mg ofNH4Cl, 147 mg of CaCl2, 10 mg of MgSO4 * 7H20, 10 mg ofK2HPO4, and 5 ml of a microelement solution (47).
Preparation of chromosomal DNA. For the isolation of
1007
on May 26, 2018 by guest
http://aem.asm
.org/D
ownloaded from

1008 GENTHNER ET AL.
DNA from E. coli B, 2 liters of cells were harvested bycentrifugation, washed once in 1/2 volume of TE buffer (10mM Tris hydrochloride, 1 mM EDTA [pH 8.0]), and sus-pended in 60 ml of TE buffer containing 2 mg oflysozyme * ml-'. The mixture was incubated for 15 min at37°C with occasional shaking, after which 20% sodiumdodecyl sulfate (SDS) was added to make a final concentra-tion of 0.5%. Pronase (20 mg * ml-') was added to a finalconcentration of 1 mg * ml-'. After incubation for 30 min at37°C, the SDS concentration was adjusted to 1.0% by theaddition of a 20% SDS solution. Sodium perchlorate (5 M)was added to a final concentration of 1 M. Protein was thenremoved by sequential extractions with equal volumes of thefollowing: redistilled phenol saturated with 0.1 M Tris hy-drochloride (pH 8.0), phenol-chloroform (1:1), and chloro-form. Nucleic acids were precipitated by the addition of 1/10volume of 3 M sodium acetate and 2 volumes of cold (-20°C)95% ethanol. The nucleic acids were pelleted by centrifuga-tion at 10,800 x g (9,500 rpm; model SS34; Ivan Sorvall,Inc.) for 10 min and dissolved in 0.lx SSC (lx SSC is 0.15M NaCl plus 0.015 M sodium citrate) (33). The SSC concen-tration was adjusted to 1x by adding an appropriate volumeof 20x SSC (33). Ribonuclease A (10 mg * ml-' in 10 mMTris hydrochloride-15 mM NaCl [pH 7.5], heated for 15 minat 100°C to inactivate deoxyribonuclease activity) was addedto a final concentration of 50 ,ug * ml-'. This mixture wasincubated at 37°C for 30 min. The ribonuclease was removedby extraction with an equal volume of phenol-chloroform(1:1) and then an equal volume of chloroform. The DNA wasprecipitated with sodium acetate and cold ethanol as de-scribed previously, pelleted, and dissolved in 0.12 M sodiumphosphate buffer (pH 6.8). S. coelicolor DNA was isolatedas described by Chater et al. (10) and dissolved in 0.12 Msodium phosphate buffer (pH 6.8). For isolation of DNAfrom B. alba B18LD, a 2-liter culture of trichomes wasgrown and harvested as previously described (45). Thetrichome pellets were suspended in 45 ml of TE buffer, solidlysozyme was added to make a final concentration of 2mg * ml-', and the mixture was incubated for 15 min at 37°Cwith occasional shaking. Trichomes were lysed by theaddition of 1% SDS (final concentration) and the DNA waspurified essentially as described for E. coli, with the additionof a CsCl purification step (33). The purity of all DNApreparations was estimated by the ratio of A260 to A280. DNAwith an A260/A280 ratio of 1.8 to 2.0 was considered pureenough for further analysis.
Preparation of DNA fragments. The DNAs used inrenaturation experiments were sheared to ca. 500 base pairs.The DNA fragment sizes were monitored by 3.2%acrylamide gel electrophoresis with bacteriophage lambdadigested with BglII restriction endonuclease as the molecu-lar mass standard. E. coli B DNA was fragmented byblending (5). All other DNAs were fragmented by sonicationon ice for 5 min (10 30-s bursts) with a Branson Sonifier at asetting of 5. After fragmentation, the bacterial DNA solu-tions were filtered through a filter (pore size, 0.45 ,um) andadjusted to concentrations of 250 to 350 pug * ml-', and theT4 DNA solution was adjusted to ca. 150 ,g* ml-' withsterile 0.12 M sodium phosphate buffer (pH 6.8). The con-centration of DNA was determined spectrophotometricallyat a wavelength of 260 nm as described by Maniatis et al.(33).
Preparation of purified plasmid DNA. After plasmid ampli-fication, 1 liter of E. coli HB101 cells harboring pBR322 washarvested by centrifugation and lysed by the method ofHolmes and Quigley (24). Plasmid DNA was purified by
centrifugation in cesium chloride-ethidium bromide gradi-ents (33). After extraction of the ethidium bromide withisopropanol, the plasmid solution was dialyzed against 0.12M sodium phosphate buffer (pH 6.8). The purity of theplasmid was determined spectrophotometrically by using theratio of absorbance at A260 and A280 (33).Chromatography and reassociation kinetics. Fragmented
chromosomal DNA (average size, 500 base pairs) in 0.12 Msodium phosphate buffer (pH 6.8) was denatured at 100°C for10 min and then placed into a 60°C water bath (7) (time zero).For S. coelicolor, the samples were heated for at least 20 minat 105°C in a sealed tube. Samples (40 to 100 R1I) wereremoved at time intervals (30 s to 12 h) and immediatelyfrozen in an ethanol (95%)-dry ice bath.Chromatography was performed at ambient temperature
(ca. 21°C) on an Altex HPLC apparatus equipped with aBio-Rad Bio-Gel HPHT column (100 by 7.8 mm) and guardcolumn (50 by 4.0 mm). Rapidly thawed 20-pl samples wereinjected into a Rheodine HPLC sample injector equippedwith a 20-pul loop. Elution was performed by using a stepgradient from 0.1 to 0.3 M sodium phosphate (pH 6.8) at aflow rate of 0.45 ml - min-'. It took 30 s for the concentra-tion of the elution buffer to change linearly from 0.1 to 0.3 M.All buffers were filtered (pore size, 0.2 p.m) and degassed.The buffers used for HPLC contained calcium and phos-phate at the level of the solubility product for calciumphosphate (as described in the instructions accompanyingthe column) and were preserved with 0.05% sodium azide.The ssDNA and dsDNA were monitored at 260 nm with a
Hitachi spectrophotometer equipped with an Altex model100-40 flow-through cell. Areas under the ssDNA anddsDNA peaks were integrated by a Hewlett-Packard 3390Aintegrator and calculated as percentage of total area. Thesewere used to plot the fraction of DNA reassociated againstlog Cot. Cot is the product of DNA concentration in moles ofnucleotides per liter, and the time (t) in seconds of reas-sociation. The rate of renaturation of fully denatured DNA iskinetically a second-order reaction (48). On the log Cot plot,there is a nearly linear region on the curve that extends forabout two logs (25). It was from this portion of the curve thata linear regression analysis was used to determine the Cotvalue at 50% reassociation (CWt412). The genome size wasestimated directly from the comparison of the C0t1/2 valueswith the standard Cot value obtained for T4 bacteriophage(7).
Estimation of plasmid copy number. A 500-ml culture of E.coli HB101 harboring pBR322 was grown to a density of 1.6x 10⁹ cells ml-1'. A cleared lysate was prepared from 60 mlof this culture by the method of Guerry et al. (21). Thecleared lysate was made up of 6 M urea and 0.25 M sodiumphosphate (pH 6.8). The urea-treated lysate was filtered(pore size, 0.45 pum), and a 200-,u portion was applied to theBio-Gel HPHT column. The majority of the contaminatingmaterial (e.g., chromosomal DNA, RNA, and protein) waseluted at ambient temperature with a buffer of 0.25 M sodiumphosphate with 6 M urea (pH 6.8) at a flow rate of 0.45ml - min-' (26). The plasmid was then eluted with a lineargradient of 0.01 to 0.4 M sodium phosphate.A standard curve, correlating area under the plasmid peak
to the amount of plasmid, was prepared by applying knownamounts of purified plasmid onto the column and elutingwith a linear gradient of 0.01 to 0.4 M sodium phosphate.The amount of plasmid in the experimental culture wasdetermined with the standard curve, using the area under theplasmid peak. Total DNA was measured from a 200-mlportion of the culture by the diphenylamine reaction (16)
APPL. ENVIRON. MICROBIOL.
on May 26, 2018 by guest
http://aem.asm
.org/D
ownloaded from
HPLC METHODS FOR DNA 1009
a
IsIs 10
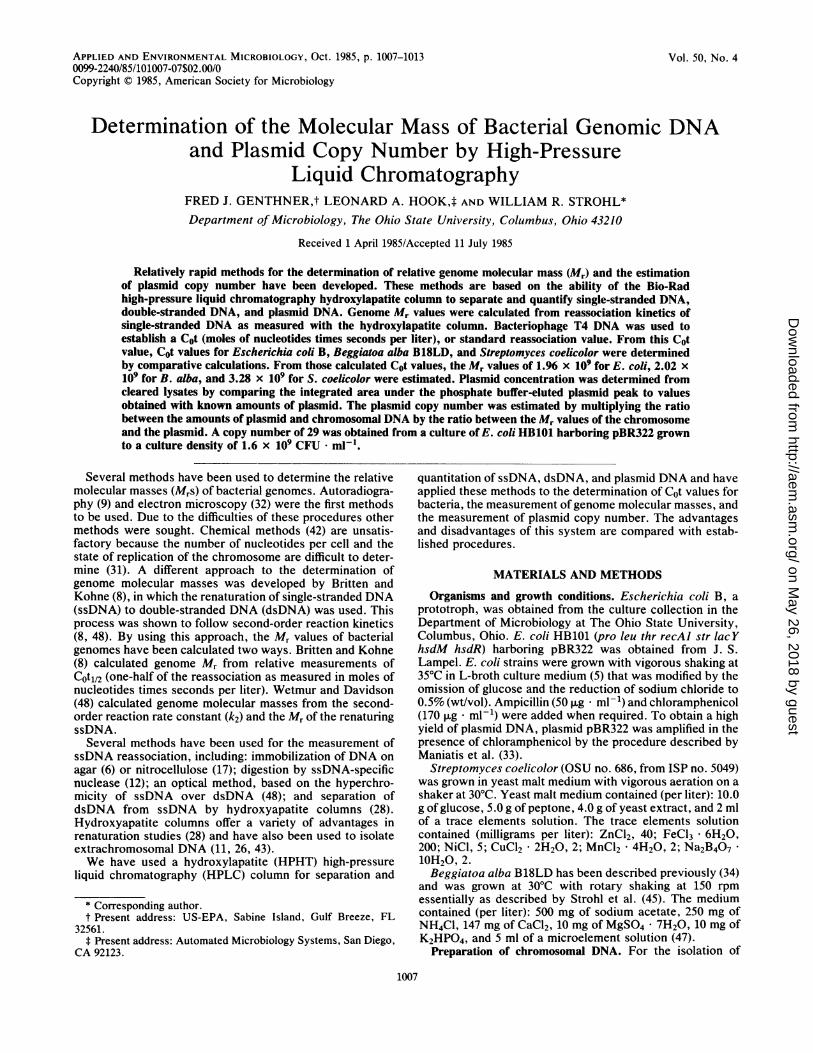
ELUTIOn rot{(MII)FIG. 1. Rapid separation of ssDNA from dsDNA with the Bio-
Gel HPHT column. Samples (20 ,ul) containing 5.4 p.g of renaturedDNA were applied to the column. Elution was carried out by a stepgradient formed by increasing the concentration of sodium phos-phate from 0.1 to 0.3 M (pH 6.8) in 0.5 min (0.45 ml * min-' at anambient temperature). The buffer was maintained at 0.3 M for 4.5min, during which time separation of the ssDNA and dsDNAoccurred (retention time, between 12.5 and 14.5 min; there is ca. 12min of delay time between injection and the chart recorder). Thesodium phosphate concentration was then decreased from 0.3 to 0.1M in 0.5 min to prepare for the next sample. Eluted peaks weredetected by monitoring A260. Low-molecular-mass DNA, ssDNA,and dsDNA eluted at approximately 9, 12.5, and 14.5 min, respec-tively. (A) Elution of dsDNA before heating to 100°C. (B) Elution ofheated DNA that has been ca. 4% reannealed. (C) Elution of DNAthat has been 62% reannealed. (D) Elution of DNA that has been100% reassociated to dsDNA. Units of A260 are given as arbitraryvalues.
with salmon testes DNA as the standard. The copy numberwas calculated by multiplying the ratio between the amountsof plasmid and chromosomal DNA by the ratio between themolecular masses of the chromosome and plasmid (13).
Chemicals. All chemicals used were reagent grade orbetter. Bacteriophage T4 DNA, salmon testes DNA, ribo-nuclease A, lysozyme, chloramphenicol, ampicillin, anddiphenylamine were purchased from Sigma Chemical Co.,
St. Louis, Mo. Bacteriophage lambda DNA was obtainedfrom Bethesda Research Laboratories, Gaithersburg, Md.,and BglII restriction endonuclease was obtained from Inter-national Biotechnologies Inc., New Haven, Conn. Ultrapureurea, necessary for the HPLC purification of plasmid DNA,was obtained from Schwartz-Mann, Cambridge, Mass., ascatalog no. 821519.
RESULTSSeparation of ssDNA and dsDNA. The retention times on
the HPLC hydroxylapatite column for ssDNA and dsDNAwere approximately 12.5 min and 14.5 min, respectively(Fig. 1). A small peak with a retention time of approximately9 min was also eluted. This peak represented DNA of low Mrand accounted for less than 5% of the total area under allthree peaks (Fig. 1).
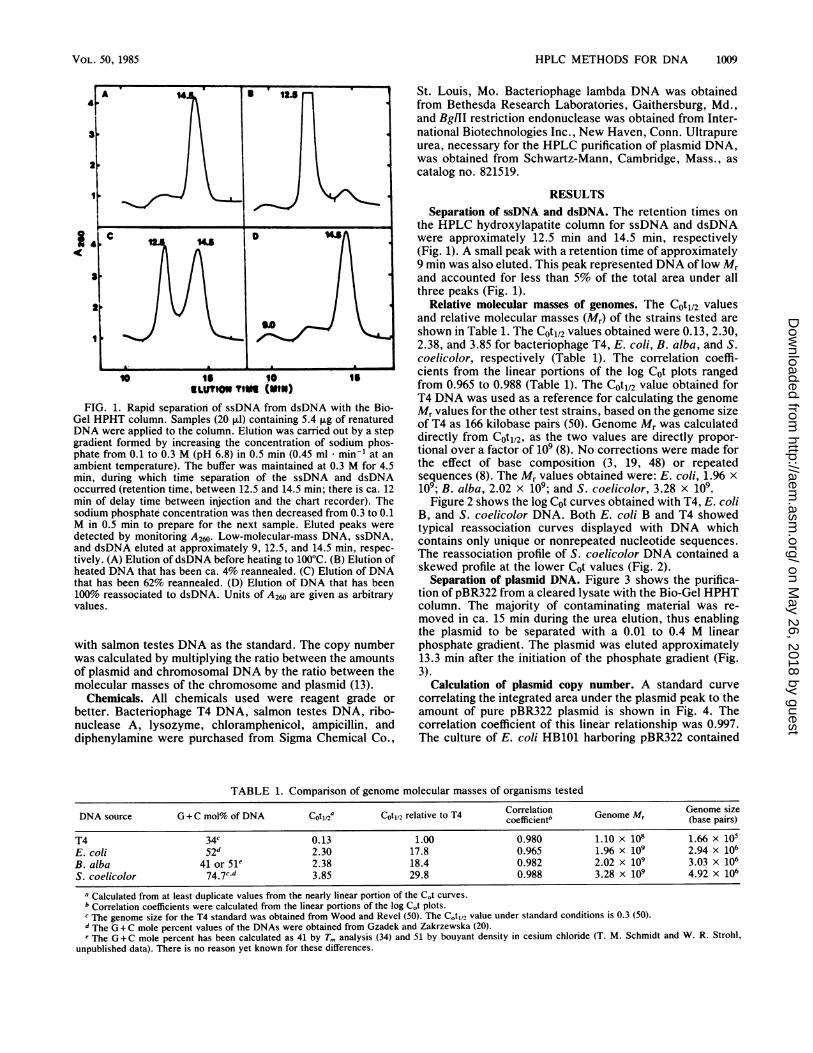
Relative molecular masses of genomes. The Cot1/2 valuesand relative molecular masses (Mr) of the strains tested areshown in Table 1. The Cot1/2 values obtained were 0.13, 2.30,2.38, and 3.85 for bacteriophage T4, E. coli, B. alba, and S.coelicolor, respectively (Table 1). The correlation coeffi-cients from the linear portions of the log Cot plots rangedfrom 0.965 to 0.988 (Table 1). The Cot1/2 value obtained forT4 DNA was used as a reference for calculating the genomeMr values for the other test strains, based on the genome sizeof T4 as 166 kilobase pairs (50). Genome Mr was calculateddirectly from Cot1/2, as the two values are directly propor-tional over a factor of 109 (8). No corrections were made forthe effect of base composition (3, 19, 48) or repeatedsequences (8). The Mr values obtained were: E. coli, 1.96 x10⁹; B. alba, 2.02 x 10⁹; and S. coelicolor, 3.28 x 10⁹.Figure 2 shows the log Cot curves obtained with T4, E. coli
B, and S. coelicolor DNA. Both E. coli B and T4 showedtypical reassociation curves displayed with DNA whichcontains only unique or nonrepeated nucleotide sequences.The reassociation profile of S. coelicolor DNA contained askewed profile at the lower Cot values (Fig. 2).
Separation of plasmid DNA. Figure 3 shows the purifica-tion of pBR322 from a cleared lysate with the Bio-Gel HPHTcolumn. The majority of contaminating material was re-moved in ca. 15 min during the urea elution, thus enablingthe plasmid to be separated with a 0.01 to 0.4 M linearphosphate gradient. The plasmid was eluted approximately13.3 min after the initiation of the phosphate gradient (Fig.3).
Calculation of plasmid copy number. A standard curvecorrelating the integrated area under the plasmid peak to theamount of pure pBR322 plasmid is shown in Fig. 4. Thecorrelation coefficient of this linear relationship was 0.997.The culture of E. coli HB101 harboring pIR322 contained
TABLE 1. Comparison of genome molecular masses of organisms tested
DNA source G + C mol% of DNA C0t112a C0t112 relative to T4 Correlation Genome M, Genome sizeCOtl/ COtI2 reltive o T4 coefficientb GnmM (base pairs)
T4 34C 0.13 1.00 0.980 1.10 x 10⁸ 1.66 x 10⁵E. coli 52d 2.30 17.8 0.965 1.96 x 10⁹ 2.94 x 10⁶B. alba 41 or Sie 2.38 18.4 0.982 2.02 x 10⁹ 3.03 x 10⁶S. coelicolor 74.7c.d 3.85 29.8 0.988 3.28 x 10⁹ 4.92 x 10⁶
a Calculated from at least duplicate values from the nearly linear portion of the Cot curves.b Correlation coefficients were calculated from the linear portions of the log Cot plots.c The genome size for the T4 standard was obtained from Wood and Revel (50). The C.tI/2 value under standard conditions is 0.3 (50).d The i3 + C mole percent values of the DNAs were obtained from Gzadek and Zakrzewska (20).e The G + C mole percent has been calculated as 41 by Tm analysis (34) and 51 by bouyant density in cesium chloride (T. M. Schmidt and W. R. Strohl,
unpublished data). There is no reason yet known for these differences.
A 14 S 12.5 iS
Sc U ID A A
I~~ ~ ~~~~~... La.
VOL. 50, 1985
I
on May 26, 2018 by guest
http://aem.asm
.org/D
ownloaded from
1010 GENTHNER ET AL.
a0
540
2500
= 70
CoTFIG. 2. Log Cot plot of reassociation kinetics on the DNA from T4 (0), E. coli B (0), and S. coelicolor (A). With T4 and E. coli DNA,
each point represents at least the mean of duplicate determinations from a single experiment. Certain points were replicated in otherexperiments. With S. coelicolor DNA, each point represents the mean of duplicate determinations from two separate experiments.
0.37 ,ug of plasmid ml-', as measured with the HPHTcolumn by comparing the area (mean of duplicate determi-nations) under the plasmid peak to the standard curve. TotalE. coli DNA, as measured by the diphenylamine reaction,was 10.62 ,ug * ml-'. A copy number of 29 was then calcu-lated for plasmid pBR322 as follows (13).
however, more closely agrees with the value of 2.32 x 10⁹for E. coli JE5506, a K-12 derivative (23), reported by Yeeand Inouye (51). Yee and Inouye obtained their measure-ment by quantitation of individual restriction fragments aftertwo-dimensional agarose gel electrophoresis (51, 52).
Beggiatoas are sulfide-oxidizing, colorless, filamentous,
0.37 p.g/ml (pBR322 DNA)10.62 [Lg of 0.37 pLg of
2.35 x 10⁹ (Mr of E. coli genome)2.878 x 10⁶ (Mr of pBR322)
= 29 (copy number of pBR322)
total DNA per ml pBR322 DNA per ml
DISCUSSIONThe methods developed and used in this research are
based on the ability of hydroxyapatite to separate ssDNA,dsDNA (7), and plasmid DNA (11, 26, 43). This relativelystandard procedure was expanded for use with HPLC bydevelopment of the HPLC HPHT column by Bio-Rad.Development of HPLC methods are advantageous becausethey are rapid, and combine qualitative separation withdirect quantitation (via integration of peaks) of the separatedproducts (e.g., ssDNA, dsDNA, plasmid DNA). AnotherHPLC technique for separation of ssDNA from dsDNA, inwhich a reverse phase column is used, has also recently beenreported (30).The Cot value for T4 obtained using this HPLC procedure
was 0.13, which is quite different from the 0.3 Cot value forT4 obtained by different procedures (50). Thus with our
procedure, Mr must be calculated by comparison of Cotvalues with a standard DNA of known mass, such as T4. Therelative Mr values of the E. coli B, B. alba B18LD, and S.coelicolor genomes were calculated by comparison with theT4 reference DNA of 166 kilobases (50). Our calculations forthe Mr of the E. coli genome are about 27% lower than thevalue of 2.67 x 10⁹ reported by Gillis et al. (19) and the valueof 2.77 x 10⁹ reported by Gjadek and Zakrzewska (20). Bothof these groups used the initial optical renaturation ratemethod (19). The Mr reported here for the E. coli B genome,
gliding bacteria (29, 46, 47). The beggiatoas have beenconsidered to be related to Oscillatoria spp., mostly becauseof their striking similarities in morphology and life cycle (29,46, 47). The B. alba B18LD genome had aproximately thesame mass as E. coli and was similar in mass to severalOscillatoria spp., which had Mr values of 2.50 x 10⁹ to 4.38x 10⁹ (22). Recent data on the 5S ribosomal RNA of B. albaB18LD and other closely related beggiatoas indicate thatthey belong phylogenetically to group III of the purplephotosynthetic bacteria (37). This would place the beggi-atoas phylogenetically very distant from the cyanobacteria(37, 44); therefore, the similarities in genome masses arecoincidental.The streptomycetes, organisms that undergo a complex
morphological differentiation, have been reported to havegenome masses of ca. 1.5 times greater than that of E. coli(20). The Mr that we calculated for the S. coelicolor genome,3.28 x 109, is ca. 13% smaller than the value of 3.75 x 10⁹reported by Gjadek and Zakrzewska (20), who used theinitial renaturation method of Gillis et al. (19). We considerthis to be in reasonable agreement, especially consideringthe great differences in the techniques used. Benigni and hiscolleagues reported an Mr of 7.09 x 10⁹ for the S. coelicolorgenome (4), based on a spectrophotometric measurement ofthe reassociation constant (k2; 48). There is some contro-versy, however, as to the accuracy of that method due to thepotential error involved in the calculation of k2 and the Mr
APPL. ENVIRON. MICROBIOL.
on May 26, 2018 by guest
http://aem.asm
.org/D
ownloaded from

HPLC METHODS FOR DNA 1011
determination ofDNA fragments by sedimentation (18). Thismight explain the abnormally high genome Mr values ob-tained for several organisms by that technique (18, 20).The reassociation profile of S. coelicolor DNA suggests
the presence of repeated sequences (2, 7). Examples ofhighly amplified (reiterated) DNA sequences have beenreported in several members of the genus Streptomyces (15,35, 36, 38-40). Repeated DNA sequences occur in otherbacterial species (1, 27); however, very high levels of re-peated sequences are unusual (15). Caulobacter crescentushas been reported to have enough repeat sequences to showup in a Cot analysis (49). Moreover, Antonov et al. (2) haveshown, by using Cot data as well as other methods, that S.coelicolor contains about 5% reiterated DNA. Our datafurther indicate that reiterated sequences in streptomycetesmay be measurable by using Cot analyses. It is possible thatour data may represent short segments of S. coelicolor thatcontain abnormally high local G + C mole percent levels thatwould not dissociate under the conditions we used. Antonovet al. (2), however, analyzed S. coelicolor for the presence ofsuch sequences and found them to be lacking.As mentioned previously, Mr values for the genomes were
calculated on the basis of comparative C0t1/2 values. We didnot account for the possible effect of base composition in ourcalculations. There is some controversy concerning therelationship between base composition and intrinsicrenaturation rate. Gillis et al. (19) have described a reverserelationship between base composition and the intrinsicrenaturation rate, while Wetmur and Davidson (48) andSeidler and Mandel (41) have reported a direct relationship.
p
$7 ~~~~IF
p Cp a I
4 8 12 16 20 24 28 32 36ELUTION TIME (MI1O
FIG. 3. Separation of plasmid with Bio-Gel HPHT column.Contaminating material (CM), e.g., chromosomal DNA, RNA, andprotein, was eluted with 6 M urea-0.25 M sodium phosphate (pH6.8) at a flow rate of 0.45 ml * min-' (between small arrows). Thecolumn was equilibrated with 0.01 M sodium phosphate buffer (pH6.8), and the plasmid was eluted by increasing the phosphateconcentration from 0.01 to 0.4 M in 2 min at a flow rate of 0.5ml * min-' (started at large arrow). Plasmid DNA (P) was eluted ca.13 min. after beginning the phosphate gradient. The integratorfunction (IF) was used so that only the area under the plasmid peakand above the background was integrated (see dotted line). A260 isgiven in arbitrary units.
.0 OF DNAFIG. 4. Standard curve of pBR322 correlating the area under the
plasmid peak to the amount of plasmid. The standard curve wasgenerated by applying known amounts of purified plasmid to theBio-Gel HPHT column. The plasmid was eluted as described in thelegend to Fig. 3.
Bak et al. (3) have concluded that no relationship exists.Despite the controversy, the values reported here, withorganisms which vary considerably in both genome size andbase composition, agree closely with accepted values.A copy number of 29 for pBR322 residing in E. coli HB101
agrees well with the accepted value of 30 (14). Methods forestimation of plasmid copy number have often been unreli-able and inaccurate. In this report, we found that the areasunder the plasmid peak from a test culture varied by + 15%.We do not expect significant losses from the crude lysateprocedure that we used. Recoveries of extrachromosomalDNA of 95% (11) and 99% (43) by using hydroxyapatite havebeen reported. In addition, less than 0.5% of chromosomalDNA was present in the purified plasmid preparation (11).By the use of the standard curve, specific losses wereprobably eliminated. However, loss due to trapping of theplasmid in the chromosomal material in the preparation ofthe cleared lysate may have occurred.
This HPHT procedure described has potential advantagesother than those described in this report. For example, itshould be possible to combine HPHT separation of ssDNAand dsDNA with DNA-labeling procedures (e.g., nick trans-lation with 32P-deoxy-CTP) to develop rapid methods forquantitating the homology between DNA samples.Due to the fragile nature of the packing, the Bio-Rad
hydroxylapatite HPLC column would permit only about 200to 400 separations. Moreover, the stability of the columnwas altered by the urea treatment used for plasmid separa-tions. This may currenty limit the use of this technique forplasmid copy number due to the expense of the columns.Bio-Rad is, however, continuing its efforts to improve thestability and to lengthen the life of this packing (T. L.
VOL. 50, 1985
on May 26, 2018 by guest
http://aem.asm
.org/D
ownloaded from

1012 GENTHNER ET AL.
Brooks, personal communication). Indeed, the last columnwhich was supplied to us by Bio-Rad was able to toleratesignificantly higher pressures than previous columns. Weforesee that the columns will eventually be stable enough torun enough samples that even plasmid copy number deter-mination will be a standard procedure. Moreover, alterna-tive separation procedures, including temperature gradients,should be tried to maintain column stability during separa-tion and quantitation of plasmids.
ACKNOWLEDGMENTS
This research was partially funded by a contract from PioneerHi-Bred, Inc. to W.R.S.We thank Brian Burke for his assistance with the HPLC during
the initial stages of this project. We also thank Tim L. Brooks atBio-Rad, Inc. for his complete and sincere cooperation and forsupplying us with additional HPHT columns.
LITERATURE CITED1. Anderson, R. P., and J. R. Roth. 1977. Tandem genetic dupli-
cations in phage and bacteria. Annu. Rev. Microbiol.31.473-505.
2. Antonov, P. P., I. G. Ivanov, and G. G. Markov. 1977. Hetero-geneity of Streptomyces DNA. FEBS Lett. 79:151-154.
3. Bak, L. A., C. Christiansen, and S. Stenderup. 1970. Bacterialgenome sizes determined by DNA renaturation studies. J. Gen.Microbiol. 64:377-380.
4. Benigni, R., P. A. Petrov, and A. Carere. 1975. Estimate of thegenome size by renaturation studies in Streptomyces. Appl.Microbiol. 30:324-326.
5. Bertani, G. 1951. Studies on lysogenesis. I. The mode of phageliberation by lysogenic Escherichia coli. J. Bacteriol.62:293-300.
6. Bolton, E. T., and B. J. McCarthy. 1962. A general method forthe isolation of RNA complementary to DNA. Proc. Natl.Acad. Sci. USA 48:1390-1397.
7. Britten, R. J., D. E. Graham, and B. R. Neufeld. 1974. Analysisof repeating DNA sequences by reassociation. MethodsEnzymol. 24:363-406.
8. Britten, R. J., and D. E. Kohne. 1968. Repeated sequences inDNA. Science 161:529-540.
9. Cairns, J. 1963. The bacterial chromosome and its manner ofreplication as seen by autoradiography. J. Mol. Biol. 6:208-213.
10. Chater, K. F., D. A. Hopwood, T. Kieser, and C. J. Thompson.1982. Gene cloning in Streptomyces, p. 69-75. In P. H.Hofschneider and W. Goebel (ed.), Gene cloning in organismsother than E. coli. Springer-Verlag, New York.
11. Colman, A., M. J. Byers, S. B. Primrose, and A. Lyons. 1978.Rapid purification of plasmid DNAs by hydroxyapatite chroma-tography. Eur. J. Biochem. 91:303-310.
12. Crosa, J. H., D. J. Brenner, and S. Falkow. 1973. Use of asingle-strand specific nuclease for analysis of bacterial andplasmid deoxyribonucleic acid homo- and heteroduplexes. J.Bacteriol. 115:904-911.
13. Crosa, J. H., and S. Falkow. 1981. Plasmids, p. 266-282. In P.Gerhardt, R. G. E. Murray, R. N. Costilow, E. W. Nester,W. A. Wood, N. R. Krieg, and G. B. Phillips (ed.), Manual ofmethods for general bacteriology. American Society for Micro-biology, Washington, D.C.
14. Davis, R. W., D. Botstein, and J. R. Roth. 1980. AdvancedBacterial Genetics. Cold Spring Harbor Laboratory, ColdSpring Harbor, N.Y.
15. Fishman, S. E., and C. L. Hershberger. 1983. Amplified DNA inStreptomyces fradiae. J. Bacteriol. 155:459-466.
16. Giles, K. W., and A. Meyers. 1965. An improved diphenylaminemethod for the estimation of deoxyribonucleic acid. Nature(London) 206:93.
17. Gillespie, D., and S. Spiegelman. 1965. A quantitative assay forDNA/RNA hybrids with DNA immobilized on a membrane. J.Mol. Biol. 12:829-842.
18. Gillis, M., and J. De Ley. 1979. Molecular complexities ofbacterial genomes determined by the initial optical renaturationrate method. FEMS Microbiol. Lett. 5:169-171.
19. Gillis, M., J. De Ley, and M. DeCleene. 1970. The determinationof molecular weight of bacterial genome DNA from renaturationrates. Eur. J. Biochem. 12:143-153.
20. G%adek, A., and J. Zakrzewska. 1984. Genome size of Strepto-myces. FEMS Microbiol. Lett. 24:73-76.
21. Guerry, P., D. J. LeBlanc, and S. Falkow. 1973. General methodfor the isolation of plasmid deoxyribonucleic acid. J. Bacteriol.116:1064-1066.
22. Herdman, M., M. Janvier, R. Rippka, and R. Y. Stanier. 1979.Genome size of cyanobacteria. J. Gen. Microbiol. 111:73-85.
23. Hirota, Y., H. Suzuki, Y. Nishimura, and S. Yesuda. 1977. Onthe process of cellular division in Escherichia coli: a mutant ofE. coli lacking a murein-lipoprotein. Proc. Natl. Acad. Sci. USA74:1417-1420.
24. Holmes, D. S., and M. Quigley. 1981. A rapid boiling method forthe preparation of bacterial plasmids. Anal. Biochem.114:193-197.
25. Johnson, J. L. 1981. Genetic characterization, p. 450-470. In P.Gerhardt, R. G. E. Murray, R. N. Costilow, E. W. Nester,W. A. Wood, N. R. Kreig, and G. B. Phillips (ed.), Manual ofmethods for general bacteriology. American Society for Micro-biology, Wasington, D.C.
26. Johnson, T. R., and J. Ilan. 1983. Large-scale isolation ofplasmid DNA using hydroxyapatite chromatography. Anal.Biochem. 132:20-25.
27. Kleckner, N. 1981. Transposable elements in prokaryotes.Annu. Rev. Genet. 15:341-404.
28. Kohne, D. E., and R. J. Britten. 1971. Hydroxyapatite tech-niques for nucleic acid reassociation, p. 500-512. In G. L.Cantoni and D. R. Davies (ed.), Procedures in nucleic acidresearch, vol. 2. Harper & Row, Publishers, Inc., New York.
29. Larkin, J. M., and W. R. Strohl. 1983. Beggiatoa, Thiothrix,and Thioploca. Annu. Rev. Microbiol. 37:341-367.
30. Liautard, J. P. 1984. Rapid separation of single-stranded DNAfrom double-stranded DNA by reversed-phase high-perfor-mance liquid chromatography. J. Chromatogr. 285:221-225.
31. Maaloe, O., and N. 0. Kjeldgaard. 1966. Control of macromo-lecular synthesis. W. A. Benjamin, Inc., New York.
32. MacHattie, L. A., K. I. Berns, and C. A. J. Thomas. 1965.Electron microscopy of DNA from Hemophilus influenzae. J.Mol. Biol. 11:648-649.
33. Maniatis, T., E. F. Fritsch, and J. Sambrook. 1982. Molecularcloning: a laboratory manual. Cold Spring Harbor Laboratory,Cold Spring Harbor, N.Y.
34. Mezzino, M. J., W. R. Strohl, and J. M. Larkin. 1984. Charac-terization of Beggiatoa alba. Arch. Microbiol. 137:139-144.
35. Ono, H., G. Hintermann, R. Crameri, G. Wallis, and R. Hutter.1982. Reiterated DNA sequences in a mutant strain of Strepto-myces glaucescens and cloning of the sequence in Escherichiacoli. Mol. Gen. Genet. 186:106-110.
36. Orlova, V. A., and V. N. Danilenko. 1983. DNA multiplicationfragment in Streptomyces antibioticus-a producer ofoleandomycin. Antibiotiki 28:163-167.
37. Pace, N. R., D. A. Stahl, D. J. Lane, and G. J. Olsen. 1985.Analyzing natural microbial populations by rRNA sequences.ASM News 51:4-12.
38. Robinson, M., E. Lewis, and E. Napier. 1981. Occurrence ofreiterated DNA sequences in strains of Streptomyces producedby an interspecific protoplast fusion. Mol. Gen. Genet.182:336-340.
39. Schrempf, H. 1982. Plasmid loss and changes within the chro-mosomal DNA of Streptomyces reticuli. J. Bacteriol. 151:701-707.
40. Schrempf, H. 1983. Deletion and amplification of DNA se-quences in melanin-negative variants of Streptomyces reticuli.Mol. Gen. Genet. 189:501-505.
41. Seidler, R. J., and M. Mandel. 1971. Quantitative aspects ofdeoxyribonucleic acid renaturation: base composition, state ofchromosome replication, and polynucleotide homologies. J.Bacteriol. 106:608-614.
APPL. ENVIRON. MICROBIOL.
on May 26, 2018 by guest
http://aem.asm
.org/D
ownloaded from

HPLC METHODS FOR DNA
42. Shapiro, H. S. 1968. Deoxyribonucleic acid content per cell ofvarious organisms, p. H-52. In H. A. Sober (ed.), Handbook ofbiochemistry. CRC Press, Inc., Boca Raton, Fla.
43. Shoyab, M., and A. Sen. 1978. A rapid method for the purifica-tion of extrachromosomal DNA from eukaryotic cells. J. Biol.Chem. 253:6654-6656.
44. Stackebrandt, E., and C. R. Woese. 1984. The phylogeny ofnrokaryotes. Microbiol. Sci. 1:117-122.
45. Strohl, W. R., G. C. Cannon, J. M. Shively, H. Gude, L. A.Hook, C. M. Lane, and J. M. Larkin. 1981. Heterotrophiccarbon metabolism by Beggiatoa alba. J. Bacteriol. 148:572-583.
46. Strohl, W. R., and J. M. Larkin. 1978. Cell division andtrichome breakage in Beggiatoa. Curr. Microbiol. 1:151-155.
47. Strohl, W. R., and J. M. Larkin. 1978. Enumeration, isolation,
and characterization of Beggiatoa from freshwater sediments.Appl. Environ. Microbiol. 36:755-770.
48. Wetmur, J. G., and N. Davidson. 1968. Kinetics of renaturationof DNA. J. Mol. Biol. 31:349-370.
49. Wood, N. B., A. V. Rake, and L. Shapiro. 1975. Structure ofCaulobacter deoxyribonucleic acid. J. Bacteriol. 126:1305-1315.
50. Wood, W. B., and H. R. Revel. 1976. The genome of bacterio-phage T4. Bacteriol. Rev. 40:847-868.
51. Yee, T., and M. Inouye. 1981. Reexamination of the genome sizeof myxobacteria, including the use of a new method for genomeanalysis. J. Bacteriol. 145:1257-1265.
52. Yee, T., and M. Inouye. 1982. Two-dimensional DNA electro-phoresis applied to the study of genome size in Myxococcusxanthus. J. Mol. Biol. 154:181-196.
VOL. 50, 1985 1013
on May 26, 2018 by guest
http://aem.asm
.org/D
ownloaded from