determinants of successful technology...
TRANSCRIPT
DETERMINANTS OF
SUCCESSFUL TECHNOLOGY TRANSFER
Stephanie Chastain
Department of Economics
Warrington College of Business Administration
University of Florida
April 2, 2014

Determinants of Successful Technology Transfer 2
TABLE OF CONTENTS
I. Introduction
II. Legal History
III. Major Data Sources
IV. Data Sample
V. Dependent Variables
VI. Independent Variables
VII. Summary Statistics
VIII. Regression Results
IX. Variable Results
X. Conclusion
References
3
4
4
6
7
7
11
12
25
30
32

Determinants of Successful Technology Transfer 3
I. INTRODUCTION
Technology transfer is defined as “the process of transferring scientific findings from one
organization to another for the purpose of further development and commercialization” (About
Technology Transfer, AUTM). The process typically includes:
Identifying new technologies
Protecting technologies through patents and copyrights
Forming development and commercialization strategies such as marketing and licensing
to existing private sector companies or creating new startup companies based on the
technology
Universities are the most prominent research institutions involved in technology transfer,
which allows such institutions to commercialize their innovations, protect their research
investments, and benefit the economy through job creation. The significance of technology
transfer grows as the economy gravitates from manufacturing-based to knowledge-based. At this
point in time, universities and other institutions are not ranked on their technology transfer
abilities, despite the importance of this process to the university and the economy. This paper
will take advantage of the abundance of data relating to technology transfer, and through
regression analysis attempt to determine which factors lead to the success of this process. By
testing various inputs to technology transfer (independent variables) against an array of outputs
(dependent variables) we are better able to analyze the many factors involved in the process and
eliminate potential for leaving out key pieces of insight.

Determinants of Successful Technology Transfer 4
II. LEGAL HISTORY
The Bayh-Dole Act (1980), also called the Patent and Trademark Act Amendments, spurred
American innovation by allowing universities, non-profit institutions, and small businesses to
maintain ownership of inventions made through federally-funded research. Prior to this
legislation, the government retained title to any inventions made under such funding.
Key points of the Act include the ability to elect to retain title to innovations, the expectation
to give preference to small businesses, the requirement to share income with the inventor(s), and
requirement to manufacture products in the United States if they are to be sold in the United
States. The Bayh-Dole Act has been referred to as “the most inspired piece of legislation to be
enacted in America over the past half-century…More than anything, this single policy measure
helped to reverse America’s precipitous slide into industrial irrelevance” (Innovation’s Golden
Goose).
III. MAJOR DATA SOURCES
The Association of University Technology Managers (AUTM) is a non-profit organization
that strives to enhance technology transfer and to grow the knowledge base around this process.
AUTM publishes surveys such as the annual Licensing Activity Survey and the biennial Salary
Survey, and maintains the Statistics Analysis for Technology Transfer (STATT) database which
houses over 20 years of survey data (dating back to 1991). The FY2012 Licensing Activity
Survey shows growth in several categories of technology transfer activity, including license
income, licenses and options executed, patents issued, number of startups initiated, and research
Determinants of Successful Technology Transfer 5
expenditures. Specific data points obtained from AUTM’s STATT database will be discussed in
the Dependent and Independent Variables sections.
The National Center for Education Statistics (NCES) reports student Fall enrollment and
salary data for each university, among numerous other measures, in their Integrated
Postsecondary Education Data System (IPEDS). These two types of information will be further
discussed in the Independent Variables section.
The U.S. Census Bureau reports metropolitan and micropolitan statistical areas, which is
used as a binary variable. Please note the following definitions given by the Census Bureau:
The term "Core Based Statistical Area" (CBSA) is a collective term for both metro
and micro areas. A metro area contains a core urban area of 50,000 or more population,
and a micro area contains an urban core of at least 10,000 (but less than 50,000)
population. Each metro or micro area consists of one or more counties and includes the
counties containing the core urban area, as well as any adjacent counties that have a
high degree of social and economic integration (as measured by commuting to work)
with the urban core.
U.S. Census Bureau CBSA reports are available for almost each year, unlike the more
commonly known decennial Census. The data available was satisfactory for the purposes of this
regression.
Those are the major data sources that were used in the regression.

Determinants of Successful Technology Transfer 6
IV. DATA SAMPLE
Data will be obtained based primarily on which U.S. universities consistently report data
over a series of time to the AUTM through their annual Licensing Activity Survey, to ensure
consistency and eliminate unexplained fluctuations in the data. The available AUTM data dates
back to 1991. To take advantage of over 20 years of data without becoming overwhelming, only
data from every 3 years will be used – more specifically: 2012, 2009, 2006, 2003, 2000, 1997,
1994. AUTM did not include many of the same data points in the 1991 survey, which is the
reason for the absence of this year from the testing.
The data was further filtered down to only those universities who have participated in the
Licensing Activity Survey for all, or most, of the mentioned years. By including the same years
for each university, as opposed to choosing any or all years available, we reduce the effects of
macroeconomic circumstances that may be shown through inconsistency in years reported. As is
discussed later, there are a set of regressions run with a Salary variable and a set run without this
variable. For the regressions not including Salary, 95 universities were used. Of these, 56
universities reported for all 7 selected years, 24 reported for 6 of these years, and 15 reported for
5 of these years. This provided a total of 606 data points for each regression. Because not all
universities provided salary data, the sample for the next set of regressions is smaller. For the
regressions including Salary, 81 universities were used. The breakdown is 49, 21, and 11
universities that reported for 7, 6, and 5 years, respectively. This provided 519 data points for
these regressions.

Determinants of Successful Technology Transfer 7
V. DEPENDENT VARIABLES
The dependent variables will represent outcomes resulting from technology transfer; the
chosen variables are the most common measures of such outcomes. There will be four dependent
variables, defined as follows:
Patents Issued- the number of U.S. patents issued in the given year
Start-ups- the number of start-up companies formed in the given year
Licenses/Options Executed- the number of licenses executed in the given year
License Income- the monetary income resulting from a university’s licenses in the given year
All data points for these variables are obtained from the AUTM surveys and the STATT
database.
During preliminary research, regressions were ran with each of the above dependent
variables being adjusted on a per student basis, but the results were highly insignificant with R-
Squared values ranging from 0.1376 to 0.1992. These low values clearly show that the per-
student dependent variables do not adequately fit the independent variables, and thus were not
explored further.
VI. INDEPENDENT VARIABLES
Inputs to the technology transfer process will be used as the independent variables in these
regressions. More specifically, these inputs are characteristics of the university itself and/or the
immediate surrounding area. Using university characteristics as independent variables to explain

Determinants of Successful Technology Transfer 8
the outputs of technology transfer, or the dependent variables, we can most accurately show a
prediction as to a university’s success. The independent variables are defined as follows:
Private- a variable with the value of 1 if the university is private or the value of 0 if the
university is public. Since private universities receive more revenue from tuition than do public
universities, this may allow them to participate in technology transfer on a larger scale. A value
of 1 for “Private” should have a positive correlation to the dependent variables.
Metro- a variable with the value of 1 if the university is in a metropolitan statistical area and
the value of 0 if the university is not, in a given year. The metropolitan status is determined by
the U.S. Census Bureau. A value of 1 generally indicates a highly developed, and therefore
technically advanced, area surrounding the university. A strong positive correlation is expected
with “Metro” and the dependent variables.
Technology Index- this index includes three components: patents per capita, average annual
patent growth, and the Tech-Pole Index developed by the Milken Institute, which measures the
concentration of the high-tech industry. The index is provided in The Rise of the Creative Class,
Revisited by Richard Florida. Each metropolitan area is given a ranking, with the value of 1
being “the best” on the index. Any universities that are not located in a metropolitan area were
assigned a rank of 362, since there are 361 metropolitans included in the index ranking. This
approximation seems satisfactory, because large, highly economically developed cities tend to
also be highly technologically developed, and vice versa. Although these rankings were
produced in 2012, the data is used for each year in the regressions, since they can serve as a
proxy for previous years. Since lower index numbers indicate a “better” score, the “Technology
Index” variable should have a strong negative correlation with the dependent variables.
Determinants of Successful Technology Transfer 9
Creative Class- the percentage of workers who are considered to be part of the “creative
class” within the metropolitan area that the school is located in. Examples of creative class
occupations include: architecture, engineering, education, entertainment, design, management,
financial operations, legal, health-care, and sales. The creative class measures are provided in
The Rise of the Creative Class, Revisited by Richard Florida. Any universities that are not
located in a metropolitan area were assigned a value of 17%, since the lowest reported among
metropolitans areas was 17.1%. This approximation seems satisfactory, because large, highly
economically developed cities tend to also have a large portion of creative class workers, and
vice versa. Although these rankings were produced in 2012, the data is used for each year in the
regressions, since they can serve as a proxy for previous years. As the percentage of “Creative
Class” workers increases, each dependent variable should also increase, therefore a positive
relationship is expected.
Students- the total number of students, both undergraduate and graduate, attending the
university in a given year. Student enrollment data is reported for the Fall semester, consequently
data given for Fall 2011 reflects the 2011/2012 academic year, and is therefore used for the 2012
year in the regression – likewise for the other years. This data is reported by the NCES in their
Integrated Postsecondary Education Data System (IPEDS). A positive correlation is expected
between “Students” and the four dependent variables.
TTO Years- the number of years that the technology transfer office (TTO) has been open at
the university, calculated as (year of data point – year TTO opened). These data points are
reported by AUTM. A strong positive correlation is expected between “TTO Years” and the four
dependent variables.

Determinants of Successful Technology Transfer 10
TTO FTEs- the number of full-time licensing and non-licensing employees in the technology
transfer office at the university in a given fiscal year. These data points are reported by AUTM.
A strong positive correlation is expected between “TTO FTEs” and the four dependent variables.
Expenditures- the monetary amount of university research expenditures in a given fiscal year.
These data points are reported by AUTM. A strong positive relationship is expected between
“Expenditures” and the dependent variables for obvious reasons – as a university spends more on
research, it should increase its output.
Salary- the average salary of a university professor in a given academic year. Salary data for
the 2011/2012 academic year is used for the 2012 year in the regression – likewise for the other
years. Using average salary data for professors (as opposed to the overall average which includes
administrative staff, instructors and lecturers) will be more reflective of the salaries of those
faculty members conducting research. A wide range of salaries were observed, but there are
known trends in the salary differences between various college departments. For example, a
philosophy professor does not earn as high of a salary, on average, as an engineering professor.
As the average salary for a professor increases, the outputs of their research should also increase,
therefore a positive correlation is expected between “Salary” and the dependent variables. Since
this data is not provided for all universities, separate regressions were ran for each dependent
variable with and without “Salary”.
VII. SUMMARY STATISTICS
All data, especially outlying values, have been reviewed for correctness. A few data points
that were included in initial regressions were taken out, even though their inclusion only had a

Determinants of Successful Technology Transfer 11
minor effect, to ensure the most accurate and reflective results possible. The following serves as
explanation for the maximum values included in the data set.
Massachusetts Institute of Technology had the highest number of patents issued, 219, in 2012
as well as the highest number of start-ups, 31, in 2000. The maximum for “Licenses/Options
Executed” was achieved by University of Georgia during 2012. New York University was
awarded the highest license income in 2012. Georgia Institute of Technology provided the
highest salary, of $234,758, in 2012. The maximum value of 58,465 students pertains to
University of Central Florida during 2012. “TTO Years” maximum of 74 corresponds to Iowa
State University, which opened its Research Foundation in 1938. University of Washington’s
TTO office had 59 employees in 2009. The maximum value of $1,757,268,191 for “Research
Expenditures” was spent by John Hopkins University in 2006.
Descriptive statistics for the regressions without salary data are included below.
Variable N Min Max Mean Std. Deviation
Patents Issued 606 0 219 23.2851 27.7503
Start-Ups 606 0 31 3.2063 3.9696
License/Options Executed 606 0 232 31.0941 36.8447
License Income 606 $ 0 $184,632,915 $ 9,416,532 $ 22,504,212
Private 606 0 1 0.3531 0.4783
Metro 606 0 1 0.9158 0.2779
Technology Index 606 1 362 107.8531 105.1329
Creative Class 606 17 48.4 33.3884 6.7869
Students 606
495
58,465
21,077.0908 11,478.7474
TTO Years 606 0 74 19.1799 13.0264
TTO FTEs 606 0 58.88 8.8759 8.9200
Research Expenditures 606 $ 4,319,934 $ 1,757,268,191 $ 252,642,224 $ 245,172,720
Descriptive statistics for the regressions including the “Salary” variable are as follows.

Determinants of Successful Technology Transfer 12
Variable N Min Max Mean Std. Deviation
Patents Issued 519 0 219 22.9823 28.8897
Start-Ups 519 0 31 3.2852 4.0741
Licenses/Options Executed 519 0 232 31.3410 38.0848
License Income 519 $ 0 $ 184,632,915 $ 7,651,613 $18,463,747
Private 519 0 1 0.2659 0.4422
Metro 519 0 1 0.9152 0.2788
Technology Index 519 1 362 106.7669 102.7862
Creative Class 519 17 48.4 33.2222 6.7232
Salary 519 $ 58,125 $ 234,758 $ 118,037 $ 32,512
Students 519 1376 58465 22436.3333 11345.2828
TTO Years 519 0 74 19.3565 13.7590
TTO FTEs 519 0.2 58.88 8.562061657 8.673929217
Expenditures 519 $ 4,319,934 $ 1,757,268,191 $ 247,687,985 $ 248,496,479
VIII. REGRESSIONS RESULTS
Although various research institutes have developed their own indices of high-tech
companies and high-tech cities (Milken Institute and Martin Prosperity Institute, respectively),
universities have not yet been ranked based solely on technology and licensing activities. This
paper will serve as a starting point of what factors tend to make a university most successful with
technology transfer, using regression analysis to show statistical significance, or lack thereof.
Several regressions will be ran in order to test various dependent variables against a common
set of independent variables. There will be four regressions (1-4) ran without the “Salary”
variable and four regressions (5-8) ran with the “Salary” variable, against the four dependent
variables previously specified, for a total of eight regressions. In each regression, the dependent
variables represent an output of technology transfer, while the independent variables represent
inputs to technology transfer.

Determinants of Successful Technology Transfer 13
One-tailed significance tests were used for all variables, because of strong assumptions
regarding the expected coefficient sign.
The results of each regression are laid out below, while the variables are discussed on an
individual basis in the “Variable Results” section.
Regression 1 – Patents Issued, without Salary
The results of Regression 1, using “Patents Issued” as the dependent variable, and not
including the “Salary” variable, can be found below.
PATENTS ISSUED, without Salary
Regression 1 Statistics Multiple R 0.7500 R Square 0.5625 Adjusted R Square 0.5567 Standard Error 18.4769 Observations 606
ANOVA df SS MS F Significance F
Regression 8 262084.3 32760.54 95.9611 5.4E-102 Residual 597 203812.2 341.39
Total 605 465896.6
Coefficients Standard
Error t Stat P-value Lower 95% Upper 95%
Intercept -3.7960 8.3051 -0.4571 0.6478 -20.1066 12.5147
Private 4.2219 2.0264 2.0834** 0.0376 0.2421 8.2018
Metro -11.6591 4.2931 -2.7158*** 0.0068 -20.0905 -3.2277
Technology Index -0.0314 0.0135 -2.3202** 0.0207 -0.0579 -0.0048
Creative Class 0.5426 0.2139 2.5362*** 0.0115 0.1224 0.9628
Students -5.6E-05 8.53E-05 -0.6608 0.5090 -0.0002 0.0001
TTO Years 0.3355 0.0685 4.8958*** 1.26E-06 0.2009 0.4701
TTO FTEs 0.3893 0.1709 2.2782** 0.0231 0.0537 0.7250
Expenditures 5.08E-08 6.19E-09 8.2070*** 1.4E-15 3.86E-08 6.29E-08

Determinants of Successful Technology Transfer 14
* denotes significance at the .10 level (t-Stat > 1.30 or < -1.30) ** denotes significance at the .05 level (t-Stat > 1.67 or < -1.67) *** denotes significance at the .01 level (t-Stat > 2.39 or < -2.39)
Regression 1 has an R-Square of 0.5625, showing a moderately strong correlation. Metro, ,
Creative Class, TTO Years, and Expenditures are all highly significant at the 0.01 level. Private,
Technology Index, and TTO FTEs are significant at the 0.05 level. Only Students was not
significant. Most variables had the expected sign, except for Metro and Students, which had
negative signs. The calculated impact of each variable is shown below.
Coefficients Std. Dev. Impact
Private 4.2219
4.2219
Metro -11.6591
-11.6591
Technology Index -0.0314 105.1329 -3.2977
Creative Class 0.5426 6.7869 3.6826
Students -0.0001 11,478.7474 -0.6470
TTO Years 0.3355 13.0264 4.3701
TTO FTEs 0.3893 8.9200 3.4729
Expenditures 5.08E-08 245,172,720 12.4532
These calculations show that Expenditures and Metro have a much greater impact than any
other independent variables on the number of patents issued. The other variables have similar
impacts, for the most part.
Regression 2 – Start-Ups, without Salary
The results of Regression 2, using “Start-Ups” as the dependent variable, and not
including the “Salary” variable, can be found below.
START-UPS, without Salary
Regression Statistics

Determinants of Successful Technology Transfer 15
Multiple R 0.6528 R Square 0.4261 Adjusted R
Square 0.4184 Standard Error 3.0272 Observations 606
ANOVA df SS MS F Significance F
Regression 8 4062.4016 507.8002 55.4135 3.59E-67 Residual 597 5470.8146 9.1638
Total 605 9533.2162
Coefficients Standard
Error t Stat P-value Lower 95% Upper 95%
Intercept 3.1300 1.3607 2.3004 0.0218 0.4578 5.8023
Private -0.1210 0.3320 -0.3645 0.7156 -0.7730 0.5310
Metro -0.6905 0.7034 -0.9817 0.3266 -2.0719 0.6908
Technology Index -0.0094 0.0022 -4.2542*** 2.44E-05 -0.0138 -0.0051
Creative Class -0.0412 0.0351 -1.1757 0.2402 -0.1101 0.0276
Students 3.27E-06 1.4E-05 0.2342 0.8149 -2.4E-05 3.07E-05
TTO Years 0.0540 0.0112 4.8098*** 1.91E-06 0.0319 0.0760
TTO FTEs 0.0829 0.0280 2.9604*** 0.0032 0.0279 0.1379
Expenditures 5.16E-09 1.01E-09 5.0872*** 4.87E-07 3.17E-09 7.15E-09 * denotes significance at the .10 level (t-Stat > 1.30 or < -1.30) ** denotes significance at the .05 level (t-Stat > 1.67 or < -1.67) *** denotes significance at the .01 level (t-Stat > 2.39 or < -2.39)
Regression 2, shows that the variables Technology Index, TTO Years, FTEs in TTO, and
Expenditures are highly significant at the 0.01 level with the expected sign, while all other
variables are not significant. Private, Metro, and Creative Class have unexpected negative signs,
but since none of these variables were significant this does not cause alarm. The R-Square of
0.4261 shows a moderate correlation. The calculated impact of each variable is shown below.
Coefficients Std. Dev. Impact
Private -0.1210
-0.1210
Metro -0.6905
-0.6905
Technology Index -0.0094 105.1329 -0.9906
Creative Class -0.0412 6.7869 -0.2797

Determinants of Successful Technology Transfer 16
Students 0.0000 11,478.7474 0.0376
TTO Years 0.0540 13.0264 0.7034
TTO FTEs 0.0829 8.9200 0.7394
Expenditures 0.0000 245,172,720 1.2647
Compared to Regression 1, the impacts for each variable in Regression 2 are quite small.
Expenditures once again had the highest impact.
Regression 3 – Licenses/Options Executed, without Salary
The results of Regression 3, using “Licenses/Options Executed” as the dependent
variable, and not including the “Salary” variable, can be found below.
LICENSES/OPTIONS EXECUTED, without Salary
Regression Statistics Multiple R 0.7418 R Square 0.5502 Adjusted R
Square 0.5442 Standard Error 24.8743 Observations 606
ANOVA df SS MS F Significance F
Regression 8 451924.3127 56490.54 91.3004 1.96E-98 Residual 597 369383.3259 618.7325
Total 605 821307.6386
Coefficients Standard Error t Stat P-value Lower 95% Upper 95%
Intercept -26.7774 11.1806 -2.3950 0.0169 -48.7356 -4.8193
Private -4.3432 2.7281 -1.5920* 0.1119 -9.7010 1.0146
Metro -7.7348 5.7796 -1.3383* 0.1813 -19.0856 3.6159
Technology Index 0.0231 0.0182 1.2666 0.2058 -0.0127 0.0588
Creative Class 0.8707 0.2880 3.0232*** 0.0026 0.3051 1.4364
Students 0.0001 0.0001 1.0915 0.2755 -0.0001 0.0004
TTO Years 0.4456 0.0922 4.8303*** 1.74E-06 0.2644 0.6268
TTO FTEs 1.7297 0.2301 7.5183*** 2.04E-13 1.2779 2.1816

Determinants of Successful Technology Transfer 17
Expenditures 3.32E-08 8.33198E-09 3.9855*** 7.57E-05 1.68E-08 4.96E-08 * denotes significance at the .10 level (t-Stat > 1.30 or < -1.30) ** denotes significance at the .05 level (t-Stat > 1.67 or < -1.67) *** denotes significance at the .01 level (t-Stat > 2.39 or < -2.39)
This regression has an R-Square of 0.5502, suggesting a moderately strong correlation.
Regression 3 also shows that all variables except Technology Index and Students are significant.
Creative Class, TTO Years, TTO FTEs, and Expenditures are highly significant at the 0.01 level.
The coefficient signs on Private and Metro are negative and the sign on Technology Index is
positive, none of which are as predicted, but the Private and Metro variables are only significant
at the 0.10 level and Technology Index is not significant. The calculated impact of each variable
is shown below.
Coefficients Std. Dev. Impact
Private -4.3432
-4.3432
Metro -7.7348
-7.7348
Technology Index 0.0231 105.1329 2.4236
Creative Class 0.8707 6.7869 5.9096
Students 0.0001 11,478.7474 1.4387
TTO Years 0.4456 13.0264 5.8044
TTO FTEs 1.7297 8.9200 15.4293
Expenditures 0.0000 245,172,720 8.1414
TTO FTEs has a very large impact on the number of licenses executed; Expenditures and
Metro also have large impacts compared to the other variables.
Regression 4 – License Income, without Salary
The results of Regression 4, using “License Income” as the dependent variable, and not
including the “Salary” variable, can be found below.

Determinants of Successful Technology Transfer 18
LICENSE INCOME, without Salary
Regression Statistics Multiple R 0.5440 R Square 0.2959 Adjusted R
Square 0.2865 Standard Error 19009286 Observations 606
ANOVA df SS MS F Significance F
Regression 8 9.067E+16 1.13E+16 31.3642 3.93302E-41 Residual 597 2.157E+17 3.61E+14
Total 605 3.064E+17
Coefficients Standard
Error t Stat P-value Lower 95% Upper 95%
Intercept -1.3E+07 8544383 -1.5566 0.1201 -30080600.52 3480803.98
Private 11938894 2084843 5.7265*** 1.63E-08 7844375.54 16033412.99
Metro 1119177 4416810 0.2534 0.8001 -7555196.01 9793550.93
Technology Index 13633.94 13909 0.9803 0.3274 -13681.65 40949.52
Creative Class -1132.21 220106 -0.0051 0.9959 -433408.80 431144.38
Students 325.20 87.76 3.7058*** 0.0002 152.86 497.55
TTO Years 5372.76 70497 0.0762 0.9393 -133080.35 143825.87
TTO FTEs 1305904 175822 7.4274*** 3.85E-13 960598.75 1651210.15
Expenditures -0.01 0.01 -1.5577* 0.1198 -0.02 0.00 * denotes significance at the .10 level (t-Stat > 1.30 or < -1.30) ** denotes significance at the .05 level (t-Stat > 1.67 or < -1.67) *** denotes significance at the .01 level (t-Stat > 2.39 or < -2.39)
Regression 4 has the lowest R-Square, of 0.2959. This suggests that there is a weak
correlation between these independent variables and the license income universities receive. This
conclusion makes sense because license income may reflect technology transfer efforts from
many years back. Private, Students, and TTO FTEs are highly significant, at 0.01, and
Expenditures is slightly significant, at 0.10. All coefficients, except for Technology Index and
Expenditures, have the expected sign. Since these variables are not significant and slightly

Determinants of Successful Technology Transfer 19
significant, respectively, the signs are not point of concern. The calculated impacts are shown
below.
Coefficients Std. Dev. Impact
Private 11,938,894.2629
11,938,894.2629
Metro 1,119,177.4582
1,119,177.4582
Technology Index 13,633.9372 105.1329 1,433,375.4964
Creative Class -1,132.2141 6.7869 -7,684.2656
Students 325.2030 11,478.7474 3,732,923.0240
TTO Years 5,372.7578 13.0264 69,987.9315
TTO FTEs 1,305,904.4513 8.9200 11,648,723.3659
Expenditures -0.0099 245,172,720 -2,431,670.5472
Private had the greatest impact in this regression, with TTO FTEs close behind. Students,
Expenditures, Technology Index, and Metro also had fairly large impacts on license income.
Regression 5 – Patents Issued, with Salary
The results of Regression 5, using “Patents Issued” as the dependent variable, including
the “Salary” variable, can be found below.
PATENTS ISSUED, with Salary
Regression Statistics Multiple R 0.7529
R Square 0.5669 Adjusted R
Square 0.5593 Standard Error 19.0656 Observations 526
ANOVA df SS MS F Significance F
Regression 9 245479.1998 27275.46665 75.0365 5.99E-88 Residual 516 187563.9773 363.4960801
Total 525 433043.1772

Determinants of Successful Technology Transfer 20
Coefficients Standard
Error t Stat P-value Lower 95% Upper 95%
Intercept -7.3085 9.8856 -0.7393 0.4601 -26.7294 12.1124
Private 5.4968 2.3334 2.3557** 0.0189 0.9127 10.0810
Metro -12.4816 4.8898 -2.5526*** 0.0110 -22.0878 -2.8753
Technology Index -0.0270 0.0160 -1.6876** 0.0921 -0.0584 0.0044
Creative Class 0.6903 0.2411 2.8638*** 0.0044 0.2168 1.1639
Salary -2.2E-06 3.1792E-05 -0.0697 0.9445 -6.5E-05 6.02E-05
Students -0.0001 8.66478E-05 -1.3257* 0.1855 -0.0003 5.54E-05
TTO Years 0.3412 0.0748 4.5600*** 6.4E-06 0.1942 0.4882
TTO FTEs 0.4772 0.1933 2.4686*** 0.0139 0.0974 0.8569
Expenditures 5E-08 6.72395E-09 7.4386*** 4.28E-13 3.68E-08 6.32E-08 * denotes significance at the .10 level (t-Stat > 1.30 or < -1.30) ** denotes significance at the .05 level (t-Stat > 1.67 or < -1.67) *** denotes significance at the .01 level (t-Stat > 2.39 or < -2.39)
Regression 5 has an R-Squared of 0.5669, a moderately strong correlation. This is only
.0044 more than Regression 1, which used the same dependent variable, but did not include
salary data. Metro, Creative Class, TTO Years, TTO FTEs, and Expenditures are highly
significant, at 0.01. Private and Technology Index are significant at 0.05. Students is slightly
significant. The newly included Salary variable was not significant. Metro’s coefficient is
unexpectedly negative; the reason for this is unclear. Salary and Students also had a negative
sign, but this is not point of concern. The calculated impacts are shown below.
Coefficients Std. Dev. Impact
Private 5.4968
5.4968
Metro -12.4816
-12.4816
Technology Index -0.0270 102.7862 -2.7742
Creative Class 0.6903 6.7232 4.6413
Salary 0.0000 32,512.4321 -0.0720
Students -0.0001 11,345.2828 -1.3032
TTO Years 0.3412 13.7590 4.6944
TTO FTEs 0.4772 8.6739 4.1390
Expenditures 0.0000 248,496,479 12.4289

Determinants of Successful Technology Transfer 21
Metro and Expenditures had significant negative and positive impacts, respectively, on
the number of patents issued.
Regression 6 – Start-Ups, with Salary
The results of Regression 6, using “Start-Ups” as the dependent variable, and including
the “Salary” variable, can be found below.
START UPS, with Salary
Regression Statistics Multiple R 0.6549
R Square 0.4288 Adjusted R Square 0.4189 Standard Error 3.0953 Observations 526
ANOVA df SS MS F Significance F
Regression 9 3711.8369 412.4263 43.0461 2.26E-57 Residual 516 4943.8152 9.5810
Total 525 8655.6521
Coefficients Standard Error t Stat P-value Lower 95%
Upper 95%
Intercept 2.5077 1.6049 1.5625 0.1188 -0.6453 5.6607
Private 0.0976 0.3788 0.2576 0.7969 -0.6467 0.8418
Metro -1.4080 0.7939 -1.7736** 0.0767 -2.9676 0.1516
Technology Index -0.0101 0.0026 -3.9071*** 0.0001 -0.0152 -0.0050
Creative Class -0.0157 0.0391 -0.4022 0.6877 -0.0926 0.0611
Salary 7.52E-06 5.16E-06 1.4569* 0.1458 -2.6E-06 1.77E-05
Students -2.64E-06 1.41E-05 -0.1875 0.8513 -3E-05 2.5E-05
TTO Years 0.0493 0.0121 4.0573*** 5.73E-05 0.0254 0.0732
TTO FTEs 0.0808 0.0314 2.5747*** 0.0103 0.0191 0.1425
Expenditures 4.73E-09 1.09E-09 4.3374*** 1.73E-05 2.59E-09 6.88E-09 * denotes significance at the .10 level (t-Stat > 1.30 or < -1.30) ** denotes significance at the .05 level (t-Stat > 1.67 or < -1.67) *** denotes significance at the .01 level (t-Stat > 2.39 or < -2.39)
Determinants of Successful Technology Transfer 22
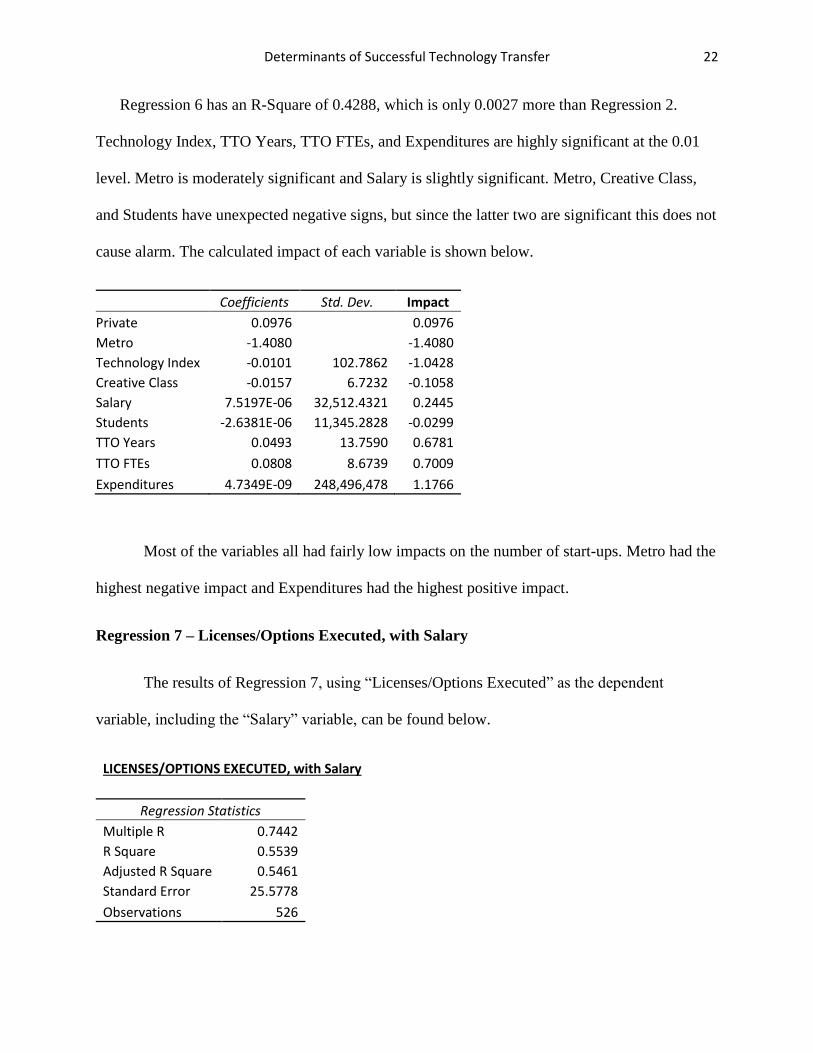
Regression 6 has an R-Square of 0.4288, which is only 0.0027 more than Regression 2.
Technology Index, TTO Years, TTO FTEs, and Expenditures are highly significant at the 0.01
level. Metro is moderately significant and Salary is slightly significant. Metro, Creative Class,
and Students have unexpected negative signs, but since the latter two are significant this does not
cause alarm. The calculated impact of each variable is shown below.
Coefficients Std. Dev. Impact
Private 0.0976
0.0976
Metro -1.4080
-1.4080
Technology Index -0.0101 102.7862 -1.0428
Creative Class -0.0157 6.7232 -0.1058
Salary 7.5197E-06 32,512.4321 0.2445
Students -2.6381E-06 11,345.2828 -0.0299
TTO Years 0.0493 13.7590 0.6781
TTO FTEs 0.0808 8.6739 0.7009
Expenditures 4.7349E-09 248,496,478 1.1766
Most of the variables all had fairly low impacts on the number of start-ups. Metro had the
highest negative impact and Expenditures had the highest positive impact.
Regression 7 – Licenses/Options Executed, with Salary
The results of Regression 7, using “Licenses/Options Executed” as the dependent
variable, including the “Salary” variable, can be found below.
LICENSES/OPTIONS EXECUTED, with Salary
Regression Statistics Multiple R 0.7442
R Square 0.5539 Adjusted R Square 0.5461 Standard Error 25.5778 Observations 526
Determinants of Successful Technology Transfer 23
ANOVA df SS MS F Significance F
Regression 9 419077.1 46564.13 71.17435 1.15E-84 Residual 516 337580.7 654.2262
Total 525 756657.9
Coefficients Standard
Error t Stat P-value Lower 95% Upper 95%
Intercept -23.7349 13.2622 -1.7897 0.0741 -49.7894 2.3196
Private -4.2139 3.1304 -1.3461* 0.1789 -10.3638 1.9361
Metro -8.8423 6.5600 -1.3479* 0.1783 -21.7298 4.0452
Technology Index 0.0209 0.0215 0.9753 0.3299 -0.0212 0.0631
Creative Class 1.0102 0.3234 3.1236*** 0.0019 0.3748 1.6455
Salary -6.2E-05 4.27E-05 -1.4574* 0.1456 -0.0001 2.16E-05
Students 7.62E-05 0.0001 0.6559 0.5122 -0.0002 0.0003
TTO Years 0.4914 0.1004 4.8958*** 1.31E-06 0.2942 0.6886
TTO FTEs 2.0671 0.2593 7.9711*** 1.02E-14 1.5577 2.5766
Expenditures 2.78E-08 9.02E-09 3.0815*** 0.0022 1.01E-08 4.55E-08 * denotes significance at the .10 level (t-Stat > 1.30 or < -1.30) ** denotes significance at the .05 level (t-Stat > 1.67 or < -1.67) *** denotes significance at the .01 level (t-Stat > 2.39 or < -2.39)
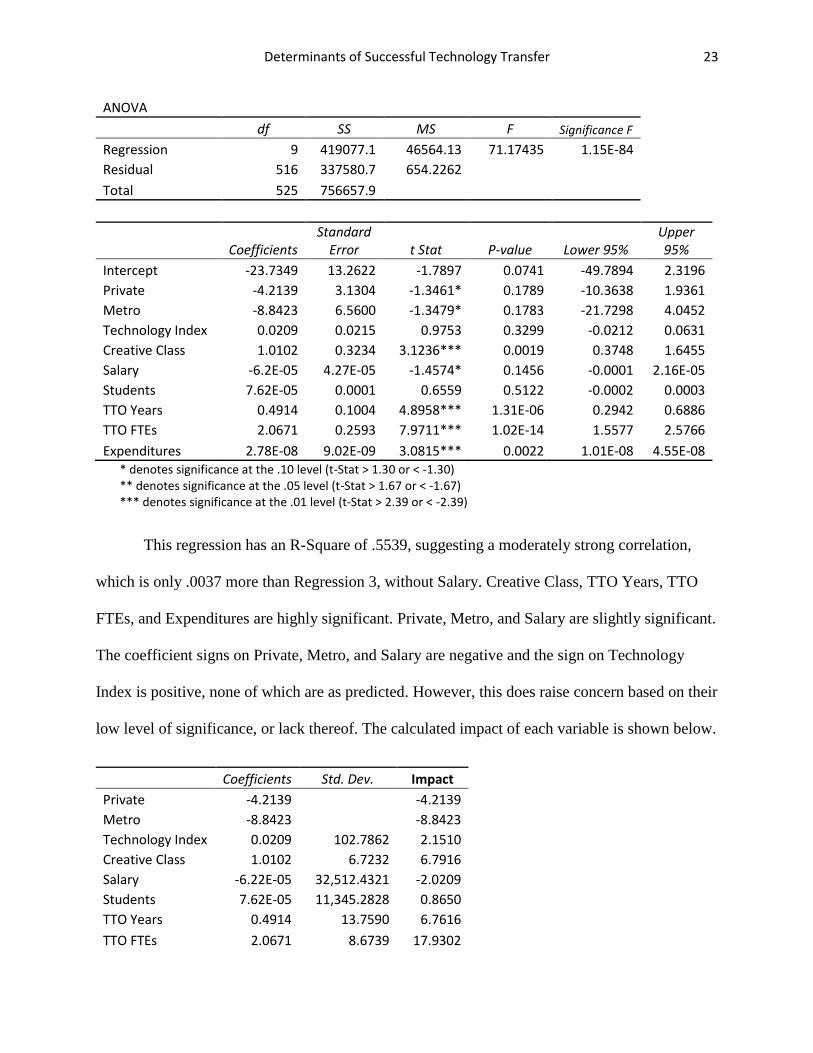
This regression has an R-Square of .5539, suggesting a moderately strong correlation,
which is only .0037 more than Regression 3, without Salary. Creative Class, TTO Years, TTO
FTEs, and Expenditures are highly significant. Private, Metro, and Salary are slightly significant.
The coefficient signs on Private, Metro, and Salary are negative and the sign on Technology
Index is positive, none of which are as predicted. However, this does raise concern based on their
low level of significance, or lack thereof. The calculated impact of each variable is shown below.
Coefficients Std. Dev. Impact
Private -4.2139
-4.2139
Metro -8.8423
-8.8423
Technology Index 0.0209 102.7862 2.1510
Creative Class 1.0102 6.7232 6.7916
Salary -6.22E-05 32,512.4321 -2.0209
Students 7.62E-05 11,345.2828 0.8650
TTO Years 0.4914 13.7590 6.7616
TTO FTEs 2.0671 8.6739 17.9302
Determinants of Successful Technology Transfer 24
Expenditures 2.78E-08 248,496,479 6.9075
TTO FTEs has a much higher impact on licenses/options executed than other variables.
Metro, Expenditures, Creative Class, and TTO Years also have large impacts.
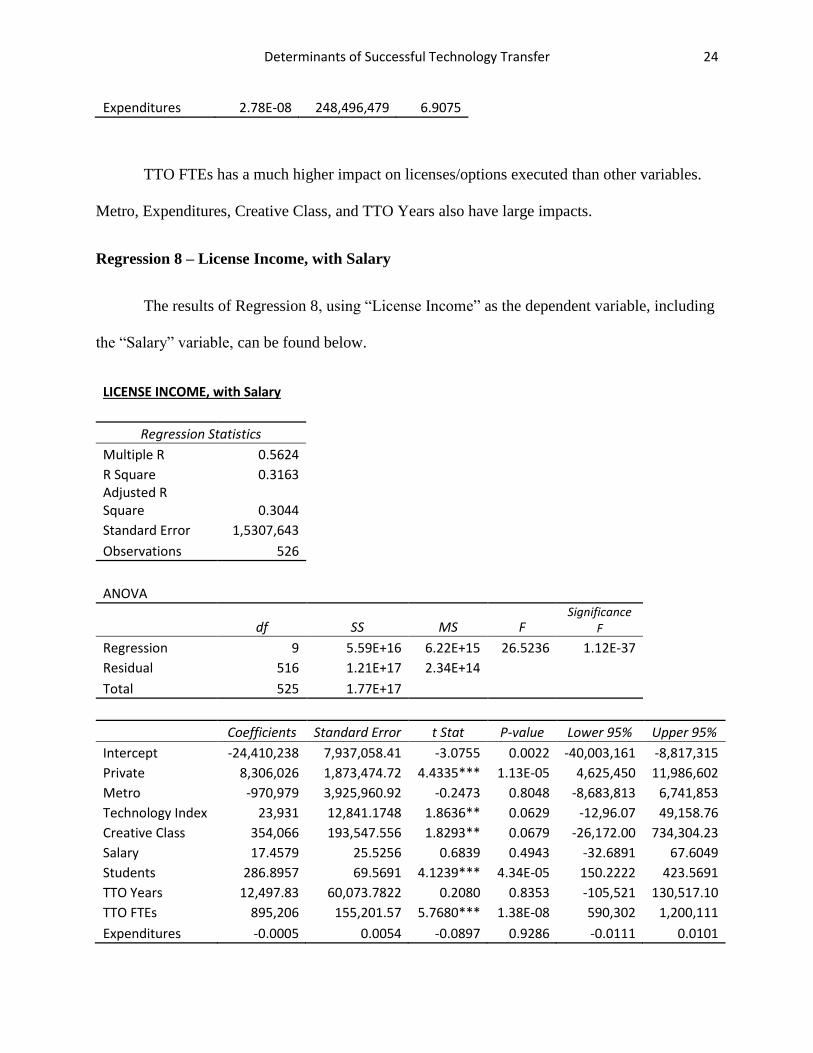
Regression 8 – License Income, with Salary
The results of Regression 8, using “License Income” as the dependent variable, including
the “Salary” variable, can be found below.
LICENSE INCOME, with Salary
Regression Statistics Multiple R 0.5624
R Square 0.3163 Adjusted R
Square 0.3044 Standard Error 1,5307,643 Observations 526
ANOVA
df SS MS F Significance
F Regression 9 5.59E+16 6.22E+15 26.5236 1.12E-37
Residual 516 1.21E+17 2.34E+14 Total 525 1.77E+17
Coefficients Standard Error t Stat P-value Lower 95% Upper 95%
Intercept -24,410,238 7,937,058.41 -3.0755 0.0022 -40,003,161 -8,817,315
Private 8,306,026 1,873,474.72 4.4335*** 1.13E-05 4,625,450 11,986,602
Metro -970,979 3,925,960.92 -0.2473 0.8048 -8,683,813 6,741,853
Technology Index 23,931 12,841.1748 1.8636** 0.0629 -12,96.07 49,158.76
Creative Class 354,066 193,547.556 1.8293** 0.0679 -26,172.00 734,304.23
Salary 17.4579 25.5256 0.6839 0.4943 -32.6891 67.6049
Students 286.8957 69.5691 4.1239*** 4.34E-05 150.2222 423.5691
TTO Years 12,497.83 60,073.7822 0.2080 0.8353 -105,521 130,517.10
TTO FTEs 895,206 155,201.57 5.7680*** 1.38E-08 590,302 1,200,111
Expenditures -0.0005 0.0054 -0.0897 0.9286 -0.0111 0.0101

Determinants of Successful Technology Transfer 25
* denotes significance at the .10 level (t-Stat > 1.30 or < -1.30) ** denotes significance at the .05 level (t-Stat > 1.67 or < -1.67) *** denotes significance at the .01 level (t-Stat > 2.39 or < -2.39)
Regression 8 has an R-Square of 0.3163. This confirms our assumption, from Regression
4 results, that there is a weak correlation between these independent variables and the license
income universities receive. This conclusion makes sense because license income may reflect
technology transfer efforts from many years back. Private, Students, and TTO FTEs are highly
significant, at 0.01. Metro and Expenditures have a negative sign, but are not significant.
Technology Index has an unexpected positive sign. The calculated impacts are shown below.
Coefficients Std. Dev. Impact
Private 8,306,026.1544
8,306,026.1544
Metro -970,979.9071
-970,979.9071
Technology Index 23,931.3426 102.7862 2,459,811.1548
Creative Class 354,066.1110 6.7232 2,380,442.0548
Salary 17.4579 32,512.4321 567,598.3369
Students 286.8957 11,345.2828 3,254,912.6043
TTO Years 12,497.8285 13.7590 171,958.0030
TTO FTEs 895,206.8229 8.6739 7,764,960.6159
Expenditures -0.0005 248,496,479 -120,298.8700
Private had the greatest impact in on license income, followed closely by TTO FTEs.
Somewhat surprisingly, Expenditures had the lowest impact. Again, this could be due to the
lagging effect of license income.
IX. VARIABLE RESULTS
Each variable will now be examined on an individual basis, to see how it performed across
the various regressions. Let’s start with the four dependent variables.

Determinants of Successful Technology Transfer 26
Patents Issued
The R-Squares of Regression 1 (without Salary) and Regression 5 (with Salary) using Patents
Issued as the dependent variable were 0.5625 and 0.5669. These values suggest a moderately
strong correlation between the independent variables and the number of patents issued.
Start-Ups
Regression 2 (without Salary) and Regression 6 (with Salary) which had Start-Ups as the
dependent variable had R-Squares of 0.4261 and 0.4288. These values indicate only a moderate
correlation between the independent variables and the number of start-up companies formed out
of a university’s technology transfer efforts.
Licenses/Options Executed
The R-Squares of Regression 3 (without Salary) and Regression 7 (with Salary) with
Licenses/Options Executed as the dependent variable were 0.5502 and 0.5539. Such R-Squares
show a moderately strong correlation between the independent variables and the number of
licenses and options executed by a university.
License Income
Regression 4 (without Salary) and Regression 8 (with Salary) had the lowest R-Squared
values of 0.2959 and 0.3163. As previously discussed, this low correlation can be explained by
the fact that licensing income in a certain year may not be reflective of that year’s technology
transfer efforts, but instead reflect activity from past years.
Determinants of Successful Technology Transfer 27
Quite noticeably, each dependent variable produced similar R-Squares whether the Salary
variable was present or not. However, the R-Squares were slightly higher for each dependent
variable in the regressions ran with salary data, than in the regressions ran without.
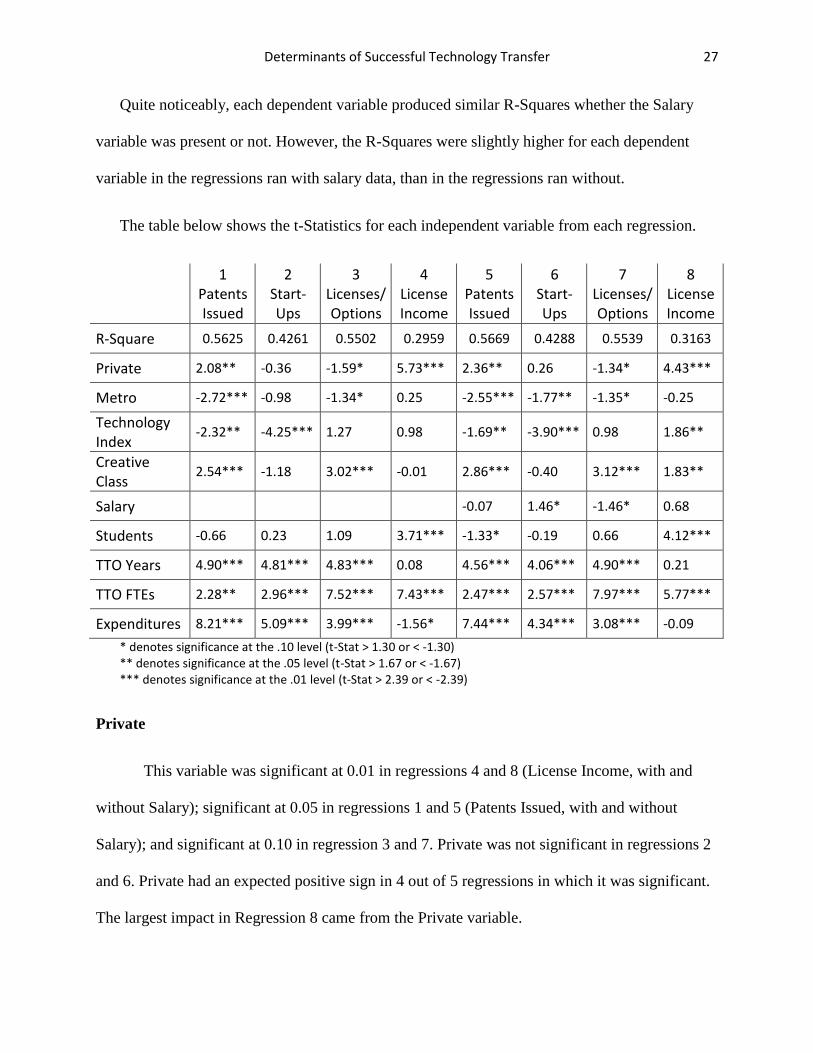
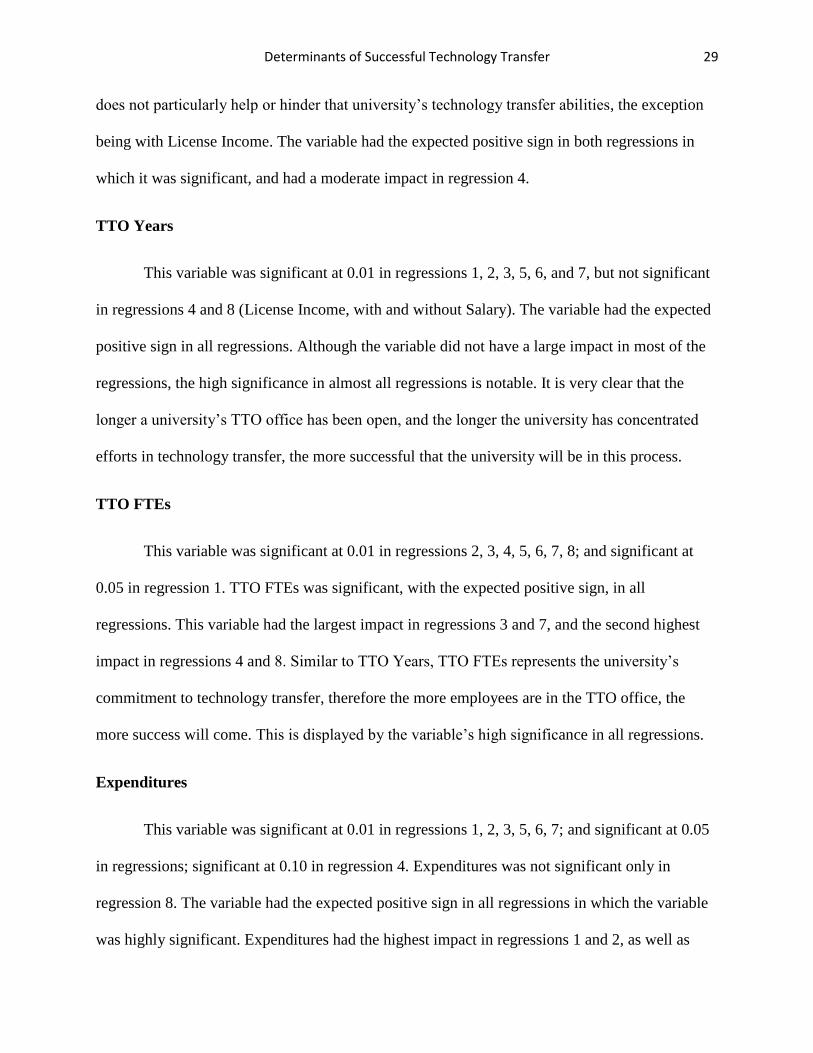
The table below shows the t-Statistics for each independent variable from each regression.
1
Patents Issued
2 Start-Ups
3 Licenses/ Options
4 License Income
5 Patents Issued
6 Start-Ups
7 Licenses/ Options
8 License Income
R-Square 0.5625 0.4261 0.5502 0.2959 0.5669 0.4288 0.5539 0.3163
Private 2.08** -0.36 -1.59* 5.73*** 2.36** 0.26 -1.34* 4.43***
Metro -2.72*** -0.98 -1.34* 0.25 -2.55*** -1.77** -1.35* -0.25
Technology Index
-2.32** -4.25*** 1.27 0.98 -1.69** -3.90*** 0.98 1.86**
Creative Class
2.54*** -1.18 3.02*** -0.01 2.86*** -0.40 3.12*** 1.83**
Salary -0.07 1.46* -1.46* 0.68
Students -0.66 0.23 1.09 3.71*** -1.33* -0.19 0.66 4.12***
TTO Years 4.90*** 4.81*** 4.83*** 0.08 4.56*** 4.06*** 4.90*** 0.21
TTO FTEs 2.28** 2.96*** 7.52*** 7.43*** 2.47*** 2.57*** 7.97*** 5.77***
Expenditures 8.21*** 5.09*** 3.99*** -1.56* 7.44*** 4.34*** 3.08*** -0.09
* denotes significance at the .10 level (t-Stat > 1.30 or < -1.30) ** denotes significance at the .05 level (t-Stat > 1.67 or < -1.67) *** denotes significance at the .01 level (t-Stat > 2.39 or < -2.39)
Private
This variable was significant at 0.01 in regressions 4 and 8 (License Income, with and
without Salary); significant at 0.05 in regressions 1 and 5 (Patents Issued, with and without
Salary); and significant at 0.10 in regression 3 and 7. Private was not significant in regressions 2
and 6. Private had an expected positive sign in 4 out of 5 regressions in which it was significant.
The largest impact in Regression 8 came from the Private variable.

Determinants of Successful Technology Transfer 28
Metro
This variable was significant at 0.01 in regressions 1 and 5 (Patents Issued, with and
without Salary); significant at 0.05 in regression 6; and significant at 0.10 in regression 3 and 7.
Metro was not significant in regressions 2, 4, and 8. Metro had an unexpected negative sign in all
4 of the regressions in which it was significant. The reason for this is very unclear. Metro had a
large negative impact in regressions 1, 3, 5, 6, 7 and 8.
Technology Index
This variable was significant at 0.01 in regressions 2 and 6; and significant at 0.05 in
regressions 1, 5 and 8. Technology Index was not significant in regressions 3, 4, and 7.
Technology Index had the expected negative sign in all regressions in which the variable was
significant. This variable had a fairly large negative impact in regressions 2 and 6.
Creative Class
This variable was significant at 0.01 in regressions 1, 3 and 7 (Licenses/Options
Executed, with and without Salary) and 5; and significant at 0.05 in regression 8. Creative Class
was not significant in regressions 2, 4, and 6. The variable had the expected positive sign in all
regressions in which the variable was significant. This variable did not have a particularly large
impact in any of the regressions.
Students
This variable was significant at 0.01 in regressions 4 and 8 (License Income, with and
without Salary); and significant at 0.10 in regression 5. Remarkably, Students was not significant
in regressions 1, 2, 3, 6, and 7. This suggests that the size of the university, in terms of students,
Determinants of Successful Technology Transfer 29
does not particularly help or hinder that university’s technology transfer abilities, the exception
being with License Income. The variable had the expected positive sign in both regressions in
which it was significant, and had a moderate impact in regression 4.
TTO Years
This variable was significant at 0.01 in regressions 1, 2, 3, 5, 6, and 7, but not significant
in regressions 4 and 8 (License Income, with and without Salary). The variable had the expected
positive sign in all regressions. Although the variable did not have a large impact in most of the
regressions, the high significance in almost all regressions is notable. It is very clear that the
longer a university’s TTO office has been open, and the longer the university has concentrated
efforts in technology transfer, the more successful that the university will be in this process.
TTO FTEs
This variable was significant at 0.01 in regressions 2, 3, 4, 5, 6, 7, 8; and significant at
0.05 in regression 1. TTO FTEs was significant, with the expected positive sign, in all
regressions. This variable had the largest impact in regressions 3 and 7, and the second highest
impact in regressions 4 and 8. Similar to TTO Years, TTO FTEs represents the university’s
commitment to technology transfer, therefore the more employees are in the TTO office, the
more success will come. This is displayed by the variable’s high significance in all regressions.
Expenditures
This variable was significant at 0.01 in regressions 1, 2, 3, 5, 6, 7; and significant at 0.05
in regressions; significant at 0.10 in regression 4. Expenditures was not significant only in
regression 8. The variable had the expected positive sign in all regressions in which the variable
was highly significant. Expenditures had the highest impact in regressions 1 and 2, as well as

Determinants of Successful Technology Transfer 30
large impacts in regressions 3, 5, 6, and 7. This data shows that Expenditures is a large factor in a
university’s success with technology transfer.
Salary
This variable was used in the last four regressions. Salary was significant at 0.10 in
regressions 6 and 7, but not significant in the other regressions and was not impactful. Such
insignificance comes as a surprise, but illustrates that the average salary for professors does not
greatly relate to the outcomes of a university’s technology transfer activities. This could be
explained by the idea that perhaps the majority of professors do not participate in the type of
research that results in these types of outcomes, such as patents and licenses.
From looking at the regression results, it appeared that Students and Expenditures may
have been correlated variables. This belief stems from the observation that Expenditures is
highly significant at 0.01 in all regressions except for 4 and 8, which also happen to be the only
regressions in which Students is highly significant. However, after running additional regressions
that excluded one of these two independent variables, on an alternating basis, the results do not
differ. When Expenditures is left out, Students is still highly significant in Regressions 4 and 8;
likewise, when Students is dropped, Expenditures is still insignificant in those regressions and
highly significant in all others.
X. CONCLUSION
This research project was initiated with the goal of determining what factors make a
university most successful during the technology transfer process. Although assumptions could
be made on this subject, there is a lack of empirical research to back up these assumptions. By
Determinants of Successful Technology Transfer 31
testing various inputs to technology transfer (independent variables) against an array of outputs
(dependent variables) we are better able to analyze the many factors involved in the process and
eliminate potential for leaving out key pieces of insight.
Through regression analysis, valuable insight was obtained. Patents Issued and
Licenses/Options Executed had moderately strong correlations to the set of independent
variables, Start-Ups had a moderate correlation, and License Income had a weak correlation.
Among independent variables, TTO Years, TTO FTEs, and Expenditures were shown to be
incredibly significant to the technology transfer process. On the flip side, Students and Salary did
not appear to have too much of an impact. However, Students was highly significant in both
regressions involving License Income.
In conclusion, this paper clearly empirically shows that if universities wish to be successful
with their technology transfer programs, they should increase resources that directly affect the
process, such as establishing a Technology Transfer office and hiring an adequate amount of
employees for the office. Additionally, the more resources and money that a university invests in
its research projects, the more that they will reap the rewards. While there is much more research
to be done around the topic of technology transfer, this paper provides a key start.

Determinants of Successful Technology Transfer 32
References
About Technology Transfer. (n.d.). Association of University Technology Managers. Retrieved
September 24, 2013, from http://www.autm.net/Tech_Transfer/12076.htm
Association of University Technology Managers. Statistics Analysis for Technology Transfer
Database. Available from http://www.autm.net/source/STATT/
DeVol, Ross and Perry Wong. (1999). America’s High Tech Economy: Growth, Development
and Risks for Metropolitan Areas. Milken Institute.
Florida, R. L. (2012). The Rise of the Creative Class, Revisited. New York: Basic Books.
Innovation's Golden Goose. (2002, December 14). The Economist, Technology Quarterly.
National Center for Education Statistics. Integrated Postsecondary Education Data System.
Available from nces.ed.gov/ipeds