determinants of soybean adoption and performance in
TRANSCRIPT

DETERMINANTS OF SOYBEAN ADOPTION AND PERFORMANCE IN NORTHERN
GHANA
BY
COURTNEY A. TAMIMIE
THESIS
Submitted in partial fulfillment of the requirements
for the degree of Master of Science in Agricultural and Applied Economics
in the Graduate College of the
University of Illinois at Urbana-Champaign, 2017
Urbana, Illinois
Adviser:
Professor Alex Winter-Nelson

ii
ABSTRACT
Soybean has capacity as a development crop to generate new sources of income for smallholder
farmers. Yet as an unfamiliar commercial crop, soybean requires farmers to move beyond
traditional production practices and market engagements in order to succeed. In this context
soybean represents a long-jump agricultural technology, requiring significant, non-incremental
changes for smallholder farmers. This research addresses the adoption process for long-jump
agricultural technologies like soybean to understand the drivers that enable or hinder farmer
participation in this dynamic agricultural market.
Specifically, I explore the role experience, space, economies of scale, demographics, market
access, and land rights play in understanding adoption and performance in soybean production
among smallholder women farmers. I consider three estimation strategies using a primary
dataset on smallholder soybean producers in the Upper West region of Ghana. I first employ
probit and ordinary least squares (OLS) regression models to understand adoption and
performance. I then employ a combined spatial-autoregressive with spatial-autoregressive
disturbances (SARAR) model using a generalized spatial two-stage least squares to understand
cross-unit interactions in a spatial dimension.
I demonstrate that there exists positive, large, and significant spatial autoregressive dependence
and knowledge spillover in soybean yields among smallholder female farmers within spatial
networks. This finding provides guidance for agricultural development programs about the
importance of social interaction and information provision through farmer networks in
improving farmer performance in soybean production. Further, I show that larger farms and
producers who allocate more land to soybean cultivation are associated with higher yields and
sustained soybean adoption, which may indicate economies of scale. Finally, I demonstrate that
experience and extension access are important drivers of success in soybean cultivation. These
findings ultimately contribute to the understanding of whether soybean as a development crop
can directly benefit smallholder farmer livelihoods.
iii
TABLE OF CONTENTS
CHAPTER 1: INTRODUCTION ................................................................................................................ 1
CHAPTER 2: LITERATURE REVIEW ..................................................................................................... 5
CHAPTER 3: SOYBEAN IN GHANA ..................................................................................................... 35
CHAPTER 4: DATA ................................................................................................................................. 38
CHAPTER 5: MODEL .............................................................................................................................. 50
CHAPTER 6: RESULTS AND DISCUSSION ......................................................................................... 59
CHAPTER 7: CONCLUSION................................................................................................................... 74
REFERENCES ........................................................................................................................................... 79

1
CHAPTER 1: INTRODUCTION
For most of the developing world, agriculture represents the largest employment sector for rural
households and is a leading contributor to national income. However, in many developing
countries, agricultural productivity is extremely low, with stagnant or even declining yields in
many parts of Sub-Saharan Africa (Doss, 2006; Damania et al., 2016). As a result, there is
tremendous interest and focus on increasing agricultural productivity through the introduction of
improved agricultural technologies and management systems. Improved agricultural
technologies have the potential to drive sustainable advances in labor productivity, incomes, food
security and general economic growth (Doss, 2006; Maertens & Barrett, 2012).
Agricultural technologies have predominantly been implemented through improved varieties of
traditional, familiar, staple crops; improvements in land, soil and water management practices;
and input and fertilizer utilization and subsidy packages (Ainembabazi & Mugisha, 2014;
Muzari, Gatsi & Muvhunzi, 2012). These types of agricultural technologies can be considered in
the context of short-jump technologies as they require farmers to engage in incremental shifts in
their existing agronomic practices and do not represent significant changes in their overall crop
production portfolios.
Short-jump, or incremental, agricultural technologies use the tacit knowledge, experience and
core competencies of farmers to improve agricultural productivity without requiring farmers to
engage in more risky endeavors often associated with long-jump agricultural technologies
(Goldsmith & Gow, 2005). Further, short-jump agricultural technologies have a high probability
of adoption and success by smallholder farmers as they build upon the traditional practices and
norms of farmers and typically require fewer new assets, have a lower risk premium and are less
expensive than long-jump agricultural technologies (Muzari et al., 2012).
Long-jump agricultural technologies are riskier than short-jump technologies as they raise
fundamental questions about how producers select appropriate strategies for their farm and can
require smallholder farmers to adopt not only a new crop, but new cropping and marketing
practices as well. In this context, producers inherently possess little tacit knowledge relevant to
the new agricultural technology and must move beyond their core competencies to be successful.
For producers, this may mean shifting their focus from a subsistence and consumption

2
production framework to one focused on the business and marketing of their agricultural
products (Osmani, Islam, Ghosh, & Hossain, 2014). This thesis explores commercial soybean
farming as an example of a long-jump agricultural technology.
Commercial farming occurs when households make product choice and input use decisions
based on profit maximization, rather than on subsistence determinants. The shift from
subsistence to commercial farming presents significant risk for farmers as their interaction with
markets and dependence on market transactions increases. When farmers make this shift, they
encounter a new dependence on markets for input, equipment and service procurement; grain
aggregation, sales and storage; technical training; and access to information providers to offset
the steep learning curve associated with new crop and production practices.
This new level of market reliance exposes farmers to high variability in the prices of farm
products, inputs, services and equipment and creates farmer dependence on market conditions
and market access (Immink & Alarcon, 1993; Osmani et al., 2015). Further, inefficient
marketing institutions and inadequate rural infrastructure can inhibit the ability, interest and
performance of smallholders who choose to move to commercial farming practices. The level,
quality and diffusion of information provision through both formal channels and informal
channels changes over time as well. These changing market and information characteristics also
affect the adoption process for farmers engaging in new commercial crop production, and
subsequently affect the performance and persistence of adoption. Finally, in some cases,
commercial farming may substitute for traditional staple crop production, resulting in farmers
becoming more reliant on market prices and availability for their household consumption needs
(Immink & Alarcon, 1993).
While these potential constraints certainly warrant attention, policy-makers, development
agencies and donors continue to see commercial farming as integral to sustainable development
for smallholder producers. Commercial production can move smallholder farmers out of poverty
by generating new sources of income for farming families, increasing the dietary diversity in the
household and increasing household expenditures on education, healthcare and non-food
consumption (Osmani et al., 2015). Further, increased domestic production of commercial crops
can improve local, regional, and national economic growth.
3
Equally important in the identification, development and rollout of an agricultural technology is
understanding the drivers of the technology adoption process to ensure that the goals of
improved farmer livelihoods, increased overall productivity and improved economic growth are
achieved. Understanding the technology adoption process enables researchers and policy-
makers to identify and reduce constraints to adoption, quantify impacts on poverty, hunger and
economic development and set priorities for future research in agricultural technology
development (Doss, 2006).
The technology adoption process in the context of short-jump, incremental agricultural
technologies is well researched (Maertens & Barrett, 2012; Ainembabazi & Mugisha, 2014;
Ward, Ortega, Spielman & Singh, 2014; Ward & Pede, 2015; Damania et al., 2016). Findings
from this literature point to a number of important areas of consideration in determining if, how,
and at what pace a farmer decides to adopt agricultural technologies that are incremental in
nature. These areas include resource endowments such as available land, labor, mechanization
and livestock; the existence of credit and input and output markets; risk and uncertainty;
differences in soil, weather and land quality; and human capital such as education, farming
experience and extension information access (Ainembabazi & Mugisha, 2014). Additional
research underlines the importance of transaction costs, spatial interaction and social networks in
influencing the adoption of agricultural technologies (Conley & Udry, 2001; Maertens & Barrett,
2012; Ward et al., 2014; Damania et al., 2016).
Despite the considerable amount of literature focused on the adoption process for short-jump
agricultural technologies, the adoption process for long-jump agricultural technologies is less
understood. Long-jump agricultural technologies do not operate within the same contextual
framework as short-jump technologies as they represent significant, non-incremental changes to
a farmer’s existing production practices and engagement with markets. These non-incremental
agricultural technologies do not build on the tacit knowledge, experience and core competencies
of farmers as incremental agricultural technologies do.
The contribution and focus of this research is thus to examine the adoption process for
commercial soybean farming as an example of a long-jump agricultural technology. Due to the
growing global demand for soybean as an animal feed and edible oil resource, policy-makers,

4
development agencies and donors recognize the potential for soybean to generate new sources of
income for smallholder farmers (Dogbe et al., 2013).
Yet as a new, unfamiliar commercial crop, soybean involves a number of critical, complex and
market-oriented components that affect technology adoption and performance. Successful
soybean production requires inputs such as fertilizer and inoculum (Bradyrhizobia inoculum is a
naturally occurring bacteria that helps enhance the nitrogen-fixing capacity of soybean through
root nodulation) and mechanization to improve seed and grain quality and reduce labor and time
burdens on the household. Further, soybean producers must access markets to purchase inputs,
seed, and services and may benefit from interaction with neighboring farmers to aggregate grain,
and achieve volume discounts for input procurement. Thus as farmers decide whether to engage
in soybean production, these market drivers require them to shift their focus from subsistence
production to the business and marketing of their agricultural products (Goldsmith & Gow,
2005).
This research identifies the critical drivers that enable or hinder farmer entry into the soybean
market. Understanding these drivers provides insight into the role smallholder farmers may play
in supplying the increased local production needed to meet the growing demand for soybean.
These insights are critical to understanding whether soybean can ultimately directly benefit
smallholder livelihoods, and if soybean production can successfully move smallholders from
traditional, low-input modes of production that make it difficult to escape the cycle of poverty
(Damania et al., 2016).
The setting for my research is the Upper West region of Ghana where the primary dataset
involves smallholder female soybean producers. I employ three estimation strategies to
understand how different drivers affect soybean sustained adoption, intermittent adoption, and
performance, as well as how spatial interactions and spatial dependence affect these outcomes.

5
CHAPTER 2: LITERATURE REVIEW
Returns to agricultural technologies can be far reaching, impacting both rural and national
economies in Sub-Saharan Africa (Muzari et al., 2012). Further, agricultural technologies can
increase agricultural productivity and incomes, leading to improved food security (Maertens &
Barrett, 2012). Yet farmers must see the benefit of these agricultural technologies, decide to
adopt them and appropriately implement them in a sustained fashion to achieve these larger
development goals (Muzari et al., 2012). Further, improved technologies may not be
immediately or completely adopted throughout a given population (Maertens & Barrett, 2012).
Thus a substantial body of literature has sought to address and understand the technology
adoption process – specifically the mechanisms underlying how, why, if, and when these
agricultural technologies are adopted by smallholder farmers in the developing world (Doss,
2006; Ward et al., 2014).
Long-jump vs. short-jump technologies
In the context of agricultural technologies, a distinction can be drawn between long-jump and
short-jump technologies. Feder, Just and Zilberman (1985) in their seminal survey of the
adoption of agricultural innovations in developing countries originally defined the difference
between these two types of agricultural technologies. This survey identifies the case in which
modern agricultural technologies can have two components: one that is neutral to scale (short-
jump, incremental) and one that is positive to scale (long-jump, non-incremental, or “lumpy”).
Long-jump agricultural technologies require fixed installation costs regardless of total farm size
and, because of the risk and credit constraints associated with these technologies, farmers may
delay or avoid adoption altogether. Further, there will be a critical farm size such that only
larger farms will adopt the lumpy, non-incremental agricultural technology (Feder et al., 1985).
Although the early literature focuses on physical investment as the fixed cost that defines a long-
jump technology, it is possible to consider an investment in learning as a fixed cost even if there
is no lumpy physical input. Any technology that represents a dramatic change in current
production or marketing practices could be considered as a long-jump technology if the learning
requirements are significant.
6
Conversely, short-jump, or incremental, agricultural technologies are not as risky. Examples of
incremental agricultural technologies are those that are associated with the Green Revolution.
These technologies did not present any credit or tenure constraints to the farmer when
considering adoption (Feder et al., 1985). Short-jump, incremental agricultural technologies are
typically applied within the context of staple, familiar and traditional crops with which
smallholder farmers already have experience producing. In this context, the farmer’s overall
production portfolio remains unchanged, and the agricultural technology is defined by an
incremental shift in the farmer’s production practice.
In the adoption of short-jump agricultural technologies, farmers continue producing within a
framework of staple, traditional and familiar crops and are not required to purchase new inputs,
change the scale of their production, enter into new commercial environments, or significantly
shift their cultivation norms and practices. The application of short-jump agricultural
technologies within the context of staple and traditional crops has sought to address the looming
food and agricultural crisis in Sub-Saharan Africa, a region that has shifted from self-sufficiency
in production to becoming a net food importer (Muzari et al., 2012).
The adoption of incremental, short-jump agricultural technologies has been widely researched.
Ward and Pede (2015) examined farmer demand and adoption of drought-tolerant rice cultivars
in India. In this analysis, existing rice-producing households were given the choice of adopting
hybrid or varietal drought-tolerant (DT) rice cultivars. While the hybrid DT rice cultivars
required farmers to purchase new seed every year and used lower seeding rates as compared to
the varietal cultivars, other aspects of the farmer’s rice cultivation practices remained unchanged.
Further, the DT rice cultivars required no additional inputs for enhanced productivity. In this
context, the DT rice cultivars represented an incremental agricultural technology as farmers were
required to make a marginal, non-significant and approachable change at one point in their
production cycle without altering their traditional crop production choices.
Further, as existing rice-producing households, farmers were familiar with cultivating this staple
crop. Thus in adopting the DT rice cultivar, farmers could rely on their tacit knowledge, norms
and experience. Hybrid rice production in India is also generally well known and supported, and
is not an unfamiliar cultivation practice. The Government of India targeted 25% of all rice
production to be undertaken using hybrid rice by 2015 and 24% of farmers in the poorer

7
northeastern states where the study took place had cultivated hybrid rice at least once as of 2009
(Ward & Pede, 2015). These statistics display a context in which DT rice cultivars were
relatively well known among smallholder farmers, were utilized by smallholders in the past and
were supported by the public sector. Thus farmers were able to rely upon their knowledge of a
familiar crop and its associated production practices as well as a familiar agricultural technology
when determining whether or not to adopt the DT rice cultivar.
Herath and Takeya (2003) examined farmer adoption of intercropping in the production of
rubber among smallholder farmers in Sri Lanka. Rubber production is widespread and familiar
to smallholder farmers in Sri Lanka. 70% of total rubber growers in Sri Lanka are smallholders
farming on less than 4 hectares of land and 8% of all agricultural land in Sri Lanka is dedicated
to rubber production. Thus rubber is not a new crop to Sri Lanka and is already considered a
commercial crop among smallholder farmers. With its historical status as a commercial crop,
farmers are already integrated into the various market structures inherent within the rubber
production context, are not required to engage in new market conditions or interact with new
market actors, and are not exposed to potentially new market risks.
Further, intercropping as an agricultural technology is not new to Sri Lanka. Intercropping of
immature rubber with various crops was introduced as early as 1979 and around 40% of
smallholders were already engaged in intercropping (Herath & Takeya, 2003). Therefore farmer
experience with rubber as a commercial crop and with intercropping as an agricultural
technology was likely not new. The overall scale of production did not change based on the
adoption of intercropping as farmers producing on both small and large plots of land engaged in
the practice. Finally, apart from the new crop used in the intercropping scheme, farmers were
not required to purchase or utilize any additional, new inputs like fertilizers, herbicides or
pesticides.
Similar to Ward and Pede (2015), intercropping in rubber production represents an incremental,
short-jump agricultural technology. Both rubber as a commercial crop and intercropping as an
agricultural practice are familiar to Sri Lankan farmers. As such, farmers were able to rely on
their existing tacit knowledge, norms, and experience and were not required to incur additional
costs or encounter new, market-oriented risks in deciding whether or not to adopt the technology.

8
In the context of short-jump agricultural technologies, much of the research has focused on the
production of high-yielding, drought-resistant and disease-resistant staple or traditional crop
varieties and improved agronomic practices (soil fertility management, planting date, planting
rates, weed control, soil and water management, legume and cereal rotation) (Muzari et al.,
2012). Other examples of the short-jump agricultural technology adoption process, assessed
within the context of familiar crops, include evaluations of improved Bt cotton in India
(Maertens & Barrett, 2012), improved mangrove swamp rice varieties in Sierra Leone (Adesina
& Zinnah, 1993), fertilizer and hybrid seed adoption for maize production in Malawi (Chirwa,
2005); and improved cowpea varieties in Nigeria (Alene & Manyong, 2006).
Conversely, relatively little work has been done on non-incremental agricultural technologies
that represent significant changes to farmer production portfolios, practices, norms and
standards. This research uses soybean, a new and unfamiliar commercial crop for smallholder
producers, as an example of a non-incremental, long-jump agricultural technology.
Long-jump technology adoption
Commercial crops represent an important economic development opportunity in developing
country settings. Commercial crops can enable smallholder farmers to earn higher profits,
increase their family income and promote improved standards of living. Further, commercial
crops can increase the consumption of basic and high-valued foods and enable farmers to make
higher expenditures on education, healthcare, non-food consumption and durable goods. As
agricultural commercialization is assumed to enhance household income, farmers are capable of
purchasing a diversified mix of goods and services and/or increase their household consumption
portfolio (Osmani et al., 2015). Further, as identified by Osmani et al. (2015) “through the
income-food-consumption linkage, commercialization is assumed to increase the food intake of
household members, which could improve their nutrition and health status”.
Osmani et al. (2015) assessed the level or extent of commercialization among 100 smallholder
farming households in Bangladesh using a Household Commercialization Index (HCI). The HCI
measured the degree to which a household sells its agricultural output to market. For households
engaged in solely subsistence farming, the index was zero and grew larger as households
engaged in commercialization of their agricultural output. The researchers then measured
various welfare outcomes as a result of commercialization including expenditures on non-food

9
items, education, healthcare, housing and farm implements as well as consumption of basic food
items. Results showed an increasing pattern of welfare outcomes among smallholders as they
moved from low to high levels of commercialization. The model used by Osmani et al. (2015) is
useful for measuring the welfare outcomes of commercialization among smallholder farmers, but
does not capture the drivers that lead some farmers to adopt higher levels of commercialization
than others. Further, this research does not address how commercialization may or may not
change the existing agricultural and market engagement practices of farmers.
Further, not all commercial crops are long-jump agricultural technologies. While rubber is a
commercial crop, its production in Sri Lanka is not new and unfamiliar to smallholder farmers.
In this context Sri Lankan producers are not required to engage with new market actors, market
channels or adopt significantly new agricultural production practices. Other commercial crops
are indeed new and unfamiliar to smallholder farmers. In this case farmers must not only learn
the production practices of a new crop, but the commercial nature of the crop requires farmers to
engage in new market integration and interactions, can present significant gender and labor
considerations and may be risky for the farming household. It is in this context that new
commercial crops represent non-incremental, long-jump agricultural technologies.
Staal, Baltenweck, Waithaka, deWolff and Njoroge (2002) examined the adoption of specialized
fodder use, concentrate feed use and the keeping of improved dairy cattle among smallholder
dairy producers in Kenya. These agricultural technologies are non-incremental for a number of
reasons. First, the keeping of improved dairy cattle require farmers to engage in significantly
new management expertise and resources outside of their traditional norms, practices, tacit
knowledge and experiences. The large size of the improved dairy cattle require farmers to invest
significant time and resources in sourcing the appropriate quality and quantity of feed through
new commercial channels. Further, farmers must engage with new commercial actors to acquire
specialized reproductive services needed for the improved dairy cattle which are more
susceptible to local animal diseases (Staal et al., 2002).
The production demands of the improved breeds are different than traditional breeds, requiring
farmers to move beyond their traditional dairy raising practices and engage in new, unfamiliar
and risky production practices. Further, the improved breeds demand a new level of market
access for farmers to engage livestock service centers for artificial or natural insemination

10
services. For the bulk of farmers with limited means of transport and communication, the costs
of accessing these market services represents a significant new and variable cost to their
traditional production practices (Staal et al., 2002). Thus, in determining whether to keep an
improved breed, farmers must weigh the costs and benefits of engaging in a riskier, more
market-oriented and unfamiliar production practice.
If a farmer decides to shift to using specialized fodder in their dairy production, they are required
to divert land from food or cash crops for the fodder production. Specialized fodder as an
agricultural technology significantly changes the scale of production for a given farmer, and can
add significant costs to the dairy production practice itself, presenting a new scenario of credit
and risk constraints. Farmers may need to purchase, rent, lease, or borrow land for the fodder
cultivation or may need to divert existing land from other crops for the fodder cultivation.
Fodder cultivation is thus as an additional non-incremental agricultural technology in that it
requires significant changes to the farmer’s existing land use and production norms and
practices, and presents new credit and risk constraints.
In the context of concentrate feed, farmers are exposed to potential market and risk-related
shocks as the concentrate feed is a commercial product, requiring cash expenditures and
integration with market actors (Staal et al., 2002). Thus, even while the use of concentrate feed
as an agricultural technology has shown to raise average returns in dairy production, the risk-
adjusted returns may be lower when farmers’ levels of risk aversion are incorporated (Staal et al.,
2002). Therefore, the level of risk associated with the use of concentrate feeds, as well as the
necessity of market integration and cash expenditures in its procurement, may prevent adoption
among smallholder producers. The constraints associated with this technology are significant
and represent a long-jump agricultural technology.
A final point to consider in the Staal et al. (2002) analysis is that with the use of agricultural
technologies, farmers are thought to generate increased milk production. To ensure the
additional production has an adequate market, farmers must engage in new, formal commercial
milk markets to access more customers to purchase their products. In Kenya, 80% of marketed
milk is neither processed nor packaged, but is bought by the consumer in raw form via direct
sales, small traders or other retail outlets. Shifting from this informal raw milk distribution
system to a formal milk market distribution system represents an additional significant and new

11
change in farmer production practice, and can lead to similar market-oriented risks for the
farmer.
In sum, Staal et al.’s (2002) study evaluates the adoption process of three long-jump agricultural
technologies. Together, these technologies require farmers to change the scale of their existing
practice in a number of ways. First, farmers must engage new lands or shift existing lands to
fodder cultivation. Next, farmers must move beyond their traditional production norms and
standards to engage in unfamiliar and new production practices using improved breeds of cattle.
Further, farmers must engage in new markets to procure the commercial inputs and agricultural
services for concentrate feed and artificial insemination or bull services. Finally, farmers may
need to move from traditional marketing norms, practices, and experiences to access new, formal
commercial milk markets for their increased production.
To model the adoption decision of the three technologies described above, Staal et al. (2002)
employ an augmented logit regression model among 3,330 Kenyan dairy producers using both
explanatory household variables and geocoded variables. The geocoded variables include agro-
climatic measures and measures of farmer distance to urban areas, differentiated by road type.
While this model captures the farm characteristics that drive adoption of long-jump agricultural
technologies, the geocoded variables included in the analysis do not adequately evaluate how
spatial interaction and relationships among farmers drive adoption decisions. The authors note
that the geographic distance measurements used in their analysis potentially capture the
interaction between neighbors and can potentially control for neighbors’ influence on adoption.
However it is difficult to see how measures of farmer distance to urban areas is an adequate
control for the existence of spatial autocorrelation. This type of spatial autocorrelation can occur
when, for example, two farmers are located an equal distance from an urban area but are not
located near to each other.
Few other studies evaluate the adoption process for non-incremental agricultural technologies.
One example is work by Conley and Udry (2010) who investigate how farmers learn about new
agricultural technologies related to intensive pineapple production in Ghana for export to
European markets. In this context, farmers intensively engaged in the use of fertilizers and other
agricultural chemicals to ensure the volume and quality required by the European export market.
Farmers thus had to adopt new and commercial technologies like fertilizers and engage in a new
12
form of pineapple production that was commercial and intensive in nature, which exposed
farmers to new markets and market actors. In the case of this agricultural technology, producers
encountered significant, and non-incremental shifts in their production practices.
Conely and Udry (2010) employ a learning model that defines a farmer’s ‘information
neighborhood’ and examine how a farmer’s decision to adopt new and unfamiliar inputs for their
pineapple production is affected by their information neighborhood. Using data from 47
pineapple producers in southern Ghana they conclude that adoption decisions for unfamiliar
technologies like intensive fertilizer use are affected by social learning while decisions for more
familiar technologies are not affected by social learning. The findings of Conley & Udry (2010)
highlight the importance of farmer networks and spatial interactions in the adoption of long-jump
agricultural technologies. Their robust measure of information neighborhoods is developed
through individual questioning of farmers about conversations between individuals in their
network. My dataset does not contain this type of social interaction information, yet I recognize
the importance of social networks in my analysis and employ a spatial model to account for these
effects.
The goal of this research is to apply aspects of the long-jump agricultural technology adoption
research to a new commercial crop context: smallholder adoption of soybean. The dramatic
growth of feed demand stemming from the “livestock revolution” is fueling interest in soybean
as a potential development crop capable of providing smallholder farmers with new sources of
income and improved agricultural productivity (Masuda & Goldsmith, 2012). In addition to the
demand for soybean as a feed source for livestock and aquaculture, soybean demand is also
growing for its use as an oilseed crop, as a biodiesel feedstock, and as a high-quality protein for
use in human diets (Masuda & Goldsmith, 2009).
Yet soybean is a new agricultural technology for much of the developing world. In Africa, it is
not a traditional crop, hence farmer utilization of soybean is limited in many settings (Dogbe et
al., 2013). As an unfamiliar, non-staple, commercial crop, soybean exhibits the characterizations
of a long-jump agricultural technology. Soybean production does not rely on farmer
experiences, tacit knowledge, norms and traditional cultural practices. The embedded behaviors
and practices in smallholder producing communities will likely affect the adoption of soybean as
an agricultural technology (Muzari et al., 2012). Farmers may instead prefer to invest in

13
agricultural technologies that improve the productivity of their staple crops which can be easily
processed, utilized and consumed in the household and do not depend on favorable markets for
utility (Dogbe et al., 2013).
Further, as a commercial crop, soybean production requires farmers to purchase new and
unfamiliar inputs like inoculum, engage in new and precise agronomic practices (proper seed
spacing, row spacing and plant populations), and connect to markets and buyers for sourcing
inputs and aggregating and selling grain. The market or profit-oriented production system for
soybean differs from traditional practices where production is oriented towards subsistence
(Osmani et al., 2015).
Research by Dogbe et al. (2013) and Etwire et al. (2013) examine soybean production among
smallholder farmers in Ghana by evaluating the level of profitability and technical efficiency,
respectively, among farmers. These studies provide important contributions to the foundational
knowledge surrounding soybean production among smallholders and comprise half of the total
studies focused on the context of soybean adoption by smallholders. Wendland and Sills (2008)
examine the adoption of soybean among smallholders in Togo and Benin, but focus on soybean
as an example of a health technology promoted exclusively for its nutritional benefits. Mbanya
(2011) studied the technical and socio-economic constraints in soybean production among
smallholder farmers in Ghana, yet does not address adoption or performance in soybean
cultivation.
Table 2.1 provides a summary of the differentiation between the long-jump and short-jump
agricultural technology adoption literature.

14
Table 2.1
Characterization of long-jump vs. short-jump agricultural technology adoption literature
Technology Familiar,
staple, or
traditional,
crop
New
market
exposure
required
Farmer
experience
in the
technology
New
agronomic
practices
required
Increased
scale
required
New
inputs
required
Improved mangrove swamp rice adoption (Adesina & Zinnah,
1993)
Yes No Yes No No No
Commercial crop production by smallholders (Immink & Alarcon,
1993)
No Yes No Yes Yes Yes
Dairy technology adoption (Staal et al., 2002) No Yes No Yes Yes Yes
Intercropping in rubber production (Herath & Takeya, 2003) Yes No Yes No No No
Improved cowpea variety adoption (Alene & Manyong, 2006) Yes No Yes No No No
Social learning in pineapple production (Conley & Udry, 2010) No Yes No Yes Yes Yes
Bt cotton adoption (Maertens & Barrett, 2012) Yes No Yes No No No
Economics of soybean production (Dogbe et al, 2013) No Yes No Yes Yes Yes
Technical efficiency in soybean production (Etwire et al., 2013) No Yes No Yes Yes Yes
Crossbred cow adoption (Edirisinghe & Holloway, 2015) Yes Yes No Yes Yes Yes
Social network effects in hybrid rice adoption (Ward & Pede, 2015) Yes No Yes No No No
Demand for drought-tolerant rice (Ward et al., 2014) Yes No Yes No No No
Transportation costs in yam, rice, cassava & maize production
(Damania et al., 2016)
Yes No Yes No No No
Oil palm adoption (Euler et al., 2017) Yes No Yes No No No

15
Drivers of adoption
Previous literature has broadly characterized the drivers of the agricultural technology adoption
process by resource endowments (land, labor, and equipment), market access (credit and input
and output markets), risk and uncertainty (idiosyncratic and covariate shocks), environmental
factors (slope, soil type, and location) and human capital (education, experience, extension)
(Ainembabazi & Mugisha, 2014). This research focuses on the following set of drivers to
understand the adoption process for soybean. These drivers relate to farmer characteristics
(education, household head, and experience/extension access); economies of scale (total farm
size, land allocated to soybean cultivation); market access (intention to sell grain, engagement in
dry-season activities); land rights (land tenure, duration of land control) and spatial interaction
among farmers.
This research evaluates how these various drivers affect two different aspects of the smallholder
soybean adoption process. First, I address how these drivers affect farmer performance in
soybean production, as measured through yield. Second, I address how these drivers affect
farmer sustained, or persistent, adoption of soybean, as measured through the number of
consecutive years producing soybean. Below, I provide a description of each of these adoption
drivers and how I expect these drivers to affect both farmer performance in soybean and
sustained, or persistent adoption, of soybean.
Farmer characteristics and technology adoption
Some research links the number of years of formal education to an increased ability to manage
agricultural technologies and to use information regarding the technology provided by extension
and through farmer networks (Staal et al., 2002). Indeed, most of the previous literature finds a
significant and positive relationship between education and technology adoption (Ainembabazi
& Mugisha, 2014). Herath and Takeya (2003) highlight the effect of human capital on
investments in adoption behavior, noting positive impacts of rural literacy (education) on the
adoption of high-yielding varieties of rice and wheat in India and in the adoption of modern
varieties of maize in Ghana (Herath & Takeya, 2003).
Feder et al. (1985) note that formal educations plays much more important role in determining
allocative ability than worker ability. They conclude that farmers with more education are
16
earlier adopters of agricultural technologies and utilize these technologies more efficiently
throughout the adoption process. I therefore expect that farmers who have more years of formal
education will experience higher performance in their soybean yields and will be associated with
sustained adoption of soybean.
Within the context of farmer characteristics, farmers who are heads of their household may differ
in their adoption preferences and performance in soybean production than those who are not.
Further, important considerations need to be given to the gender of the household head. In Sub-
Saharan Africa, it is common for women to provide more labor for agriculture and more total
labor than men. Thus even if an agricultural technology is productivity-enhancing, women may
not be able to devote more hours in their day to utilizing the technology. Female-headed
households tend to be smaller, have lower incomes and as a result may be less productive than
male-headed households. These important characteristics may incline female-headed households
to be less likely to adopt improved agricultural technologies because they face constraints not
faced by farmers in male-headed households (Doss, 2006). As my focus is on female
smallholders, I therefore expect that the female farmers who are heads of household will
experience lower performance in their soybean yields and will not be associated with sustained
adoption of soybean.
An additional focus of agricultural technology adoption relates to farmer access to extension
information. Interactions and learning via extension officers and through extension information
channels facilitates increased productivity growth by fostering the spread of improved
technologies within social networks (Ward et al., 2014). Ainembabazi and Mugisha (2014) find
that extension service delivery significantly enhanced the adoption rate of agricultural
technologies in certain farmer enterprises in Uganda. Not addressed in my research is the impact
of long-jump technologies on the effectiveness of extension services. New technologies like
soybean are not only new to farmers, but also to the research and extension community as well.
Thus extension services potentially could provide negative feedback in terms of sustained
adoption and performance in soybean production as farmers may receive poor or improper
information and guidance.
In the case of soybean in Ghana, farmer knowledge about the production and utilization of the
crop is low and extension workers with knowledge on soybean production is limited (Dogbe et

17
al., 2013). Etwire, Martey and Dogbe (2013) find that farmers mentored via agricultural value-
chain enhancement projects with soybean as a focus crop are more technically efficient
compared to farmers not participating in the project. However, there are limitations in
identifying the effect of extension services on farmer adoption of agricultural technologies and
performance in utilizing them. Extension effectiveness can be affected by, among other
constraints, literacy, different and mixed exposure sources, messages and information diffusion
channels and platforms.
Nevertheless, I expect farmers with improved access to agricultural extension information to
experience higher performance in their soybean yields and be more likely to sustain the adoption
of soybean. Under conditions very similar to my dataset of female smallholder soybean
producers in Ghana, Ragsdale and Read-Wahidi (2015) find that women often struggle when
they have to engage extension for guidance in new technologies due to traditional gender norms
and relationships. Specifically, they find that 41% of female producers in their sample reported
that they were not at all comfortable or had a great deal of difficulty speaking up in public to ask
agricultural extension agents questions about agricultural practices, policies or decisions that
affected themselves, compared to 14% of male respondents. As the majority of Ministry of
Agriculture extension agents are male, this finding may represent a potentially important limiting
factor in sustained soybean adoption and performance among Ghanaian smallholder female
producers (Ragsdale & Read-Wahidi, 2015).
Finally, as a new commercial crop in a developing country setting, farmer effectiveness with
soybean is thought to be improved as a result of learning by doing. That is, a farmer’s
effectiveness with an agricultural technology changes over time and a farmer may become more
proficient with the technology as he or she accumulates more information by using it (Feder et
al., 1985). As a farmer’s experience in soybean production is confounded by their adoption
decision (farmers who engage in sustained adoptions inherently have more years of production
experience), my research addresses the effect of farmer experience on farmer performance only.
Farmers with more experience are likely to be more proficient in soybean production as they
have had more time to obtain information on improved production practices and to become
integrated with new market actors and market channels. I therefore expect that farmers who

18
have more experience in soybean production will experience higher performance in their
soybean yields.
Economies of scale and technology adoption
The effect of total farm size and relative land allocation for new agricultural technologies have
been identified in previous literature as important drivers of soybean adoption and performance.
Total farm size captures the land a farmer uses to produce his or her crop portfolio. Land
allocation captures the land a farmer uses to produce a given crop; soybean in this case. I use
both variables in this analysis as soybean production in Ghana comprises only a portion of a
farmer’s total farm size. Ghanaian smallholder farmers produce maize, rice, cassava, yams and
vegetables for consumption, and also produce cotton and cowpea as cash crops (Dogbe et al.,
2013). Thus total farm size in my analysis is the land a farmer uses to produce all of his or her
crops while land allocated to soybean production is only the amount of land a farmer uses to
produce soybean.
In soybean production, farmers incur fixed costs in adoption, as well as labor requirements,
credit constraints and risk associated with the commercial nature of the crop. Previous work
shows that larger fixed costs associated with agricultural technologies reduce the likelihood and
pace of adoption by smaller farms. Therefore it may be more difficult for smaller farms to
efficiently utilize and adopt long-jump agricultural technologies because of the inherent fixed
costs in adoption (Feder et al., 1985). Herath & Takeya (2003) also highlight the positive impact
of farm size on the adoption of improved wheat and maize varieties. Interestingly, Immink and
Alarcon (1993) find that diversified farmers engaged in commercial crop production tend to have
larger farm sizes than farmers producing only maize. This reflects a situation when farm size
and allocation to one crop diverge. Further, Ainembabazi & Mugisha (2014) observed dis-
adoption rates in the range of 21-32% among smallholder Ugandan farmers producing a variety
of crops who had limited access to adequate farm size. They note that this constraint was
primarily associated with the wide plant spacing practice encouraged in producing these various
crops.
In the context of soybean production in Ghana, Etwire et al. (2013) find that increasing farm
size, up to a certain threshold, results in an increase in soybean yields in two districts of northern
Ghana (though does not result in increasing returns to scale). Chirwa (2005) reports a positive

19
relationship between farm size and maize production in Malawi. Idiong (2007) and Al-Hassan
(2008) note the positive effects of farm size on rice production in Nigeria and Ghana,
respectively. I therefore expect that producers with larger farm sizes will experience higher
performance in their soybean yields and will be associated with sustained adoption of soybean.
When examining the effect of land allocation for new agricultural technologies on performance
with the technology, I see mixed evidence. Feder et al. (1985) show that when utility is defined
as income generated in excess of subsistence levels, land allocation devoted to a new agricultural
technology increases in line with farm size. However the authors do not address the effect of
land allocation on performance (yield). Among soybean producers in Ghana, Etwire et al.
(2013) find a positive correlation between land kept under soybean cultivation and yield, but not
one that results in increasing returns to scale. Specifically, they find that a 1 percent increase in
land kept under soybean cultivation results in an increase in production of 0.85 percent, ceteris
paribus. When adding the cost of hired labor, family labor, inputs like herbicides and
insecticides, and seed to the analysis, they estimate a return to scale of 0.75, indicating that
soybean farmers in their sample are operating inefficiently.
As Mbanya (2011) and Dogbe et al. (2013) report, very few smallholder soybean farmers in
Ghana report using inputs like rhizobium inoculants, fertilizers, herbicides and pesticides in their
soybean production practices. The findings of Etwire et al. (2013) are in line with these
observations, and indicate a low-input production scenario for Ghanaian soybean farmers. Thus,
while the amount of land dedicated to soybean cultivation is positively correlated with yield, the
low-input production system in Ghana results in decreasing returns to scale and overall,
inefficient production systems.
Other research shows increasing returns to scale by smallholder farmers producing swamp rice in
Nigeria. Idiong (2007) finds that the effect of land under swamp rice cultivation had a
significant and positive effect on rice yields. Further, when adding to the analysis the effects of
fertilizer use, seed, capital and labor, Idiong (2007) found that farmers were operating in the
increasing returns to scale region. Among the various effects analyzed in the production system,
labor was the largest contributor to increasing returns to scale. As swamp rice production is a
tedious operation it requires large contributions of labor. Thus, in this context labor was a highly
productive component of the overall production system for farmers and contributed to the

20
positive effect of land allocation. This was not the case in Etwire et al.’s (2013) study of
soybean farmers in Ghana.
Overall I see that the effect of land allocated to a new agricultural technology can have a positive
or negative effect on productivity. The effect of land allocation on sustained adoption and
farmer performance in soybean production will be linked, through the direction of this effect,
whether positive or negative, is unclear.
Among Ghanaian smallholder producers, soybean production is labor intensive and is largely
undertaken with minimum use of machinery. Farmers require labor for land clearing and
preparation, planting, weeding, harvesting, threshing, pest and disease control and carting of
produce. A number of different sources, and combinations of these sources, are used to address
these needs and include personal, family, hired and communal labor. Some farmers engage hired
labor for plowing, harrowing, and for leveling their fields after tractor harrowing (Dogbe et al.,
2013).
Etwire et al. (2013) find that the marginal product of hired labor is negative in the context of
soybean production in Ghana, implying that an increase in hired labor will have a negative effect
on soybean production. Their explanation focuses on the fact that hired laborers, without an
attachment to the land they are servicing, are less likely to provide adequate services as
compared to family labor. Further, hired labor may change with each contracted service and
with the timing of each service’s delivery. The resulting lack of long-term relationships, or
contracts, between farm owners and hired labor may thus lead to agency problems and poor
performance. They also note that knowledge build-up does not occur in the context of hired
labor, leading to potentially lower production results (Etwire et al., 2013). However this result
may need to be considered with the assumption that the amount of household labor is not being
held constant.
The linkage between gender and labor, particularly hired labor, is also an important component
to address. Dogbe et al. (2013) find that specifically in Ghana, females incurred a higher cost for
hired labor related to all aspects of the soybean production practice (land preparation, planting,
weeding, harvesting, threshing) than males. This led to an increased overall cost of production
for females as compared to males. Ainembabazi & Mugisha (2014) find that farmers may
abandon an agricultural technology if the technology is labor demanding. Specifically they find

21
that dis-adoption rates were common among Ugandan farmers producing certain crops that
required labor-demanding activities.
Doss (2001) notes that when male and female labor are not substitutes, as is the case in Ghana
where men and women farm separate and individual plots of land, households face seasonal
labor constraints and labor bottlenecks in the planting and harvesting seasons that may be
exacerbated by the gender division of labor. Yet she also notes that when local labor markets
exist, farmers can hire labor as needed. Further, as women’s responsibilities increase with, for
example, the adoption of a new technology, their control over labor and output may also
increase. When a female producer decides to engage hired labor in her soybean production
practice, her labor burden is reduced and simultaneously, her independence and control may be
increased. Thus soybean adoption may cause a reallocation of labor and change the balance
between household labor and hired labor (Doss, 2001).
The literature however is unclear regarding under what circumstances farmers prefer to hire
labor versus using cooperative or shared labor (Doss, 2001). Women-led households may have
less access to family labor because they include fewer men, resulting in an increase in hired
labor. Finally, Doss (2001) notes that agricultural technologies that reduce labor burdens for
female producers while increasing their control over labor will have the biggest impact on farmer
well-being. In sum, it is therefore difficult to assess the impact hired labor will have on
sustained adoption and performance in soybean production.
Market access and technology adoption
Smallholder farmers commonly cultivate plots of land less than 2 hectares (ha). Further, they are
typically spatially dispersed and may be located significant distances from agricultural markets,
extension and research services, support services and financial institutions. Farmers in rural
areas are also faced with constraints to selling and aggregating their grain, where a lack of
competition among buyers can result in less competitive prices for their output, exacerbating the
adverse effects of their distance to markets (Villano, Fleming & Moss, 2016). Indeed, multiple
factors affect the price a farmer pays for their inputs and services, and the corresponding
availability and quality of these inputs and services. These factors also affect the price farmers
receive for their grain output.

22
With respect to soybean, a farmer’s market access affects both the supply and demand-sides of
their production. Market access affects a farmer’s ability to procure high-quality and necessary
inputs like fertilizer, inoculum, and certified seed. Markets also provide farmers with labor for
land preparation, planting, weeding and harvesting. The price of these inputs and services can be
significantly affected by a farmer’s market access.
Measures of farmer access to both output and input markets has been evaluated in the technology
adoption literature by measuring farmer distance to markets using travel-distance estimation
methods via road networks (Staal et al., 2002; Damania et al., 2016; Villano et al., 2016). These
measures assume that a farmer’s market access depends on their ability to access critical
infrastructure such as roads and population centers. Yet these market access measures might not
be appropriate or applicable when evaluating the case of a non-perishable, storable and
transportable crop like soybean.
In the context of soybean, farmers are able to store their grain for long durations and then sell the
crop well after harvest, when prices are elevated. Indeed, price data from 2011-2015 show that
demand for soybean is relatively strong even in regions of Ghana located far from large urban
areas and markets (Goldsmith, 2017). Yet previous literature as in the case of Staal et al.’s
(2002) research on dairy production in Kenya uses measures of travel-time and distance to large
cities, urban areas, and formal aggregation and sales centers as primary indicators of market
access. The strong demand for soybean in regions of Ghana located far from traditional markets
may indicate that these more common measures of market access may be of less importance in
the soybean context. This could also indicate that farmer access to less urban and less formal
markets may be a more appropriate predictor of adoption and performance in the soybean
context.
While a farmer’s physical distance to traditional, urban and formal markets may be less relevant
in the context of soybean production, their ability to access new market actors, channels and
suppliers remains of critical importance. Within this market access framework, network
externalities can affect the adoption of new agricultural technologies like soybean. As more
producers within a network shift to commercial soybean production they experience a network
externality as the group begins to build a marketing infrastructure to support the new crop
(Besley & Case, 1993). This marketing infrastructure can take the form of grain aggregation,

23
group financing for volume discounts on inputs and services, central or shared storage facilities
or physical farm clusters to attract hired labor. In this case, the price a farmer receives for their
grain output, as well as their production margins, may be affected by these network externalities.
Dogbe et al. (2013) note that in the case of soybean production in Ghana, the majority of
soybeans produced in the two districts where the study was conducted were sold to institutional
buyers. These institutional buyers support farmers during production with the understanding that
they will buy grain back from the farmer at a pre-determined price at harvest. While this type of
arrangement can generate adequate prices for farmers, those without this type of market access
must sell their grain through intermediaries like aggregators, assemblers or traders.
Intermediaries determine the timeliness of their payment to farmers and their marketing margin,
which can be affected by the costs a trader incurs in securing a seller. Further, farmers must
engage in verbal agreements with traders that do not have any binding power or written
contractual arrangement, presenting risk to the farmer if a trader backs out on an agreement or
claims that grain was of inferior quality. In this scenario, farmers are likely to receive less secure
and lower prices for their grain because of the marketing costs and margin incurred by the
intermediary as well as the uncertainty in the purchasing agreement (Dogbe et al., 2013). Farmer
inability to access markets, coupled with low prices received, price instability and the selling of
produce on credit were ranked as primary constraints in a study of soybean production in Ghana
by Dogbe et al. (2013).
In this context, farmers who express an intention to sell their grain after harvest may exhibit
increased market access than farmers who do not intend to sell their grain. For those who do not
intend to sell their grain, the reasons could be numerous. A lack of intention to sell may be a
result of low yield expectations; a desire to process, utilize, and consume the agricultural product
in the household; or a lack of awareness, access to markets that will provide a fair price for their
product.
Farmers intending to sell their grain may have existing contracting schemes with institutional
buyers such as processors who offer a better, pre-determined, and/or secure price for grain
output. They may also have existing relationships and interaction within the market that enable
them to access buyers, as well as the needed inputs and services for improved production.
Farmers who intend to sell their grain may thus experience lower costs in accessing markets and

24
as a result may experience more profitable production systems than farmers who do not intend to
sell their grain. I therefore expect that soybean farmers who intend to sell their grain after
harvest will experience higher performance in their soybean yields and will be associated with
sustained adoption of soybean.
An additional measure of market access among smallholder farmers is their involvement in dry-
season and off-farm activities that generate additional sources income for the household outside
of traditional production activities. In this context farmers must access different types of markets
including markets for buyers of their products, markets where they can sell their own labor, and
credit and input markets. Many dry-season, income-generating activities depend on access to
these types of markets for selling products and determining appropriate prices for farmers’ goods
and services. Herath and Takeya (2003) note that farmers who engage in off-farm activities have
increased ability to access outside, market-driven information that may have positive effects on
adoption.
Examples of dry-season activities in Ghana include drinking establishment operation, shea butter
processing, charcoal and fire wood sales as well as to a lesser extent groundnut oil extraction,
petty trading, dress making and grain banking (Muhammed & Baker, 2015). Income generated
from dry-season activities can help support the financing of a new agricultural technology. In
the case of soybean, the new income generated can help offset the costs of input and service
procurement needed for production. Muzari et al. (2012) report that higher levels of income
generated from dry-season and off-farm activities lead to higher rates of adoption of yield-raising
agricultural technologies.
Farmers engaged in dry-season activities that are more commercial in nature (as is the case with
examples presented above) may be better connected and have more access to output markets and
financing via self-financing opportunities. On the other hand, farmers engaged in dry-season
activities may be more diversified, and thus less focused in soybean production and adoption,
causing them to be less likely to be a sustained adopter of soybean and experience higher
performance in their soybean yields. As a result, the expected effect of engagement in dry-
season activities on soybean adoption and performance is unclear.
Land rights and technology adoption

25
The nature of land rights in the technology adoption process is defined by two separate but
complementary aspects. Land tenure relates to the relationship between tenant (operator) and
landlord (owner), not the relationship between tenant (operator) and the land. In land tenure
scenarios where farmers own their land, the farmer is both the tenant/operator and the
landlord/owner. This is in contrast to farmers who borrow, lease or share their land where they
are still the tenant/operator, but the landlord/owner is a different individual.
Duration of land control is an attribute of all land tenure scenarios and is defined by the relative
land rights specifications for these differing scenarios. Farmers operating under different land
tenure scenarios (i.e. own, borrow, share, or lease land) all do so with distinct land rights
specifications, some of which contain provisions on the duration of control over the land.
Farmers may own their land indefinitely, for a set period of time, or for a duration that is unclear
to them.
In Ghana, acquiring land for production occurs between January and April, during the dry-
season. Land is either acquired through cash payments, through exchange of inputs or through
in-kind payment with produce following harvest. Permission is usually granted on an annual
basis through oral consent in the presence of at least one witness (Dogbe et al., 2013). In the
context of soybean, land rights can play a significant role in the adoption process and
performance with the crop. Soybean requires soil amendments including fertilizer and inoculum.
While amendments are costly to the farmer, they result in improved nutrient content and overall
health of soils for future planting seasons and for the cultivation of other crops.
Farmers who borrow, lease or rent their land, may not value the long-term benefits of soil
correction necessary for improved soybean production (Herath & Takeya, 2003). Similarly, they
may not see the income-generating potential of soybean cultivation as outweighing the
immediate costs of these inputs. Farmers who own their land either individually or through their
family experience longer planning horizons, potentially allowing them to see the benefits of soil
correction for improved soybean cultivation.
Similarly, the rate of time preference may be shorter for farmers who own their land as they may
exhibit improved familiarity with the land in terms of its inherent soil characteristics,
topography, slope, etc. Land owners may also experience reduced uncertainty in land
performance, leading to a shorter rate of time preference for adoption (Herath & Takeya, 2003).

26
I therefore expect that soybean farmers who own their land will experience higher performance
in their soybean yields and will be associated with sustained adoption of soybean.
A farmer’s analysis of their cost-benefit for investment in a new agricultural technology is also
affected by their duration of land control. In making investment decisions, farmers consider their
future benefits, which are diminished if their duration of land control will not allow them to reap
the benefits resulting from their investment (Doss, 2001). Thus farmers with less secure, or
shorter term land rights, are less likely to adopt new technologies. Dogbe et al. (2013) cite lack
of land rights as the most important constraint to soybean production among smallholder farmers
in Northern Ghana. Land disputes and conflicts were also common in Dogbe et al.’s (2013)
study area. This resulted in farmers being hesitant to make long-term investments to improve
soil fertility and increase their area of soybean cultivation.
Conversely, farmers with uncertain or relatively short term land rights may still experience the
economic benefits of an income-generating crop like soybean even in the short-run. Noting this,
adoption and performance may not differ between farmers with differing durations of land
control (Herath & Takeya, 2003). It is therefore difficult to predict how the duration of land
control will affect farmer adoption of, and performance in, soybean cultivation. As a result, the
expected effect of the duration of land control is unclear.
Spatial interaction and technology adoption
The spatial interaction and integration among farmers can be exemplified by the existence and
extent of social networks and the presence of social learning. Including measures of spatial
interaction in the analysis of technology adoption provides insight into the potential roles that
social connections may play in farmer decision-making and performance (Maertens & Barrett,
2012). Further, understanding spatial interaction among producer networks allows research to
move beyond just the characteristics of farmers, plots and technologies to understand an
additional critical aspect of the adoption process (Doss, 2006).
By focusing on the spatial dimensions of agricultural technology adoption, I recognize that
knowledge about new technologies spills over within members of spatial networks. This often
occurs as farmers face similar production, demographic and market access conditions; interact
directly with each other; and observe the costs and benefits of new technologies directly rather

27
than relying on information from extension agents, development agencies or other actors (Ward
& Pede, 2015). Further, network economies and social networks can affect farmer awareness,
interest and understanding in an agricultural technology (Staal et al., 2002).
Ward and Pede (2015) identify three hypotheses to explain the effect of spatial interaction on
individual behavior: endogenous effects, contextual effects and correlated effects. Endogenous
effects relate to the idea that one individual’s actions can affect group actions, while at the same
time being affected by group behavior. Contextual effects relate to the idea that one individual’s
actions are affected by the exogenous characteristics of his or her group/social network.
Correlated effects relate to the idea that individuals within a group/social network behave
similarly because they tend to have similar characteristics or similar conditions related to their
political affiliations, institutions (e.g. agricultural policies) or environment (e.g. soil
characteristics, climate). While endogenous effects have policy implications because of the
associated social multiplier effect (policies that affect individual behavior may affect group
behavior, and vice-versa), contextual and correlated effects are not thought to have the same
multiplier effects, since they lack feedback loops (Ward & Pede, 2015).
Spatial networks are particularly important in the context of long-jump agricultural technologies
like soybean because of the technical learning curve associated with a new crop. Farmers are
unable to rely on their tacit knowledge, norms, and traditional production practices to enable
sustained adoption of a non-incremental technology, and to achieve high performance in
production. Instead, farmers must shift to new production practices, procure new and unfamiliar
inputs like inoculum, and engage in new market interactions. Social networks enable farmers to
directly share knowledge of new production practices amongst themselves, reinforce key
messages, translate new and unfamiliar messages and provide feedback to information suppliers.
Thus, understanding the role of spatial networks is critical to evaluating farmer adoption and
performance in agricultural technologies representing significant changes to existing farmer
production practices.
A growing number of studies find positive social interaction effects on technology adoption,
indicating that the agricultural decisions of neighboring farmers are not independent of each
other (Wollni & Andersson 2014). The spatial externality of neighborhood effects influence the
propensity for neighbors to make the same agricultural adoption decisions and the magnitude of

28
the neighborhood to make these decisions (Villano et al., 2016). Previous literature shows that
neighborhood effects yield positive spatial externalities with respect to the demonstration effect
and information and knowledge flow between neighboring smallholders. Social interaction,
networks and knowledge transmission channels can affect farmer awareness, interest and
understanding in the agricultural technology.
In this context, neighboring farmers can help reduce the uncertainty of a new agricultural
technology, thereby lowering the fixed costs of learning about the technology (Villano et al.,
2016). Social interaction can also play a role in farmers’ ability to access common property to
enable technology adoption. In the work of Staal et al. (2002), Kenyan farmers decide whether
to adopt significantly new and more resource-demanding dairy production technologies. The
authors note that in this context a farmer’s adoption decision may be a function of spillover
effects arising from neighborhood effects including common sources of information diffusion
and that neighbor interactions may influence the adoption decision of a given farmer. Further,
social institutions, organizational structures and policies that change across ethnic community,
and/or administrative boundaries can affect farmer preference and attitude towards agricultural
technologies (Staal et al., 2002).
Smallholder farms are not uniformly distributed in rural areas, so some farmers may experience
high levels of interaction while others may not (Villano et al., 2016). Spatial interaction among
farmers enables producers to share technical information, guidance, and knowledge, aggregate
grain, be at a better scale to receive formal technical support services, and reduce the cost of
inputs through reduction in fixed costs and volume discounts. Social interaction can also
potentially reduce the capital risk and technical learning curve associated with new agricultural
technologies.
Understanding how spatial interaction affects the adoption of new agricultural technologies can
improve extension strategies. If spatial interaction is a strong determinant in the adoption and
performance of agricultural technologies, extension programs may focus on specific areas,
communities or even individuals where technologies can be introduced to generate the widest
impact (Ward and Pede, 2015). I expect that spatial interaction among farmers will have a
positive effect on farmer performance in soybean production. Further, I expect that by including
a measurement of spatial interaction in my model I will be able to provide more insight, a better

29
understanding and an improved fit to explain the technology adoption process of a non-
incremental commercial agricultural technology like soybean.
Finally, the use of spatial autoregressive models can provide more in-depth insight into the
effects of spatial interactions than more conventional methods that incorporate spatial variables
such as farmer distance to markets or urban areas into traditional regression models. Spatial
autoregressive models effectively identify the causal influences arising from spatial interactions
between producers in a given network. Thus my analysis employs a spatial autoregressive model
with spatial autoregressive disturbances (SARAR) similar to Drukker et al. (2013) and Ward and
Pede (2015). The SARAR model combines two elements of spatial dependence. The first
element is a spatially lagged dependent variable that assesses the existence and strength of direct
spatial interaction, or spatial dependence, within my sample. The second element is a spatial
error (referred to as nuisance dependence) that corrects for the potential biasing influence of
spatial autocorrelation (Anselin, 2001).
A listing of the independent variables included in my analysis, as well as the expected sign and
associated rationale are provided in Table 2.2.

30
Table 2.2
Description of independent variables included in technology adoption and performance models, expected sign and rationale
Variables H0 sign Rationale
Education + Farmers with more education are likely to have an increased ability to manage new
agricultural technologies like soybean and may be more capable of applying information
provided through extension services and through farmer networks. I expect that farmers
with more years of formal education will be more likely to be sustained adopters and will
experience higher performance in soybean production.
Household head - Female-headed households tend to be smaller, have lower incomes and as a result may be
less productive than male-headed households. I therefore expect that the female farmers
who are heads of household will experience lower performance in their soybean yields and
will not be associated with sustained adoption of soybean.
Sustained adoption + Sustained adopters, by definition, have produced soybean for three consecutive years.
Experience with new agricultural technologies changes over time. Farmers may become
more proficient with the technology as they accumulate more information by using it. I
expect that farmers who are sustained adopters will experience higher performance in
soybean production.
Lead farmer + Lead farmers are likely to have more access to extension information and engage in more
interactions and learning via extension officers and through extension information
channels. I expect that lead farmers will be more likely to be sustained adopters and will
experience higher performance in soybean production.
Farm size + Producers with larger farm sizes may experience economies of scale related to the
production of a long-jump agricultural technology like soybean. They may be able to more
effectively handle the up-front fixed and variable costs associated with soybean production.
I expect that producers with larger farm sizes will be more likely to be sustained adopters
and will experience higher performance in soybean production.
Land allocation + Similar to farm size, producers who allocate more hectares to soybean production may
experience economies of scale that impact their adoption of, and performance in, soybean
production. I expect that producers who allocate more land to soy production will be more
likely to be sustained adopters and will experience higher performance in soybean
production.

31
Table 2.2 (continued)
Description of independent variables included in technology adoption and performance models, expected sign and rationale
Variables H0 sign Rationale
Land tenure +/- Farmers who borrow, lease or rent their land may not value the long-term benefits of soil
correction needed for successful soybean production. Farmers who own their land either
individually or through their family have a longer planning horizon, allowing them to see
the benefits of soil correction for improved soybean cultivation. On the other hand,
farmers who rent or borrow land may experience the economic benefits of soybean even in
the short-run. As such, the expected sign of the variable for land ownership is
undetermined.
Duration of land control (can farm land 3+
years)
+/- Farmers with certain, and relatively long, land tenures are likely to have longer planning
horizons and shortened rates of time preference for adoption than farmers with uncertain
and relatively short land tenures. On the other hand, farmers with uncertain or relatively
short land tenures may experience the economic benefits of soybean even in the short-run.
As such, the expected sign of the variable for land ownership is undetermined.
Hired labor +/- Hired laborers may not have an attachment to the land they are servicing, and may be less
likely to provide adequate services as compared to family labor. Further, hired laborers
change based on the service required and the time of service delivery, leading to different
levels of service provided. Farmers may abandon an adoption of an agricultural
technology if the technology is labor demanding. Conversely, when a female producer
decides to engage hired labor in her soybean production practice, her labor burden is
reduced and simultaneously, her independence and control may be increased. As such, the
expected sign of the variable for hired labor is undetermined.
Intention to sell grain + Farmers who intend to sell their grain after harvest may be better positioned to access input
and service markets as well as buyers, aggregators and processors. I expect that farmers
who intend to sell their grain will be more likely to be sustained adopters and will
experience higher performance in soybean production.
Dry-season activities +/- Farmers who engage in dry-season activities have been observed to be less risk-averse than
farmers without sources of dry-season income. However these same farmers may be more
diversified and thus less focused in soybean production. As such, the expected sign of the
variable for engagement in dry-season activities is undetermined.
32
Intermittent adoption
Much of the previous agricultural technology adoption literature analyzes adoption through
static, binary choice models assessed at one point in time. In reality, adoption is a dynamic and
continually changing process, influenced by information gathering, learning by doing, or
accumulating resources (Feder et al., 1985; Edirisinghe & Holloway, 2015). Farmers do not
decide whether to permanently adopt an agricultural technology but instead make a series of
decisions that affect adoption and performance of the agricultural technology over time. These
include whether or not to try the agricultural technology, how much land to allocate to the
technology, whether or not to continue adopting the technology, and whether to adopt a different
technology (Doss, 2006). These decisions are affected by decisions made in previous periods,
highlighting the need to understand farmer adoption decisions over time.
Adoption can be followed by dis-adoption. Some cases of farmer dis-adoption are a result of
reductions in gains due to a negatively sloped demand as prices decline and supply expands with
increased adoption. In this scenario, more skilled producers, who have a higher opportunity cost
in deciding to adopt an agricultural technology, may switch to an alternative activity, since the
opportunity cost for their resources is high (Feder et al., 1985). This is not the case with
soybean, as demand continues to increase domestically and the crop itself is relatively new in its
introduction as an income-generating commercial agricultural technology. The phenomenon of
dis-adoption in the context of soybean is likely related to a variety of factors highlighted within
the various drivers defined in this literature review section.
Dis-adoption can be defined using different methods. Ainembabazi and Mugisha (2014)
measured farmer experience in technology adoption and the rate of adoption among smallholder
Ugandan producers. The rate of adoption was measured by assessing the number of technology
components adopted within a production package for a given agricultural enterprise (i.e. rice,
pineapples, maize, etc.). Next, farmer experience in technology adoption was measured by
averaging the number of years a farmer adopted each technology component. In this context,
farmers who began using a technology, and then abandoned it, were classified as dis-adopters,
indicating that their definition of dis-adoption is synonymous with abandonment.
While the definition of dis-adoption offered by Ainembabazi and Mugisha (2014) captures the
dynamic adoption decisions of farmers that can change over a given time period, it does not

33
account for the potential reversal of adoption decisions by farmers. In my analysis I know
whether a producer cultivated soybean over a three-year period, from 2013 to 2015, but I do not
have information on their soybean production practices prior to this three-year period, which
could affect both their probability of adoption and production performance. In my sample, all
farmers produced soybean in 2015. I thus define intermittent adoption as farmers who produced
soybean in 2013, stopped producing in 2014, and resumed production in 2015. My analysis thus
moves beyond a linear definition of adoption to account for farmers who reverse their adoption
decision, going from adoption, to dis-adoption and finally back to re-adoption.
I provide in my analysis a series of potential explanations for why a farmer may have decided to
engage in intermittent soybean adoption. First, for producers shifting to soybean cultivation,
they will experience a number of new variable costs. Variable costs can include input costs for
seed, fertilizer and inoculum; transaction costs in securing a buyer; and labor demands for land
preparation, harvesting and weeding. When producers are unwilling to pay these variable costs
they may underinvest in their soybean production system, potentially leading to intermittent
adoption as they experience poor performance and disinterest in producing the crop.
An important variable cost in this analysis is the use of fertilizers to elevate the nutrient content
tropical soils. Fertilizers are a costly input for a farmer, but significantly improve soil nutrient
content and overall soil health, and contribute to improved cultivation of crops other than
soybean. However, for farmers who do not own their land, or for those with uncertain or
relatively short land duration control, the long-term benefits of soil correction may not outweigh
the immediate cost of the fertilizer. The benefit of improved soils may spill over into additional
years beyond their duration of land control, or may benefit land that they do not own. In this
scenario, farmers may not invest or may underinvest in the required inputs, leading to reduced
performance and potential lack of continued interest in soybean cultivation.
Further, isolation from other farmers where social interaction, social networks and social
learning can benefit adoption and performance may lead to intermittent adoption. Farmers
without economies of scale may not see the crop as profitable when aspects of farm size, land
allocation for soybean, and labor requirements are included in a farmer’s decision making
process. Reduced market access may limit farmer ability to purchase needed inputs and services
at a cost they can afford, at the time needed and in sufficient quantity and quality.

34
Intermittent adoption can be a result of poor performance in soybean cultivation. Poor
performance can be a result of a number of different factors including non-investment or
underinvestment in necessary inputs; a lack of adequate or high-quality labor; a lack of market
access; or the inability to purchase or access high-quality, certified seed. Intermittent adoption
can also be a result of low profitability due to the high fixed and variable costs described above.
Thus a farmer may experience high performance, but low profitability. Due to the limits of my
data, I are unable to test profitability in my analysis, so the relationship between profitability and
performance among farmers in my sample is unclear. Therefore I assess the impact of the
demographic, economies of scale, market access, land rights and spatial interaction variables
described in this section on both sustained soybean adoption and soybean performance.

35
CHAPTER 3: SOYBEAN IN GHANA
Agriculture is the dominant employer in Ghana, contributing 51% of the gross domestic product
and 54% of the labor force. 80% of the country’s domestic agricultural production is contributed
by smallholder farming, characterized by land holdings of less than 2 hectares (ha) among 90%
of smallholder farming communities. Among smallholder farmers, women play a critical role,
representing 40% of the overall agricultural labor force and are engaged in the majority of
soybean production in Ghana. Female smallholders engage in all aspects of agricultural
production in Ghana, from land preparation and clearing activities, to planting, weeding,
harvesting and threshing as well as animal rearing and the home production and marketing of
agricultural products (Mbanya, 2011).
Soybean is a relatively new crop in Ghana. It was first introduced in the country in the early 20th
century as a food crop used to improve the nutritional value of traditionally consumed foods
(Mbanya, 2011). Soybean was initially cultivated for household consumption and as a crop used
for rotation with maize production, owing to soybean’s nitrogen-fixing capabilities. In recent
years there has been growing interest among agricultural development programs in Ghana to
promote soybean not only as a protein resource for human consumption but also as a valuable
source of feed for the growing global livestock and aquaculture value chains (Dogbe et al.,
2013). In this sense, soybean is now seen as a potential new source of income for smallholder
farming communities.
Further, domestic soybean production is seen by many Sub-Saharan African countries, including
Ghana, as a tool to stem imports of raw soybean and soybean meal. In 2014, the Ghanaian Cedi
significantly depreciated in the third quarter, losing approximately 40% of its value. This
resulted in significantly increasing the cost of imported soy products for domestic buyers such as
the poultry industry. Further, the unmet domestic demand for soybean in Ghana leaves little, if
any, soybean for export to neighboring countries (MEDA, 2015). Within this context, increasing
domestic production can be an important policy tool for reducing hard currency outflows and
promoting regional and national economic development.
The strong demand for soybean in Ghana, along with its potential to contribute to smallholder
farmer incomes, has resulted in increased promotion, awareness building, and extension and

36
outreach efforts among agricultural development and government actors. As such, soybean is
gaining popularity and acceptance among smallholder farmers in Ghana (Dogbe et al., 2013).
Nevertheless, average Ghanaian soybean yields remain well-below global averages. Dogbe et al.
(2013) found that average soybean yields in the Northern Region of Ghana, an area of Ghana
that contributes approximately 70% of the national soybean area and 77% of national production,
ranged from 509 to 642 kilograms per hectare (kg/ha). These yield figures represent only 30%
of the national average of 1,910 kg/ha (Dogbe et al., 2013) and only 25% of the global soybean
yield average of 2,310 kg/ha (Masuda & Goldsmith, 2009).
Low yields can be attributed to a low-input, low-output production scenario. Awuni and
Reynolds (2016) show that yields of currently available soybean varieties can be doubled
through the use of improved agricultural management strategies and inputs. Yet Mbanya (2011)
and Dogbe et al. (2013) observe very few smallholder farmers reporting the use of rhizobium
inoculants and other improved agricultural technologies including fertilizer application, herbicide
and pesticide use and good management practices (for example, row planting and using the
correct plant population).
In a study of smallholder soybean farmers in the Northern Region of Ghana, Dogbe et al. (2013)
found that no male farmers used inorganic fertilizers in their soybean production practices and
only 2.5% of females used inorganic fertilizers. Mbanya (2011) reports that smallholder
Ghanaian farmers do not plant in rows or use the correct plant population, two management
practices that can ensure effective weed control, a problem that affects not only soybean yields
but production costs as well. Poor management practices, coupled with the lack of use of
herbicides and weedicides, result in farmers needing to engage in three separate weeding
sessions throughout the growing period, the first 2-3 weeks after planting, the second 4-6 weeks
after planting and the last 8-10 weeks after planting (Dogbe et al., 2013).
This low-input production scenario results not only from a lack of accessibility of inputs due to
cost and availability, but also to a lack of awareness and farmer preference. Both Dogbe et al.
(2013) and Mbanya (2011) report a low awareness of improved production practices like the use
of rhizobium inoculants in soybean production. Further, many farmers prefer to invest in
technologies that improve the productivity of staple crops that can be readily consumed in the
household and/or sold at market. Smallholder farmers also believe that soybean, as a nitrogen-

37
fixing legume, does not require additional fertilizers for improved production (Dogbe et al.,
2013).
The underdeveloped Ghanaian soybean seed system also contributes to the low yields
experienced by smallholder soybean farmers. Most farmers do not purchase certified planting
seeds for their cultivation but rather use seed from their own stocks (Mbanya, 2011). Even when
farmers choose to utilize certified seed for production, their choice is limited. Tripp and
Mensah-Bonsu (2013) report that in 2011, only one variety of soybean was produced by
commercial seed producers, compared to 6 varieties of maize, 4 varieties of rice, and 3 varieties
of cowpea. In terms of quantity produced, in the same year only 189 metric tons (MT) of
soybean were produced by certified seed producers, compared to 2,670 MT of maize and 2,367
MT of rice (Tripp & Mensah-Bonsu, 2013).
The low level and diversity of certified seed production in Ghana thus constrains farmers from
accessing the appropriate variety of certified soybean seed needed for their agro-ecological
growing conditions. Further, farmers may find it difficult to access the appropriate quantity of
certified seed required for their scale of production. These issues of accessibility, coupled with
constraints related to affordability, farmer awareness and farmer preference contribute to the
low-input, low-output soybean production situation in Ghana.
The region of focus for my analysis is the Upper West region of Ghana. The Upper West region
covers a geographical area of approximately 18,478 square kilometers, representing close to 13%
of the total land area of Ghana. The Upper West region is bordered on the north by the Republic
of Burkina Faso, on the east by the Upper East region of Ghana, on the south by the Northern
region of Ghana and on the west by Cote d’Ivoire. The largest city and capital of the region is
Wa, with 224,066 inhabitants. The total population of the region is 576,583, representing 3% of
the national population of Ghana (Government of Ghana, 2017).

38
CHAPTER 4: DATA
The Greater Rural Opportunities for Women (GROW) project is an agricultural development
project operating in the Upper West region of Ghana with soybean as its focus crop. The GROW
project is a six-year initiative begun in 2012 and funded by the Mennonite Economic
Development Associates (MEDA) organization and the Department of Foreign Affairs, Trade
and Development (DFATD) of Canada. The primary goal of the GROW project is to improve
food security for families in Ghana by helping female smallholder farmers increase their
productivity in soybean cultivation, link farmers to sustainable markets, and create nutrition
awareness among project beneficiaries (Muhammed & Baker, 2015).
Recognizing the market access and market power constraints inherent in the production of a
commercial crop like soybean, the GROW project strategically targeted its efforts among female
smallholder farmers located in the Upper West region of Ghana. Through this geographically
focused program design, the GROW project seeks to create a social network effect among
producers to enable direct sharing of information and knowledge regarding new production
practices, clarification of key extension messages, and bi-directional communication with
information providers to ensure clarity and understanding of key messages.
As a result of the GROW project only focusing on female smallholder farmers, the respondents
in my dataset are all female soybean producers. This scenario presents important considerations
in analyzing the results of my research. Households headed by female producers may be smaller
in size, have lower incomes and may be less productive than household headed by male
producers (Doss, 2006). Further, men and women in Ghana farm separate plots of land and
produce different crops. Therefore in reporting total farm size, female respondents will likely
report their personal farm size rather than the combined size of their farm and their husband’s, or
other family members’ farms. Similarly, when reporting land allocated to soybean cultivation,
female respondents may report a land size larger than their individual farm size if they produce
soybean on their farm as well as their husband’s or other family members’ farms.
GROW project farmers are supported via a number of mechanisms. These include linking
farmers to extension services, input suppliers, markets, and financial services and training
farmers on nutrition, gender empowerment and the importance of dry-season income-generating

39
activities. Beneficiaries of the GROW project are trained on how to incorporate soybean into
traditional Ghanaian foods, are connected with aggregators, buyers and processors and receive
training from Ghanaian Ministry of Agriculture extension agents. The GROW project also
integrates its farmer beneficiaries with Village Savings and Lending Associations (VSLAs) to
strengthen financing opportunities for farmers to purchase seed, inputs, labor, and land
preparation and harvest services (MEDA, 2015).
A certain number of GROW farmers within each community are designated as “lead farmers” by
the project. Lead farmers receive direct extension training and mentorship from the project
through a train-the-trainer model. The intention of the train-the-trainer model is that once
trained, lead farmers will pass on the extension training they received to other project farmers
within their social and spatial networks. In addition to direct extension outreach, lead farmers
also receive extension information and agricultural messages through an information
communication technology (ICT) tool called a “talking book”. The GROW project’s “talking
book” is an audio device that contains recorded messaging in local languages focused on
improved agricultural production strategies for soybean cultivation (MEDA, 2015).
Farmers become a GROW project “client” during project enrollment, occurring prior to planting.
Farmers self-selected to participate in the GROW project thus there may exist selection bias and
my dataset may not represent the population at large. Enrollment data is collected via a Client
Registration Form (CRF). CRF data contain information on farmer characteristics (education,
household head, and experience/extension access), scale (farm size, land allocated to soybean
cultivation); market access (intention to sell grain, engagement in dry-season activities); land
rights (land tenure, duration of land control) and the geographic coordinates of the farm
household. Farmers are surveyed after harvest via a Client Monitoring Form (CMF). CMF data
contain information on soybean harvest (reported yield, harvest and threshing techniques, grain
sales and dry-season activities).
There likely exists a degree of endogeneity due to the type of data included in the MEDA CRF
and CMF surveys, which were designed for recordkeeping, not for testing adoption. Thus the
direction of causation cannot be determined with certainty, and the resulting analysis should be
considered as showing correlation rather than pure causality.

40
Enrollment and surveying of GROW project clients is conducted by one of five Key Facilitating
Partners (KFPs). KFPs are local non-governmental organizations (NGOs) contracted by the
GROW project. Each KFP covers a specific geographic area within the Upper West region. The
data for my analysis comes from one of the five implementing KFPs from the GROW project.
The GROW project began in 2012 with farmer enrollment beginning in 2013. My dataset
contains observations for GROW project clients who enrolled in 2013, 2014 and 2015.
Throughout the three year period from 2013 to 2015 59% of total registered GROW project
clients provided CRF, or enrollment data, but did not provide any post-harvest, or CMF data.
This indicates that this portion of the total sample did not follow through with soybean
cultivation and harvest after enrollment as their observations do not contain values for post-
harvest data, as measured by the CMF which captures measures of soybean yields and grain
sales. As this is a large share of the total sample, there is potential for attrition bias. As such, the
generalizability of the results need to be taken with caution.
In 2013 and 2014 CRF and CMF data were collected using paper survey forms. This resulted in
significant errors in the data collection process. In 2015 CRF and CMF data were collected
using electronic survey forms loaded onto tablets with the “iFormBuilder” software. The use of
tablets and electronic surveys considerably improved the accuracy of data collection in 2015.
The data used for my analysis thus comes from CRF and CMF data collected via electronic
surveys during the 2015 growing season.
CRF and CMF data from the 2015 growing season provided information on 496 project clients.
Of these 496 total observations, 453 had complete values across the variables used in my
analysis. A description of how observations were coded for the dependent and independent
variables used in my analysis is provided in the sub-section below. Table 4.1 provides a
description of the data collection process. Figure 4.1 shows the geographic distribution of the
453 farmers based in the Upper West region of Ghana, classified by adopter type.
Table 4.1
Description of data
Key Facilitating Partner (KFP) ProNet North
Country Ghana
Region Upper West
Districts Daffiama-Bussie-Issa (DBI)

41
Table 4.1 (continued)
Description of data
Districts Nadowli Wa East
Total number of 2015 CRF and CMF
farmer observations
496
Total number of 2015 CRF and CMF
farmer observations used in analysis
453
Survey tool: Client Registration Form
(CRF)
Collected prior to planting.
Focuses on farmer
characteristics, economies of
scale, market access, land
rights and the geographic
coordinates of farm
household.
Survey tool: Client Monitoring Form
(CMF)
Collected after harvest.
Focuses on soybean harvest
(reported yield, harvest and
threshing techniques, grain
sales and dry-season
activities).

42
Figure 4.1: Households surveyed in the Upper West region of Ghana (n = 453)

43
Variables
To measure whether a farmer engaged in sustained adoption of soybean, I use recall data from
the Client Registration Form (CRF) where farmers were asked whether they produced soybean in
2013, 2014 and 2015. In my sample, all farmers produced soybean in 2015. Farmers who
indicated that they grew soybean consecutively in 2013, 2014 and 2015 were coded as being
engaged in sustained adoption of soybean. Of the 453 total observations, 227 observations were
coded as being sustained adopters.
Recall my definition of intermittent adoption refers to farmers who reversed their decision to
engage in soybean cultivation, or farmers who indicated that they grew soy in 2013, did not in
2014, and resumed soybean cultivation in 2015. These farmers were coded as being intermittent
adopters. Of the 453 total observations, 38 observations were coded as being intermittent
adopters.
A third classification was used among my sample to designate farmers who reported 2015 as
their first year of soybean cultivation. These farmers indicated that they did not grow soy in
2013 or 2014, but did grow soy in 2015. These farmers were coded as late adopters. Of the 453
total observations, 188 observations were coded as being late adopters.
Summary statistics for the sustained adopter, intermittent adopter, and late adopter groups are
provided below in Tables 4.2, 4.3, and 4.4, respectively. Results from the t-test comparing the
sustained adopter group with the intermittent adopter group showed that I cannot reject the null
hypothesis that the means differ with respect to four of the variables: education, household head,
lead farmer and engagement in dry-season activities. Similarly the results from the t-test
comparing the sustained adopter group with the late adopter group showed that I cannot not
reject the null hypothesis that the means of the two groups are the same with respect to the
education and household head variables.

44
Table 4.2
Summary statistics of variables included in empirical analysis for sustained adopter group
Variables Mean Mean Standard
deviation
Minimum Maximum
Full sample
(N = 453)
Sustained adopter
(N = 227)
Education 0.137 0.106 0.428 0.000 3.000
Household head (=1) 0.084 0.088 0.284 0.000 1.000
Lead farmer (=1) 0.079 0.062 0.241 0.000 1.000
Farm size 1.335 1.761 0.801 0.000 6.475
Soy hectares planted (2015) 0.545 0.704 0.485 0.202 4.047
Hired labor (=1) 0.804 0.912 0.284 0.000 1.000
Dry-season activities (=1) 0.565 0.493 0.501 0.000 1.000
Intent to sell grain (=1) 0.740 0.934 0.249 0.000 1.000
Family or owned land (=1) 0.967 0.991 0.094 0.000 1.000
Can farm land 3+ years (=1) 0.364 0.185 0.389 0.000 1.000
Yield (2015) 748.631 950.034 550.914 24.711 2965.262
Table 4.3
Summary statistics of variables included in empirical analysis for intermittent adopter group
Variables Mean Mean Standard
deviation
Minimum Maximum
Full sample
(N = 453)
Intermittent adopter
(N = 38)
Education 0.137 0.053 0.226 0.000 1.000
Household head (=1) 0.084 0.105 0.311 0.000 1.000
Lead farmer (=1) 0.079 0.000 0.000 0.000 0.000
Farm size 1.335 0.857 0.529 0.202 2.023
Soy hectares planted (2015) 0.545 0.426 0.168 0.202 0.809
Hired labor (=1) 0.804 0.763 0.431 0.000 1.000
Dry-season activities (=1) 0.565 0.632 0.489 0.000 1.000
Intent to sell grain (=1) 0.740 0.605 0.495 0.000 1.000
Family or owned land (=1) 0.967 0.895 0.311 0.000 1.000
Can farm land 3+ years (=1) 0.364 0.395 0.495 0.000 1.000
Yield (2015) 748.631 486.082 364.711 24.711 1482.631

45
Table 4.4
Summary statistics of variables included in empirical analysis for late adopter group
Variables Mean Mean Standard
deviation
Minimum Maximum
Full sample
(N = 453)
Late adopter
(N = 188)
Education 0.137 0.193 0.642 0.000 3.000
Household head (=1) 0.084 0.074 0.263 0.000 1.000
Lead farmer (=1) 0.079 0.117 0.322 0.000 1.000
Farm size 1.335 0.917 0.891 0.202 6.475
Soy hectares planted (2015) 0.545 0.376 0.128 0.121 1.214
Hired labor (=1) 0.804 0.681 0.467 0.000 1.000
Dry-season activities (=1) 0.565 0.638 0.482 0.000 1.000
Intent to sell grain (=1) 0.740 0.532 0.500 0.000 1.000
Family or owned land (=1) 0.967 0.952 0.214 0.000 1.000
Can farm land 3+ years (=1) 0.364 0.574 0.496 0.000 1.000
Yield (2015) 748.631 558.517 402.510 6.178 2471.052
Farmer characteristics variables include whether a farmer was head of their household, their level
of education and their extension access in soybean production. Education was coded to reflect
the various levels of education present in the dataset (0 = never attended school; 1 = primary
school education; 2 = middle school, junior high school or junior secondary school education; 3
= secondary school education; 4 = tertiary education). For observations where the education
type did not fall into one of these categories (i.e. Arabic school, vocational school), farmers were
given a value corresponding to the average among all observations.
On average, sample farmers are not educated past a primary school education. Average
education among sustained adopters was .11, and .05 and .19 among intermittent adopters and
late adopters, respectively. The education variable was statistically different between the three
adopter groups. These results indicate that on average, among all adopter groups, farmer
respondents had never attended school. These findings are in line with Ragsdale and Read-
Wahidi’s (2015) survey of smallholder farmers in the Northern Region of Ghana where 87.6% of
female farmers surveyed reported less than a primary school education. Similarly, research by
Dogbe et al. (2013) showed similar results with 87.1% of female farmers indicated they had no
formal education. However my results, and those from the previously referenced authors, show
lower levels of education compared to statistics reported by the U.S. Agency for International

46
Development (USAID) in 2015. In their report, 57% of the 4,410 households surveyed in
Northern Ghana had never been educated (USAID, 2015).
Farmers who indicated that they were heads of their household were given a value of 1 while
those who did not were given a value of 0. Among the three adopter groups, between 7 and 11%
of farmers indicated that they were heads of their household. The household head variable was
statistically different between the three adopter groups. The low percentage of female heads of
household is in line with previous research by Ragsdale and Read-Wahidi (2015) among
smallholder farmers in northern Ghana, where 4.3% of households were female-headed as
compared to 93.7% of households that were dual-headed.
Being a “lead farmer” within the GROW project indicated a farmer’s access to extension
information in soybean production. Farmers who indicated that they were a lead farmer were
given a value of 1 while those who did not were given a value of 0. The majority of farmers in
the sample are not lead farmers. No farmers in the intermittent adopter group were lead farmers.
Among sustained adopters, 6% of farmers were lead farmers and 12% of late adopters were lead
farmers. The lead farmer variable was statistically different between the three adopter groups.
Farm size and area of land allocated to soybean production were converted from acres to
hectares. Agriculture production in Ghana is separated along gender lines, with males and
females each having separate plots of lands and crops of focus. As all sample farmers in my
dataset are female, farm size is expected to reflect the individual female farmer’s farm size rather
than total family farm size. In some instances the area of land allocated to soybean production
may be larger than the farm size reported by a given farmer if that farmer produced soybean on
their land as well as other land owned by relatives. The land allocated for soybean cultivation
reported was for the 2015 growing season only.
Average farm size among sustained adopters was 1.76 ha, .86 ha among intermittent adopters
and .92 ha among late adopters. Land allocated to soybean cultivation among sustained adopters
was .7 ha, .43 ha among intermittent adopters and .38 ha among late adopters. Both the farm size
and land allocated to soybean production variables were not significantly different among the
three adopter groups. The average amount of land allocated for soybean production among
smallholder farmers in Etwire et al.’s (2013) research was .80 hectares, a figure similar to the
land allocation for sustained adopters in my sample.

47
Farmers who reported using hired labor were given a value of 1 while farmers who didn’t report
the use of hired labor were given a value of 0. Farmers were able to report using more than one
labor source in their soybean production practices, including individual labor, hired labor,
communal labor, and family labor. Therefore farmers who indicated that they used hired labor,
regardless of the proportion of hired labor used with respect to their overall labor source, were
given a value of 1. 91% of sustained adopters engaged the use of hired labor in their soybean
production practices with 76% of intermittent adopters and 68% of late adopters using hired
labor. The hired labor variable was not significantly different among the three adopter groups.
Dogbe et al. (2013) notes that soybean producers in northern Ghana depend on different labor
sources including family, hired, and communal labor for land clearing, planting, weeding,
harvesting, threshing, pest and disease control. Noting the relatively high labor demand of
soybean cultivation, it is therefore likely that producers will engage hired labor at some point in
their cultivation practices.
Land rights variables relate to land tenure and the duration of land control. With respect to land
rights, farmers indicating that their land was owned individually or through their family were
given a value of 1 while farmers indicating that their land was either shared, leased or borrowed
were given a value of 0. Duration of land control was not dependent upon a farmer’s land rights
status. For example a farmer who reported owning their land and a farmer who reported
borrowing, leasing or sharing their land could both experience the same duration of land control.
Farmers indicating that the duration of their land control was at least 3 years (and up to 6 years,
the maximum value reported) were given a value of 1. Farmers who responded that they either
didn’t know the duration of their land control, or that the duration of their land control was 1
year or 2 years were given a value of 0.
The nature of land rights for the vast majority of sample farmers is owned land, either
individually or family owned, with between 86 and 99% of respondents indicated that their land
is owned among the different adopter types. Population-based survey results from USAID’s
2015 study show that 85% of households surveyed own their agricultural land. More
specifically, 21% of women surveyed in the study indicated that they were able to purchase land
and 23% were able to sell, give or rent land. This finding is similar to Dogbe et al.’s (2013)

48
findings that male producers in two districts of northern Ghana typically own their land and
provide land for rent to friends and colleagues at relatively low prices.
The duration of land control variable however differed among the adopter types. 19% of
sustained adopters reported land ownership of at least 3 years while 40% of intermittent adopters
57% of late adopters control their land for at least 3 years. Both the land rights and duration of
land control variables were not significantly different among the three adopter groups.
Yield measurements were calculated by dividing the total soybean production for a given farmer
by the total number of hectares (converted from acres) allocated for soy production. 2015 farmer
yield varied among the three adopter groups. Sustained adopters experienced an average yield of
950 kg/ha in the 2015 growing season with a median yield value of 906 kg/ha. Among
intermittent adopters, average yield was 486 kg/ha with a median yield value of 371 kg/ha.
Finally, late adopters experienced an average 2015 yield of 559 kg/ha with a median yield value
of 494 kg/ha. Yield values were not significantly different among the three adopter groups.
Research conducted by Dogbe et al. (2013) among smallholder Ghanaian soybean farmers
showed average yields in the range of 509 to 642 kg/ha. Etwire et al. (2013) found that
Ghanaian soybean farmers in their sample experienced averaged yield of 757 kg/ha. The
average yields among intermittent adopters and late adopters are in line with the ranges reported
by Dogbe et al. (2013) and Etwire et al. (2013). However, sustained adopters reported higher
yields than the farmers in Dogbe et al.’s (2013) study, potentially indicating the benefit of three
consecutive years of experience in achieving higher yields. Yet these yield ranges are still well
below the national average soybean yield of 2012, 1,910 kg/ha (Dogbe et al., 2013), and 2011,
1,500 kg/ha (Etwire et al., 2013). This indicates that farmers in my sample are achieving
performance in their soybean production that is well below the national average.
With respect to the market access variables included in my analysis, farmers indicating that they
did intend to sell their grain after harvest were given a value of 1, while farmers who indicated
that they did not intend to sell their grain after harvest were given a value of 0. Similarly,
farmers who indicated that they were engaged in dry-season, income-generating activities were
given a value of 1; while farmers indicating the opposite were given a value of 0. At least 50%
of respondents in all adopter groups reported engaging in dry-season activities. 50% of sustained
adopters engaging in dry-season activities, while 63% of intermittent adopters and 64% of late
49
adopters reported engaging in dry-season activities. The dry-season variable was statistically
different between the three adopter groups.
Ragsdale and Read-Wahidi (2015) report different peak income-generating months among male
and female smallholder farmers in northern Ghana, indicating that women may derive income
from different sources, including possibly dry-season activities. Interestingly, in the same study
the authors find that there was little difference in male and female responses regarding having
input in non-farm economic activities, potentially indicating that dry-season activities are split
along gender lines in Ghana (Ragsdale & Read-Wahidi, 2015).
Between 53 and 93% of respondents indicated an intention to sell their grain at harvest. Among
the adopter groups, sustained adopters were most mot likely to intend to sell their grain at 93%
while 53% of late adopters and 61% of intermittent adopters reported an intention to sell grain at
harvest. The intention to sell grain variable was not statistically different between the three
adopter groups. Farmers intending to sell their grain therefore exhibit a level of commercial
awareness that likely affects their access to source inputs like soybean seed as well. Ragsdale and
Read-Wahidi (2015) find that 53.8% of female smallholder farmers in their survey reported
knowing where to buy soybean seed that grows well in their agro-ecological area. Therefore the
level of commercial awareness in my sample is in line with previous research in this area.

50
CHAPTER 5: MODEL
Adoption
The probability of a farmer adopting an agricultural technology has typically been evaluated
within the literature using probit or logit models with flexible functional forms in the
independent variables that work well for the analysis of dichotomous choices (Besley & Case,
1993; Immink & Alarcon, 1993; Staal et al., 2002; Herath & Takeya, 2003; Maertens & Barrett,
2012; Ainembabazi & Mugisha, 2014). Yet in reality, farmers do not decide to adopt an
agricultural technology permanently at one point in time.
Instead, farmers make a series of decisions that change over time and subsequently affect the
adoption, and the performance, of an agricultural technology. These decisions include when,
how, and at what intensity to adopt the agricultural technology; how much land to allocate to the
technology; whether or not to continue adopting the technology; and whether to adopt a different
technology as they gain more experience through adoption or observe the experiences of fellow
farmers using the technology (Doss, 2006).
The adoption process is thus affected by decisions made in previous periods, and is influenced by
information gathering, learning by doing, and accumulating resources (Feder et al., 1985;
Edirisinghe & Holloway, 2015). These considerations highlight the need to understand how
farmer adoption decisions change over time rather than evaluating them in a snapshot, static
manner. My analysis acknowledges the inherent changing nature of the adoption process to
explore the idea of dynamic adoption among smallholder soybean farmers.
Previous research has sought to address the idea of dynamic adoption by evaluating either the
sequence or intensity of adoption by farmers when faced with an adoption package containing
different components (Doss, 2006; Ainembabazi & Mugisha, 2014). Examples of this type of
dynamic adoption research include evaluating the quantity of inputs a farmer decides to use
(intensity); modeling adoption as a two-stage process (sequence); different combinations of
technology adoption; step-wise adoption patterns; sequential decision making and simultaneous
adoption decisions (Doss, 2006).

51
An additional important component in understanding how the dynamic adoption process relates
to farmers’ histories of technology use (Doss, 2006). This consideration moves beyond simply
asking a farmer whether or not they are currently using a particular technology, but whether they
have ever used it in the past. My analysis delves into this question to enable an understanding of
two types of dynamic adoption: sustained (persistent) adoption, and intermittent adoption.
In my analysis I draw a distinction between three types of dynamic adoption: farmers who
adopted and continued using a technology (sustained adopters), farmers who adopted a
technology, discarded it, then returned to the technology (intermittent adopters), and farmers
with one year of adoption (late adopters). In evaluating these different adoption scenarios, my
research addresses the inherent dynamic nature of the adoption process and particularly the
drivers behind sustained versus intermittent adoption of a non-incremental, long-jump
technology like commercial soybean production. Further, the GROW project has struggled with
the presence of intermittent adoption among project farmers. This analysis examines the drivers
that predict intermittent adoption among project farmers as well as those that predict sustained
adoption among project farmers.
Following Besley and Case (1993), I model the existence of sustained adoption and intermittent
adoption using a probit regression analysis. I first acknowledge that the gain to farmer i of using
a new agricultural technology is typically parameterized as 𝛾𝑥𝑖 + 𝑢𝑖, where 𝑥𝑖 are farm and
farmer characteristics and 𝑢𝑖 is an independently and identically distributed farm specific ex ante
shock. As it is often assumed that these shocks are normally distributed, the model is run as a
probit, which assumes a normal distribution and is preferred over a logit model which assumes a
logistic distribution (Besley & Case, 1993; Herath & Takeya, 2003).
The probability of sustained adoption or intermittent adoption can be written as:
(1) 𝑃𝑟𝑜𝑏{𝑎𝑑𝑜𝑝𝑡𝑖𝑜𝑛 𝑏𝑦 𝑓𝑎𝑟𝑚𝑒𝑟 𝑖} = ∅(𝑦𝑥𝑖/𝜎𝑢)
where ∅(∙) is the distribution function of the standard normal. In equation (1) I measure the
impact of 𝑥𝑖 on the decision of farmer 𝑖 to engage in either sustained or intermittent adoption of
soybean. In this model 𝑥𝑖 is a vector of explanatory variables related to farmer characteristics,
economies of scale, market access and land rights.

52
In the sustained adoption probit regression model sustained adopters are given a value of 1, while
late adopters are given a value of 0. As the sample size for intermittent adoption is relatively
small compared to the other two adopter types, these farmers were removed from the sample
used for this analysis. Further, the focus of this probit regression model is to understand what
drives sustained adoption of soybean as compared to late adoption of soybean.
In the probit regression model used to predict intermittent soybean adoption, farmers engaged in
intermittent adoption are given a value of 1, while sustained adopters are given a value of 0. As
late adopters have by definition not yet had the possibility to engage yet in intermittent adoption,
they were removed from the sample used for this analysis.
Soybean Performance
I use individual farmer soybean yields in the 2015 growing season to measure farmer
performance in soybean production. I assume that farmer performance in soybean is a function
of drivers related to farmer characteristics, economies of scale, market access, and land rights.
Further, I explore the effect of different adoption decisions of a given farmer on performance in
soybean production in 2015. As sustained adopters have the most experience in soybean
production, they may be better integrated within commercial markets to enable procurement of
inputs and services that can improve their production performance. I therefore expect farmers
engaged in sustained adoption of soybean to be associated with higher performance in soybean
and farmers engaged in intermittent adoption of soybean to be associated with lower
performance in soybean production.
Farmer performance in soybean cultivation can be written as:
(2) 𝑦𝑖 = 𝑓(𝑥𝑖) + 𝜖𝑖
where 𝑦𝑖 denotes the output of famer 𝑖 in 2015 (soybean yield in my context). In equation (2) I
measure the impact of 𝑥𝑖, a vector of explanatory variables for farmer 𝑖 (including the adoption
decision for farmer 𝑖), and 𝜖𝑖, an error term, on the performance of farmer 𝑖 in 2015. As Feder et
al. (1985) note, this model is flexible enough to allow a situation where some variables positively
affect the mean and variance of yields, while others may have a negative effect.

53
Spatial Interaction
Spatial interaction among farmers may have important effects on the performance in soybean
production as a long-jump commercial agricultural technology. Spatially-connected farmers
may share technical information, guidance and knowledge within their networks. Further, their
spatial distribution may enable them to aggregate grain to yield better prices for output. Farmers
located within a network may receive more formal technical support services and achieve
savings in input procurement through volume discounts.
Previous research has sought to address the effects of space in the technology adoption process
through relatively rudimentary specifications of spatial relationships. These include the use of
regional dummy variables, measures of farmer distance to urban or market centers or measures
of spatial clustering among farmers (Staal et al., 2002; Ward & Pede, 2015). When these simple
spatial measures are integrated into inadequate regression models, estimates can be biased or
inconsistent, as they assume the absence of spatial correlations among unobservable factors.
However, unobservable factors can be present and likely play a large role within the endogenous,
contextual and/or correlated effects of spatial interaction on farmer performance in agricultural
technologies (Ward & Pede, 2015). I thus move beyond more simplistic integrations of spatial
variables into household adoption models and instead use a more refined, integrated approach to
better understand the spatial dimensions of soybean performance.
My dataset contains geographic coordinates for each household, provided in latitude and
longitude coordinates. As such I are able to spatially represent each farmer observation in my
sample to enable for a robust analysis of the effect of spatial interaction on farmer performance
in soybean production. The dataset used for the sustained adopter and soybean performance
models contained 453 farmer observations. However, due to coding errors with respect to the
latitude and longitude coordinates for 16 observations in this dataset, I were only able to use 437
of these farmer observations in the spatial interaction analysis.
Following Drukker, Prucha and Raciborski (2013) and Ward and Pede (2015), I employ a
generalized spatial two-stage least squares (GS2SLS) process that effectively identifies the
causal influences arising from spatial interactions between GROW project farmers. The
GS2SLS process augments the basic linear regression model to include spatially lagged
observations of the exogenous explanatory variables. An assumption of this model is that the
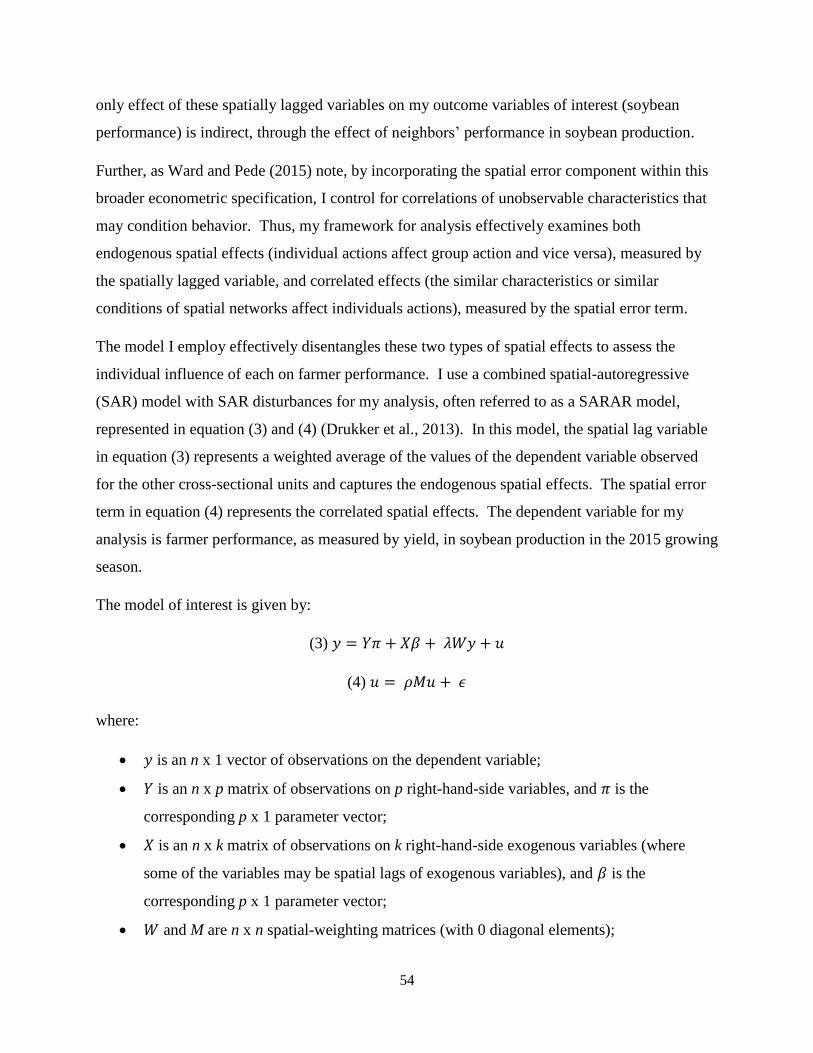
54
only effect of these spatially lagged variables on my outcome variables of interest (soybean
performance) is indirect, through the effect of neighbors’ performance in soybean production.
Further, as Ward and Pede (2015) note, by incorporating the spatial error component within this
broader econometric specification, I control for correlations of unobservable characteristics that
may condition behavior. Thus, my framework for analysis effectively examines both
endogenous spatial effects (individual actions affect group action and vice versa), measured by
the spatially lagged variable, and correlated effects (the similar characteristics or similar
conditions of spatial networks affect individuals actions), measured by the spatial error term.
The model I employ effectively disentangles these two types of spatial effects to assess the
individual influence of each on farmer performance. I use a combined spatial-autoregressive
(SAR) model with SAR disturbances for my analysis, often referred to as a SARAR model,
represented in equation (3) and (4) (Drukker et al., 2013). In this model, the spatial lag variable
in equation (3) represents a weighted average of the values of the dependent variable observed
for the other cross-sectional units and captures the endogenous spatial effects. The spatial error
term in equation (4) represents the correlated spatial effects. The dependent variable for my
analysis is farmer performance, as measured by yield, in soybean production in the 2015 growing
season.
The model of interest is given by:
(3) 𝑦 = 𝑌𝜋 + 𝑋𝛽 + 𝜆𝑊𝑦 + 𝑢
(4) 𝑢 = 𝜌𝑀𝑢 + 𝜖
where:
𝑦 is an n x 1 vector of observations on the dependent variable;
𝑌 is an n x p matrix of observations on p right-hand-side variables, and 𝜋 is the
corresponding p x 1 parameter vector;
𝑋 is an n x k matrix of observations on k right-hand-side exogenous variables (where
some of the variables may be spatial lags of exogenous variables), and 𝛽 is the
corresponding p x 1 parameter vector;
𝑊 and M are n x n spatial-weighting matrices (with 0 diagonal elements);

55
𝑊𝑦 and 𝑀𝑢 are n x 1 vectors typically referred to as spatial lags, and 𝜆 and 𝜌 are the
corresponding scalar parameters typically referred to as spatial-autoregressive
parameters;
𝜖 is an n x 1 vector of innovations
Note that if 𝜌 = 0 and 𝜆 = 0 the resulting model reduces to a linear regression model with
endogenous variables (Drukker et al., 2013). Thus the SARAR model is an augmented form of
the linear regression model which includes the additional right-hand-side variable known as the
spatial lag.
The spatial-weighting matrices 𝑊 and M are part of the model definition and are described in the
sub-section below. Following Drukker et al. (2013), if I let �̅� = 𝑊𝑦, let �̅�𝑖 and 𝑦𝑖 denote the 𝑖th
element of �̅� and 𝑦, respectively, and let 𝑤𝑖𝑗 denote the (𝑖, 𝑗)th element of W. Then
(6) �̅�𝑖 = ∑ 𝑤𝑖𝑗𝑦𝑗𝑛𝑗=1
This shows that the dependence of 𝑦𝑖 on neighboring outcomes is measured by the spatial lag �̅�𝑖.
The SARAR parameter 𝜆 measures the extent of these interactions (Drukker et al., 2013).
I also employ a modification of the SARAR model to include an additional right-hand side
spatially lagged variable for the presence of GROW project lead farmers within a spatial
network. The previous SARAR model shows the spatial dependence of farmer yields within a
network. Further, the model recognizes that spatial dependence is indirectly due in part to
individual farmer yields which are affected by individual farmer characteristics (contextual
effects). The inclusion of the additional spatially lagged variable in the augmented SARAR
model shows the direct, contextual effect of individual farmer characteristics (like lead farmer
status) on average farmer yields within a spatial network. Thus the augmented SARAR model
provides a richer interpretation of the spatial effects on yield, and explains, to a degree, why
space matters and how space matters.
The augmented SARAR model is given by:
(5) 𝑦 = 𝑌𝜋 + 𝑋𝛽 + 𝜆𝑊𝑦 + 𝛾𝑊𝑥 + 𝑢
(6) 𝑢 = 𝜌𝑀𝑢 + 𝜖
56
where:
𝑥 is an n x 1 vector of observations on lead farmer status
𝑊𝑥 is an n x 1 vector typically referred to as a spatial lag for the lead farmer variable
𝛾 is the corresponding spatial scalar parameter
In this augmented SARAR model the parameter 𝛾 measures the effect of having lead farmers in a
spatial network on farmer yields within the network (Drukker et al., 2013).
Spatial Weights Matrix
Similar to Ward and Pede (2015), I construct the spatial weights matrix, W, such that the strength
of network relationships is inversely related to the physical distance (measured in kilometers)
between farmer households, thereby creating an inverse distance spatial weights matrix. In
inverse distance matrices, more weight is placed on nearby farmers rather than on more
distantly-located farmers. The (𝑖, 𝑗)th element of an inverse-distance spatial-weighting matrix is
1/𝑑𝑖𝑗, where 𝑑𝑖𝑗 is the distance between unit 𝑖 and 𝑗 computed from the geographic coordinates
of the household and distance measure (Drukker et al., 2013).
I explored creating matrix W as a contiguity matrix, a matrix design that indicates whether spatial
units share a boundary or not. The most precise spatial boundary representation available in the
Ghanaian context is at the district level. In the spatial distribution of my sample, farmers are
located within only three districts of the Upper West region of Ghana. As such, a contiguity
matrix that is defined by shared boundaries among farmers does not provide an accurate and
detailed enough representation of the spatial distribution of my sample. Further, as my dataset is
comprised of point data (farmer household location), rather than polygon data (e.g. village-level
boundaries), a contiguity matrix is not appropriate for my analysis.
I further construct W to be a minmax-normalized matrix where each element of the matrix is
divided by the minimum of the largest row sum and column sum of the matrix. Specifically, in a
minmax-normalized matrix, the (𝑖, 𝑗)th element of �̃� becomes �̃�𝑖𝑗 = 𝑤𝑖𝑗
𝑚, where 𝑚 =
min{max𝑖(𝑟𝑖), max𝑖(𝑐𝑖)}, with max𝑖(𝑟𝑖) being the largest row sum of W and max𝑖(𝑐𝑖) being the
largest column sum of W. Minmax-normalized matrices are normalized by a scalar while
preserving their basic model specification. This process scales the weight values of the matrix to

57
a fixed range between -1 and 1. I explored other normalization options for matrix W including
row normalization and spectral normalization. Minmax normalization was the most appropriate
method for my analysis as the spatially lagged variable will differ for two people with a different
number of neighbors, or two people with the same number of neighbors but at a different average
distance. The minmax normalization process effectively lowers the weight on the neighbor
outcomes (and thus the spatially lagged variable) for a farmer who is more distant from their
neighbors.
In constructing W I also explored different truncation methods. Truncation specifies that the
values of the spatial-weights matrix W that meet the truncation criteria will be changed to 0. Bin
truncation partitions the values of W into B equal-length bins and truncates to 0 entries that fall
into bin b or below, b < B. Value truncation truncates to 0 the values of W that are less than or
equal to a set value v (Drukker et al., 2013).
In exploring the various truncation possibilities, bin truncation was determined as the most
appropriate method that preserved the structure of W while also removing from my analysis any
neighbors that were not appropriate. Using bin truncation I first determine the maximum value
in W. As my spatial weights matrix W is normalized so my weighted values fall between 0 and 1,
1 is the maximum value of W. I then divide the values of W into a set number of bins so that
observations with weights falling in the smallest bin are rounded to 0. The smallest bin b was
determined by first observing the average weight value in W which was found to be .223. Thus
any observations with a weight value smaller than the average of .223 were rounded to a weight
value of zero. For my minmax-normalized, bin-truncated W the average number of links
(neighbors) between the different adopter types is 52 with an average weight of .0004 and a
maximum weight of .223. The average distance between neighbors overall in W is 10.148
kilometers and the maximum distance between neighbors within each bin is .312 kilometers.
Without bin truncation, the average weight of W remains as .0004, the maximum weight changes
to .222 and the average number of links increases to 436. As my dataset contains 437 total
farmer observations, this indicates that the non-truncated matrix allows for nearly all farmers
within the matrix to be neighbors with each other, independent of distance. Without truncation,
the average distance between neighbors overall in W is similar to with bin truncation, at 10.292

58
kilometers, but the maximum distance between neighbors is 52.477 kilometers. This maximum
distance measurement is too large to enable classification of two farmers as neighbors.

59
CHAPTER 6: RESULTS AND DISCUSSION
Table 6.1
Estimated probit regression results for sustained soybean adoption
Variables Estimate Delta-method
standard error
Education -0.017 0.034
Household head 0.079 0.066
Lead farmer -0.107 0.066
Farm size .129*** 0.019
Soy hectares planted (2015) .303*** 0.095
Hired labor .150*** 0.054
Dry-season activities -.073* 0.039
Intent to sell grain .207*** 0.041
Family or owned land 0.157 0.115
Can farm 3+ years -.133*** 0.038
N 415 LR chi2 236.58 Prob > chi2 0.0000
Pseudo R2 0.4139
% Correctly classified 84.82%
Note: *Significant at 10% level; **Significant at 5% level; ***Significant at 1% level.
The sustained soybean adoption probit results are shown in Table 7.1. Recall that this probit
regression model compares famers engaged in sustained adoption with farmers classified as
intermittent adopters to understand the drivers that predict sustained adoption of soybean. The
results are presented in the form of marginal effects expressed as percent change in the
probability of sustained soybean adoption. Marginal effects interpret how much the probability
of the outcome variable changes as the value of a single independent variable changes, holding
all other independent variables constant.
The farmer characteristics variables of household head, lead farmer and education were all
insignificant in the probit model. However, these results may be attributable to the nature of my
dataset. In my sample, average education ranged from 0.11 to 0.20 among all adopter types. As
a value of 1 indicated that a farmer had received a primary school education, my farmer dataset
was comprised primarily of individuals who had never received any formal education. Noting the
low variability in education among my sample, it is unlikely that education would have a

60
statistically significant effect on the probability of engaging in sustained adoption. Similarly,
only between 6 and 12% of my sample indicated that they were lead farmers within the GROW
project. Therefore the lack of significance for the lead farmer variable may also be attributable
to the small percentage of my sample designated as a lead farmer.
The household head variable result may also be driven by the nature of my dataset. As Ragsdale
and Read-Wahidi (2015) found in their research in northern Ghana, only 4.3% of households
were female-headed, as compared to 93.7% that were dual-headed. Similarly in my sample,
between 7 and 11% of respondents indicated that they were heads of their household. The low
variability of female-headed households in my dataset may also be driving the lack of
significance for this variable.
While these variables were not statistically significant, my findings do not align with my initial
hypotheses that education and extension would be important drivers in helping farmers achieve
success in approaching the new and unfamiliar agronomic practices, commercial interactions and
market dependence inherent in soybean adoption. However unaccounted for in my analysis is
the quality of formal education and extension (provided through the lead farmer model) available
to my farmer sample. Extension agents, research institutes and development agencies all have
relatively little experience with soybean as a new and non-traditional crop. This lack of technical
knowledge and guidance may thus lessen the overall effect of extension information on adoption.
Results from this model indicate that, holding all other variables constant, each additional
hectare that comprises a GROW project farmer’s total farm size is associated with a 12.9
percentage point increase in the likelihood of that producer being a sustained adopter. Similarly,
I find that each additional hectare of land allocated to soy cultivation by a GROW project farmer
is associated with a 30.3 percentage point increase in the likelihood of that producer being a
sustained adopter.
These results point to the importance of economies of scale in the sustained adoption of a long-
jump agricultural technology like soybean. As previously highlighted, new commercial crops
like soybean require up-front fixed costs related to learning about new production practices and
in making market linkages for input and service procurement and grain sales. My results show
that it may be easier for producers with larger farms and with more land allocated to soybean
production to efficiently spread these fixed costs over more land, subsequently leading to

61
sustained adoption. My findings are in line with other research addressing economies of scale in
the technology adoption process literature (Etwire et al., 2013; Feder et al., 1985).
Further within the economy of scale framework, my results also show that producers who use
hired labor in some proportion to overall labor used in their soybean production are 15
percentage points more likely to be sustained soybean adopters. This result may point to the fact
that as women begin to adopt soybean, their independence and control over labor utilization may
increase, causing a reallocation of labor and a change in the balance between hired labor and
household/community labor. Further, female producers who engage hired labor in their soybean
production practices may present a level of sophistication to their farming practice that other
producers do not exhibit. Their interest, dedication and commitment to soybean production may
result in the use of hired labor, which can lead to improved production, a reduction in the labor
burden for women, and result in sustained adoption of soybean.
Both of the market access variables in my analysis are significant when analyzing their effect in
predicting sustained soybean adoption. Farmers who engage in dry-season activities are 7.3
percentage points less likely to be a sustained soybean adopter. However it is unclear how dry-
season activities may or may not compete for farmer attention with soybean production. At a
minimum, results indicate that farmers who engage in these types of activities are less likely to
engage in sustained soybean adoption. Soybean, as a new commercial crop with a steep
technical learning curve, requires farmers to exhibit a higher level of focus and specialization to
procure necessary inputs, services and make market linkages. Thus if dry-season activities do
indeed compete for farmer attention, then farmers who engage in these activities may be more
diversified in their farm enterprise, and therefore potentially less focused in soybean production.
Conversely, the variable for intention to sell grain has a significant and positive effect on
sustained soybean adoption. Farmers intending to sell their grain are 20.7 percentage points
more likely to be engaged in sustained soybean adoption. This result may indicate that farmers
who intend to sell their grain after harvest are better positioned to access input and service
markets as well as buyers, aggregators and processors. This leads to more competitive prices for
their grain as well as for inputs and services and may influence producers to remain engaged in
soybean production and be a sustained adopter. Further, farmers who exhibit an intention to sell
their grain may view soybean as a commercial crop requiring market integration and connection

62
rather than as a household nutrition crop. Farmers who approach soybean cultivation as a
commercial activity may thus be more committed to sourcing the necessary inputs needed for
successful production, leading to sustained adoption.
With respect to land rights, the land tenure variable is positive but not statistically significant.
Specifically, farmers with individual or family ownership of their land are 15.7 percentage points
more likely to engage in sustained adoption of soybean. This finding may indicate that the
longer planning horizons experienced by farmers with land ownership encourages investment in
soil correction practices that improve soybean yields and encourage sustained adoption. Further,
if land owners are more knowledgeable about the inherent quality of the land they farm they may
be more willing to invest in the appropriate soil correction practices needed to improve yields, in
turn leading to sustained adoption.
The duration of land control measure is negative and significant. My results show that farmers
who indicate that the duration of their land control is at least three years are 13.3 percentage
points less likely to be a sustained soybean adopter. The rationale behind the duration of land
control result is unclear. The finding may point to the fact that income generated from soybean
production encourages famers, regardless of the duration of their land control, to engage in
sustained adoption of soybean and makes the fixed and variable costs of production manageable
for farmers. Further, this finding may point to the idea that producers with uncertain or relatively
short land control durations may still experience the economic benefits of soybean as an income-
generating crop, even in the short-run, and thus the duration of land control is irrelevant in
determining sustained soybean adoption.
Table 6.2
Estimated probit regression results for intermittent soybean adoption
Variables Estimate Delta-method
standard error
Education -0.033 0.040
Household head 0.020 0.046
Lead farmer omitted omitted
Farm size -.063*** 0.024
Soy hectares planted (2015) -0.024 0.064
Hired labor -0.027 0.037
Dry-season activities 0.001 0.030
Intent to sell grain -0.023 0.031

63
Table 6.2 (continued)
Estimated probit regression results for intermittent soybean adoption
Variables Estimate Delta-method
standard error
Family or owned land -.126** 0.058
Can farm 3+ years -0.016 0.031
N 251 LR chi2 69.52 Prob > chi2 0.0000
Pseudo R2 0.3258
% Correctly classified 86.06%
Note: *Significant at 10% level; **Significant at 5% level; ***Significant at 1% level.
The intermittent adoption probit results are shown in Table 7.2. Recall that this probit regression
model compares farmers who engage in intermittent adoption with sustained adopters. This
comparison provides insight into what predicts intermittent adoption of soybean, a phenomenon
that the GROW project has identified as a critical challenge faced by smallholder women
soybean farmers in Ghana. Similar to the probit regression model assessing sustained adoption,
the results in Table 7.2 are expressed in marginal effects, showing the percent change in the
probability of intermittent soybean adoption. Overall the results from the intermittent adoption
probit model are weaker than the sustained adoption regression.
As in the sustained adoption model, farmer characteristics including education and household
head were insignificant in the intermittent adoption model. As a new commercial crop, soybean
requires farmers to invest new time and resources, engage with new market actors and
significantly change their production practices. As such, traditional drivers of adoption for
incremental, short-jump technologies may not apply in this context. The variable for lead farmer
was omitted from the analysis as no intermittent adopters were classified as lead farmers.
Results from the intermittent adoption model show that, holding all other variables constant,
each additional hectare of a GROW project producer’s total farm size is associated with a 6.3
percentage point decrease in the likelihood of engaging in intermittent adoption. The effect of
land allocation to soy cultivation in the intermittent adoption model is negative, indicating that as
farmers allocate more land to soy production they are less likely to become an intermittent
adopter.

64
This finding indicates that while increased land allocated for soybean production may encourage
sustained adoption, the converse is not true, in that reduced land allocation for soybean does not
predict intermittent adoption. Therefore economies of scale may play a more important role in
predicting sustained adoption than predicting intermittent adoption in the context of soybean
production. Due to the high fixed costs for soybean as a new commercial crop for smallholders,
it may be more difficult for producers with smaller farms to efficiently utilize soybean as an
income-generating crop. This may discourage producers from continuing to adopt soybean,
resulting in intermittent adoption.
Interestingly, the variables for the amount of land allocated for soybean production, the use of
hired labor, engagement in dry-season activities and intention to sell grain are all insignificant in
the intermittent adoption model, though the direction of the effect is as expected. Thus variables
related to economies of scale and farmer market access provide more explanatory power in
predicting sustained adoption rather than intermittent adoption. This finding may indicate that
there are unobserved effects driving intermittent adoption among farmers in my sample that are
not accounted for in my analysis.
Land ownership is significant and negative in predicting intermittent adoption of soybean.
Specifically, when farmers own their land, either individually or through family ownership, they
are 12.6 percentage points less likely to engage in intermittent adoption of soybean. This finding
indicates that while land ownership is not a significant predictor of sustained adoption, it is an
important indicator of preventing intermittent adoption. Farmers who borrow, lease or rent their
land may not see the value in correcting soils on lands that they do not own, regardless of the fact
that this practice improves performance in soybean production. Not engaging in this production
practice can lead to poor performance, thus leading to intermittent adoption.
Table 6.3
Estimated OLS regression results for 2015 yield
Variables Estimate Standard
error
Education 28.240 41.484
Household head -25.143 76.545
Lead farmer 150.887* 80.598
Sustained adopter 101.153* 58.910
Intermittent adopter -93.077 80.843

65
Table 6.3 (continued)
Estimated OLS regression results for 2015 yield
Variables Estimate Standard
error
Farm size 73.015*** 27.767
Soy hectares planted (2015) 103.528* 62.549
Hired labor -47.353 64.268
Dry-season activities -132.825*** 45.367
Intent to sell grain 327.842*** 55.515
Family or owned land 121.584 120.022
Can farm 3+ years -156.815*** 51.454
N 453 R-squared 0.286 F-stat (12, 440) 14.66
Prob > F 0.0000
Note: *Significant at 10% level; **Significant at 5% level; ***Significant at 1% level.
Table 7.3 reports results from the OLS regression of 2015 farmer yields among the various
adopter groups. Similar to the sustained adoption probit model, farmer characteristics of
household head and education were insignificant in the yield regression model. Again, this
finding may be a result of the low variability of these characteristics among my farmer sample.
While lead farmer status was not a significant predictor of sustained soybean adoption, there is a
significant effect of being a lead farmer on soybean yields. Specifically, producers who reported
that they were lead farmers experienced an additional 150.9 kg/ha in their 2015 soybean yields.
This result may point to the fact that being a lead farmer doesn’t significantly change a
producer’s decision of whether or not to continue adopting soybean. Instead this decision may
be affected more by drivers related to market connectedness and economies of scale. However,
being a lead farmer, and having direct access to extension messaging and guidance, does have a
significant effect on yield. This finding is significant in the case of long-jump agricultural
technologies like soybean where producers cannot rely on their tacit knowledge, norms and
practices to engage in successful cultivation, but must rely on outside extension messaging and
information channels.
The final contributing variable in the farmer characteristics framework relates to experience in
soybean production. Sustained adopters, those with three consecutive years of producing

66
soybean, experienced an additional 101.2 kg/ha in their 2015 soybean yields than farmers who
were not classified as sustained adopters. Conversely, intermittent adopters on average
experienced 93.1 less kg/ha in their 2015 yield as compared to sustained adopters and late
adopters, though this result is not statistically significant. This result may indicate that soybean
performance is improved over time as farmers gather more information about this new crop,
accumulate more resources and become more experienced in production. Further, this result
underlines the negative effect that lack of experience and commitment in soybean production can
have on performance.
The same economy of scale variables found to be significant in the probit regression model were
also significant in the OLS regression, with the exception of the use of hired labor. Specifically,
farm size and land allocation for soy production both had a significant and positive effect on
farmer soybean yields in 2015, increasing yields by 73 kg/ha and 103.5 kg/ha, respectively.
These large yield increases point to the positive benefits that economies of scale contribute in
managing the fixed costs associated with soybean production, and in leading to both sustained
soybean adoption and high performance in soybean production. Economies of scale may result
in increased returns to scale for farmers adopting a new, commercial, long-jump agricultural
technology like soybean. However hired labor may not play a critical role in soybean
performance as it does for sustained and intermittent adoption of soybean.
Market access measures related to engagement in dry-season activities and intention to sell grain
are both significantly associated with farmer yields in this model. Specifically, farmers who
engage in dry-season activities produce, on average, 132.8 kg/ha less than farmers who are not
engaged in dry-season activities. Similar to the explanation in the probit regression results, the
potential for these dry-season activities to compete for farmer attention with soybean is unclear.
Therefore the results indicate at a minimum that farmers who engage in dry-season activities
achieve lower soybean yields than those who do not. However if the dry-season activities do
indeed compete for farmer attention then the hypothesis holds that success in soybean cultivation
requires a level of focus and specialization.
Farmer intention to sell grain at harvest has the strongest effect on farmer soybean yields in
2015. Farmers who intend to sell their grain experience, on average, 327.8 kg/ha more than
farmers who do not. Farmers who intend to sell their grain may have existing contracting

67
schemes with institutional buyers such as processors who offer a better, pre-determined, and/or
secure price for their grain output. Further, these producers may also have existing market
connections that enable them to access buyers, and procure inputs and services necessary for
improved production. This result highlights the importance of market connectedness in
determining farmer performance in the production of a long-jump agricultural technology like
soybean.
Similar to the probit model, duration of land control is negatively associated with soybean
performance. Specifically, producers who indicate that the duration of their land control is at
least three years experienced lower yields in the magnitude of 156.8 kg/ha. Similar to the
sustained adoption and intermittent adoption probit regressions, the rationale behind this finding
is unclear. There may be an unobservable relationship between land quality and duration of
control driving this result.
Conversely, producers who indicate that their land is owned either individually or through their
family generated an additional 121.6 kg/ha on average than producers who do not own their land
and instead lease, borrow or share their land, though this result was not statistically significant.
Thus while the duration of land control may present a seemingly contradictory effect, the effect
of land tenure on soybean performance is clearer. I should note that producers with a certain or
relatively long duration of land control do not necessarily own their land. However, land tenure
is a more definitive measure of farmer land ownership, and thus may be a better proxy to assess
tenure security than the duration of land control variable.
Table 6.4
Estimated SARAR model results for 2015 yield
Variables Estimate Standard
error
Education 16.253 39.883
Household head -23.462 75.832
Lead farmer 167.543** 79.830
Sustained adopter 125.655** 63.829
Intermittent adopter -89.325 83.184
Farm size 53.807** 27.868
Soy hectares planted (2015) 57.380 61.847
Hired labor -25.272 62.861
Dry-season activities -94.345** 44.638

68
Table 6.4 (continued)
Estimated SARAR model results for 2015 yield
Variables Estimate Standard
error
Intent to sell grain 275.516*** 56.976
Family or owned land 50.458 125.298
Can farm 3+ years -114.177** 57.969
Lambda .644*** 0.258
Rho .947*** 0.200
N 437
Note: *Significant at 10% level; **Significant at 5% level; ***Significant at 1% level.
Table 7.4 displays the results of the SARAR model for 2015 yield among the different adopter
groups. As discussed in the Model section, the spatial lag parameter lambda (𝜆) measures the
extent of the spatial interactions on 2015 soybean yields. The lambda value at .644 is both
positive and significant at the 1% level. (Without truncation or normalization of the spatial
weights matrix W the lambda value remains positive and significant, but to a lesser extent.)
Recall that in creating a minmax-normalized spatial weights matrix the range of 𝜆 can only fall
between -1 and 1. Thus the value of 𝜆 at .644 shows a strong effect of spatial interaction on
farmer yields. This confirms my hypothesis that there is positive, large, and significant spatial
autoregressive dependence in soybean yields. In other words, the soybean yield of a given
GROW project farmer is strongly affected by the soybean yield of neighboring GROW project
farmers.
This finding also underlines the presence of spatial interaction and integration among farmers,
highlighting the potential roles that social multiplier effects may play in farmer performance in
soybean production. Knowledge about new agricultural technologies, particularly those that are
new, unfamiliar and commercial in nature, can spill over within members of spatial networks.
The positive and significant 𝜆 value in the SARAR model indicates that farmers are expected to
have higher yields if, on average, their neighbors have higher yields.
In terms of the individual independent variables included in my SARAR analysis, the results are
for the most part in line with the OLS regression. However the interpretation of the coefficients
in the SARAR model is different than in the OLS regression. The SARAR model assesses the
impact of each independent variable on average farmer yield while also controlling for spatial

69
dependence, or the extent to which variation in a given farmer’s yield can be accounted for by
the yield of a neighboring farmer. Thus the magnitude of the various coefficients in the SARAR
model are affected by the inclusion of the spatially lagged variable in the model.
The presence of a lead farmer and sustained adopter have significant and positive effects on
farmer soybean yields, and at larger magnitudes than in the OLS yield regression model. This
finding indicates that producers who are lead farmers and sustained adopters have, on average,
higher yields which in turn have a positive effect on the average yields within their spatial
network. Further, there is a positive and significant effect of farm size on yield in the SARAR
model, yet the effect is at a smaller magnitude than in the OLS regression. This finding indicates
that in addition to the spatial effects of farmer networks and experience on yield, economies of
scale continue to play a role in successful soybean production when assessing the impact from a
spatial perspective.
The effect of the market access variables of dry-season activity engagement and intention to sell
are both consistent with the OLS regression results. Engagement in dry-season activities has a
negative and significant effect on soybean yields when controlling for spatial dependence.
Conversely, farmer intention to sell grain positively and significantly affects soybean yields in
the SARAR model. As noted earlier, farmers who intend to sell their grain may be better
integrated with markets and institutional buyers who offer more secure and potentially higher
prices for grain output as well as for inputs and services. Further, farmers with connection to
markets may be in a better position to aggregate grain, receive formal technical support services,
and reduce the cost of inputs through reduction in fixed costs and volume discounts. These
characteristics may contribute to the positive effect that intention to sell grain has on farmer
yields. Finally, farmers with a longer duration of land control have a significant and negative
effect on the soybean yields of farmers within a spatial network, as seen in the OLS regression.
The estimated 𝜌 value is also strong, significant, and positive with a value of .947. Recall that
the 𝜌 value enters the model specification only through the error terms. Therefore the
significant, large and positive 𝜌 value indicates that observations within the farmer sample are
related in terms of unmeasured factors that are correlated across the distances among the
observations. Thus the 𝜌 value is a coefficient indicating the correlation of the residuals, rather
than a right hand side covariate of explicit interest.

70
The effects captured in the spatial error term may relate to correlated effects as noted by Ward
and Pede (2015). Examples of potential correlated effects include soil and climate characteristics
that are spatially correlated across farmer networks. Farmers within a given spatial network may
farm land with inherently better soils than farmers in a different spatial network. Similarly, the
topography and slope among spatial networks may differ, contributing to the unobserved spatial
error effect in the model. Further the social institutions, organizational structures and policies
that change across spatial boundaries can affect farmer performance in agricultural technologies
(Ward & Pede, 2015).
In sum, as both the 𝜌 and 𝜆 values are large and greater than their standard errors, there exists
substantial spatial dependence in yield among GROW project farmers. As such, my results show
that standard OLS regressions that assume independent observations may be misleading
(Gleditsch et al., 2007).
Table 6.5 Estimated GS2SLS spatial autoregressive model results for 2015 yield with lead farmer spatial
lag
Variables Estimate Standard
error
Education 14.738 39.428
Household head -17.227 75.037
Lead farmer 182.791** 79.558
Lead farmer lag 2843.505** 1327.867
Sustained adopter 140.572** 64.038
Intermittent adopter -74.770 82.618
Farm size 55.347** 27.713
Soy hectares planted (2015) 63.583 61.365
Hired labor -15.471 62.282
Dry-season activities -96.010** 44.191
Intent to sell grain 280.184*** 56.625
Family or owned land 44.146 124.022
Can farm 3+ years -128.200** 58.232
Lambda 0.362 0.292
Rho -.947 0.200
N 437
Note: *Significant at 10% level; **Significant at 5% level; ***Significant at 1% level.

71
The results of the augmented SARAR model that includes a spatially lagged lead farmer variable
are presented in Table 7.5. The additional spatially lagged variable shows the direct effect of the
presence of lead farmers within a spatial network on average farmer yields. The contribution of
this model is to identify what spatial mechanism is contributing to the spatial dependence shown
by the lambda term in Table 7.4. A clearer understanding of how space and proximity matter, to
what degree, is provided by the augmented SARAR model.
The spatially lagged lead farmer variable is large, significant and positive, indicating that
average farmer yields within a spatial network were improved by the presence of lead farmers
within this network. Specifically, the presence of lead farmers within a spatial network increased
average farmer yields by 2,843.51 kg/ha. The value of the coefficient on the spatially lagged
lead farmer variable is relatively high and should be cautiously interpreted because such a small
percentage (8%) of the sample are lead farmers.
This finding underlines the success of the GROW project’s lead farmer extension model and the
existence of knowledge spillover within spatial networks. As a long jump agricultural
technology, soybean production requires farmers to engage in knowledge acquisition to offset
the steep learning curve of a new commercial crop. Farmers are unable to rely on their tacit
knowledge, experiences and norms in soybean cultivation. Therefore farmers must have access
to critical information on agronomic practices and input utilization to successfully produce
soybean.
Lead farmers who had direct access to extension messaging and guidance were able to share this
knowledge and training with farmers within their spatial networks. This finding underlines the
presence of spatial interaction and integration among farmers, highlighting the potential roles
that social multiplier effects may play in farmer performance in soybean production. We see that
knowledge about new agricultural technologies, particularly those that are new, unfamiliar and
commercial in nature, can spill over within members of spatial networks
This finding thus has important policy considerations in that community-based extension models
can yield positive effects for spatial networks and may have a place alongside traditional
extension models. Traditional extension models rely on irregular visits by extension officers
who may or may not be integrated within the social network of a given farmer group. Extension
agents may also not have adequate or appropriate knowledge regarding the agronomics of

72
soybean production and input utilization and may be ill-equipped to respond to the technical
questions and knowledge needs of smallholder farmers. The lead farmer model instead provides
focused extension messaging on soybean production and does so through a network-based
approach.
Further, as Ragsdale and Read-Wahidi (2015) show, Ghanaian female smallholders in particular
struggle when they have to engage extension for guidance in new technologies due to traditional
gender norms and relationships. Thus employing extension models that are both community
based and gender sensitive, as lead farmers in this context were also female smallholder farmers,
may represent a new development tool to ensure adoption and high performance in the context of
long jump agricultural technologies.
This finding highlights the importance of farmer clustering and farmer networks in encouraging
successful production of soybean as a long-jump technology. As farmers face similar
production, demographic and market access conditions and interact directly with each other they
learn first-hand from lead farmers about improved agronomic practices. Further, farmers learn
from each other regarding the importance of inputs in their production and can first-hand observe
the costs and benefits of new technologies rather than relying on information from extension
agents, development agencies or other actors.
In the case of soybean as a long-jump agricultural technology, there is an inherent risk and
technical learning curve associated with the crop due to its unfamiliarity and market dependence.
The positive effect of lead farmer presence on a spatial network’s soybean yields lends credence
to the idea that there exists positive spatial externalities with respect to the demonstration effect
and information and knowledge flow between neighboring smallholders. Equipping farmers
within a spatial network with direct extension access can thus help to reduce the uncertainty of a
new agricultural technology, thereby improving farmer performance.
Finally, results from the augmented SARAR model show that the lambda and rho parameters
remain positive, but the spatial dependence parameter is no longer statistically significant. While
the inclusion of the spatially lagged lead farmer variable clearly reduced the overall spatial
dependence effect in the model, it should not be discounted either or assumed to be zero.
Though not statistically significant, there is still a level of spatial dependency among farmer
yields within the GROW project that is unobserved and not attributed to the lead farmer effect.

73
As the spatial error term rho remains positive and significant, the augmented SARAR model
shows unobserved correlated effects within a given spatial network that contribute to overall
spatial dependence among yields within the network.
74
CHAPTER 7: CONCLUSION
As governments, development agencies, donors and the international community seek to identify
new pathways to move rural African communities out of poverty, the production of profitable
commercial crops may hold potential as a promising agricultural technology. It is within this
context that soybean, a crop with a large, growing and global demand, is seen as a tool
worthwhile of investment and capable of shifting smallholders out of subsistence farming and
into new opportunities for income generation. While soybean farming presents significant
opportunities for smallholders, it also carries with it complex challenges as a non-traditional and
non-staple commercial crop. Understanding how farmers may achieve success in soybean
production, and continue to utilize the crop as an agricultural technology is critical to achieving
broader goals of poverty reduction and economic growth in rural areas.
This research fills a void in the existing literature by examining the adoption process for soybean
as a representative example of a non-incremental, or long-jump, agricultural technology. To do
so, I examine three critical components of the technology adoption process. First, I move
beyond the idea of static, or binary, adoption choice models to examine the idea of dynamic
adoption, or sustained, persistent adoption versus intermittent adoption. Next, I employ a
continuous dependent outcome variable in the adoption process research to understand how
farmer performance in soybean as a technology is impacted by a number of different drivers and
farmer characteristics. Finally, I recognize the importance of space and farmer networks in
impacting farmer performance by using a spatial autoregressive model that moves beyond more
traditional methods that include spatial measures as an explanatory variable in linear regressions.
Dynamic adoption recognizes that adoption decisions change over time and are not adopted at
one point in time with permanence. Instead, adoption is affected by decisions made in previous
periods and is influenced by experience, among other factors. By assessing the impact of farmer
characteristics, market access, land rights, and economies of scale on soybean performance, I
highlight a critical component in the technology adoption process: the role of success in
encouraging adoption. Farmers must not only adopt a technology in a sustained, persistent
manner, but they must also experience a level of success in production that can generate the
income potential of the crop. Finally, in recognizing the role of space in soybean performance, I
underline the importance of social learning, social networks, and farmer groups in sharing

75
information, resources, knowledge and experience. This analysis delves into more traditional
modes of communication in rural settings, and examines the impact of peer networks rather than
top-down approaches more characteristic of traditional extension delivery systems.
My findings highlight the importance of economies of scale in the production of new commercial
crops like soybean. Soybean production requires up-front fixed costs for farmers related to
learning about new agronomic and production practices and making the necessary market
linkages to source inputs and services and aggregate and sell grain. Smaller farms and those
without adequate land to allocate to soybean cultivation may not find soybean a profitable
endeavor for their farm when they are unable to spread these fixed costs over larger land areas.
Further, smaller farms may find it difficult to attract buyers who will provide a competitive price
for their grain if their overall output is low. If they are only able to attract intermediary buyers
who offer relatively lower prices, they may be unable to offset the costs incurred in the soybean
production system.
The importance of scale in predicting sustained adoption and improved performance of long-
jump agricultural technologies like soybean points to the non-incremental nature of the crop.
Successful soybean production and persistent adoption requires farmers to make significant
changes to their overall production practices and to the overall focus of their farming enterprises.
A component of this shift may include changing the scale of production for a given farmer. In
the context of soybean, my analysis shows that producers with larger farm sizes and those who
devote more land to soybean cultivation may be in a better position to ultimately achieve the
income generating potential of the technology. Further, there may exist certain farm sizes for
which the production of new commercial crops and the application of other long-jump
technologies are not suitable due to a lack of scale. This is an important consideration for
development agencies, governments, and donor groups attempting to transition smallholders to
new long jump technologies.
The economy of scale finding points to two potential policy intervention areas. The first relates
to cooperative marketing for a new commercial crop like soybean. Cooperative marketing and
grain aggregation activities can attract institutional buyers and processors who can pay fair and
competitive prices for grain, reduce post-harvest losses through shared storage facilities, and
achieve volume discounts on input and service procurement. These mechanisms can also

76
promote the inclusion of farmers producing on a range of different farm sizes and may offset the
negative returns to scale for smaller farmers.
Secondly, subsidization packages that offset the relatively high cost of inputs necessary for
soybean production including phosphorous fertilizers and inoculum may be an area worthwhile
of investment and attention. While many governments do subsidize components of staple crop
production, like maize, similar subsidy programs do not exist for new commercial crops that can
generate significant sources of income for rural communities. Encouraging the use of necessary
inputs through subsidization, at least in the short term, can encourage producers, regardless of
farm size, to apply them in their cultivation practices.
An additional critical finding of my analysis centers on the importance of market access for
smallholder producers engaged in soybean production. My findings show that farmer intention
to sell grain is a significant predictor of sustained adoption and success in soybean performance.
Farmers producing a subsistence portfolio consisting of traditional, staple crops need not rely on
new aspects of market integration for successful production. Instead, their success in production
is a result of the inherent knowledge and skills they possess with respect to these crops. Soybean
presents a new, complex crop that requires farmers to engage in new levels of market access to
engage the necessary service providers, source inputs and reach buyers for their grain.
Farmers who intend to sell their grain may have an existing level of market access that can be a
result of a number of factors, including physical location, market engagement from other crops
produced, or as a result of outside institutional support. Regardless of the contributing factor, my
research highlights the importance of market access in successful and sustained soybean
production. Thus if soybean is to be successful as a development engine to move rural
communities out of poverty and improve regional economic growth, farmer penetration in
markets must be considered. Development agencies can help foster connections between
institutional buyers and processors with farmer cooperatives, farmer networks and farmer
associations. More widespread availability of certified seed, phosphorous and inoculum would
enable a larger proportion of farmers to access these necessary inputs. Further, village or
community-level processing mechanisms or enterprises would serve as an intermediary market
for farmer grain output while also contributing processed soy products to the local animal feed
industry.

77
My results show that engaging dry-season activities is associated with intermittent adoption of
soybean and low performance in soybean yields. The production of new, commercial crops like
soybean require focus not only during production but prior to production as well. Producers
must engage input and seed suppliers during the dry-season, prior to planting, and must ensure
that they have adequate labor and services to support their production. While dry-season
activities may be seen as an added income-generating activity, when coupled with the demands
of soybean as a new commercial crop, they may diminish from overall farmer output and
discourage sustained adoption. It is difficult to know how and to what degree dry-season
activities may compete for farmer attention in soybean production, but evidence shows that they
are not associated with sustained adoption and high performance. Therefore, a more targeted
investment for development agencies, governments and donors may be to focus on connecting
farmers with markets, input and seed suppliers, and forming cooperative unions and farmer
associations rather than encouraging producers to engage in multiple income-generating
activities.
New commercial crops, and particularly soybean, which requires threshing to separate the seed
from the pod, exposes farmers to new labor demands. This is of critical concern as rural farm
households, and particularly women, already dedicate a large portion of time and energy on labor
for their agricultural production. Outsourcing labor for the production of new commercial crops,
particularly in the planting, weeding and harvesting stages may allow farmers to focus their time
and remaining resources on procuring high-quality seed and inputs to enhance their production,
and engage in farmer networking to develop new skills with respect to soybean production. The
decision of how to allocate time and resources within the farm enterprise is associated with a
level of sophistication and focus necessary for success in soybean cultivation. As the use of
hired labor in my analysis was associated with improved performance in soybean production and
sustained adoption, my findings highlight the importance of sophistication and discernment in
terms of resource allocation. Providing training and education to famers in this arena may be
beneficial to overall production in soybean among smallholders.
A final key finding of my analysis centers on the importance of spatial networks and social
learning in improving the performance of soybean production among smallholder farmers.
Specifically, the steep learning curve associated with soybean as a new commercial crop results

78
in substantial knowledge spillover and social multiplier effects that take place within traditional,
peer-based farmer networks. As farmers within a network face similar production, demographic
and market access conditions they can interact directly with each other to learn and observe first-
hand the importance of improved agronomic practices, the appropriate use of inputs and the costs
and benefits of new technologies like soybean.
This finding has important policy considerations for agricultural development programs with
respect to developing extension approaches. My results show that community-based extension
models can yield positive benefits in soybean yields within a spatial network. Farmer networks
can serve as a knowledge and information hub and warrant a place alongside traditional
extension models that rely on irregular visits by extension officers who may or may not be
integrated within the social network of a given farmer group and are likely not well trained on
soybean cultivation. Instead, providing extension information focused on soybean through a
social network, lead farmer model may be more appropriate. Additionally, in the context of
female smallholder farmers, women may feel more comfortable approaching other female peers
for extension information rather than government extension agents who are predominately male.
As such, the use of soybean as a development tool must be considered within the framework of
farmer networks, peer groups and social learning. Agricultural development programs must
recognize the information and knowledge flow between neighboring smallholders and encourage
responsive extension models that focus on community-based information hubs where
information sharing, resource building and aggregation opportunities can have the largest impact.
In the context of soybean, producers are unable to rely on their tacit knowledge, norms, and
traditional production practices and will look elsewhere for critical information and training on
how to produce a new commercial crop. Investing in farmer networks to build these knowledge
and information resources can yield sustainable extension models for farming communities.

79
REFERENCES
Adesina, A. A., & Zinnah, M. M. (1993). Technology characteristics, farmers' perceptions and
adoption decisions: A Tobit model application in Sierra Leone. Agricultural economics, 9(4),
297-311.
Ainembabazi, J. H., & Mugisha, J. (2014). The role of farming experience on the adoption of
agricultural technologies: Evidence from smallholder farmers in Uganda. Journal of
Development Studies, 50(5), 666-679.
Akramov, K., & Malek, M. (2012). Analyzing profitability of maize, rice, and soybean
production in Ghana: Results of PAM and DEA analysis. Ghana Strategy Support Program
(GSSP) Working, 0028.
Al-Hassan, S. (2008). Technical efficiency of rice farmers in Northern Ghana (No. RP_178).
African Economic Research Consortium.
Alene, A. D., & Manyong, V. M. (2006). Farmer‐to‐farmer technology diffusion and yield
variation among adopters: the case of improved cowpea in northern Nigeria. Agricultural
Economics, 35(2), 203-211.
Amanor-Boadu, V. (2016, March). Poverty and Expenditure in Northern Ghana in 2015
(Discussing Progress: PBS 2015). Presentation at the 2016 IP Meeting, Accra, Ghana.
Anselin, L. (2001). Spatial econometrics. A companion to theoretical econometrics, 310330.
Awuni, G. & Reynolds, D. (2016). Two (2) Year Activity Review Summary Report of SMART
Farm In Ghana (2014 – 2015). Mississippi State, MS: Feed the Future Innovation Lab for
Soybean Value Chain Research (Soybean Innovation Lab, SIL).
Besley, T., & Case, A. (1993). Modeling technology adoption in developing countries. The
American Economic Review, 83(2), 396-402.
Chirwa, E. W. (2005). Adoption of fertiliser and hybrid seeds by smallholder maize farmers in
Southern Malawi. Development Southern Africa, 22(1), 1-12.

80
Conley, T., & Udry, C. (2001). Social learning through networks: The adoption of new
agricultural technologies in Ghana. American Journal of Agricultural Economics, 83(3), 668-
673.
Conley, T. G., & Udry, C. R. (2010). Learning about a new technology: Pineapple in Ghana. The
American Economic Review, 100(1), 35-69.
Damania, R., Berg, C., Russ, J., Barra, A. F., Nash, J., & Ali, R. (2016). Agricultural technology
choice and transport. American Journal of Agricultural Economics, aav073.
Dogbe, W., Etwire, P. M., Martey, E., Etwire, J. C., Baba, I. I., & Siise, A. (2013). Economics of
Soybean Production: Evidence from Saboba and Chereponi Districts of Northern Region of
Ghana. Journal of Agricultural Science, 5(12), 38.
Doss, C. R. (2001). Designing agricultural technology for African women farmers: Lessons from
25 years of experience. World development, 29(12), 2075-2092.
Doss, C. R. (2006). Analyzing technology adoption using microstudies: limitations, challenges,
and opportunities for improvement. Agricultural Economics, 34(3), 207-219.
Drukker, D. M., Peng, H., Prucha, I. R., & Raciborski, R. (2013). Creating and managing spatial-
weighting matrices with the spmat command. Stata Journal, 13(2), 242-286.
Drukker, D. M., Prucha, I. R., & Raciborski, R. (2011). A command for estimating spatial-
autoregressive models with spatial-autoregressive disturbances and additional endogenous
variables. Econometric Reviews, 32, 686-733.
Edirisinghe, J. C., & Holloway, G. J. (2015). Crossbred cow adoption and its correlates:
Countable adoption specification search in Sri Lanka's small holder dairy sector. Agricultural
Economics, 46(S1), 13-28.
Etwire, P. M., Martey, E., & Dogbe, W. (2013). Technical efficiency of soybean farms and its
determinants in Saboba and Chereponi Districts of Northern Ghana: a stochastic frontier
approach. Sustainable Agriculture Research, 2(4), 106.
Feder, G., Just, R. E., & Zilberman, D. (1985). Adoption of agricultural innovations in
developing countries: A survey. Economic development and cultural change, 33(2), 255-298.

81
Gleditsch, K. S., Ward, M. D., & Kristian, S. (2007). An introduction to spatial regression
models in the social sciences. Duke University.
Goldsmith, P. (2014, October). The Economics of Tropical Soybean. Presented at the Feed the
Future Innovation Lab for Soybean Value Chain Research Tropical Soybean in Development
Workshop, Washington, D.C. Presentation retrieved from
http://soybeaninnovationlab.illinois.edu/sites/soybeaninnovationlab.illinois.edu/files/Peter%20G
oldsmith.pdf
Goldsmith, P. (2017, March). Soybean, a New Technology for Development. Presented at the
University of Illinois’ Center for African Studies Brown Bag Series, Champaign, IL.
Presentation retrieved from
http://soybeaninnovationlab.illinois.edu/sites/soybeaninnovationlab.illinois.edu/files/CAS%20Pr
esentation.pdf
Goldsmith, P., & Gow, H. (2005). Strategic positioning under agricultural structural change: A
critique of long jump co-operative ventures. International Food and Agribusiness Management
Review, 8(2), 1-21.
Government of Ghana. (2017). Upper West Region. Accra, Ghana: Government of Ghana
Official Portal. Retrieved from http://www.ghana.gov.gh/index.php/about-ghana/regions/upper-
west
Herath, P. H. M. U., & Takeya, H. (2003). Factors determining intercropping by rubber
smallholders in Sri Lanka: a logit analysis. Agricultural Economics, 29(2), 159-168.
Idiong, I. C. (2007). Estimation of farm level technical efficiency in smallscale swamp rice
production in cross river state of Nigeria: a stochastic frontier approach. World Journal of
Agricultural Sciences, 3(5), 653-658.
Immink, M. D., & Alarcon, J. A. (1993). Household income, food availability, and commercial
crop production by smallholder farmers in the western highlands of Guatemala. Economic
Development and Cultural Change, 41(2), 319-342.
Maertens, A., & Barrett, C. B. (2012). Measuring social networks' effects on agricultural
technology adoption. American Journal of Agricultural Economics, aas049.

82
Masuda, T., & Goldsmith, P. D. (2009). World soybean production: area harvested, yield, and
long-term projections. International Food and Agribusiness Management Review, 12(4), 143-
162.
Masuda, T., & Goldsmith, P. D. (2012). China's meat and egg production and soybean meal
demand for feed: An elasticity analysis and long-term projections. International Food and
Agribusiness Management Review, 15(3), 33-54.
Mbanya, W. (2011). Assessment of the Constraints in Soybean Production: A Case of Northern
Region, Ghana. Journal of Developments in Sustainable Agriculture, 6(2), 199-214.
Mennonite Economic Development Associates (MEDA) – Greater Rural Opportunities for
Women (GROW). (2015). Soybean Value Chain Analysis Mid-Project Report. Wa, Ghana:
MEDA-GROW Value Chain Unit.
Muhammed, A.R., Baker, J. (2015). Greater Rural Opportunities for Women (GROW) Project,
Ghana Annual Survey Report 2015. Waterloo, ON, Canada: Mennonite Economic
Development Associates (MEDA).
Muzari, W., Gatsi, W., & Muvhunzi, S. (2012). The impacts of technology adoption on
smallholder agricultural productivity in Sub-Saharan Africa: A review. Journal of Sustainable
Development, 5(8), 69.
Osmani, M. A. G., Islam, M. K., Ghosh, B. C., & Hossain, M. E. (2014). Commercialization of
smallholder farmers and its welfare outcomes: Evidence from Durgapur Upazila of Rajshahi
District, Bangladesh. Journal of World Economic Research, 3(6), 119-126.
Ragsdale, R. & Read-Wahidi, M. (2015). Gender Equity & Soybean Uptake in Northern Ghana
WEAI+ Preliminary Results. Starkville, MS: Social Science Research Center, Mississippi State
University. Retrieved from
http://soybeaninnovationlab.illinois.edu/sites/soybeaninnovationlab.illinois.edu/files/KR.MRW_
WEAI%2BGH%20YR1_Prelim%20Report_FINAL_011816.pdf
Staal, S. J., Baltenweck, I., Waithaka, M. M., DeWolff, T., & Njoroge, L. (2002). Location and
uptake: integrated household and GIS analysis of technology adoption and land use, with
application to smallholder dairy farms in Kenya. Agricultural Economics, 27(3), 295-315.

83
Tripp, R., & Mensah-Bonsu, A. (2013). Ghana's commercial seed sector: New incentives or
continued complacency? (No. 32). International Food Policy Research Institute (IFPRI).
United States Agency for International Development (USAID). (2015). Food Security, Nutrition
and women and Children’s Nutrition in Northern Ghana (Discussing Progress: PBS 2015).
Accra, Ghana: USAID.
United States Agency for International Development (USAID). (2015). Poverty and Nutrition in
Northern Ghana: 2015 Population-based Survey Results (Infographic Summary). Accra,
Ghana: USAID.
United States Agency for International Development (USAID). (2015). Women’s Empowerment
in Agriculture and Women’s Anthropometric Measurements (Discussing Progress: PBS 2015,
Interim PBS 2015 Results). Accra, Ghana: USAID.
Ward, P. S., & Pede, V. O. (2015). Capturing social network effects in technology adoption: the
spatial diffusion of hybrid rice in Bangladesh. Australian Journal of Agricultural and Resource
Economics, 59(2), 225-241.
Ward, P. S., Ortega, D. L., Spielman, D. J., & Singh, V. (2014). Heterogeneous demand for
drought-tolerant rice: Evidence from Bihar, India. World development, 64, 125-139.
Wollni, M., & Andersson, C. (2014). Spatial patterns of organic agriculture adoption: Evidence
from Honduras. Ecological Economics, 97, 120-128.
Villano, R., Fleming, E., & Moss, J. (2016). Spatial Econometric Analysis: Potential
Contribution to the Economic Analysis of Smallholder Development. In Causal Inference in
Econometrics (pp. 29-55). Springer International Publishing.