determinants of shadow economy: theory and evidence · determinants of shadow economy: theory and...
TRANSCRIPT
Determinants of Shadow Economy: Theoryand Evidence
Vesa Kanniainen∗ Jenni Paakkonen†
Friedrich Schneider‡
October 11, 2004
Abstract
The goal of this paper is to develop a theory of the mechanismand determinants of why shadow economies develop and test thesehypotheses using data on highly developed 21 OECD countries from1989/90 - 2002/03. The econometric results provide support for theproposed causes for shadow economies; e.g. taxation and social se-curity variables are found to be significant as well as the tax moralvariable. Using the DYMIMIC statistical procedure the average sizeof the shadow economy (in % of official GDP) over 2003 of 21 highlydeveloped OECD countries is 16.4% for 2002/03.
Key words: shadow economy, DYMIMIC, determinants of shadoweconomy, theoretical approach
JEL Classification: D43, D69, E41, H26, L13
1 Introduction
As underground economic activities (including shadow economy ones) are afact of life around the world, most societies attempt to control these activitiesthrough various measures, like punishment, prostitution, economic growthand/or education. Gathering theoretical knowledge about and statistics who
∗Department of Economics, FIN-00014, University of Helsinki, Finland and CESifo,e-mail [email protected]
†Department of Economics, FIN-00014, University of Helsinki, Finland, [email protected]
‡Johannes Kepler University of Linz, E-mail: [email protected]
1

is engaged in underground activities. This theoretical and empirical knowl-edge about the frequencies with these activities are occurring and the mag-nitude of them is crucial for making effective and efficient (public) decisionsregarding the allocations of a country’s resources in this area. Unfortunately,it is very difficult to develop a good theoretical model and to get empirical ac-curate information about these underground (or as a subset shadow economy)activities on the goods and labour market, because all individuals engaged inthese activities wish not to be identified. Hence, the major goal of this paperis to overcome these difficulties and in a first attempt to develop a theoryof the mechanisms and determinants of why shadow economies develop andprovide some empirical tests about the theoretically derived hypotheses.
The existing research has successfully established that shadow economieswith illicit economic activities exist not only in non-industrialized countriesbut are significant also in western economies.1 The earlier studies have an-alyzed in particularly two issues, i.e. payment transactions and measuresof the magnitude of underground economic activities. Our paper providesa complementary study. It develops a theory of the mechanisms and deter-minants of why shadow economies develop and tests these hypotheses usingdata on OECD countries and DYMIMIC estimation method.
Some markets are prone to develop shadow transactions for the purpose oftax evasion especially if the government is viewed as a predatory revenue max-imizer. Abstaining from participation of financing the public goods, thosewho visit the illicit market exert a negative fiscal externality on the honestconsumers. However, people have intrinsic moral sentiments, with preferencefor obeying inherited social norms and disapproving deviants. People carewhat other people think of them and they are subject to self-esteem. Moralfeelings of social disapproval tend to arise from free-riding by the deviants.2
Our paper raises the question what determines the borderline betweenlegal and shadow economies. It explores to what extent moral sentimentscan control shadow activities. It therefore introduces preferences for moralstandards, determination of morality as social capital and sustainability ofsocial norms when taxes can be evaded by visiting illicit markets. In themodel, we consider the commodity tax in allocating consumers between thelegal and illicit sectors. The paper indicates that illegal transactions are animportant determinant of cash holdings despite the fact that more efficientelectronic payment system are at hand.3
1Schneider and Enste (2002).2Fehr and Gachter (Nature 2002, 415, 137-140) indicate that people are willing to
invest substantial resources in public goods, as long as they have the possibility to inflictpunishment on those who free ride on the co-operation.
3Using cash for payments of illegal anonymous transactions appears as an important
2

In our model, morality is viewed as a network good.4 Apart from con-sumption opportunities, people value the social approval attached to their be-havior within the social network sharing the same moral values. By implica-tion, deviants subject themselves to the risk of being detected and becomingsocially stigmatized. Detection is, however, probabilistic and by anonymoustransactions immoral people may mimic the moral ones. Morality operateslike a particular form of social capital.5 In our model, it is determined en-dogenously as the share of people who choose to commit to honest behavior.6
The model suggests that high tax rate, low expected cost of punishmentand low relative cost of production shape the industry equilibrium leadingto contraction of the legal sector and a boost in the shadow economy. Toqualify, rising tax rate tends to expand the shadow economy through the taxevasion effect. There is an associated public goods effect. Moral sentiments interms of self-esteem and disapproval of deviations from social norms operateas mechanisms which limit the shadow market activities.
The econometric and empirical results of this paper demonstrate that forthe 21 highly developed OECD countries, the theoretical considerations canbe confirmed: The tax and social security burden are the driving forces of theshadow economy, closely followed by the status of the official economy andby the tax morale variable. Moreover, we observe quite a dynamic increaseof the shadow economy in the 90s and for a part of the OECD countries astaggering or slightly decreasing shadow economy since the end of the 90s.
Our paper is structured as follows. After surveying the previous studies
motive for why people hold cash in spite of the recent innovations in the payment system.Cash payments are convenient for those who seek to hide their motives. The marketsfor prostitution, for example, are presumably predominantly based on the use of cash,reducing the enforceability of within family contracts. Modern brand products like Nikeor Adidas in sportswear and shoes or Prada on ladies fashion are actively copied andmarketed in pirate products. With high legal prices of CDs, people have developed abilityto copy music freely from internet. In construction, illegal labor is employed with the aimof tax evasion. Many private services are delivered without receipts. In most economies,there are also well-functioning secondary markets for stolen durable goods. Moreover, therise of terrorism is largely financed by illegal money.
4Our model highlights the conflict between opportunistic private incentives and col-lective values and norms. Some studies in the sociological literature explain crimes asan outcome of evolutionaly interplay between productive and expropriative strategies, cf.Cohen and Machalek (1988) and Vila and Cohen (1993).
5The reasons for non-opportunistic behavior have been extensively discussed by biolo-gists. Hamilton (1964) introduced the notion of kin selection and Trivers (1971) a moregeneral view of reciprocal altruism. Wilson (1975) represents a comprehensive document ofreciprocal behavior among animals extended to human behavior by Binmore (1998). Frank(1988) argued convincingly that the ability of people to behave non-opportunistically servesas a helpful commitment device facilitating beneficial relations like joint ventures.
6Cf. Frank (1987) for a pioneering analysis of honesty and dishonesty.
3

in section 2, we develop our theoretical model in section 3. The model is es-timated in section 4 which reports the empirical results. Section 5 concludes.
2 Previous Studies
Shadow Economy, its Magnitude and Payment Systems Shadoweconomy arises exclusively from government intervention, i.e. regulation andtaxation. Such a policy intervention has side effects. Many empirical stud-ies show that the size of the shadow economy has been most dramatic inthe planned socialistic economies with maximum governmental intervention7.However, Giles (1999) suggests that the size of the shadow economy has beengrowing over the past two or three decades in almost all of the countries forwhich comparative data have been assembled. According to Giles, growthin the underground economy is associated with increases in the actual orperceived tax burden but also with the degree of economic regulation. Theview is shared by Thomas (1999) who hints that a growing shadow economymay be an indication of over-taxation and over-regulation. He also suggeststhat at least some part of the shadow economy may be social security fraud,making unemployment less bad as it looks.
As early as in 1958, Cagan proposed that people prefer to use cash inillegal economy, especially in black markets and for tax evasion. Modernpaymet systems have sought to challenge cash, but none has been able toshake the prominent role of money. Thus, Hancock and Humphrey (1998)conclude that factors other than the simple opportunity cost must play pri-mary role in determining holdings and the use of cash. After an extensivesurvey Drehman et al. (2002) conclude that ’bad behavior’ creates a demandfor anonymous means of payment which for now is the currency.
Some useful figures for understanding the magnitude of illegal demandfor cash are provided, for example, by Rogoff (1998). Accordingly, half ofthe currency holdings in the OECD countries are in the domestic informaleconomy. It appears that informal economy already is the main holder ofcash. Humphrey et al. (2000) suggest, that the technological progress willfurther distort the demand as the share of the legal use will decrease and theshare of illegal use will increase. Thus the authorities will face an unpleasantmoral dilemma, as the seigniorage revenues are likely to be due to providingthe means of payment for illegal activities, for example, tax evasion!
7For recent survey and for methodological review see Schneider (2004).
4

Links to Policy There are several conclusions that have been justified inthe light of the above results. Schneider (2000) gives a concerned note bysuggesting that under a growing (or substantial) shadow economy, policy isbased on mistaken official indicators. In addition, he suggests that a growingshadow economy attracts workers to work in shadow economy and to workless in the official economy. Giles and Caragata (1999) are concerned thatunpaid tax in hidden economy or loopholes allowing abusive avoidance in theexisting tax system create a deadweight loss on the economy. These will, inturn, undermine taxation equity by shifting tax burden in the direction ofhonest, socially responsible individuals and corporations. Accordingly, partof the hidden economy is learned response to changing opportunities andconstraints in fiscal policy, but on the other hand, there is a threshold levelof underground activity that will sustain.
Theoretical work Theoretical attempts to analyze the shadow econ-omy include Cowell (1989) who asks how far should taxation authoritiesgo in pursuit of the missing income. In a paper which is closest to ours,Acemoglu (1994) analyzes the pecuniary and non-pecuniary aspects of thereward structure on the allocation of talent across different activities withdivergent private and social returns. The non-pecuniary aspects of rewardstructure consist of social status and prestige received for different activities.For example, the prestige and the status are influenced by the establishednorms and role models and reference groups8.
The determinants and effects of the informal sector are studied in anendogenous growth model by Loayza (1996). Using data on Latin Americancountries it is found that the informal sector negatively affects growth andits size depends on tax burden, labor-market restrictions and governmentinstitutions. Johnson et al. (1997) propose that supply of public goods tendsto result in increasing returns in private firms, leading to multiple equilibria.Data on transition economies suggests that market-supporting institutionsare critical for a successful transition. Friedman et al. (2000) suggest thatthe incentive to go underground to dodge higher tax rates is outweighed bythe benefits of remaining official.
Camera (2001) analyzes what would happen if authorities promote theuse of e-purse and limit the use of currency. Accordingly, an equilibriumexists with no illegal production if monitoring is sufficiently extensive andmoney supply is moderate. When enforcement is not too extensive, how-ever, there are monetary equilibria where legal and illicit production coexist.Accordingly, the results provide a rationale for limiting the amount of cash
8’Bad behavior’ may have less damaging stigma when it is more widespread.
5

in circulation. Nonetheless, using currency as an exogenous discipline onillicit undertakings may have unintended consequences, such as depressingall trading activities and decreasing welfare. Dabla-Norris and Feltenstein(2003) apply an intertemporal general equilibrium model to explore the linkbetween tax rates, access to credit and the size of the underground economy.Simulation results for Pakistan demonstrate that entry into undergroundeconomy can have a cyclical nature. Moreover, the share of undergroundactivity will decline over time and sectors gradually move back into legaleconomy. With low taxes, there is no underground economy, but due to highbudget and trade deficit the low tax regime is not sustainable over time.Thus an economy may have to accept some underground activity as part ofan otherwise acceptable tax program.
Davidson, Martin and Wilson (2003) suggest that shadow transactionsmay increase welfare. They argue in the experience goods framework thatby allowing agents to self-select into the black market, the government cantarget tax breaks to transactions involving low-quality goods. Finally, werefer to Kanniainen and Paakkonen (2004) which provides the starting pointfor the model we introduce below.
3 Model
3.1 Market Solution Without Moral Sentiments: Fis-cal Externality
We consider a shadow economy arising from tax evasion by consumers.Thereby, it reduces resources available for production of public goods. Ourresearch strategy is to analyze first the industry equilibrium when one sectoris taxed and the other is not. Subsequently, we introduce moral standardsto examine in which way they control the development of shadow economy.
Anonymous Visits to Shadow Economy In the real world, shadowtransactions take a variety of forms (Schneider and Enste (2002)), includinghousehold production, neighborhood help, sales of stolen products, imperfectreporting by firms and self-employed, gambling and drugs. It is not feasibleto model all such transactions within a single paper. Instead, we formulatea model of an ”industry” consisting of legal and illicit producer or servicesor goods, resorting to Kanniainen and Paakkonen (2004).
We thus consider a market with a product brand where a producer hasmarket power in pricing. The product is assumed to have some prestige
6

value, determining the basic willingness to pay.9 In such markets, the entrycost is non-trivial because of the nature of the product or because of barriersto entry. The products are subject to a commodity tax, τ > 0.10 Because ofthe market power, the producer is able to shift part of the tax to consumers.The two elements, pricing power and the tax wedge in consumer price createan incentive for illicit production. To avoid social punishment, consumerstry to visit the illicit market anonymously.11
Consumers Consumers are assumed to have preferences over goods andsocial approval. By their intrinsic preferences, people are assumed to be allalike. They are egoists in the sense of utility maximizers. But they also carefor what other people think of them.12 Thus, they have subjective preferenceboth for their self-esteem and they care about the expected social punishmentof illegal actions.13 Thus, morality becomes a network phenomenon. However,for tax evasion reasons, it may become profitable to deviate from the normof buying only legal products. By anonymous transactions, deviants tryto mimic the legal consumers, though risking themselves to social stigma.Hiding deviations from an established social norm becomes attractive, ashiding may help to maintain the status of an honest person.
We first build the market model without moral sentiments. We assumethat consumers differ with respect to their willingness to pay for the prestigeof the product brand. We assume that there is continuum of consumers withmass one. They can buy a private product in the legal or illicit market.We denote the producer prices by pl, pi. The marginal utility from buying
9Alternatively, we could think of paternalistically regulated industries, like casinos,state monopolies in liquor production etc.
10The possibilities to avoid the commodity tax by imperfect reporting may depend onthe particular product. This observation seems to support the view that the optimalcommodity tax is non-uniform, i.e. products which allow for easy tax evation should betaxed less heavily. One topical example is the Finnish (and Swedish) tax reduction onstrong liqeur, aiming at controlling the (legal and illicit) imports.
11To clarify, when we talk about an illicit producer, this should not be understood torefer a registered firm but to an activity which is rival to legal activity. We also notice thatwe abstract from the possibility that the legal firm operates partly like an illicit producersin the shadow economy. Though such an activity is common in practice, we leave it out ifonly to keep the model simple enough.
12Such a subjective status effect is well-known in psychology, cf. Singh-Manoux, Adlerand Marmot (2003). In biology, we refer to Ridley (1996). In economics, Fershtman, Weissand Hvide (2001) have studied status effects.
13Binmore (1998) has shown that it is rational for people to commit to social normsand social contracts as long as the commitment gains exceed the short-term losses fromdeviating. Morality arises in the equilibrium of a repeated game as a social contract.
7
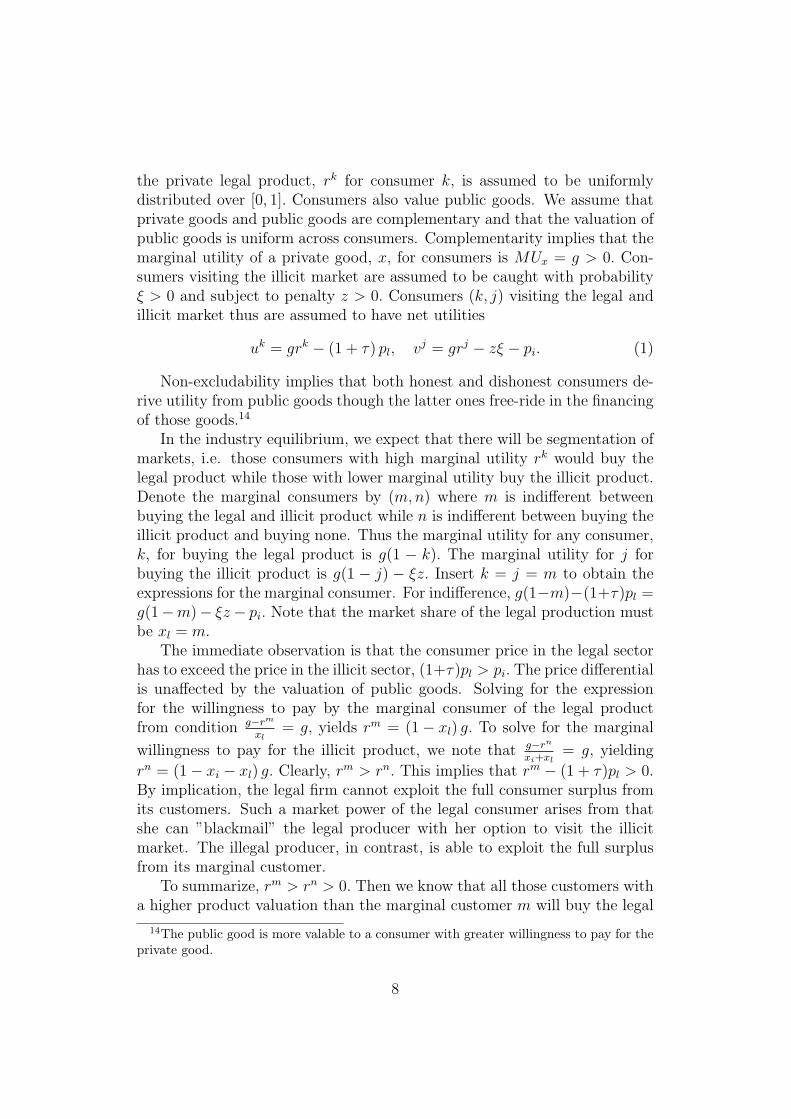
the private legal product, rk for consumer k, is assumed to be uniformlydistributed over [0, 1]. Consumers also value public goods. We assume thatprivate goods and public goods are complementary and that the valuation ofpublic goods is uniform across consumers. Complementarity implies that themarginal utility of a private good, x, for consumers is MUx = g > 0. Con-sumers visiting the illicit market are assumed to be caught with probabilityξ > 0 and subject to penalty z > 0. Consumers (k, j) visiting the legal andillicit market thus are assumed to have net utilities
uk = grk − (1 + τ) pl, vj = grj − zξ − pi. (1)
Non-excludability implies that both honest and dishonest consumers de-rive utility from public goods though the latter ones free-ride in the financingof those goods.14
In the industry equilibrium, we expect that there will be segmentation ofmarkets, i.e. those consumers with high marginal utility rk would buy thelegal product while those with lower marginal utility buy the illicit product.Denote the marginal consumers by (m,n) where m is indifferent betweenbuying the legal and illicit product while n is indifferent between buying theillicit product and buying none. Thus the marginal utility for any consumer,k, for buying the legal product is g(1 − k). The marginal utility for j forbuying the illicit product is g(1 − j) − ξz. Insert k = j = m to obtain theexpressions for the marginal consumer. For indifference, g(1−m)−(1+τ)pl =g(1−m)− ξz − pi. Note that the market share of the legal production mustbe xl = m.
The immediate observation is that the consumer price in the legal sectorhas to exceed the price in the illicit sector, (1+τ)pl > pi. The price differentialis unaffected by the valuation of public goods. Solving for the expressionfor the willingness to pay by the marginal consumer of the legal productfrom condition g−rm
xl= g, yields rm = (1− xl) g. To solve for the marginal
willingness to pay for the illicit product, we note that g−rn
xi+xl= g, yielding
rn = (1− xi − xl) g. Clearly, rm > rn. This implies that rm − (1 + τ)pl > 0.By implication, the legal firm cannot exploit the full consumer surplus fromits customers. Such a market power of the legal consumer arises from thatshe can ”blackmail” the legal producer with her option to visit the illicitmarket. The illegal producer, in contrast, is able to exploit the full surplusfrom its marginal customer.
To summarize, rm > rn > 0. Then we know that all those customers witha higher product valuation than the marginal customer m will buy the legal
14The public good is more valable to a consumer with greater willingness to pay for theprivate good.
8

product. The other active customers buy the illicit product. The third groupbuys nothing.
Solving for the price differential
(1 + τ)pl − pi = ξz. (2)
What this condition suggests is that a consumer is indifferent betweenvisiting the legal and illicit market if the risk of getting caught and penalizedis fully compensated by the price differential. For the marginal consumer n,the net utility from buying the illicit product is zero, g(1− n)− ξz − pi = 0.Noting that the n is the last buyer, i.e. n = xl + xi, her net utility is(1 − xl − xi)g − ξz − pi = 0. Thus, the valuation of public goods raises theprice of the illicit product. Through the first arbitrage condition, this is thenreflected in the price of the legal product, too.
The total production thus satisfies xl + xi = 1 − ξz+pi
g. Solving for the
prices pi = (1− xl − xi)g − zξ, pl = (1−xl−xi)g1+τ
.
Profits Market equilibrium can now be analyzed in terms of competitionwith differentiated products. The legal firm can take opportunistically ad-vantage of honest consumers. On the other hand, the illicit market intensifiescompetition. This results in fewer consumers in the legal market, exerting apressure on the legal price.15 Consumers buy the product with greater netutility.16 Under Cournot-competition in differentiated products, the behaviorof firms obeys
maxxl
(pl − cl)xl, maxxi
( pi − ci)xi, (3)
where cl, ci > 0 are the production costs.17
Nash equilibrium In Nash equilibrium, market shares satisfy
xl =g + zξ + ci − 2(1 + τ)cl
3g(4)
xi =g + (1 + τ)cl − 2zξ − 2ci
3g. (5)
15The firm producing in the legal market obviously has an incentive to capture theconsumers also in the illicit market. An example is the illegal production of pirate productsof cigarettes in Eastern European countries. The legal firm typically then issues licencesto combat the illegal pirate production.
16One can extend the analysis to quality uncertainty in the illicit market. One of therecent examples is the Estonian vodka. When bought in illicit markets, it has killed someconsumers.
17The decision to become a producer in the illicit market could be analyzed in terms ofoccupational choice. Such a choice would also be subject to moral considerations which,however, will not be explicitly discussed in the current paper.
9

Similarly, prices are
pl =g + (1 + τ)cl + zξ + ci
3 (1 + τ)(6)
pi =g − 2zξ + ci + (1 + τ)cl
3(7)
We find that the codition for exitence of shadow market in the industryequilibrium is xi = g+(1+τ)cl−2zξ−2ci
3g> 0. High tax rate and low expected cost
of punishment and low relative cost of production support the developmentof shadow markets. In particular, increased tax on the legal product shakesthe industry equilibrium leading to contraction of the legal sector and a boostin the shadow economy.
However, when tax revenue is used to finance public goods, these naturalresults no longer hold as their validity is limited to the ceteris paribus case.The role of public goods in the determination of the limits to shadow economythus deserves attention. Solving
∂xl
∂g=
1
g(1
3− xl),
∂xi
∂g=
1
g(1
3− xi). (8)
With large market shares (xl > 13, xi > 1
3), an increase in the supply of
public goods reduces both the size of the legal sector and the illicit sector. Itis only when the market shares are small that the complementarity effect ofpublic and private goods raises output when more public goods become avail-able. This somewhat surprising finding follows from the profit maximizingbehavior of producers. Realizing that the willingness to pay by consumersfor the private products has increased with more public goods available, pro-ducers can raise their profits by actually cutting the production and charginghigher prices.
3.2 Balanced Budget Requirement
Suppose now that the public goods available are constrained by the tax rev-enue generated by taxation of the legal product. This amounts to consideringthe industry equilibrium subject to the constraint
g = τplxl. (9)
With a given tax rate, such a constraint endogenizes the supply of publicgoods in the economy.18 We now have five equations to determine the five
18We consider below the case where the tax rate is determined by revenue maximizinggovernment.
10

variables (xl, xi, pl, pi, g) in the industry equilibrium. Dishonest people un-derstand that by free-riding in financing the public goods production theyalso suffer if the tax revenue is reduced and less public goods are available.Does this understanding restrict the market share of the shadow economy?What does the uncoordinated equilibrium look like?
Suppose that there is a marginal increase in the tax rate τ. What hap-pens to the shadow markets? From the solution above, the new industryequilibrium satisfies
dxi
dτ=
cl
3g+
(1/3− xi
g
) (dg
dτ
). (10)
We find that if the tax rate is increased, there are two effects. The first onedefinitively tends to make the shadow economy larger. This can be called thetax evasion effect and its magnitude is measured by cl/3g. High productioncost in the legal sector makes the tax evasion effect large, while large supply ofpublic goods has a negative impact on the expansion of the shadow economy.These effects follow from production decisions by firms. There is a secondaryeffect which depends on the impact of tax rate on tax revenue and henceon supply of public goods, dg
dτand on the initial market share of the shadow
economy, xi. It is appropriate to call this the public goods effect. Totallydifferentiating the budget constraint dg = dτ (plxl) + τ (dplxl + pldxl) andinserting the market reactions, we find
dg
dτ=
11+τ
(plxl − τcl
3
(xl + 2(1+τ)cl
g
))1− 1
3τ
1+τxl + τ
3zξ+ci−2(1+τ)cl
g2 pl
.
The denominator is always positive because 13
τ(1+τ)
xl < 1. The sign of
numerator is, however, ambiguous. Despite its sign, 1/3−xi
gis positive in
when shadow economy is small and negative when it is large. The publicgoods effect therefore generates accelerating or decelerating mechanisms onthe expansion of the shadow economy when the tax rate is increased. Thosemechanisms depend on the changed possibility of the legal firm to makeprofit when the tax rate is greater. Consider s small initial shadow economy.A sharp decline in profit plxl reduces access to public goods, slowing downexpansion of the shadow economy. A minor decline in profit, however, makestax revenue and hence supply of public goods sustainable. Consumers canmove to the shadow economy with less concern of what happens to publicgoods. When the shadow economy has reached more consumers, the signof (1/3− xi) changes, the accelarating secondary effect disappears and theprofit effect starts to decelerate. Despite such dynamic mechanisms, the
11

economy settles down in an equilibrium with positive tax revenue and positivesupply of public goods as long as the profit of the legal firm, plxl, does notvanish.
From a dynamic perspective, we have the following result: Rising tax ratetends to expand the shadow economy through the tax evasion effect. Thereis an associated public goods effect under the requirement of balanced bud-get, which accelerates or decelerates the expansion of the shadow economy,depending on the possibility of the legal firm to sustain profitability whenthe tax rate is raised.
3.3 Moral Norms in Control of Illicit Transactions
Morality as a Group Phenomenon We now introduce two mechanismsto control illicit transactions. First, we introduce moral sentiments in thevalues by consumers. Second, we introduce the cost of holding cash whichturns out to operate analogously to the tax on legal transactions.
In addition to their basic willingness to pay, consumers are now assumedalso to value self-esteem. Moreover, they are sensitive to social disapproval.In other words, they care much of what they think of themselves and what theother people think of them.19 The strength of self-esteem effect is measuredby parameter s > 0 and it is uniform across people. Only deviants are willingto give it up.
The moral sentiments of, say poor and rich are thus equal and indepen-dent of, their incomes. The total marginal utility of consumers buying a legalproduct is then grk + s and is uniformly distributed over [s, g + s]. Alterna-tively, consumers can anonymously visit the illicit market with catching-upprobability ξ. If caught, they suffer from social disapproval cost, z > 0.The model of the previous section is now extended in that the disapprovalis assumed to be expressed by those people who adhere to the social normof visiting the legal market only. The disapproval effect thereby becomes agroup phenomenon, eroding with the contraction of the legal market.20 Interms of consumer valuation, the legal product thus is valued at grk whilethe illegal product is valued at grk − xl∆, where ∆ is the expected social
19Existence of moral sentiments has been well-known in economics ever since AdamSmith (1966) and studied more recently by Frank (1987, 1988). The origin of thosesentiments has been traced both to genetic forces in evolutionary biology or to memes,cultural genes, cf. Dawkins (1976).
20There is no particular need to introduce any restriction on whether it is the self-esteemor the social disapproval which has greater weight in people’s valuation. The model allowsfor both cases.
12

punishment, ∆ = E[P ] with
P =
z with probability ξ0 with probability 1− ξ.
We consider fulfilled expectations equilibrium. We assume further thatpayments in the illicit market are made by cash. More efficient means ofpayments dominate in the legal market. There is thus an extra cost of makingpayments in the illicit market in terms of the cost of holding cash. The costdifferential is denoted by γ > 0.It would be possible to interpret the model asa cash-in-advance variety with pi measuring the amount of cash demanded.
Consumers visiting the legal and illicit markets then have net utilities,
uk = grk + s− (1 + τ) pl, vj = grj − xlzξ − (1 + γ) pi. (11)
In our model, the mass of people will be endogenously distributed intomoral and immoral ones in terms of their behavior. In equilibrium peoplethus differ by their factual behavior. Moral (honest) and immoral (dishonest)behavior is endogenously determined and so is the strength of the socialdisapproval effect xlzξ. Morality as social capital is thus determined by themoral network, the expected relative size of the group of people expressingsocial disapproval in case of detection. The deviants21 are viewed as thosetaking the risk of being subject to stigma.22
Denote again the marginal consumers by (m,n) where m is indifferentbetween buying the legal and illicit product while n is indifferent betweenbuying the illicit product and buying none. Thus the marginal utility for anyconsumer, say k, for buying the legal product is g(1− k). Then the marginalutility for j for buying the illicit product is g(1− j)− ξzxl. For the marginalconsumer, her net marginal utilities have to be equal g(1−m)+s−(1+τ)pl =g(1−m)− ξzxl − (1 + γ)pi.
The price differential now satisfies (1 + τ)pl − (1 + γ)pi = s + ξzxl. Thus,both the self-esteem effect and the group effect of moral sentiments are re-flected in the price differential, as the legal producer can exploit them. Forthe marginal consumer n, the net utility from buying the illicit product iszero, (1− n)g− ξzxl − (1 + γ)pi = 0. Noting that the n is the last buyer, i.e.n = xl + xi, her net utility is (1− xl − xi)g − ξzxl − (1 + γ)pi = 0. The totalproduction thus satisfies xl + xi = g − ξzxl − (1 + γ)pi.
21The deviants might value positively other deviants, like members in gangs of sub-cultures. It would be easy to extend the model in this direction but for simplicity, weabstract from it.
22The stigma effect has previously been discussed in psychology by Puhl and Brownell(2003) or Schulze and Angermeyer (2003).
13
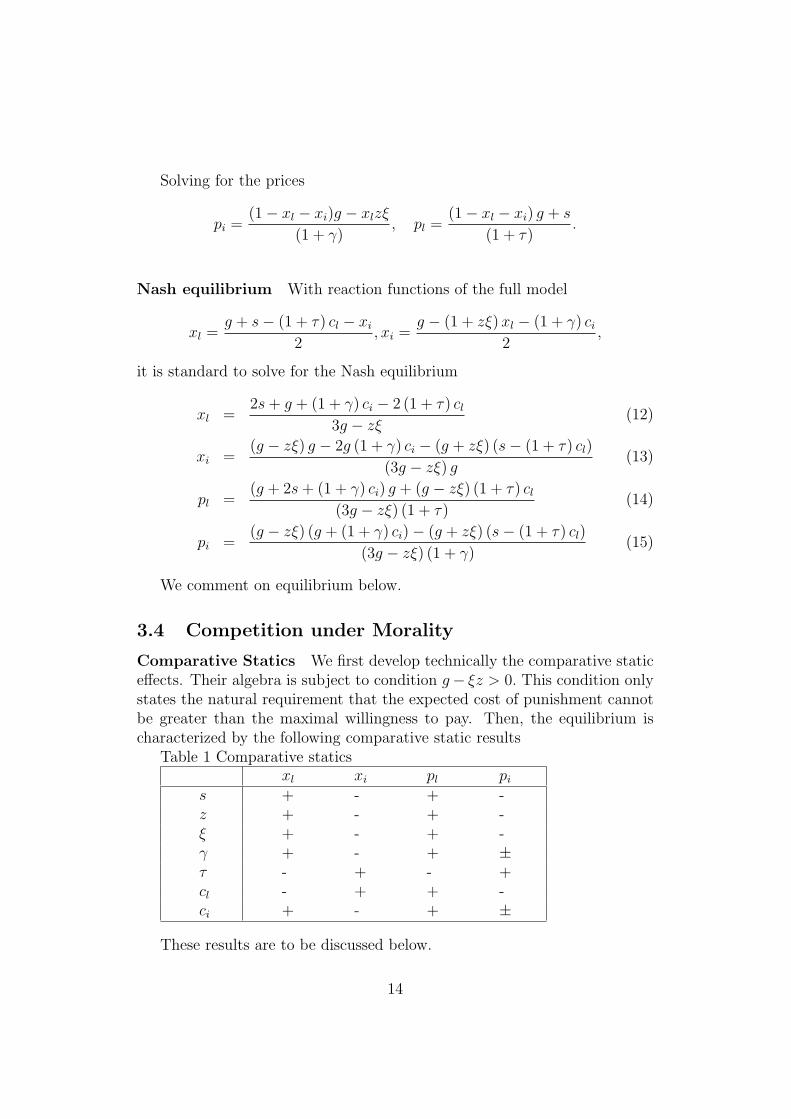
Solving for the prices
pi =(1− xl − xi)g − xlzξ
(1 + γ), pl =
(1− xl − xi) g + s
(1 + τ).
Nash equilibrium With reaction functions of the full model
xl =g + s− (1 + τ) cl − xi
2, xi =
g − (1 + zξ) xl − (1 + γ) ci
2,
it is standard to solve for the Nash equilibrium
xl =2s + g + (1 + γ) ci − 2 (1 + τ) cl
3g − zξ(12)
xi =(g − zξ) g − 2g (1 + γ) ci − (g + zξ) (s− (1 + τ) cl)
(3g − zξ) g(13)
pl =(g + 2s + (1 + γ) ci) g + (g − zξ) (1 + τ) cl
(3g − zξ) (1 + τ)(14)
pi =(g − zξ) (g + (1 + γ) ci)− (g + zξ) (s− (1 + τ) cl)
(3g − zξ) (1 + γ)(15)
We comment on equilibrium below.
3.4 Competition under Morality
Comparative Statics We first develop technically the comparative staticeffects. Their algebra is subject to condition g− ξz > 0. This condition onlystates the natural requirement that the expected cost of punishment cannotbe greater than the maximal willingness to pay. Then, the equilibrium ischaracterized by the following comparative static results
Table 1 Comparative staticsxl xi pl pi
s + - + -z + - + -ξ + - + -γ + - + ±τ - + - +cl - + + -ci + - + ±
These results are to be discussed below.
14

Self-Esteem as Conscience and Social Punishment Comparativestatic analysis shows the potentially powerful effects of self-esteem and therisk of being caught when deviating and being punished. Those effects tendto maintain the legal sector large. Evaluating we find ∂xl/∂s = 2
3g−zξ. This
is positive as 3g − ξz > 0. Self-esteem operates like a conscience for anindividual, supporting the legal production. The mechanism that the socialpunishment effect depends on the size of the legal sector is confirmed by theresult ∂xl/∂z = ξxl
3g−zξ.
The price effects are non-trivial. This results from that the self-esteemand social disapproval effects tend to be priced not only in the illicit product.Their effect also spills over to the legal market. It is easy to see that thenet surplus of the marginal consumer in the legal market is lower when heis subject to self-esteem. Insert the expressions for the quantity and pricefrom above in the surplus of the marginal consumer, g(1 − m) + s − (1 +τ)pl and develop the partial derivative with respect to s. This suggests thatwith consumers becoming more moral, they pay a price in terms of reducedsurplus. The marginal consumer is now the one who previously was a shadowmarket visitor. They keep the option of returning to the shadow market. Itis easy to see that the greater is the shadow market, the more valuable isthis option. Pricing of the shadow market producer, however, reduces thisoption value.23
3.5 Laffer Curve
The proponents of the view of government as revenue-maximizing Leviathanwhich uses resources inefficiently obviously welcome the shadow economy.24
This section studies the effects of illicit transactions on an economy’s Laffer-curve. Suppose that the tax revenue, T, is only partly allocated to publicgoods and that the government is able to extract a fraction, say 0 < y < 1for its own use. Then the resources available for financing public goods are
g = (1− y)T.
Assume that the government chooses the tax rate τ to maximize its taxrevenue collected from the sales of the legal firm, T = τplxl. We notice that
23Despite that the equilibrium outcome is characterized by stratification of consumers,the shadow markets do not perform a screening function of people between ”honest” and”dishonest” in our model, as all consumers are ex ante identical in terms their preferencesfor moral sentiments.
24Waste of tax revenue may result, for example, from influence or bribes by powerfullobbies leading to inefficient public spending. Grossman (2002) shows that if the tech-nology of predation is sufficiently effective in a society, then having a ”king” is better foreveryone even though the king maximizes the consumption of a ruling elite.
15

such a government profile, though a burden on tax paying honest consumers,is not necessarily detrimental to public goods production as an increase intax revenue means also an increase in the supply of public goods. Whatmatters is the magnitude of the fraction, y, which the government extracts.We assume that y is constant. Then maximization of (1− y)T is equivalentto maximizing T. Kanniainen and Paakkonen (2004) have shown that withlow (positive) tax rates, tax revenue (Laffer curve) is increasing in the taxrate. Thus, the Laffer curve is increasing in the tax rate when the tax rateis low. They also prove that the legal sector disappears at a certain tax rateand that the Laffer curve has a unique maximum.
As τ3 positively depends on public goods, self-esteem, the cost of legalproduction, the cost of holding money and negatively on the cost of legalproduction, so does presumably the tax rate τ ∗.
4 Econometric Analysis
4.1 Method
Causal models which incorporate latent variables have been utilized in esti-mating the size of the shadow economy by Giles (1999) and Schneider (2000)in cross-country data. The latent variables are not directly observable, buthave operational implications for relationships among observable variables.The observalbe variables appear as causes of the latent variables as well asindicators of latent variables. In this paper we apply MIMIC (multiple indi-cators, multiple causes) method introduced by Zellner (1970) and Joreskogand Goldberger (1975).
It is assumed that the latent variable y∗ is determined by a set of obser-valbe exogenous causes x1, ..., xk and a disturbance ε
y∗ = α1x1 + α2x2 + ... + αkxk + ε.
The latent variable, on the other hand, with disturbances u1, ..., um deter-mines the set of observable indicators y1, ..., ym
y1 = β1y∗ + u1, .... , ym = βmy∗ + um.
In vector-formy∗ = αx + ε, (16)
y = βy∗ + u, (17)
with E [εu′] = 0′, E (ε2 = σ2) and E (uu′) = Θ2.
16
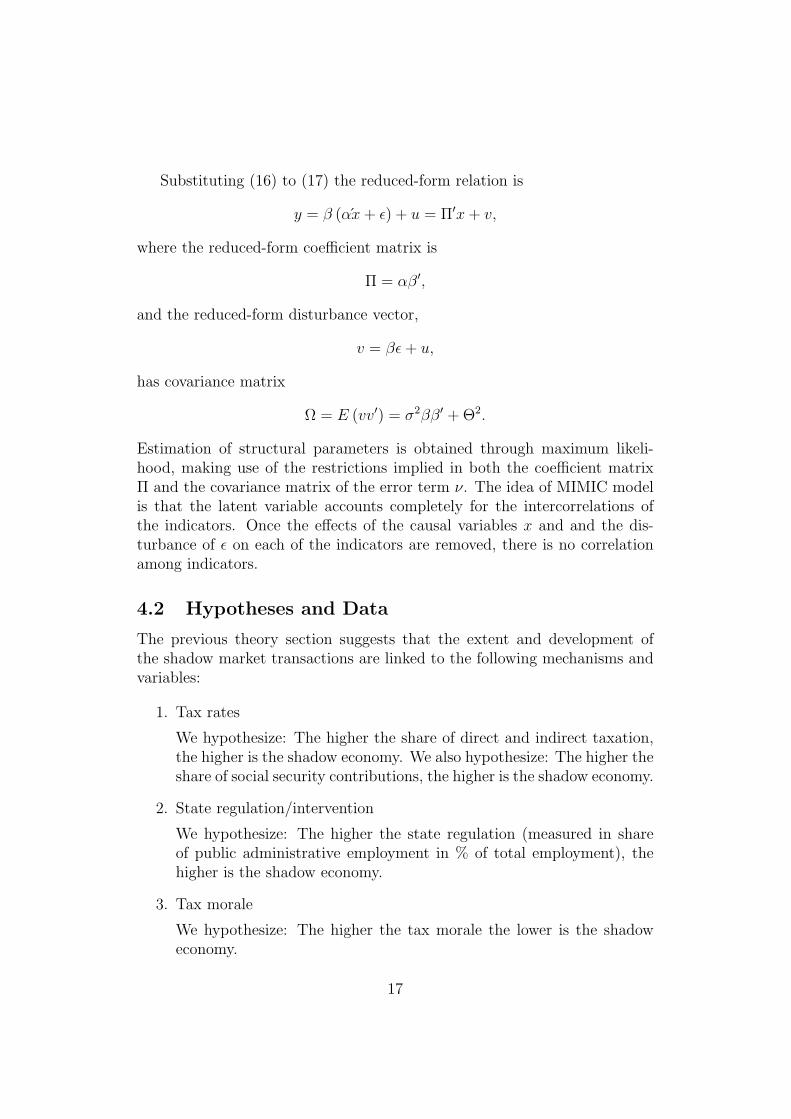
Substituting (16) to (17) the reduced-form relation is
y = β (αx + ε) + u = Π′x + v,
where the reduced-form coefficient matrix is
Π = αβ′,
and the reduced-form disturbance vector,
v = βε + u,
has covariance matrix
Ω = E (vv′) = σ2ββ′ + Θ2.
Estimation of structural parameters is obtained through maximum likeli-hood, making use of the restrictions implied in both the coefficient matrixΠ and the covariance matrix of the error term ν. The idea of MIMIC modelis that the latent variable accounts completely for the intercorrelations ofthe indicators. Once the effects of the causal variables x and and the dis-turbance of ε on each of the indicators are removed, there is no correlationamong indicators.
4.2 Hypotheses and Data
The previous theory section suggests that the extent and development ofthe shadow market transactions are linked to the following mechanisms andvariables:
1. Tax rates
We hypothesize: The higher the share of direct and indirect taxation,the higher is the shadow economy. We also hypothesize: The higher theshare of social security contributions, the higher is the shadow economy.
2. State regulation/intervention
We hypothesize: The higher the state regulation (measured in shareof public administrative employment in % of total employment), thehigher is the shadow economy.
3. Tax morale
We hypothesize: The higher the tax morale the lower is the shadoweconomy.
17

4. Public goods and state transfers
We hypothesize: The higher the state transfers and/or public goodsand the better the quality of these goods and transfers the lower is theshadow economy.
5. Status of the economy
The worse the economy the higher the shadow economy. This is mea-sured here in unemployment with the hypothesis: The higher the un-employment, the higher is the shadow economy. Another variable isGDP per capita with the hypothesis: The higher the GDP per capita,the lower is the shadow economy.
6. Payment habits
We hypothesize: The higher the share of cash payments the higher isthe shadow economy.
These 6 hypotheses will be tested with the help of an econometric analysisorder to try to explain the size and development of the shadow economyof 21 highly industrialized OECD countries. In table 4.1 the econometricestimation using the DYMIMIC approach (latent estimation approach) ispresented for the 21 industrialized and highly developed OECD countries forwhich we have data for four points of time: 1990/91, 1994/95, 1997/98 und1999/2000. As cause variables we have the following ones:
• share of direct taxation (positive sign expected),
• share of indirect taxation (positive sign expected),
• share of social security contribution (positive sign expected),
• burden of state regulation (share of public administrative employmentin % of total employment – positive sign expected),
• tax morale (positive sign expected ),
• state transfers (per capita – negative sign expected),
• unemployment quota (positive sign expected), and
• GDP per capita (negative sign expected).
As indicator variables we have the following ones:
• employment quota (in % of population 18-64 – negative sign expected),
18

• average working time (per week – negative sign expected),
• annual rate of GDP (adjusted for the mean of all 22 OECD countries– negative sign expected), and
• change of currency per capita (positive sign expected).
4.3 Estimation Results
ftbpFU6.1237in7.8331in0ptDYMIMIC estimation of the Shadow Economyof 21 highly developed OECD Countries, years 1990/91, 1994/95, 1997/98,1999/2000 and 2001/2002Figure
For 21 OECD countries the results are presented in table 4.2 from 1989/90to 2002/03.
ftbpFU6.1187in7.8323in0ptThe Size of the Shadow Economy in OECDCountriesFigure
If we consider the empirical results of table 4.1 the estimated coefficientsof all seven cause variables are statistically significant and have the theoreti-cally expected signs. The estimated coefficients of the tax and social securityburden variables are quantitatively the most important ones, followed by thetax morale variable which has the single biggest influence. Hence, the taxpayers’ attitude against the state institutions/government is quite importantto determine whether one is engaged in shadow economy activities, or not.Also the shape of the official economy measured in unemployment and GDPper capita have a quantitative important influence on the size and develop-ment of the shadow economy of these 21 OECD countries. Turning to thefour indicator variables, they all have a statistically significant influence andthe estimated coefficients have the theoretically expected signs. The quanti-tatively most important are the unemployment quota and change of currencyper capita.
For the calculation of the size and the development of the shadow econ-omy, for the 21 OECD countries a combination of the DYMIMIC methodwith the currency demand method is used. Considering the latest period2002/2003, Greece has with 28.3% of official GDP the largest shadow econ-omy, followed by Italy with 26.2% ) and Portugal with 22.3%. In the middle-field are Germany with a shadow economy of 16.8% of official GDP, followedby Ireland with 15.5% and France with 14.8% of official GDP. At the lowerend are Austria with 10.8% of GDP and the United States with 8.6% of officialGDP. For these OECD countries one realizes over time a remarkable increaseof the shadow economies during the 90s. On average the shadow economy was13.2% in these 21 OECD states in the year 1989/90 and it rose to 16.4% in
19
the year 2002/2003. If we consider the second half of the 90s, we realize thatfor the majority of OECD countries the shadow economy is not further in-creasing, even (slightly) decreasing, like for Belgium from 22.5% (1997/98) to21.5% (2002/2003), for Denmark from 18.3% (1997/98) to 17.5% (2002/2003)or for Finland from 18.9% (1997/98) to 17.6% (2002/2003) or for Italy from27.3% (1997/98) to 26.2% (2002/2003). For others, like Austria, it is still in-creasing from 9.0% (1997/98) to 10.8% (2002/2003), or Germany from 14.9%(1997/98) to 16.8% (2002/2003). Hence, one can’t draw a general conclusionwhether the shadow economy is further increasing or decreasing at the endof the 90s. It differs from country to country but in some countries someefforts have been made to stabilize the size of the shadow economy and inother countries (like Austria or Germany) these efforts were not successfulup to the year 2003.
Summarizing, the econometric and empirical results demonstrate thatfor the 21 highly developed OECD countries the theoretical considerationsof part 2 and 3 can be confirmed: The tax and social security burden are thedriving forces of the shadow economy, closely followed by the status of theofficial economy and by the tax morale variable. Moreover, we realize quitea dynamic increase of the shadow economy in the 90s and for a part of theOECD countries a staggering or slightly decreasing shadow economy sincethe end of the 90s.
5 Final Remarks
The econometric results provide support for the proposed causes for shadoweconomies. Taxation and social security variables were found to be signifi-cant. As a policy implication, this finding suggests that an increase in the sizeof the public sector with high tax burden has side-effects: hidden economyexpands. Such an implication provides support for the view that by control-ling tax burden, tax competition also provides breakes for shadow economieswhile the tax harmonization may have the opposite effect. The econometricsuccess with the tax moral variable in control of the shadow economy pointsto the importance of social capital in the society. It appears thus importantto make sure that the public is informed of the link between the benefitsassociated with their contribution. In terms of our model, the state of theofficial economy is reflected in the willingess to pay function. Such effectsare captured by the unemployment variable and the GDP per capita vari-able which both turned out to be significant. As to employment promotingpolicies, the social benefits may thus be greater than often thought. The sig-nificant coefficient of the the state transfer variable points to the conclucion
20

that the transfers operate like bribing people out of the shadow economy.The limits to shadow economy are sensitive to economic performance of
an economy. There is substantial cross-country variation in the developmentof the shadow economies over time. We find quite an increase of the estimatedsize of shadow economy in the 90s in the OECD countries. For a part of theOECD countries, there is a staggering or slightly decreasing shadow economysince the end of the 90s.
References
[1] Acemoglu, D. (1995), ”Reward structures and the allocation of talent”.European Economic Review, 39, 17-33.
[2] Binmore, K. (1998), Game Theory and the Social Contract II. Just Play-ing, Cambridge, Mass: The MIT Press.
[3] Cagan, P. (1958), ”The demand for currency relative to the total moneysupply”, Journal of Political Economy, 66.
[4] Camera, G. (2001), ”Dirty money”, Journal of Monetary Economics,47, 377-415.
[5] Cowell, F.A. (1989), ”Honesty is sometimes a best policy”, EuropeanEconomic Review, 33, 605-617.
[6] Dabla-Norris, E. and Feltenstein, A. (2003), ”An analysis of the under-ground economy and its macroeconomic consequences”, IMF WorkingPaper, 23/03.
[7] Cohen, L.E., and Machalek, R. (1988), ”A General Theory of Expropria-tive Crime: An Evolutionary Ecological Approach”, American Journalof Sociology, 94, 465-501.
[8] Davidson, C., Martin, L., and Wilson, J.D. (2003), ”Efficient BlackMarkets”, CESifo Area Conference.
[9] Dawkins, R. (1976), The Selfish Gene, New York: Oxford UniversityPress.
[10] Drehmann, M., Goodhart, C. and Krueger, M. (2002), ”Challenges tocurrency”, Economic Policy, 17, 34, 193-218.
21

[11] Fehr and Gachter, Nature 2002, 415, 137-140
[12] Fershtman, C., and Weiss, Y., and Hvide, H.K. (2001), ”Status concernsand the organization of work”, WP No. 2-2001, Tel-Aviv University.
[13] Frank, R. (1987), ”If Homo Economicus Could Choose His Utility Func-tion, Would He Want One with a Conscience”, The American EconomicReview, 1987, 593-604.
[14] Frank, R. (1988), Passions Within Reason. The Strategic Role of theEmotions, New York: W.W.Norton & Company, Inc.
[15] Giles, D. E. A. (1999), ”Measuring the hidden economy: Implicationsfor econometric modelling”, The Economic Journal, 109, F370-F380.
[16] Giles, D.E. A. and Caragara, P. J. (1999), ”The learning path of thehidden economy”, Econometrics working papers 9904, Department ofEconomics, University of Victoria.
[17] Grossman, H.I. (2002), ”Make Us a King: Anarchy, Predation, and theState”, European Journal of Political Economy, 18, 31-46.
[18] Hamilton, W. D. (1964), ”The Genetic Theory of Social Behavior”, Jour-nal of Theoretical Biology 7, 1-32.
[19] Hancock, D. and Humphrey, D. B. (1998), ”Payment transactions, in-struments and systems: a survey”, Journal of Banking and Finance, 21,1573-1624.
[20] Humphrey, D. B., Kaloudis, A. and Owre, G. (2000), ”Forecasting cashuse in legal and illegal activities”, Bank of Norway Working Paper, 14.
[21] Johnson, S., and Kaufman, D., Shleifer A., Goldman, M. I., and Weitz-man, M. L. (1997), ”The unofficial economy in transition”, BrookingsPapers on Economic Activity, N:o 2, 159-239.
[22] Joreskog, Karl G. and Goldberger, Arthur S. (1975). Estimating of aModel with Multiple Indicators and Multiple Causes of a Single LatentVarialbe
[23] Kanniainen, V. and Paakkonen, J. (2004), ”Anonymous Money, MoralSentiments and Welfare”, CESifo working paper N.o 1258.
[24] Loayza, N. V. (1996), ”The economies of the informal sector: a sim-ple model and some empirical evidence from Latin America”, Carnegie-Rochester Conference Series on Public Policy 45, 129-162.
22

[25] Puhl, R. and Brownell, K. D. (2003), ”Ways of coping with obesitystigma: review and conceptual analysis”, Eating Behaviors, 4, 53-78.
[26] Ridley, M. (1996), Origin of Virtue, Sane Toregard Agency.
[27] Rogoff, K. (1998), ”Blessing or curse? Foreign and underground demandfor euro notes”, Economic Policy, pp. 263-303.
[28] Schneider, F. (2000) ”The increase of the size of the shadow economy”,CESIfo Working Paper 306.
[29] Schneider, F. and Enste D. (2002), The shadow economy: An interna-tional survey, Cambridge University Press.
[30] Schulze, B. and Angermeyer, M. C. (2003), ”Subjective experiences ofstigma. A focus group study of schizophrenic patients, their relatives andmental health professionals”, Social Science & Medicine, 56, 299-312.
[31] Singh-Manoux, A., Adler, N. E. and Marmot, M. G. (2003), ”Subjectivesocial status: its determinants and its association with measures of ill-health in the Whitehall II study”, Social Science & Medicine, 56, 1321-1333.
[32] Smith, A. 1966
[33] Thomas, J. (1999), ”Quantifying the black economy: ’Measurementwithout theory’ yet again?”, The Economic Journal, 109, F381-F389.
[34] Trivers, R. (1971), ”The Evolution of Reciprocal Altruism”, QuarterlyReview of Biology, 46, 35-57.
[35] Vila, B.J., and Cohen, L.E. (1993), ”Crime as Strategy: Testing an Evo-lutionary Ecological Theory of Expropriation Crime”, American Journalof Sociology, 98, 873-912.
[36] Wilson, E. O. (1975), Sociobiology: The New Synthesis, Cambridge,Mass: Belknap Press of Harvard University Press.
[37] Zellner, A: (1970), ”Estimation of Regression Relationships ContainingUnobservable Variables”, International Economic Review, 11, 441-454.
23