determinants of serum 25-hydroxyvitamin d in hong kongthe main natural source of vitamin d is the...
TRANSCRIPT

1
Determinants of serum 25-hydroxyvitamin D in Hong Kong 1
2
Cuiling Xu1, Ranawaka A. P. M. Perera1, Yap-Hang Chan1,2, Vicky J. Fang1, Sophia Ng3, Dennis 3
K. M. Ip1, Andrea May-Sin Kam1, Gabriel M. Leung1, J. S. Malik Peiris1, Benjamin J. Cowling1* 4
5
Affiliations: 6
1. School of Public Health, The University of Hong Kong, Pokfulam, Hong Kong Special 7
Administrative Region, China. 8
2. Division of Cardiology, Department of Medicine, Queen Mary Hospital, The University 9
of Hong Kong, Hong Kong, China 10
3. School of Public Health, University of Michigan, Ann Arbor, Michigan. 11
12
*Corresponding author: 13
Dr B. J. Cowling, School of Public Health, Li Ka Shing Faculty of Medicine, The University of 14
Hong Kong, 21 Sassoon Road, Pokfulam, Hong Kong. 15
Tel: +852 3917 6711; Fax: +852 3520 1945; email: [email protected] 16
17
Running title: Determinants of vitamin D in Hong Kong 18
Key words: Vitamin D, 25-hydroxyvitamin D, age, solar radiation, Hong Kong 19
Abbreviations: 1,25(OH)2D, 1,25-dihydroxy-vitamin D ; 25(OH)D , 25-hydroxyvitamin D. 20
Word count (abstract): 250 21
Word count (main text): 2,986 22
23
24
25

2
ABSTRACT 1
Vitamin D plays an important role in skeletal health throughout life. Some studies have 2
hypothesized that vitamin D may reduce the risk of other diseases. Our study aimed to estimate 3
age-specific and sex-specific serum 25-hydroxyvitamin D (25(OH)D) status and to identify the 4
determinants of serum 25(OH)D status in Hong Kong, a subtropical city in southern China. In 5
2009-10, households in Hong Kong were followed up to identify acute respiratory illnesses, and 6
sera from 2694 subjects were collected in 3-4 different study phases to permit measurement of 7
25(OH)D levels at different times of the year. A questionnaire survey on diet and lifestyle was 8
conducted among children with simultaneous serum collection in April and May 2010. The mean 9
of serum 25(OH)D levels in age groups ranged from 39-63 nmol/L throughout the year with the 10
mean values in all age groups in spring below 50 nmol/L. Children 6-17y, and girls and women 11
had significantly lower serum 25(OH)D levels, than adults, and boys and men respectively (all 12
p<0.001). We estimated that serum 25(OH)D levels in Hong Kong followed a lagged pattern 13
relative to climatic season by 5 weeks with lowest observed levels in early spring (March). For 14
children 6-17y, reporting a suntan, having at least 1 servings of fish per week, and having at least 15
1 serving of egg per week, were independently associated with higher serum 25(OH)D levels. 16
Adequate sunlight exposure and increased intake of dietary vitamin D could improve vitamin D 17
status, especially for children and females in the winter and spring. 18
19
20

3
Introduction 1
Vitamin D plays an important role in skeletal health, and vitamin D deficiency is known to be a 2
cause of rickets and osteoporosis (1). In addition, a wide range of tissues and cells have been 3
found to possess vitamin D receptors. Observational studies have suggested that low 25-4
hydroxyvitamin D values are associated with an increased risk for several non-skeletal diseases, 5
including cancer (2,3), infectious diseases (4-7), and cardiovascular disease (8). Vitamin D 6
inadequacy is being increasingly recognized worldwide, and remains common in children and 7
adults (1,9,10). 8
Humans acquire vitamin D from exposure to sunlight, from their diet, and from dietary 9
supplements (1). The main natural source of vitamin D is the sun, as vitamin D is synthesized in 10
the skin after exposure to solar ultraviolet B radiation (wavelength 290–315 nm) (1). A diet high 11
in oily fish prevents vitamin D deficiency (11).Vitamin D from the skin and diet converts to 25-12
hydroxy-vitamin D (25(OH)D) in the liver and subsequently to 1,25-dihydroxy-vitamin D 13
(1,25(OH)2D) in the kidney, which is the active form of vitamin D (1). 25(OH)D is the major 14
form of vitamin D that circulates in the blood stream and can be used as a marker to determine 15
vitamin D status (12). 16
Hong Kong is a subtropical coastal city in southern China, with sufficient sunshine during the 17
whole year and fish is commonly consumed in the local diet. However, there are few data on 18
vitamin D status by age and sex in residents, and on the effect of dietary and sun exposures on 19
vitamin D status in Hong Kong. Seasonal variation in Vitamin D status is thought to play a role 20
in the seasonality of bone mass (13,14). However, there is a paucity of data on the seasonality of 21
vitamin D levels in subtropical Hong Kong, where there is relatively little variation in the hours 22
of sunlight throughout the year. 23
We conducted a household-based prospective study from September 2009 through December 24
2010 in Hong Kong (15). The study was primarily designed to study the direct and indirect 25
effectiveness of influenza vaccination among school-age children in preventing influenza virus 26
infections in their households. For the present study, we determined vitamin D status in stored 27
sera to describe the seasonal variation in vitamin D status in children and adults over time, and to 28
investigate the determinants of vitamin D status. Our present study also included an additional 29
questionnaire survey conducted among participating children 6-17y of age in April and May 30

4
2010 to collect information on sun-seeking behaviors, and dietary and supplementary habits that 1
might affect vitamin D status. 2
3
Methods 4
Study participants 5
Participants included in this study of vitamin D were part of a household-based prospective study 6
of influenza, as describe elsewhere(15). In 2009-2010, we recruited all members of 796 7
households, and each household included a child 6-17y of age who was randomly allocated to 8
receive either a single dose of seasonal trivalent inactivated influenza vaccine (TIV) or placebo 9
in a double blind manner. Enrollment, collection of serum specimens and vaccinations were 10
performed by trained research staff at a study clinic. Serum specimens were collected at baseline 11
(September 2009 through February 2010) and after 12 months at the end of the follow-up period 12
(“post-study”, October through December 2010). Serum specimens were also collected 1 month 13
after vaccination from the children who received vaccine or placebo (“post-vaccination”, 14
October 2009 through February 2010). A subset of participants also provided blood samples 15
half-way through the study (“mid-study”, April and May 2010). 16
Using a vitamin D questionnaire designed according to previous studies in the United 17
States(16,17), we collected data about sun-seeking behaviors, and dietary and vitamin D 18
supplementary habits from these children 6-17y who also provided mid-study serum specimens 19
in April and May 2010. The questionnaires were completed by the children together with their 20
parents. 21
22
Ethics 23
Written consent was obtained from all adult subjects. Proxy written consent from parents or legal 24
guardians was obtained for participants 17 years of age and younger, with additional written 25
assent from those aged 8-17 years. The study protocol was approved by the Institutional Review 26
Board of The University of Hong Kong. 27
28
Laboratory analysis 29
Blood from all household members were collected in tubes containing clot activator and held at 30
4-8°C from collection until receipt at the laboratory. At the laboratory, each specimen was 31
5
centrifuged to extract the sera, which was then frozen at -80°C. The serum specimens were 1
subsequently tested for 25(OH)D using the OCTEIA ELISA 25-hydroxyvitamin D immunoassay 2
kit manufactured by Immunodiagnostic Systems (IDS) Ltd (Boldon, United Kingdom) (18). 3
According to the package insert of the assay, the inter-assay Coefficient of Variation for the 4
25(OH)D assay was 4.6%-8.7%, and the intra-assay Coefficient of Variation was 5.3%-6.7%. In 5
our own laboratory we found that the intra-assay Coefficient of Variation was 7.4%. 6
7
Statistical analysis 8
We anticipated that we would have at least 80% power to detect at least a 9 nmol/L difference in 9
serum 25(OH)D between any two groups (four age groups and male/female) in each season, 10
assuming a standard deviation of 15-18 nmol/L based on data available for mean and standard 11
deviation of serum 25(OH)D by sex in a normal population from the literature (19). The sample 12
size of 63 in each age or sex group would be adequate to test the difference in mean of serum 13
25(OH)D by age or sex in a single season. We anticipated that our overall study sample size of 14
2694 individuals with repeated measurements would permit reliable comparisons between 15
seasons, by age and sex, and would allow us to identify moderate effects of determinants after 16
accounting for serial correlation in the measurements. 17
The participants were categorized into four age groups, i.e. 6-17y, 18-44y, 45-64y and ≥ 65y. 18
The four seasons were defined as spring (March-May), summer (June-August), autumn 19
(September-November), and winter (December-February) respectively. The 25(OH)D levels 20
were categorized into different seasons based on the data of specimen collection. If two 21
specimens from the same subject were categorized to the same season, we used the average 22
25(OH)D level of the two specimens. Since no blood specimens were collected in the study 23
during June through August of 2010, no data on 25(OH)D levels in the summer of 2010 were 24
available. 25
We used a generalized linear model to compare the mean of serum 25(OH) by age and sex in 26
each season to estimate age-specific and sex-specific patterns in serum 25(OH)D levels. Since 27
solar radiation can reflect climatic season, we fitted a random-effects linear regression model to 28
obtain quantitative seasonality estimates of serum 25(OH)D based on the repeated measures of 29
serum 25(OH)D, which included daily level of solar radiation as a predictive factor. Daily means 30
of solar radiation were obtained from Hong Kong observatory, and were smoothed using Kernel 31

6
density smoothing as a proxy measure for seasonal variation in the climate in Hong Kong (20). In 1
a separate secondary analysis, a random-effects sinusoidal linear regression model with annual 2
periodicity was fitted to characterize the seasonal variation of serum 25(OH)D. In the two 3
random-effects linear regression models used to estimate the seasonal variation of serum 4
25(OH)D, the associations of 25(OH)D with age, sex, educational attainment of the household 5
head, vaccination and chronic conditions were adjusted for. The ratio of serum 25(OH)D levels 6
between the peak season and the trough season in each age group was calculated to estimate the 7
degree of seasonal variation in serum 25(OH)D levels. 8
Since both vitamin D questionnaires and mid-study sera were collected simultaneously from a 9
subset of participating children 6-17y of age in April-May 2010, we performed univariable and 10
multivariable analyses to explore the determinants of serum vitamin D levels among children 11
using generalized linear models. A multiple linear model with backward selection was used to 12
exclude variables one by one from an initially complete model. Only the factors with p-values 13
<0.2 were included in the final model. Statistical analyses were conducted in R version 2.15.1 (R 14
Foundation for Statistical Computing, Vienna, Austria) and SAS version 9.2 (SAS Institute, Cary, 15
NC). 16
17
Results 18
Characteristics of participants 19
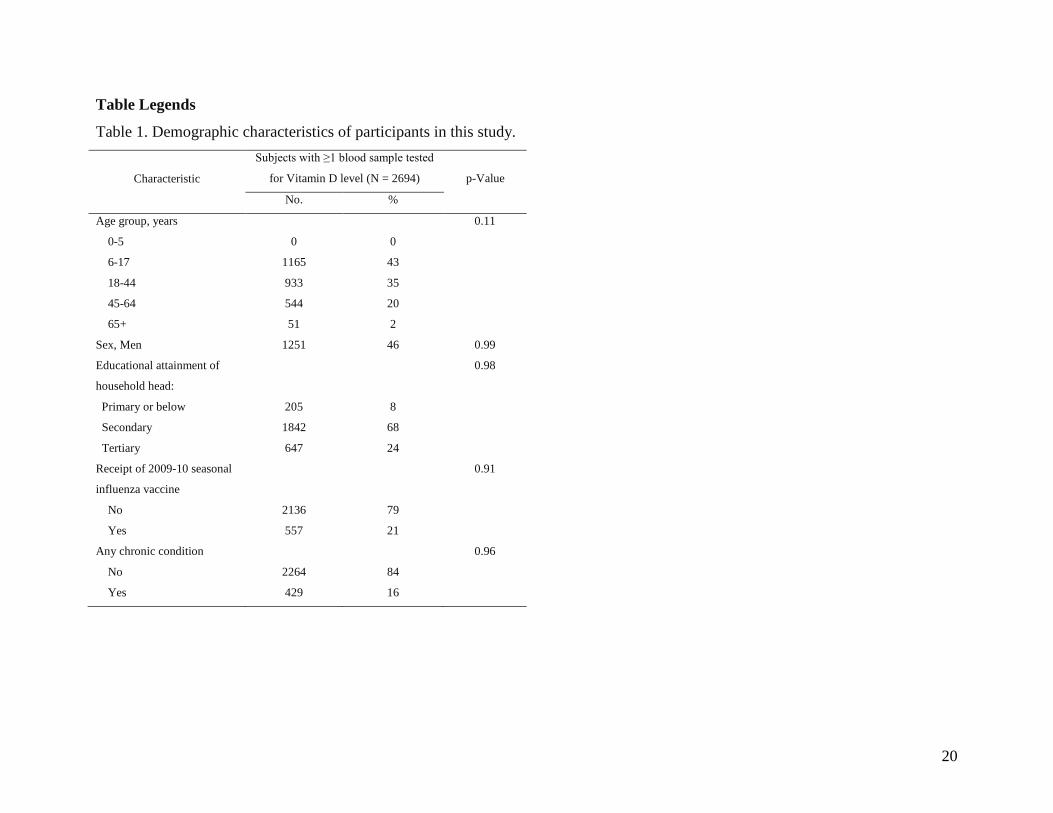
In total 3030 people participated in the previous influenza household study, and 53 people from 20
14 households withdrew or were lost to follow-up. 2694/3030 participants (89%) had at least 1 21
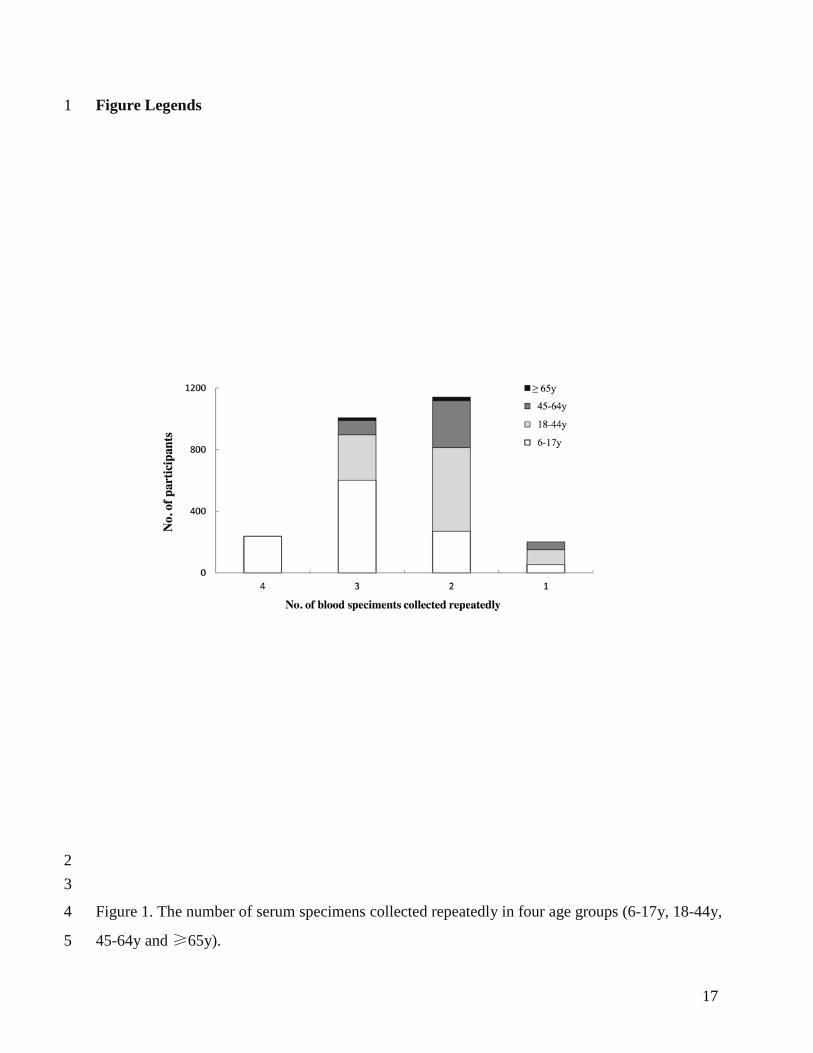
serum specimen available for 25(OH)D testing (Table 1). Of the 2694 participants, 2459 (91%) 22
and 1341 (50%) had ≥2 and ≥3 serum specimens available for 25(OH)D testing respectively 23
(Figure 1). There was no difference in age, sex, educational attainment of household head, 24
vaccination history and chronic conditions between 3030 participants in the influenza household 25
study and 2694 participants included in the vitamin D analysis (Table 1). The median age of 26
these 2694 participants was 33 years (interquartile range, 11-43 years), and 46% were male. Of 27
these 2694 participants, 21% reported receipt of 2009-2010 seasonal influenza vaccine, and 16% 28
had a self-reported chronic condition. 29
30
Mean of serum25(OH)D by age and sex in different seasons 31

7
Table 2 presents the comparative analysis of serum 25(OH)D levels in each season by age and 1
sex. In each season children 6-17y of age had significantly lower vitamin D levels (39-53 nmol/L) 2
compared to adults 18-44y of age (42-57 nmol/L) (all p<0.001). Adults 45-64y of age (47-63 3
nmol/L) had significantly higher serum 25(OH)D levels than adults 18-44y of age in the other 4
three seasons (all p<0.01) except the winter of 2009-10.The mean serum 25(OH)D level in adults 5
≥65y (41-56 nmol/L) was not significantly different from adults 18-44y of age in each season. 6
Males had significantly higher serum 25(OH)D levels (3-5 nmol/L) than females in each season. 7
8
Seasonal variation of serum 25(OH)D 9
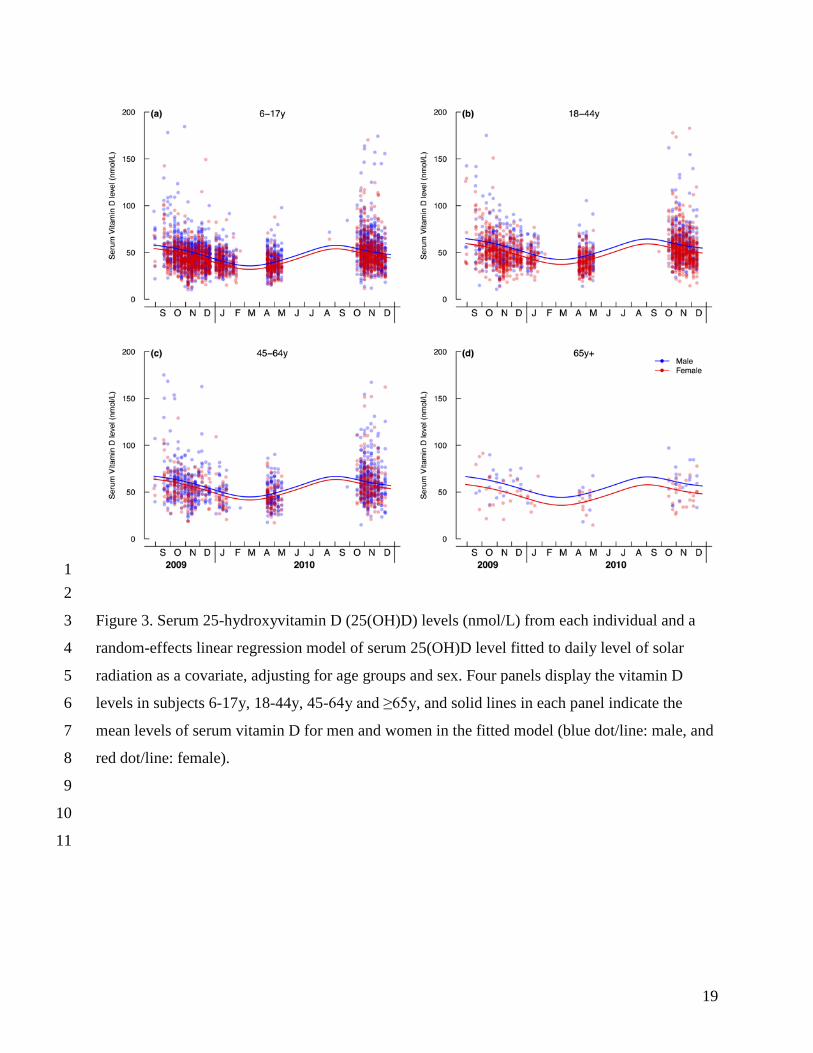
The pattern of daily solar radiation showed one peak (August) in Hong Kong (Figure 2). Using 10
the random-effects linear regression model, we found that the daily level of solar radiation, age 11
and sex were significantly associated with serum 25(OH)D levels after adjusting for other factors 12
(supplementary Table 1). For males and females in the age groups of 6-17y, 18-44y, 45-64y, the 13
model that included a 5-week lag in solar radiation gave the best fit to time-varying serum 14
25(OH)D levels (all p<0.05) (Figure 3a-c). We identified significant seasonal fluctuation in 15
serum 25(OH)D levels for males and females in the age groups of 6-17y, 18-44y and 45-64y, 16
which peaked in September (Autumn), and dropped to lowest levels in March (Spring). 10.6% of 17
the variation in vitamin D levels was explained by the inclusion of seasonal variation in solar 18
radiation in the model. In all four age groups, the average of predicted serum 25(OH)D levels in 19
boys/men were 4-9 nmol/L higher than in girls/women (all p<0.05). In a secondary analysis 20
using the random effects sinusoidal linear regression model, we found that there was similar 21
degree of seasonal fluctuation in serum 25(OH)D levels for different age and sex groups to the 22
first random-effects model while the first random-effects model incorporating solar radiation 23
better explained the seasonal variation in serum 25(OH)D levels. The ratio of serum 25(OH)D 24
levels between the spring and the autumn of 2010 in each age group varied from 1.3-1.4. 25
26
Factors that influence serum 25(OH)D among children 27
321 children completed vitamin D questionnaires and also provided mid-study serum specimens 28
in April and May 2010. The median age of participants in the questionnaire survey was 11y 29
(interquantile range, IQR: 9-12y). 86% of participants reported a suntan in the past year, and 20% 30
reported an average of at least 1 hour of sun exposure per day in the past week. 21%, 30% and 38% 31

8
of participants reported having an average of at least 1 daily serving of fish, milk and eggs 1
respectively. 9%, 6% and 60% reported the use of additional vitamin D supplements, intake of 2
multivitamins, and use of cod liver or fish oil respectively. 3
In univariable analyses, younger age, male sex, reporting a suntan, having at least 1 serving of 4
fish per week, having at least 1 serving of milk per day, and taking cod liver oil or fish oil were 5
significantly associated with higher serum 25(OH)D levels (Table 3). In multivariable analysis, 6
younger age, male sex, reporting a suntan, having at least 1 serving of fish per week and having 7
at least 1 serving of egg per week were independently associated with higher serum 25(OH)D 8
levels (Table 3). 9
10
Discussion 11
In our study, we characterized seasonal fluctuations in serum 25(OH)D levels in subtropical 12
Hong Kong at 22º latitude, identifying peaks in September and troughs in March, following a 13
lagged pattern relative to climatic seasons. We found that the mean of serum 25(OH)D levels in 14
the peak season for each age group was 1.3-1.4 times higher than that in the trough season, while 15
the peak/trough ratios tend to be slightly greater in temperate locations such as the 16
Netherlands(21), Germany(22), Italy(23) and Japan(19). In spring, the means of serum 25(OH)D in 17
each of four age groups were below 50 nmol/L that is recommended by the Institute of Medicine 18
Recommended Dietary Allowance (RDA) (24), and in the other seasons, these values were below 19
the requirements recommended by the International Osteoporosis Foundation and the US 20
Endocrine Society (≥75 nmol/L)(25). In Hong Kong, the means of serum 25(OH)D in different 21
age groups were also lower than those reports at the similar age groups from Japan, Thailand and 22
Vietnam in Asia and most reports from the countries in North America(10,26-31). Moreover, the 23
means of serum 25(OH)D our study reported were lower than that (77 nmol/L) in Taiwan where 24
the latitude (25º) is similar to Hong Kong(32) .The reasons why living in Hong Kong with lower 25
latitudes does not appear to protect against vitamin D insufficiency is likely due to several 26
factors, potentially including less time spent outdoors, less vitamin D intake from diet or dietary 27
supplements, skin pigmentation of the local Chinese residents (11), air pollution(33), or other racial 28
differences in genetic polymorphism (34). 29
Similar to the findings from several temperate locations (19,35-40), our study estimated that there 30
is substantial seasonal fluctuation in serum 25(OH)D levels in Hong Kong. Previous studies in 31
9
subtropical Taiwan, Florida and Hong Kong reported the differences in serum 25(OH)D level 1
between summer (or autumn) and winter(32,41,42). However our study with 15-month study 2
duration was able to predict the year-round seasonal fluctuation by using a cyclic regression 3
model, although there was a lack of data on summer levels of serum 25(OH)D in our study. Sun 4
exposure and solar radiation are known to be a major determinant of vitamin D status (1) and the 5
seasonal pattern of vitamin D in Hong Kong is consistent with seasonal variation in solar 6
radiation. In Hong Kong, hours of sunlight (136 and 111 hours/month respectively) and solar 7
radiation (10 and 12 megajoule (MJ)/m2 respectively) in winter and spring are lower than those 8
(182 and 182 hours/month; 16 and 14 MJ/m2 respectively) in the summer and autumn (20). The 9
weather in winter and spring is suitable for outdoor activity in Hong Kong, while in the autumn 10
temperatures are still high (22–27 °C) in Hong Kong so people also reduce outdoor activity in 11
daytime. That previous study in Hong Kong in 1980’s reported that the means of serum 12
25(OH)D levels in young healthy people were 26.8 µg/l and 23.4 µg/l (equal to 67.0 nmol/L and 13
58.5 nmol/L) in September and January respectively (41), which were higher than our study for 14
the age group 18-44y at similar months. 15
Some previous studies found that aging is associated with the reduction of vitamin D synthesis, 16
however, the association of age with vitamin D status in children, young adults and middle-aged 17
adults is inconsistent (19,43). Our study found that for adults under 65y and children 6-17y serum 18
25(OH)D levels increased with age. This could be explained by children having the capacity to 19
produce 25(OH)D and 1,25(OH)2D due to healthy renal and liver function, whereas adults may 20
produce less of these metabolites due to declining renal function and decreasing capacity of the 21
skin to produce vitamin D precursors. As in Asian and western countries, our study also provided 22
evidence that females had lower 25(OH)D levels than males (19,42,44-46). The sex difference in 23
serum 25(OH)D status could be explained by men and boys having more sunlight exposure, and 24
more usage of sunscreen by girl or women exposure because of cosmetic concerns. 25
We identified five factors associated with higher serum 25(OH)D levels among children 6-17y 26
of age namely, younger age, male sex, reporting a suntan, having at least 1 serving of fish per 27
week, and having at least 1 serving of egg per week. Only a limited number of foods naturally 28
contain vitamin D. Oily fish and egg yolks are rich in both vitamin D3 and 25(OH)D3, which is 29
consistent with more fish and egg ingestion helping to increase serum 25(OH)D3 levels (47,48). A 30
suntan reflect a large amount of cutaneous sun exposure so children reporting a suntan had 31
10
higher serum 25(OH)D level (17). The higher serum 25(OH)D levels in children 6-8y and boys 1
might be related to more skin synthesis after sun exposure. However, reporting a suntan and the 2
amount of hours of sun exposure in the recent week collected in the questionnaire could not 3
reflect fully the duration of sun exposure in the longer period and the timing of sun exposure 4
related to zenith angle of the sun. 5
Our study has several limitations. First, seasonal variation in serum 25(OH)D was assessed 6
using the data collected over 15 months with a lack of data on 25(OH)D in the summer months, 7
and a longer time series of 25(OH)D levels would improve the determination of the seasonal 8
variations of 25(OH)D. Second, our study had a limited sample size in elderly persons ≥65y of 9
age and this reduced the precision of estimates in that age group. Third, the factors associated 10
with serum 25(OH)D level among children might not be the same for adults. Finally, we did not 11
select participants at random from the population of Hong Kong, and our estimates of 25(OH)D 12
levels might need adjustment before being used to infer the mean of serum 25(OH)D in the 13
population as a whole. 14
In conclusion, we identified seasonal variation in serum 25(OH)D in Hong Kong, peaking in 15
early autumn (September) and troughing in early spring (March). Children 6-17y, and girls and 16
women had lower serum 25(OH)D levels than adults, boys and men. For children 6-17y, More 17
sunlight exposure and more intake of fish and eggs could improve vitamin D status. 18
19
20
11
Financial Support 1
This study was supported by the Research Fund for the Control of Infectious Diseases of the 2
Health, Welfare and Food Bureau of the Hong Kong SAR Government (grant nos. CHP-CE-03 3
and 11100862), and the Area of Excellence Scheme of the Hong Kong University Grants 4
Committee (grant no. AoE/M-12/06). The funding bodies had no role in study design, data 5
collection and analysis, preparation of the manuscript, or the decision to publish. 6
7
Conflicts of Interest 8
D.K.M.I has received research funding from F. Hoffmann-La Roche Ltd. JSMP receives 9
research funding from Crucell NV. G.M.L has received consulting honoraria from Janssen 10
Pharmaceuticals. B.J.C has received research funding from MedImmune Inc. and Sanofi Pasteur, 11
and consults for Crucell NV. The authors report no other potential conflicts of interest. 12
13
Authorship Contributions 14
C.X. and B.J.C. contributed to the study conception and design. V.J.F., S.N., D.K.M.I., A.M.S.K., 15
G.M.L. and B.J.C. collected data. R.A.P.M.P. and J.S.M.P. conducted laboratory tests. C.X. and 16
V.J.F. analysed data. C.X. wrote the first draft of the paper. All authors contributed to the 17
interpretation of data and approved the final manuscript. 18
19
Acknowledgements 20
We thank Chan Kit Man, Calvin Cheng, Lai-Ming Ho, Ho Yuk Ling, Nicole Huang, Lam Yiu 21
Pong, Lincoln Lau, Winnie Lim, Tom Lui, Tong Hok Leung, Loretta Mak, Eunice Shiu, Joey Sin, 22
Jessica Wong, Kevin Yau and Eileen Yeung for research support. We thank Susan Chiu for 23
helpful discussions. 24
25
26
27
28
12
References 1
2
1. Holick MF (2007) Vitamin D deficiency. N Engl J Med 357, 266-281. 3
2. Giovannucci E, Liu Y, Rimm EB et al. (2006) Prospective study of predictors of vitamin D 4
status and cancer incidence and mortality in men. J Natl Cancer Inst 98, 451-459. 5
3. Lappe JM, Travers-Gustafson D, Davies KM et al. (2007) Vitamin D and calcium 6
supplementation reduces cancer risk: results of a randomized trial. The American journal of 7
clinical nutrition 85, 1586-1591. 8
4. Bergman P, Lindh AU, Bjorkhem-Bergman L et al. (2013) Vitamin D and Respiratory Tract 9
Infections: A Systematic Review and Meta-Analysis of Randomized Controlled Trials. PloS one 10
8, e65835. 11
5. Ginde AA, Mansbach JM, Camargo CA, Jr. (2009) Association between serum 25-12
hydroxyvitamin D level and upper respiratory tract infection in the Third National Health and 13
Nutrition Examination Survey. Arch Intern Med 169, 384-390. 14
6. Douglas AS, Ali S, Bakhshi SS (1998) Does vitamin D deficiency account for ethnic 15
differences in tuberculosis seasonality in the UK? Ethn Health 3, 247-253. 16
7. Cannell JJ, Vieth R, Umhau JC et al. (2006) Epidemic influenza and vitamin D. Epidemiology 17
and infection 134, 1129-1140. 18
8. Wang TJ, Pencina MJ, Booth SL et al. (2008) Vitamin D deficiency and risk of cardiovascular 19
disease. Circulation 117, 503-511. 20
9. Wahl D, Cooper C, Ebeling P et al. (2012) A global representation of vitamin D status in 21
healthy populations. Arch Osteoporos 7, 155-172. 22
10. Hilger J, Friedel A, Herr R et al. (2013) A systematic review of vitamin D status in 23
populations worldwide. Br J Nutr, 1-23. 24
11. Chen TC, Chimeh F, Lu Z et al. (2007) Factors that influence the cutaneous synthesis and 25
dietary sources of vitamin D. Arch Biochem Biophys 460, 213-217. 26
12. Holick MF (2009) Vitamin D status: measurement, interpretation, and clinical application. 27
Ann Epidemiol 19, 73-78. 28
13. Viljakainen HT, Palssa A, Kärkkäinen M et al. (2006) A seasonal variation of calcitropic 29
hormones, bone turnover and bone mineral density in early and mid-puberty girls–a cross-30
sectional study. Br J Nutr 96, 124-130. 31
13
14. Bhattoa H, Bettembuk P, Ganacharya S et al. (2004) Prevalence and seasonal variation of 1
hypovitaminosis D and its relationship to bone metabolism in community dwelling 2
postmenopausal Hungarian women. Osteoporos Int 15, 447-451. 3
15. Cowling BJ, Ng S, Ma ES et al. (2012) Protective efficacy against pandemic influenza of 4
seasonal influenza vaccination in children in Hong Kong: a randomized controlled trial. Clin 5
Infect Dis 55, 695-702. 6
16. Nucci AM, Russell CS, Luo R et al. (2013) The effectiveness of a short food frequency 7
questionnaire in determining vitamin D intake in children. Dermatoendocrinol 5, 205-210. 8
17. Bolek-Berquist J, Elliott ME, Gangnon RE et al. (2009) Use of a questionnaire to assess 9
vitamin D status in young adults. Public Health Nutr 12, 236-243. 10
18. Roth HJ, Schmidt-Gayk H, Weber H et al. (2008) Accuracy and clinical implications of 11
seven 25-hydroxyvitamin D methods compared with liquid chromatography–tandem mass 12
spectrometry as a reference. Ann Clin Biochem 45, 153-159. 13
19. Ono Y, Suzuki A, Kotake M et al. (2005) Seasonal changes of serum 25-hydroxyvitamin D 14
and intact parathyroid hormone levels in a normal Japanese population. J Bone Miner Metab 23, 15
147-151. 16
20. Observatory HK Extract of Meteorological Observations for Hong Kong. 17
http://www.hko.gov.hk/wxinfo/pastwx/mwsc.htm (accessed March 2 2014) 18
21. Khoo A-L KH, Chai LYA, et al. (2010) Seasonal variation in vitamin D₃ levels is paralleled 19
by changes in the peripheral blood human T cell compartment. PloS one 7, e29250. 20
22. Zittermann A, Scheld K, Stehle P (1998) Seasonal variations in vitamin D status and calcium 21
absorption do not influence bone turnover in young women. Eur J Clin Nutr 52, 501-506. 22
23. Carnevale V, Modoni S, Pileri M et al. (2001) Longitudinal evaluation of vitamin D status in 23
healthy subjects from southern Italy: seasonal and gender differences. Osteoporos Int 12, 1026-24
1030. 25
24. Ross AC, Manson JE, Abrams SA et al. (2011) The 2011 report on dietary reference intakes 26
for calcium and vitamin D from the Institute of Medicine: what clinicians need to know. J Clin 27
Endocrinol Metab 96, 53-58. 28
25. Dawson-Hughes B, Mithal A, Bonjour J-P et al. (2010) IOF position statement: vitamin D 29
recommendations for older adults. Osteoporos Int 21, 1151-1154. 30

14
26. Nakamura K, Nashimoto M, Hori Y et al. (1999) Serum 25-hydroxyvitamin D levels in 1
active women of middle and advanced age in a rural community in Japan. Nutrition 15, 870-873. 2
27. Nakamura K, Nashimoto M, Yamamoto M (2001) Are the serum 25-hydroxyvitamin D 3
concentrations in winter associated with forearm bone mineral density in healthy elderly 4
Japanese women? Int J Vitam Nutr Res 71, 25-29. 5
28. Suzuki T, Kwon J, Kim H et al. (2008) Low Serum 25‐Hydroxyvitamin D Levels 6
Associated With Falls Among Japanese Community‐Dwelling Elderly. J Bone Miner Res 23, 7
1309-1317. 8
29. Ho-Pham L, Nguyen N, Lai T et al. (2011) Vitamin D status and parathyroid hormone in a 9
urban population in Vietnam. Osteoporos Int 22, 241-248. 10
30. Chailurkit L-o, Kruavit A, Rajatanavin R (2011) Vitamin D status and bone health in healthy 11
Thai elderly women. Nutrition 27, 160-164. 12
31. Soontrapa S, Chailurkit L (2005) Difference in serum calcidiol and parathyroid hormone 13
levels between elderly urban vs suburban women. J Med Assoc Thai 88, S17-20. 14
32. Tsai K, Hsu S, Cheng J et al. (1997) Vitamin D stores of urban women in Taipei: effect on 15
bone density and bone turnover, and seasonal variation. Bone 20, 371-374. 16
33. Kelishadi R, Moeini R, Poursafa P et al. (2013) Independent association between air 17
pollutants and vitamin D deficiency in young children in Isfahan, Iran. Paediatr Int Child Health 18
34, 50-55. 19
34. Powe CE, Evans MK, Wenger J et al. (2013) Vitamin D–Binding Protein and Vitamin D 20
Status of Black Americans and White Americans. N Engl J Med 369, 1991-2000. 21
35. Davies PS BC, Cole TJ, Prentice A, Clarke PC (1999) Vitamin D: seasonal and regional 22
differences in preschool children in Great Britain. Eur J Clin Nutr 53, 1. 23
36. Klenk J, Rapp K, Denkinger MD et al. (2013) Seasonality of vitamin D status in older people 24
in Southern Germany: implications for assessment. Age Ageing 42, 404-408. 25
37. Mavroeidi A, O'Neill F, Lee PA et al. (2010) Seasonal 25-hydroxyvitamin D changes in 26
British postmenopausal women at 57 degrees N and 51 degrees N: a longitudinal study. J Steroid 27
Biochem Mol Biol 121, 459-461. 28
38. Nakamura K1 NM, Yamamoto M (2000) Summer/winter differences in the serum 25-29
hydroxyvitamin D3 and parathyroid hormone levels of Japanese women. Int J Biometeorol 44, 4. 30

15
39. Vecino-Vecino C, Gratton M, Kremer R et al. (2006) Seasonal variance in serum levels of 1
vitamin d determines a compensatory response by parathyroid hormone: study in an ambulatory 2
elderly population in Quebec. Gerontology 52, 33-39. 3
40. Kasahara AK, Singh RJ, Noymer A (2013) Vitamin D (25OHD) Serum Seasonality in the 4
United States. PloS one 8, e65785. 5
41. MacDonald D, Swaminathan R (1988) Seasonal Variation in 25-OH Vitamin D In Plasma of 6
Hong Kong Chinese. Clin Chem 34, 1. 7
42. Levis S, Gomez A, Jimenez C et al. (2005) Vitamin D deficiency and seasonal variation in 8
an adult South Florida population. J Clin Endocrinol Metab 90, 1557-1562. 9
43. Sherman SS, Hollis BW, Tobin JD (1990) Vitamin D Status and Related Parameters in a 10
Healthy Population: The Effects of Age, Sex, and Season. J Clin Endocrinol Metab 71, 405-413. 11
44. Robien K, Butler LM, Wang R et al. (2013) Genetic and environmental predictors of serum 12
25-hydroxyvitamin D concentrations among middle-aged and elderly Chinese in Singapore. Br J 13
Nutr 109, 493-502. 14
45. Chailurkit L-o, Aekplakorn W, Ongphiphadhanakul B (2011) Regional variation and 15
determinants of vitamin D status in sunshine-abundant Thailand. BMC Public Health 11, 853. 16
46. Choi HS, Oh HJ, Choi H et al. (2010) Vitamin D insufficiency in Korea—a greater threat to 17
younger generation: the Korea National Health and Nutrition Examination Survey (KNHANES) 18
2008. J Clin Endocrinol Metab 96, 643-651. 19
47. Lamberg-Allardt C (2006) Vitamin D in foods and as supplements. Prog Biophys Mol Biol 20
92, 33-38. 21
48. Schmid A, Walther B (2013) Natural vitamin D content in animal products. Adv Nutr 4, 453-22
462. 23
24
25
16
Table Legends 1
Table 1. Demographic characteristics of participants in this study. 2
3
Table 2. Comparison of serum 25-hydroxyvitamin D (25(OH)D) levels (nmol/L) in each season 4
by age and sex using a generalized linear model 5
6
Table 3. The individual characteristics of sun seeking behaviors, diet and vitamin D supplements, 7
and their associations with serum 25-hydroxyvitamin D (25(OH)D) levels among children 6-17y 8
of age in Hong Kong, in April and May 2010. 9
10
17
Figure Legends1
2 3
Figure 1. The number of serum specimens collected repeatedly in four age groups (6-17y, 18-44y, 4
45-64y and ≥65y). 5

18
1 2
Figure 2. Daily levels of solar radiation (megajoule (MJ)/m2) that were obtained based on daily 3
means of solar radiation from Hong Kong observatory using Kernel density smoothing as a 4
proxy measure for meteorological season. (Grey line: daily means of solar radiation, black line: 5
daily level of solar radiation). 6
7
8
9
10
11
12
13
14
19
1 2
Figure 3. Serum 25-hydroxyvitamin D (25(OH)D) levels (nmol/L) from each individual and a 3
random-effects linear regression model of serum 25(OH)D level fitted to daily level of solar 4
radiation as a covariate, adjusting for age groups and sex. Four panels display the vitamin D 5
levels in subjects 6-17y, 18-44y, 45-64y and ≥65y, and solid lines in each panel indicate the 6
mean levels of serum vitamin D for men and women in the fitted model (blue dot/line: male, and 7
red dot/line: female). 8
9
10
11
20
Table Legends
Table 1. Demographic characteristics of participants in this study.
Characteristic
Subjects with ≥1 blood sample tested
for Vitamin D level (N = 2694)
p-Value
No. %
Age group, years 0.11
0-5 0 0
6-17 1165 43
18-44 933 35
45-64 544 20
65+ 51 2
Sex, Men 1251 46 0.99
Educational attainment of
household head:
0.98
Primary or below 205 8
Secondary 1842 68
Tertiary 647 24
Receipt of 2009-10 seasonal
influenza vaccine
0.91
No 2136 79
Yes 557 21
Any chronic condition 0.96
No 2264 84
Yes 429 16

21
Table 2. Comparison of serum 25-hydroxyvitamin D (25(OH)D) levels (nmol/L) in each season by age and sex using a generalized
linear model
2009 Autumn
(Sep-Nov)
2009-10 Winter
(Dec-Feb)
2010 Spring
(Mar-May)
2010 Autumn
(Sep-Nov)
No. of
subjects
Mean
(95% CI) p-Value
No. of
subjects
Mean
(95% CI) p-Value
No. of
subjects
Mean
(95% CI)
p-
Value
No. of
subjects
Mean
(95% CI) p-Value
Age,
years
6-17 893 47 (46, 48) <0.001 484 42 (41, 43) <0.001 399 39 (37, 40) <0.001 1072 53 (51, 54) <0.001
18-45 800 53 (52, 55) Ref. 111 48 (47, 50) Ref. 323 42 (41, 43) Ref. 829 57 (56, 58) Ref.
46-64 458 58 (56, 60) <0.01 69 53 (50, 57) 0.23 203 47 (45, 49) <0.001 500 63 (60, 65) <0.001
65+ 42 56 (48, 63) 0.96 7 51 (45, 57) 0.18 20 41 (35, 48) 0.96 46 54 (48, 60) 0.36
Gender
Male 1007 54 (53, 55) <0.001 338 47 (46, 48) <0.001 447 43 (42, 44) <0.001 1133 58 (57, 60) <0.001
Female 1187 49 (48, 50) Ref. 333 44 (43, 45) Ref. 496 40 (39, 41) Ref. 1321 54 (53, 55) Ref.
Ref. represents reference group.
P-Value denote the P value for comparing serum 25(OH)D levels in different age/sex groups with referent age/sex group in each season.

22
Table 3. The individual characteristics of sun seeking behaviors, diet and vitamin D supplements,
and their associations with serum 25-hydroxyvitamin D (25(OH)D) (nmol/ L) levels among
children 6-17y of age in Hong Kong, in April and May 2010.
Characteristics
No. (%)
Unadjusted β
(95% CI) p-Value
Adjusted β*
(95% CI) p-Value
Age, years
6-8 70(22) Ref. Ref.
9-11 109(34) -4.62 (-7.90, -1.35) <0.01 -4.69(-8.04, -1.34) <0.01
12-17 142(44) -6.76 (-9.88 -3.63) <0.001 --3.96(-7.11, 0.81) <0.05
Male sex 171(53) 3.803 (1.402, 6.204) <0.001 3.92(1.48, 6.36) <0.01
Reporting suntan in the past year 260 (86) 5.31 (1.75, 8.86) <0.01 4.06 (0.57, 7.55) <0.015
Sunscreen used 124(39) 2.072 (-0.437, 4.582) 0.11
Sun exposure in the past week
< 1 hours per week 33(11) Ref.
1-6 hours per week 213(69) 2.95 (-1.14,7.03) 0.16
≥7 hours per week 61(20) 1.00 (-3.72, 5.73) 0.68
Meal of fish per week
< 1 meal of fish per week 10(3) Ref. Ref.
1-6 meals of fish per week 240(75) 11.08 (4.07, 18.10) <0.01 11.38 (4.70, 18.06) <0.001
≥7 meals of fish per week 68(21) 12.83 (5.71, 19.95) <0.001 11.78 (5.00, 18.55) <0.001
Cups of milk per week
< 1 average cup of milk per week 78(25) Ref.
1-6 cups of milk per week 139(45) 3.02 (-0.06, 6.10) 0.06
≥1 cups of milk per day 93(30) 4.91 (1.57, 8.26) <0.01
Number of egg per week
<1 eggs per week 10(3) Ref. Ref.
1-6 eggs per day 188(59) 4.26 (-2.78, 11.31) 0.24 7.26 (0.55, 13.98) <0.05
≥7 eggs per week 119(38) 7.01 (-0.38, 14.41) 0.07 9.25 (2.11, 16.39) <0.05
Vitamin D supplement 30(9) 0.92 (-3.29, 5.13) 0.68
Multivitamin 20(6) 1.95 (-3.12, 7.03) 0.45
Intake cod liver oil or fish oil 64(20) 3.425 (0.401, 6.450) <0.015 2.99 (-0.12, 6.11) 0.06
Skin color compared with
classmates
Much darker 9(3) Ref. Ref.
Darker 67(21) -3.53 (-11.25, 4.20) 0.37 -1.68 (-9.06, 5.71) 0.66
Similar 183(57) 5.88 (-13.31, 1.55) 0.12 -5.32 (-12.38, 1.74) 0.14
Lighter 54(17) -6.22 (-14.05, 1.62) 0.12 -5.54 (-12.98, 1.90) 0.15
Much lighter 7(2) 3.56 (-7.40, 14.53) 0.52 2.67 (-7.59, 12.94) 0.61
Diseases of Digestive System 2(1) 1.08 (-14.46, 16.62) 0.89

23
Diarrhea in past 2 weeks 18(6) -0.30 (-5.63, 5.02) 0.91
Ref. represents reference group.
A multiple linear model with backward selection was used. Only the factors with p-values <0.2 were included in the
final model.

Supplementary Material
Supplementary Table 1. The association of daily levels of solar radiation (megajoule (MJ)/m2)
and time-varying serum vitamin D level (nmol/L) using the random-effects linear regression
model. Characteristic Adjusted β p-Value
Solar radiation 0.46 (0.40, 0.52) <0.01
Age group, years
6-17 -6.06 (-7.45, -4.67) <0.01
18-44 Ref. -
45-64 3.57 (1.98, 5.16) <0.01
65+ -0.50 (-4.72, 3.72) 0.82
Sex
Female Ref. -
Male 4.13 (3.01, 5.25) <0.01
Educational attainment of
household head
Primary or below 1.77 (-0.27, 3.82) 0.09
Secondary Ref. -
Tertiary 0.53 (-0.77, 1.82) 0.42
Receipt of 2009-10
seasonal influenza vaccine
No Ref. -
Yes -0.36 (-1.84, 1.12) 0.63
Any chronic condition
No Ref. -
Yes 0.73 (-0.81, 2.27) 0.35
Ref. represents reference group.