determinants of public-private-partnership performance ...€¦ · have been carried out to...
TRANSCRIPT
ResearchOnline@JCU
This file is part of the following work:
Shah, Syed Azeem Ahmed (2019) Determinants of public-private-partnership
performance: the case of Pakistan. PhD Thesis, James Cook University.
Access to this file is available from:
https://doi.org/10.25903/5d5339a29cc07
Copyright © 2019 Syed Azeem Ahmed Shah.
The author has certified to JCU that they have made a reasonable effort to gain
permission and acknowledge the owners of any third party copyright material
included in this document. If you believe that this is not the case, please email

1
Determinants of Public-Private-Partnership Performance: The Case of Pakistan
This thesis is submitted in fulfilment of the requirement for the degree of Doctor of
Philosophy (Ph.D.) at James Cook University
By
Syed Azeem Ahmed Shah
Bachelor of Commerce
Master of Economics
Master of Business Administration (Finance and Marketing)
Certified Public Accountant of Pakistan
Advisory Panel: Dr Taha Chaiechi
Dr A.B.M. Rabiul Alam Beg Prof Lynne Eagle
College of Business, Law and Governance
James Cook University
2019

2
Research Outputs From thesis
Journal Articles
Azeem Shah. (2013). What are the rationales to pursue Public Private Partnerships in
Pakistan? The Macrotheme Review, January 2013 Volume 2 Issue 1.
Conference Presentations
Azeem Shah. (2013). What are the rationales to pursue Public Private Partnerships in
Pakistan? The Macrotheme Review: Business and Social Science Research Conference: Paris 2012,
France, 27 – 28 December, 2012.
Other than thesis
Conference Presentations
Azeem Shah. (2010). To what extent can public private partnerships in infrastructure
development contribute to economic and social development in industrializing economies? 2nd
International Conference (SAICON 2010) on “Nurturing Innovation, Entrepreneurship, Investments, &
Public-private Partnerships – in Global Environment”, PC Bhurban, Pakistan, 21 – 23 July, 2010.
(One of the top three presentations of the conference)

3
Statement of Original Authorship
The work contained in this thesis has not been previously submitted to meet the
requirements for an award at this or any other higher education institution. To the best of my
knowledge and belief, the material included in this thesis is original and is an intellectual
product of the author of this thesis. Proper citation/ acknowledgment has been made to the work
of other authors contained in this thesis.
________________________
Syed Azeem Ahmed Shah
Author
04 June 2019

4
Acknowledgments
In the name of Allah, Most Gracious, Most Merciful. Proclaim! (or read!) in the name of thy Lord and Cherisher, Who created man, out of a (mere) clot of congealed blood. Proclaim! And thy Lord is Most Bountiful. He Who
taught (the use of) the pen. Taught man that which he knew not (Al-'Alaq 96:1-5).
First of all, I am thankful to Almighty Allah for His countless blessings. After that I
thank all my supervisors and mentors for their help and support to accomplish this thesis. I
thank Dr Taha Chaiechi, primary supervisor, for her support and valuable advice during my
thesis writing. I thank Dr Rabiul Beg, secondary supervisor, for his help and support on every
step during my candidature. Last but not least, my thanks go to Prof Lynne Eagle, secondary
supervisor, for her inspirational and supportive role as professional mentor to complete this
thesis.
The journey involved in this scholarly work has been difficult and challenging. Without
the contribution of a number of sincere people, this thesis would not have been completed. My
sincere gratitude and appreciation go to: my elder brother Syed Nadeem Ahmed Shah, my elder
sister Sajida Aqdas, my baby sister Rabia Shahzad Shah, my mother-in-law Shamim Akhtar,
my ex-colleague Adnan Mazhar, my friends Rizwan Ahmad, Anees Ahmed and fellow PhD
student Muhammad Abid Saleem for their encouragement and moral support.
To my children (Syed Umer Azeem Shah, Warda Jannat Shah, Sara Jannat Shah and
Syed Ali Azeem Shah) goes my thanks for their love, prayers, support and encouragement
especially during the final stage of my study.
Finally, thank-you to my beloved and beautiful wife and the best friend ever, Dr Seema
Azeem Shah, for her love, prayers, encouragement and support right from the beginning of my
PhD journey. She has kept me focused on completing this degree. I would not have been able
to complete this journey without her companionship. A big Thank-You to her for being with
me and keeping me determined to achieve!
________________________
Syed Azeem Ahmed Shah
Author
04 June 2019
5
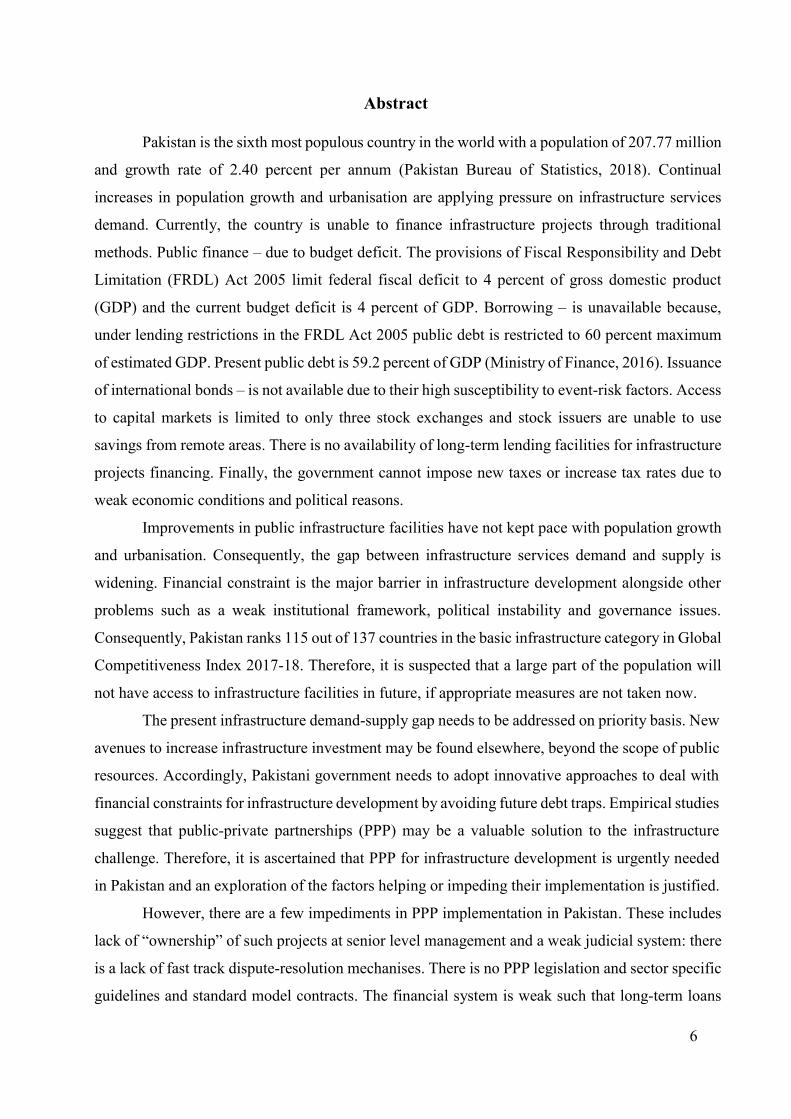
Statement of Contributions of Others
Name of Assistance Contribution
Names, Titles and
Affiliation of Contributors
Supervision Primary Supervisor Dr Taha Chaiechi
Secondary Supervisor Dr A.B.M. Rabiul Alam Beg
Secondary Supervisor Professor Lynne Eagle, James
Cook University
Editing Support Copyediting and proofreading services
according to the protocols in the
university-endorsed National Guidelines
for Editing Research Theses
Dr John Cokley,
PhD, EduPreneur Services
International
6
Abstract
Pakistan is the sixth most populous country in the world with a population of 207.77 million
and growth rate of 2.40 percent per annum (Pakistan Bureau of Statistics, 2018). Continual
increases in population growth and urbanisation are applying pressure on infrastructure services
demand. Currently, the country is unable to finance infrastructure projects through traditional
methods. Public finance – due to budget deficit. The provisions of Fiscal Responsibility and Debt
Limitation (FRDL) Act 2005 limit federal fiscal deficit to 4 percent of gross domestic product
(GDP) and the current budget deficit is 4 percent of GDP. Borrowing – is unavailable because,
under lending restrictions in the FRDL Act 2005 public debt is restricted to 60 percent maximum
of estimated GDP. Present public debt is 59.2 percent of GDP (Ministry of Finance, 2016). Issuance
of international bonds – is not available due to their high susceptibility to event-risk factors. Access
to capital markets is limited to only three stock exchanges and stock issuers are unable to use
savings from remote areas. There is no availability of long-term lending facilities for infrastructure
projects financing. Finally, the government cannot impose new taxes or increase tax rates due to
weak economic conditions and political reasons.
Improvements in public infrastructure facilities have not kept pace with population growth
and urbanisation. Consequently, the gap between infrastructure services demand and supply is
widening. Financial constraint is the major barrier in infrastructure development alongside other
problems such as a weak institutional framework, political instability and governance issues.
Consequently, Pakistan ranks 115 out of 137 countries in the basic infrastructure category in Global
Competitiveness Index 2017-18. Therefore, it is suspected that a large part of the population will
not have access to infrastructure facilities in future, if appropriate measures are not taken now.
The present infrastructure demand-supply gap needs to be addressed on priority basis. New
avenues to increase infrastructure investment may be found elsewhere, beyond the scope of public
resources. Accordingly, Pakistani government needs to adopt innovative approaches to deal with
financial constraints for infrastructure development by avoiding future debt traps. Empirical studies
suggest that public-private partnerships (PPP) may be a valuable solution to the infrastructure
challenge. Therefore, it is ascertained that PPP for infrastructure development is urgently needed
in Pakistan and an exploration of the factors helping or impeding their implementation is justified.
However, there are a few impediments in PPP implementation in Pakistan. These includes
lack of “ownership” of such projects at senior level management and a weak judicial system: there
is a lack of fast track dispute-resolution mechanises. There is no PPP legislation and sector specific
guidelines and standard model contracts. The financial system is weak such that long-term loans

7
for infrastructure development are unavailable. There is limited access to the capital market.
Institutional structure is ineffective, especially regarding political instability and inconsistency in
policy implementation. Finally, microeconomic polices are weak.
In the current literature, the majority of research focus, primarily within developed
countries, has been put on PPP procurement, management and performance of PPP projects and
service delivery. However, institutional capacity and the capacity of public and private sectors for
implementing PPP projects has been largely ignored, with only a small number of researchers
having identified the importance of institutional and public sector capacity for successful
implementation of PPP projects. A comprehensive set of criteria and methodology for evaluating
their capacity is missing. An extensive review of the available literature suggests that private sector
capacity to implement PPP programs has not been assessed so far. Therefore, no previous analytical
methodology and research technique was available to evaluate this aspect of PPP. As no studies
have been carried out to determine the capacity of institutions, public and the private sector to
implement PPP program in the context of Pakistan, this thesis therefore focuses on the determinants
of PPP implementation.
In this thesis, time series and cross-sectional primary and secondary data covering 24 years
from 1991 to 2014 was used. Primary data was collected through a survey questionnaire. Secondary
data was collected through official websites and financial reports of the government of Pakistan
and from the World Bank database. The suitability of questionnaire was verified by using factor
analysis. Cronbach’s alpha was used to test reliability and consistency among questionnaire
variables. Time series property of the data and unit root non-stationarity of variables within panel
framework was conducted by panel unit root tests. Panel cointegration tests were performed among
the variables to avoid spurious regression by utilising Persyn and Wasteland tests.
The estimated model was built up within panel vector autoregression (PVAR) framework.
The PVAR model was further extended to include qualitative policy variables to articulate the
effects of quantitative and qualitative variables in infrastructure development of Pakistan. This
model is generally known as panel vector auto regression with exogenous variables (PVAR – X).
The panel regression model was estimated by ordinary least square (OLS) and generalised least
square (GLS) methods. PVAR model was estimated by generalised method of moment (GMM).
The post-estimation analysis was performed for checking: i) economic theory consistency and sign
consistency; ii) statistical significance; iii) model adequacy; iv) goodness-of-fit tests; and v)
classical testing framework was also applied (t-test, F-test, Lagrange multiplier (LM) and Wald
testing approaches) for comparing growth parameter among panel and their interaction.

8
The estimation results showed that:
i) Institutions in Pakistan do not have the capacity for managing PPP program. The private
sector not only lacks the capacity for participating and managing PPP projects but also are a barrier
to infrastructure development;
ii) The public sector has an influence on PPP undertakings for infrastructure development
but the sector cannot attract private sector investment due to lack of managerial, financial and
monitoring capacity. Further, the public sector does not have the capacity for mitigating project-
related risks.
iii) Other factors (barriers) for implementing PPP in Pakistan were also identified, which
are: a) lack of good governance – administrative formalities and ambiguous rules and regulations;
b) delays/deficiencies in project execution; c) public and private sectors do not have PPP related
experience and qualification; and d) feasibility studies and projections for PPP projects are
unrealistic.
This thesis contributes to both theoretical and practical aspects of PPP implementation in
Pakistan. The findings provide valuable insights on how and why PPP model may or may not work
effectively in different institutional settings. These contributions extend the theoretical literature
related to PPP implementation, especially in developing economies, and provides policy guidance
for the government to remove barriers for implementing and encouraging PPP undertakings in
Pakistan. The findings provide guidelines for PPP implementation in Pakistan and the methodology
used can be extended to other developing countries and/or multi-country studies for generating
useful comparisons and revealing more useful information.
Keywords: Public private partnerships, Fiscal Responsibility and Debt Limitation Act
2005, panel vector autoregression, ordinary least square, generalised least square, Lagrange
multiplier.
9
Table of Contents Chapter One: Introduction ....................................................................... 23
1.1 Background ....................................................................................................... 23
1.2 Pakistan: Infrastructure investment as a percentage of GDP ............................ 25 1.3 Current state of private investment in Pakistan ................................................ 26
1.3.1 Weak institutional arrangements .................................................................... 27 1.3.2 Lack of expertise ............................................................................................ 28 1.3.3 Lack of adequate regulatory framework ......................................................... 29
1.4 Justification for the Thesis ................................................................................ 29
1.4.1 Pakistan’s Current Infrastructure Status ......................................................... 29
1.4.2 Scarcity of finance/loans ................................................................................ 30 1.4.3 Brief introduction to PPP................................................................................ 31 1.5 Research questions and objectives .................................................................... 32 1.6 Methodology ..................................................................................................... 33 1.7 Econometrics to verify the results .................................................................... 35
1.8 Organisation of the Thesis ................................................................................ 35
Chapter Two: Current Status of Infrastructure in Pakistan ................ 37
2.1 Defining infrastructure ...................................................................................... 37
2.1.1 Infrastructure improves standard of living ..................................................... 38
2.1.2 Infrastructure has positive effects on business ............................................... 39 2.2 Overview: ownership/control of Pakistani’s infrastructure assets across each sector 39
2.2.1 Population and GDP Trends ........................................................................... 41 2.2.2 Telecommunications....................................................................................... 42
2.2.3 Power (Electricity) Access and Consumption ................................................ 43 2.2.4 Transport Infrastructure .................................................................................. 45
2.2.5 Implications of Infrastructure Deficiencies .................................................... 50 2.2.6 Summary......................................................................................................... 53 2.3 Infrastructure investment planning, policies and trend in Pakistan .................. 56
2.3.1 Telecommunications....................................................................................... 59
2.3.2 Power .............................................................................................................. 60 2.3.3 Transport......................................................................................................... 66 2.4 Causes of insufficient infrastructure facilities in Pakistan ................................ 71
2.4.1 Lack of managerial capacity and skilled human resources ............................ 71 2.4.2 Lack of financial resources and budgetary constraints ................................... 72 2.5 Infrastructure projects financing models .......................................................... 74
2.5.1 Possible options for Pakistan to finance infrastructure facilities .................... 74
2.5.2 Infrastructure project financing structure in Pakistan .................................... 78 2.6 The way forward ............................................................................................... 86
Chapter Three: Literature Review ........................................................... 87
3.1 Evolution of public-private partnerships .......................................................... 87 3.2 Origin of PPP .................................................................................................... 87
3.3 Current situation ............................................................................................... 92

10
3.4 Definition and characteristics of PPP ............................................................... 97
3.5 Evaluation of PPP ............................................................................................. 99
3.5.1 Advantages/benefits/value of PPP .................................................................. 99 3.5.2 Weaknesses/disadvantages of PPP ............................................................... 102 3.5.3 Contribution of PPP to economic growth ..................................................... 105 3.6 Implementation of PPP ................................................................................... 108
3.6.1 Essential ingredients to carry out PPP .......................................................... 108
3.6.2 Barriers to implementation of successful PPP in infrastructure development123 3.6.3 PPP studies in the context of South Asia...................................................... 126 3.7 Role of institutions and private-sector participation in infrastructure development 126 3.8 Review of investment theories ........................................................................ 133
3.8.1 Neoclassical theory of investment (NTI) ..................................................... 133 3.8.2 Keynesian investment theory ....................................................................... 134 3.8.3 Post-Keynesian investment theory ............................................................... 135 3.8.4 Conclusion of investment theories ............................................................... 138
3.9 Scope of the literature review ......................................................................... 140 3.10 Literature review conclusions ......................................................................... 141
3.10.1 Concluding remarks...................................................................................... 142 3.10.2 PPP is a valuable solution to the current infrastructure challenges in Pakistan142
3.11 Identification of literature gaps ....................................................................... 143
Chapter Four: Research Methodology ................................................... 146
4.1 Conceptual Considerations ............................................................................. 146
4.2 Research questions and research hypotheses .................................................. 148
4.3 Research Methodology ................................................................................... 152 4.4 Estimation approaches .................................................................................... 156
4.4.1 Primary (qualitative) data collection ............................................................ 158 4.4.2 Secondary data collection (Quantitative) ..................................................... 159 4.5 Data 165
Chapter Five: The Survey and Preliminary Results ............................. 167
5.1 The Survey ...................................................................................................... 167
5.1.1 The questionnaire ......................................................................................... 167
5.1.2 Administration of the survey ........................................................................ 170 5.1.3 Challenges in the initial data collection........................................................ 171
5.2 Descriptive statistics and preliminary results ................................................. 173
5.2.1 Description of the survey participants (Question set 1 and 2) ...................... 173 5.2.2 The importance of infrastructure (Question set 3-A) ................................... 175 5.2.3 Infrastructure and the economic growth of Pakistan (Question set 3-B) ..... 177 5.2.4 Private sector investment and the performance of public organisations ...... 178
5.2.5 Public sector capacity to manage PPP programs in Pakistan ....................... 180 5.2.6 Private sector capacity to manage PPP programs in Pakistan ...................... 182 5.2.7 Sector-wide institutional capacity to manage PPP programs in Pakistan .... 184 5.2.8 Industry-wide institutional capacity to manage PPP programs in Pakistan . 186 5.2.9 Sector-wide availability of guidance materials ............................................ 188

11
5.2.10 Barriers to PPP program implementations in the telecommunications industry189
5.2.11 Barriers to PPP program implementations in the power industry ................ 192
5.2.12 Barriers to PPP programs implementations in the transport industry .......... 195 5.3 Summary of the survey results ........................................................................ 197
Chapter Six Empirical Results and Interpretation................................ 198
6.1 Data analysis for quality test of the instrument .............................................. 198
6.1.1 Factor analysis .............................................................................................. 199 6.1.2 Cronbach alpha ............................................................................................. 200 6.2 Quantitative data analysis ............................................................................... 201
6.2.1 Panel unit root tests ...................................................................................... 201
6.2.2 Panel Cointegration test ................................................................................ 202
6.3 Estimation of panel regression ........................................................................ 203
6.3.1 Estimation of random effects panel regression of log differenced series ..... 204 6.4 Estimation of panel regression with exogenous variables .............................. 206
6.4.1 Estimation of panel regression of log differenced series with exogenous variables ............................................................................................................... 206
6.5 Estimation of PVAR model ............................................................................ 211
6.5.1 Estimation of PVAR in difference with historical variables ........................ 211
6.6 Estimation of PVAR in difference with exogenous variables (PVAR-X) ...... 215
6.6.1 Empirical results PVAR – X total investment ............................................ 215
6.6.2 Empirical results PVAR – X private investment .......................................... 223 6.6.3 Empirical results PVAR – X public investment ........................................... 230 6.7 Hypotheses tests for the research questions .................................................... 236
6.7.1 Hypotheses test results of random effects Panel regression model .............. 236 6.7.2 Hypotheses test results in Panel vector auto regression combining with survey
data (PVAR-X) model ......................................................................................... 240 6.8 Summary of empirical results ......................................................................... 243
Chapter Seven Conclusions ...................................................................... 245
7.1 Findings and conclusions ................................................................................ 245
7.1.1 Findings ........................................................................................................ 245 7.1.2 Conclusions .................................................................................................. 247
7.2 Significance and contributions........................................................................ 247
7.2.1 Contribution to research methodology ......................................................... 248
7.2.2 Contribution to the policy debate ................................................................. 249 7.3 Implications .................................................................................................... 249 7.4 Limitations and future research ...................................................................... 249
Appendices ................................................................................................. 250
Appendix I: Credit rating tiers ................................................................... 251
Appendix II: Rating tier definitions ............................................................ 252
Appendix III: Public sector survey questionnaire ..................................... 253
Appendix IV: Private sector survey questionnaire .................................... 261

12
Appendix V: Information sheet of survey questionnaire .......................... 269
Appendix VI: Factor analysis results along with scree plots .................... 270
Appendix VII: Panel unit root tests on log series....................................... 278
Appendix VIII: Random effects panel regression estimation of log differenced of total investment – The GLS estimation .......................... 279
Appendix IX: Random effects panel regression of log differenced of private investment – The GLS estimation ............................................................ 280
Appendix X: Random effects panel regression of log differenced of public investment – The GLS estimation ............................................................ 281
Appendix XI: Random effects panel regression of log differenced series and series and exogenous variable total investment– The GLS estimation 282
Appendix XII: Random effects panel regression with log differenced series and exogenous variable private investment– The GLS estimation ...... 283
Appendix XIII: Random effects panel regression with log differenced series and exogenous public investment– The GLS estimation ....................... 284
Appendix XIV: Impulse Response Function of PVAR – X Investment Shock to Total Investment ................................................................................... 285
Appendix XV: Impulse Response Function of PVAR – X Investment Shock to Real GDP 287
Appendix XVI: Impulse Response Function of PVAR – X Investment Shock to Interest Rate .......................................................................................... 289
Appendix XVII: Impulse Response Function of PVAR – X Private Investment Shock to Private Investment ................................................ 291
Appendix XVIII: Impulse Response Function of PVAR – X Private Investment Shock to Real GDP ................................................................ 293
Appendix XIX: Impulse Response Function of PVAR – X Private Investment Shock to Interest Rate ............................................................................... 295
Appendix XX: Impulse Response Function of PVAR – X Public Investment Shock to Public Investment ...................................................................... 297
Appendix XXI: Impulse Response Function of PVAR – X Public Investment Shock to Real GDP .................................................................................... 299
Appendix XXII: Impulse Response Function of PVAR – X Public Investment Shock to Interest Rate ............................................................................... 301
References .................................................................................................. 303

13
List of Tables
Table 1.1: Comparison of population growth rate (%) of Pakistan and South Asian countries 1960-2017 23 Table 1.2: Pakistan’s financial indicators (as percentage of GDP) 26 Table 1.3: Comparison of domestic credit to private sector (% of GDP) in South Asian countries 1990-2017 27 Table 1.4: Comparison of urbanisation across South Asian countries at 2015 30 Table 1.5: Pakistan’s ranking in the basic determinants of GCI 30 Table 1.6: Overview of the research design and thesis contribution 34 Table 2.1: Comparative Indicators of Infrastructure across South Asian Countries 40 Table 2.2: Population growth and GDP from 1960 to 2015 41 Table 2.3: Comparative data of telecommunication from 1960 to 2015 42 Table 2.4: Comparative access and consumption data for the power sector from 1960 to 2015 44 Table 2.5: Comparative data for the road sector from 1960 to 2015 45 Table 2.6: Comparative data for the railways sector from 1960 to 2015 48 Table 2.7: Comparative data for aviation from 1960 to 2015 49 Table 2.8: Comparative data for seaports from 1960 to 2015 50 Table 2.9: Major events in Pakistan since independence at a glance 52 Table 2.10: Comparison of infrastructure across South Asian countries at 2015 55 Table 2.11: Details of Five-Year Development Plan 57 Table 2.12: IPPs power projects announced by the Government of Pakistan 62 Table 2.13: List of Power Plants that have Started Operation since 2015 65 Table 2.14: Detail of Seaports in Pakistan 69 Table 2.15: Public Debt as percentage of GDP 73 Table 2.16: Debt credit rating of Pakistan 74 Table 2.17: Broad Sectoral Allocations of Federal PSDP 2011-12 and 2012-13 (Rs Billion) 79 Table 2.18: Private Sector Participation in Infrastructure in Pakistan from 1990 to 2011 (US$ million) 84 Table 2.19: Private Participation in Infrastructure Development by Region from 1990 to 2011 (US$ million) 85 Table 3.1: Common features of PPP definitions 99 Table 3.2: Advantages/benefits/value of PPP 101 Table 3.3: Disadvantages/weaknesses of PPP 103 Table 3.4: Key elements for PPP program implementation in Mexico 109 Table 3.5: Key challenges for PPP program implementation in Mexico 109 Table 3.6: Indicators of financial development 119 Table 3.7: Functional classification of capacity 120 Table 3.8: Level classification of capacity 121 Table 3.9: Summary of major success factors of PPP implementation 122 Table 3.10: Generic barriers in PPP implementation 124 Table 3.11: Pakistan’s overall score and rank in Global Competitiveness Index 2007-08 to 2017- 18 131 Table 3.12: Comparison of GCI 2017-18 in South Asian countries (Score out of 7, Rank out of 138) 132 Table 4.1: Summary of quantitative variables for the period 1991-2014 166 Table 5.1: Sector-wide detail of data collection 173 Table 5.2: Industry-wide detail of data collection 173 Table 5.3: Descriptive statistics of participants 174 Table 5.4: Infrastructure and performance of your organisation 176 Table 5.5: Infrastructure and the economic growth of Pakistan 177 Table 5.6: Private sector investment and the performance of your (public) organisation 179

14
Table 5.7: Public sector capacity to manage PPP program in Pakistan 180 Table 5.8: Public sector capacity to manage PPP programs in Pakistan 181 Table 5.9: Private sector capacity to manage PPP programs in Pakistan 182 Table 5.10: Private sector capacity to manage PPP programs in Pakistan 183 Table 5.11: Sector-wide institutional capacity to manage PPP programs in Pakistan 184 Table 5.12: Sector-wide institutional capacity to manage PPP programs in Pakistan 185 Table 5.13: Industry-wide institutional capacity to manage PPP programs in Pakistan 186 Table 5.14: Industry-wide institutional capacity to manage PPP programs in Pakistan 187 Table 5.15: Industry-wide availability of guidance materials 188 Table 5.16: Barriers to implementing PPP programs in the telecommunications industry 190 Table 5.17: Barriers to implementing PPP program in telecommunications industry 191 Table 5.18: Barriers to implementing PPP programs in the power industry 193 Table 5.19: Barriers to implementing PPP programs in the power industry 194 Table 5.20: Barriers to implementing PPP programs in the transport industry 195 Table 5.21: Barriers to implementing PPP programs in the transport industry 196 Table 6.1: Question X1 retains one factor 199 Table 6.2: Cronbach for checking internal consistency and reliability of the items in the questionnaire 200 Table 6.3: Panel cointegration tests of total investment (public and private) 202 Table 6.4: Panel cointegration tests of private investment 202 Table 6.5: Panel cointegration tests of public investment 203 Table 6.6: Hausman test random effects versus fixed effects 203 Table 6.7: Eigenvalue for stability condition 212 Table 6.8: Eigenvalue for stability condition 213 Table 6.9: Eigenvalue for stability condition 214 Table 6.10: Empirical results of PVAR – X (investment, GDP, and IR are the dependent variables list with exogenous variables) model estimated by GMM 215 Table 6.11: Eigenvalue for stability condition 217 Table 6.12: Granger causality test in PVAR investment 218 Table 6.13: Forecast-error variance decomposition 219 Table 6.14: Responses of investment, real GDP and interest rate due to shock in investment 220 Table 6.15: Responses of investment, interest rate and real GDP due to shock in real GDP 221 Table 6.16: Responses of investment, real GDP and interest rate due to shock in interest rate 222 Table 6.17: Empirical results PVAR – X (private investment, GDP, and IR are in the dependent variable list) with exogenous variables estimated by GMM 223 Table 6.18: Eigenvalue for stability condition 224 Table 6.19: Granger causality test in PVAR: private investment 225 Table 6.20: Forecast-error variance decomposition 226 Table 6.21: Responses of private investment, real GDP and interest rate due to shock in private investment 227 Table 6.22: Responses of private investment, interest rate and real GDP due to shock in real GDP 228 Table 6.23: Responses of private investment, real GDP and interest rate due to shock in interest rate 229 Table 6.24: Empirical results of PVAR – X (public investment, GDP, and IR are the dependent variables with exogenous variables) model estimated by GMM. 230 Table 6.25: Eigenvalue for stability condition 232 Table 6.26: Granger causality test in PVAR 232 Table 6.27: Forecast-error variance decomposition 233 Table 6.28: Responses of public investment, real GDP and interest rate due to shock in public investment 234 Table 6.29: Responses of public investment, interest rate and real GDP due to shock in real GDP. 235 Table 6.30: Responses of public investment, real GDP and interest rate due to shock in interest rate236

15
List of Figures
Figure 1.1: Comparison of population growth rates (%) of Pakistan and South Asia 1960-2017 24 Figure 1.2:Infrastructure investment in Pakistan 1960 – 2016 by percentage of GDP 25 Figure 1.3: Comparison of domestic credit to private sector (% of GDP) in South Asian countries 1990-2017 28 Figure 2.1: Global ICT developments, 1998-2009 43 Figure 2.2: Inadequate transport facilities 46 Figure 2.3: Underdeveloped road infrastructure 46 Figure 2.4: Inadequate railways transport facilities 47 Figure 2.5: Miserable sewage system 47 Figure 2.6: Geographical map of Pakistan 49 Figure 2.7: Bill recoveries and loss reduction (%) 64 Figure 2.8: Total infrastructure investment (public and private) from 1981 to 2009 as percent of GDP 81 Figure 2.9: Electricity sector investment (public and private) from 1981 to 2009 as percent of GDP 82 Figure 2.10: Transportation and communication sector investment (public and private) from 1981 to 2009 as percent of GDP 83 Figure 3.1: Copy of contract of Philadelphia and Lancaster Turnpike Road 90 Figure 3.2: Image of Philadelphia and Lancaster Turnpike Road 91 Figure 3.3: Key elements in creating a PPP enabling environment focusing on India 110 Figure 3.4: Comparison of political stability in South Asian countries in 2016 116 Figure 3.5: Problem Tree Analyses of PPP 123 Figure 3.6: The 12 pillars/3 stages of competitiveness 130 Figure 3.7: Comparison of GCI 2017-18 in South Asian countries (Overall Score 7) 131 Figure 3.8: Summary of existing PPP research 143 Figure 4.1: Possible interrelationship 147 Figure 4.2: Flowchart of estimation approaches 157 Figure 5.1: Administration of survey questionnaire 172 Figure 5.2: Public sector capacity to manage PPP program in Pakistan 181 Figure 5.3: Public sector capacity to manage PPP programs in Pakistan 182 Figure 5.4: Sector-wide institutional capacity to manage PPP programs in Pakistan 185 Figure 5.5: Industry-wide institutional capacity to manage PPP programs in Pakistan 187 Figure 5.6: Industry-wide availability of guidance materials 189 Figure 5.7: Barriers to implementing PPP programs in the telecommunications industry 191 Figure 5.8: Barriers to implementing PPP programs in the power industry 194 Figure 5.9: Barriers to implementing PPP programs in the transport industry 196 Figure 6.1: Scree plot of eigenvalues after factor 199 Figure 6.2: Eigenvalue for stability condition 212 Figure 6.3: Eigenvalue for stability condition 213 Figure 6.4: Eigenvalue for stability condition 214 Figure 6.5: Eigenvalue for stability condition 217 Figure 6.6: Eigenvalue for stability condition 225 Figure 6.7: Eigenvalue for stability condition 232

16
List of Abbreviations and Acronyms
ADF Augmented Dickey-Fuller
AIC Akaike Information Criterion
APEC Asia-Pacific Economic Cooperation
BLT Build-Lease-and-Transfer
BOO Build-Own-and-Operate
BOT Build-Own-and-Transfer
BTO Build-Transfer-and-Operate
CAGR Compounded Annual Growth Rate
CSF Critical Success Factor
DFBOT Design, Finance, Build, Operate and Transfer
ECM Error-Correction Mechanism
AIC Akaike Information Criterion
GCI Global Competitiveness Index
GFCF Gross Fixed Capital Formation
ICT Information and communication technology
IMU Infrastructure Management Unit
IPDF Infrastructure Project Development Facility
IPK Institutionalist and Post-Keynesian
KICT Karachi International Container Terminal
KM Kilometer
KPT Karachi Port Trust
KWH Kilowatt-Hour
MDGs Millennium Development Goals
MoF Ministry of Finance
MW Mega Watt
NC Neoclassical
NK Neo-Keynesian
NTI Neoclassical Theory of Investment
OECD The Organisation for Economic Co-operation and Development
PVAR Panel vector Auto Regression
PFI Private Finance Initiative

17
PICT Pakistan International Container Terminal
PK Post-Keynesian
PPIB Private Power & Infrastructure Board
PPP, P3,3P Public-Private Partnerships
PPPIRC Public-Private-Partnership in Infrastructure Resource Centre
PSC Public Sector Competitor
PSDP Public Sector Development Program
ROO Rehabilitate-Own-and-Operate
ROT Rehabilitate-Operate-and-Transfer
Rs Rupees
T&D Transmission and Distribution
UNECE United Nations Economic Commission for Europe
UNESCAP United Nations Economic and Social Commission for Asia and the Pacific
VGF Viability Gap Funding
VoF Value for Money
WEF World Economic Forum

18
Glossary of Technical Terms
Animal Spirits This term was used by the British economist, John Maynard Keynes, to explain
financial and buying decisions in conditions of uncertainty. In Keynes’ 1936
publication, The General Theory of Employment, Interest and Money, “animal
spirits” describe the human emotion that drives consumer confidence.
Business Cycle
The business cycle is also known as the trade cycle or economic cycle. It is the
upward and downward movement of GDP and unemployment in its long-term
trend (Alan, 2006). Business cycles are usually measured by considering the
growth rate of real GDP.
Circular Debt Circular debt is a kind of debt where all members are both a creditor and a
debtor. Every individual owes to someone and the net final creditor in the chain
is indebted to the first creditor. At the end balance of all debts between
individuals is zero (Nikbakht, 2006).
Credit Rating An independent assessment of the likelihood of credit default of an enterprise
or undertaking by a credit rating agency. A credit rating is assigned and this
plays an important role in the pricing of the rated enterprise’s securities
(Regan, 2010).
Crowding in
An economic principle in which private investment increases as debt-financed
government spending increases. This is caused by government spending
boosting the demand for goods, which in turn increases private demand for
new output sources, such as factories. This is in contrast to crowding out.
Crowding out
The principle that high levels of public sector activity in the economy (such as
increased public expenditure) have an adverse impact on private sector
demand. This can also apply to markets where Keynesian style budget deficits
increase Treasury activity in the capital market, which increases interest rates
and so “crowds out” private activity such as capital raisings, investment and
expenditures.
Enabling
Environment
A supportive policy, legal, institutional, macro-economic, infrastructural and
bureaucratic environment. Businesses have difficulty functioning when their
trading activities are hampered by excessive bureaucracy. When the judicial
system does not function well and laws are not well drafted, this can distort
19
and reduce the efficiency of the market, increase the costs of doing business
and retard the development of a competitive private sector. Traders and others
are generally reluctant to make investments in an uncertain policy climate,
such as those that restrict imports and exports or internal produce movement.
Ex-Ante The term is derived from the Latin for “before the event” and refers to future
events, such as future returns (expected return of an investment portfolio) or
prospects of a company. For example, an ex-ante analysis is done when an
investment company values a stock ex-ante and then compares the predicted
results to the actual movement of the stock’s price.
Expansionary
Monetary
policy
Monetary policy is the process by which the monetary authority of a country,
typically the central bank, controls the monetary base or cost of very short-term
borrowing. It targets the inflation rate or interest rate to ensure price
stability and general trust in the currency.
Monetary policy is referred to as being either expansionary or contractionary.
The expansionary monetary policy tool is used to stimulate the economy and
maintain short-term interest rates at lower than usual rates to control
unemployment and increase aggregate demand for all goods and services in an
economy or to increase total supply of money more rapidly than usual.
Expansionary monetary policy decreases the value of the currency relative to
other currencies (the exchange rate).
Contractionary monetary policy is the opposite of expansionary monetary
policy. It is used to increase interest rates higher than usual, thus slowing the
rate of growth in the money supply. Consequently, it slows short-term
economic growth and lessens inflation. However, contractionary monetary
policy leads to increased unemployment and depressed borrowing and
spending by consumers and businesses, which can eventually result in an
economic recession if implemented too vigorously.
Gross Fixed
Capital
Formation
Government/private expenditure on fixed assets, additions and replacements,
and upgradation of existing fixed assets (excluding repairs and maintenance).
Incomplete
Contract
A contract whereby some aspects of the future are not observable or capable
of resolution at the time of the contract was entered into and writing-up the

20
contract to address all future responsibilities is too costly, impractical or
unachievable (Regan, 2010).
Public Sector
Competitor
A public sector competitor (PSC) is an estimate of what the project would cost
if traditional procurement methods were used while still meeting the
performance standards expected from the private sector deal over the life of
the contract. A PSC is normally used to determine whether private finance
offers better value for money than traditional procurement.
Sovereign Debt A central government’s debt. This debt is issued by a national government in
a foreign currency in order to finance the issuing country’s growth and
development. Sovereign debt is also called government debt, public debt and
national debt.
Turnpike Road with turnpike – in former times, a road that travellers were allowed to
use only after paying a toll at the turnpike.
Road barrier – a gate formerly used to bar the way on to a section of road or a
bridge until a toll had been paid.
Toll road – in the United States, a motorway on which a toll is charged. Drivers
usually receive a ticket when they start their journey and pay a fee at the end
that depends on the length of journey.
Unitary
Charges
A payment refers to a fixed charge per unit of production under a long-term
contract to supply a service. For example, under a PPP arrangement for a
hospital, the private operator is required to furnish a minimum number of fully
serviceable beds together with linen and support equipment to the hospital each
day. The cost of providing and maintaining the beds is the responsibility of the
contractor who is paid a quarterly unitary or availability charge based on bed
availability.
User Charges The imposition of fees and charges for the use of certain public goods and state-
owned utilities. Examples include fees applied for admission to council car
parks, highways, art galleries and national or state parks and flora/fauna
reserves.
Value for
Money
Value of money is generally defined as “the best possible outcome at the lowest
possible price” (Linda, 2006). Value for money is the optimum combination
of whole-life cost and quality (or fitness for purpose) to meet a user’s
requirement and does not always mean choosing the lowest cost bid. It should

21
not be chosen to secure a particular balance sheet treatment (HM Treasury
2004, p.3). The Partnerships Victoria (2001) approach to value for money is:
• Risk transfer – relieving government of the substantial, but often
undervalued, cost of asset-based risks;
• Whole-of-life – whole-of-life costing, fully integrating under the
responsibility of one party;
• Up-front – design and construction costs, with ongoing service delivery,
operational, maintenance and refurbishment costs;
• Innovation – providing wider opportunity and incentive for innovative
solutions for how service requirements can be delivered; and
• Asset utilisation – developing opportunities to generate revenue from use
of the asset by third parties, which may reduce the cost that government
would otherwise have to pay as a sole user.
Viability Gap
Funding
Targeted subsidies provided by government for PPP projects that are
economically and socially justified but financially unviable.
22
Personal Statement
I have had more than 17 years of diversified work experience in both private sector
organisations and the public sector in various federal ministries at different positions in
Pakistan. As a result of my experience, I realised that the country is unable to achieve its
economic goals without well-established infrastructure. Financial constraint is the major
impediment to infrastructure development, combined with other problems such as poor
infrastructure planning, policy and management and the lack of research into alternative sources
of infrastructure financing. This thesis is intended to provide both theoretical and policy-related
contributions to inform future infrastructure funding decisions. In this context, the thesis
focuses on how private sector participation in terms of PPP can be a part of the solution to
infrastructure financing and management problems. However, inexperienced institutional
frameworks and lack of public and private sector capability are major barriers to implement an
efficient PPP programs. These challenges motivated me to develop expertise in the field of
infrastructure development through private sector participation.
I have experience working with both the public and the private sector in Pakistan and
over the years I have developed associations with public and private sector organisations.
Therefore, I have access to bureaucracy, public sector record/reports and many private sector
organisations in Pakistan for research purposes. This research is expected to provide in-depth
an analysis of the determinants of PPP performance in Pakistan in order to promote its economic
growth.

23
Chapter One: Introduction 1.1 Background
Pakistan’s population grew by 1.954% in 2017, the highest population growth rate
among South Asian countries (The World Bank, 2018) (Table 1.1 and Figure 1.1). Rapidly
increasing population growth is putting pressure on infrastructure services. Consequently, the
gap between infrastructure services demand and supply is widening continuously (Bjorvatn,
2000). Conversely, Pakistan’s economic growth and development has remained unsustainable
mainly because of insufficient physical and social connectivity and inappropriate use of
economic growth software that drives the growth rate on a sustained basis. The software
includes effective governance mechanisms, better organisation of institutions, efficient
management of physical infrastructure, and human capital development in relation to globally
successful experiences (Planning Commission, 2012).
This thesis identifies the key determinants of PPP performance for developing physical
infrastructure, including telecommunication, power and transport, with reference to Pakistan.
Table 1.1: Comparison of population growth rate (%) of Pakistan and South Asian countries 1960-2017
Year Pakistan Bhutan Bangladesh India Nepal Sri Lanka 1960 2.291 2.501 2.846 1.947 1.566 2.395 1965 2.577 2.846 3.101 2.074 1.715 2.376 1970 2.702 3.246 2.538 2.205 1.990 2.193 1975 2.912 3.205 2.014 2.321 2.165 1.858 1980 3.255 2.922 2.780 2.304 2.277 1.658 1985 3.397 2.923 2.683 2.254 2.278 1.422 1990 2.912 1.316 2.469 2.074 2.462 1.272 1995 2.522 -0.315 2.150 1.921 2.505 0.819 2000 2.276 2.807 1.958 1.774 1.849 0.603 2005 2.054 2.523 1.492 1.584 1.299 0.782 2010 2.080 1.828 1.120 1.367 1.049 0.612 2015 2.045 1.399 1.120 1.168 1.169 0.934 2017 1.954 1.227 1.049 1.127 1.106 1.130
Source: The World Bank Data (2018)

24
Figure 1.1: Comparison of population growth rates (%) of Pakistan and South Asia 1960-2017
Source: The World Bank Data (2018)
The basic physical and organisational structures and facilities (e.g. buildings, roads,
power supplies) needed for the operation of a society or enterprise is called infrastructure
(Oxford Dictionary, 2018). Infrastructure is widely recognised as an integral part of economic
growth in any economy (Lakshmanan, 2008; Zhang and Fan, 2004). It provides the core
networks for all economic and social activities. A review of international empirical evidence
points to a positive association between infrastructure investment and productive capacity,
output growth, domestic and overseas trade, lower private costs, employment, incomes and
living conditions of general public (Kevin, 2011; Paravaka and Ranjan, 2010; Naoyuki and
Masaki, 2000).
In Pakistan the gap between demand for and supply of infrastructure services is large
and widening. Between 2010 and 2015 Pakistan’s population increased by 8.83 percent while
Development Expenditure (% of GDP) decreased to 2.3%. However, inadequate infrastructure
facilities are observed to be one of the factors that have impeded Pakistan’s attempts to achieve
higher economic growth (Economic Survey of Pakistan, 1990 – 2015).
As noted above, Pakistan’s need for infrastructure development has risen in recent
decades due to increasing population and rapid urbanisation. On the other hand, gross fixed

25
capital formation1(GFCF) in Pakistan was 15 percent of GDP in 2014 and 16 percent of GDP
in 2016, which is the lowest in South Asia (World Bank Indicators, 2015 and 2017).
An increase in physical capital generates positive spillovers by providing better health,
education and transportation, accumulating productive capacity to sustain a higher output by
using modern research and techniques, and ultimately enhancing GDP growth. There is a two-
way causality between GDP and investment (Maryam and Nazima, 2012). A comparison of
infrastructure investment in Pakistan 1960-2016 is presented in Figure 1.2.
Figure 1.2:Infrastructure investment in Pakistan 1960 – 2016 by percentage of GDP
Source: The World Bank data (2018)
According to World Bank indicators 2018, the average value of infrastructure
investment in Pakistan from 1960 to 2016 was 17.43 percent of GDP, with a minimum of 11.56
percent of GDP in 1960 and a maximum of 21.47 percent of GDP in 1965.
1.2 Pakistan: Infrastructure investment as a percentage of GDP
In Pakistan, infrastructure development has traditionally been carried out through public
resources i.e. borrowing or taxpayer funded. The limited availability of public resources results
in an inability to build sufficient infrastructure to meet growing demand (Table 1.2 provides an
1 See Glossary of Technical Terms.
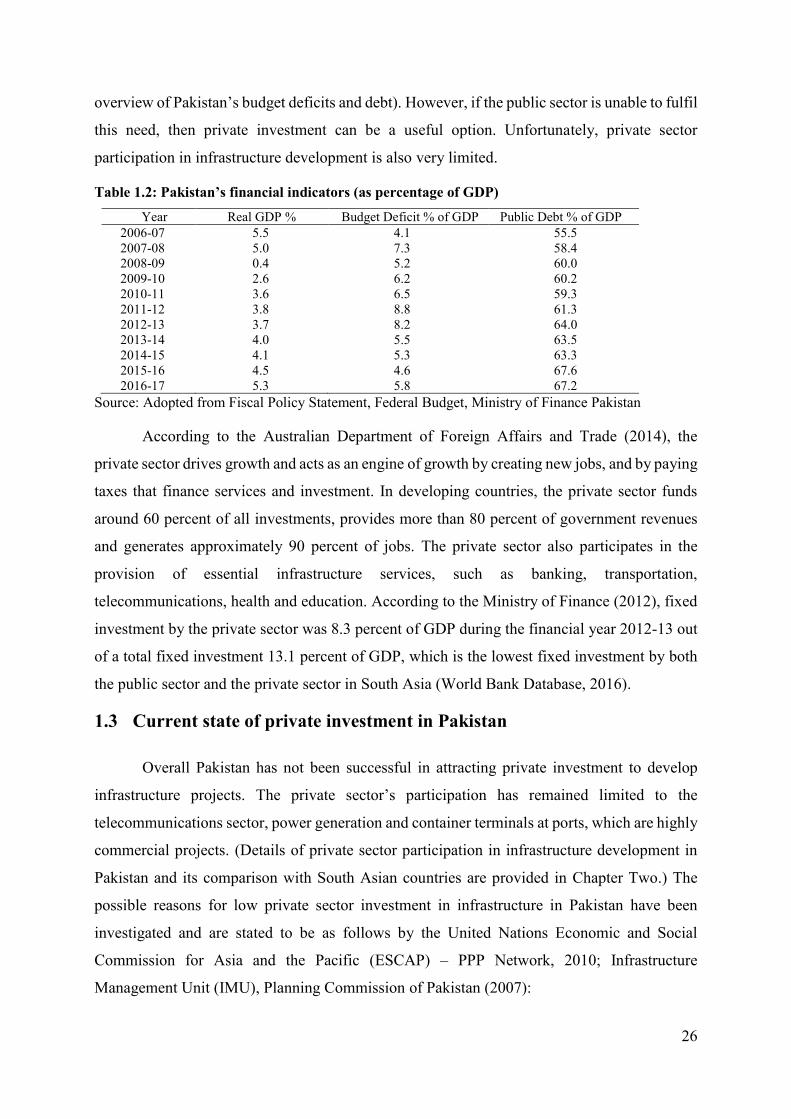
26
overview of Pakistan’s budget deficits and debt). However, if the public sector is unable to fulfil
this need, then private investment can be a useful option. Unfortunately, private sector
participation in infrastructure development is also very limited.
Table 1.2: Pakistan’s financial indicators (as percentage of GDP) Year Real GDP % Budget Deficit % of GDP Public Debt % of GDP
2006-07 5.5 4.1 55.5 2007-08 5.0 7.3 58.4 2008-09 0.4 5.2 60.0 2009-10 2.6 6.2 60.2 2010-11 3.6 6.5 59.3 2011-12 3.8 8.8 61.3 2012-13 3.7 8.2 64.0 2013-14 4.0 5.5 63.5 2014-15 4.1 5.3 63.3 2015-16 4.5 4.6 67.6 2016-17 5.3 5.8 67.2
Source: Adopted from Fiscal Policy Statement, Federal Budget, Ministry of Finance Pakistan
According to the Australian Department of Foreign Affairs and Trade (2014), the
private sector drives growth and acts as an engine of growth by creating new jobs, and by paying
taxes that finance services and investment. In developing countries, the private sector funds
around 60 percent of all investments, provides more than 80 percent of government revenues
and generates approximately 90 percent of jobs. The private sector also participates in the
provision of essential infrastructure services, such as banking, transportation,
telecommunications, health and education. According to the Ministry of Finance (2012), fixed
investment by the private sector was 8.3 percent of GDP during the financial year 2012-13 out
of a total fixed investment 13.1 percent of GDP, which is the lowest fixed investment by both
the public sector and the private sector in South Asia (World Bank Database, 2016).
1.3 Current state of private investment in Pakistan
Overall Pakistan has not been successful in attracting private investment to develop
infrastructure projects. The private sector’s participation has remained limited to the
telecommunications sector, power generation and container terminals at ports, which are highly
commercial projects. (Details of private sector participation in infrastructure development in
Pakistan and its comparison with South Asian countries are provided in Chapter Two.) The
possible reasons for low private sector investment in infrastructure in Pakistan have been
investigated and are stated to be as follows by the United Nations Economic and Social
Commission for Asia and the Pacific (ESCAP) – PPP Network, 2010; Infrastructure
Management Unit (IMU), Planning Commission of Pakistan (2007):

27
1.3.1 Weak institutional arrangements
Debt financing for infrastructure projects is very limited/unavailable due to the long
development period needed to construct and commission projects, during which there is little
financial return. Infrastructure projects typically require long-term investment (10-20 years
approximately). Therefore, traditional lending resources (commercial banks) do not offer long-
term loans facilities for large infrastructure projects. Bank credit provided to the private sector
in Pakistan during 1990 to 2017 reached its lowest point of 15.39 percent of GDP in 2015,
which is also the lowest among South Asian countries (The Global Economy.com, The World
Bank). Table 1.3 and Figure 1.3 provide a comparison of domestic credit to the private sector
as percentage of GDP in Pakistan and South Asia during 1990-2017. Domestic credit to the
private sector refers to financial resources provided to the private sector by financial
corporations, such as through loans, purchases of non-equity securities and trade credits and
other accounts receivable, that establish a claim for repayment (The World Bank, 2018).
Table 1.3: Comparison of domestic credit to private sector (% of GDP) in South Asian countries 1990-2017
Year Pakistan Bangladesh Bhutan India Nepal Sri Lanka 1990 24.16 16.07 4.11 25.25 12.81 19.62 2000 22.34 21.78 8.85 28.72 30.67 28.83 2008 28.73 34.04 29.96 50.06 51.65 29.54 2009 22.72 36.19 32.42 48.78 59.18 25.74 2010 21.41 40.96 41.45 51.14 54.59 25.52 2011 18.13 42.47 46.81 51.29 52.95 35.01 2012 16.94 43.00 45.72 51.89 56.13 35.02 2013 16.12 41.79 45.64 52.39 58.03 34.75 2014 15.59 43.74 43.82 51.88 61.90 35.87 2015 15.39 44.41 45.19 51.90 64.75 41.60 2016 16.53 45.28 47.02 49.55 81.05 45.71 2017 17.03 47.58 --- --- 81.16 ---
Source: The World Bank Data (Retrieved on 27-08-2018)

28
Figure 1.3: Comparison of domestic credit to private sector (% of GDP) in South Asian countries 1990-2017
Source: The World Bank Data (Retrieved on 27-08-2018)
1.3.2 Lack of expertise
Pakistani government departments lack knowledge and prerequisites of project finance
at an institutional level. A well-developed insurance sector can be an important long-term
financial resource for infrastructure development, like other financial institutions such as banks.
The insurance sector should facilitate investors by providing hedging facilities. A hedge is an
investment position intended to offset potential risks or losses that may be incurred by an
investor. Simply, a hedge is a risk management technique used to minimise any substantial
losses or gains suffered by an individual or an organisation. Examples of hedging include
forward exchange contracts for currencies and interest, money market operations for currencies
and bets on elections or sporting events. However, the Pakistani insurance sector is dormant
due to low levels of insurance density and penetration in the country. The domestic financial
market (commercial and industrial banks), lending companies and the stock exchange are also
not mature enough to finance infrastructure projects. The country’s capital market (a financial
market that provides long-term debt or where bonds and equity-backed securities are bought
and sold) is limited and unable to encompass the country’s overall infrastructure financing
needs. In Pakistan, private investors are not familiar with infrastructure project financing and
typically are short-term investors. They are more inclined towards projects that involve lower
investment, have shorter construction and return periods, and are highly profitable. Examples
of these include short-term stock market investors, real estate investors, gold and money market

29
investors. See, for example: (Edwards, 1998; Infrastructure Management Unit, 2007;
Investopedia, 2018; Morewedge, Tang, & Larrick, 2018).
1.3.3 Lack of adequate regulatory framework
Too many bureaucratic formalities are involved in the public procurement process. The
main bottlenecks are the complex and time-consuming procurement, approval, tendering and
bidding processes, as well as conflicts of interest, the principal-agent problem and increasing
risk of corruption. Complex rules and regulations together with official procedural requirements
are known to cause delays in project completion and cost overruns (Klijn & Teisman, 2003). In
addition, a lack of unidirectional policy frameworks and coordination at federal, provincial and
municipal levels have impeded private-sector investment in infrastructure development in
Pakistan (Infrastructure Management Unit, 2007). The existing procurement law does not have
provisions for cancelling the procurement process if there are any irregularities. There is limited
scope to make changes to the requirements once the contract has been signed, as it increases
the project cost (Podriguez, 2018). Furthermore, the division of responsibilities between the
contracting parties (public and the private sector) is unclear and ambiguous project-related risk
mitigation mechanisms have discouraged private-sector participation in infrastructure
development.
1.4 Justification for the Thesis
1.4.1 Pakistan’s Current Infrastructure Status
Pakistan is the sixth most populous country in the world, with 188.9 million people (The
World Bank, 2018). Projections suggest that it will become the fifth largest country with a
population ranging between 230 and 260 million people by 2030 (Planning Commission, 2005).
The country also has a relatively high level of urbanisation, with 37 percent of its population
living in cities, and so is the most urbanised in South Asia (Ministry of Finance, 2011).
Rapid urbanisation is claimed to place burdens on inadequate infrastructure (Bjorvatn,
2000). The rapid increase in population and urbanisation has led to the gap between
infrastructure services demand and supply widening. According to the Ministry of Finance
(2011), existing road conditions are getting worse, the power supply and sewerage and
sanitation systems are unreliable and potable water is often unavailable. A comparison of
urbanisation across South Asian countries is presented in Table 1.4.
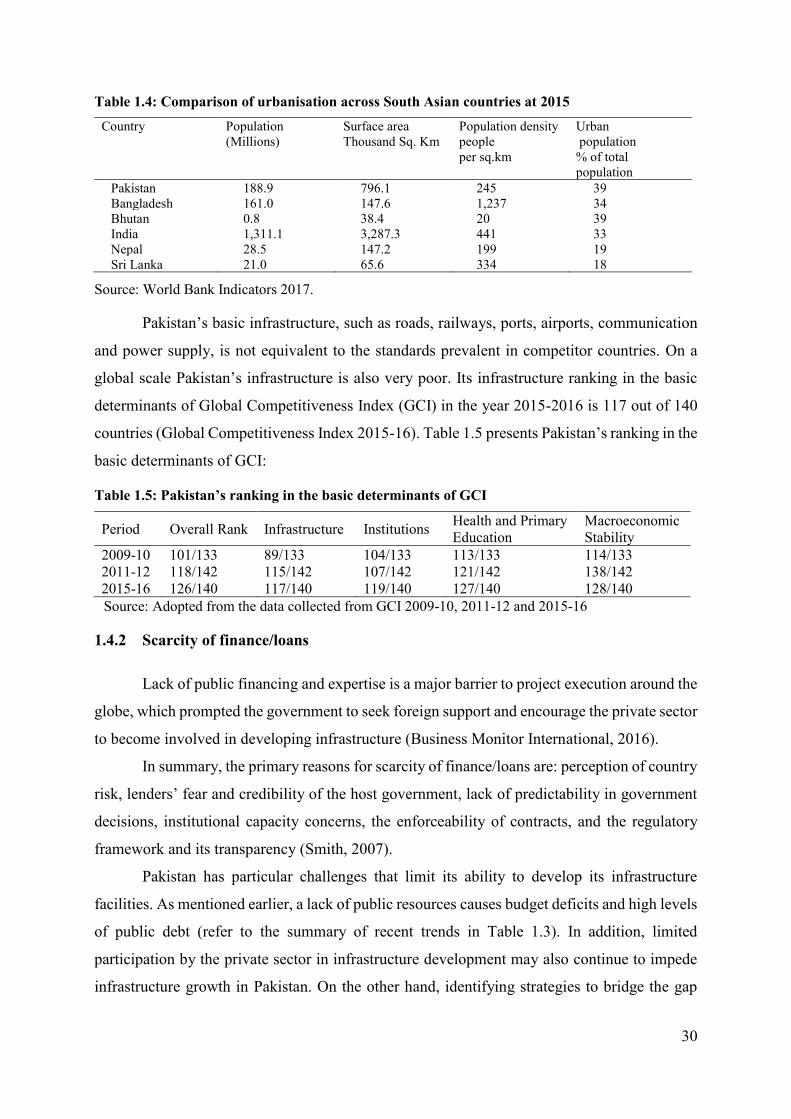
30
Table 1.4: Comparison of urbanisation across South Asian countries at 2015 Country Population
(Millions) Surface area Thousand Sq. Km
Population density people per sq.km
Urban population % of total population
Pakistan 188.9 796.1 245 39 Bangladesh 161.0 147.6 1,237 34 Bhutan 0.8 38.4 20 39 India 1,311.1 3,287.3 441 33 Nepal 28.5 147.2 199 19 Sri Lanka 21.0 65.6 334 18
Source: World Bank Indicators 2017.
Pakistan’s basic infrastructure, such as roads, railways, ports, airports, communication
and power supply, is not equivalent to the standards prevalent in competitor countries. On a
global scale Pakistan’s infrastructure is also very poor. Its infrastructure ranking in the basic
determinants of Global Competitiveness Index (GCI) in the year 2015-2016 is 117 out of 140
countries (Global Competitiveness Index 2015-16). Table 1.5 presents Pakistan’s ranking in the
basic determinants of GCI:
Table 1.5: Pakistan’s ranking in the basic determinants of GCI
Period Overall Rank Infrastructure Institutions Health and Primary Education
Macroeconomic Stability
2009-10 101/133 89/133 104/133 113/133 114/133 2011-12 118/142 115/142 107/142 121/142 138/142 2015-16 126/140 117/140 119/140 127/140 128/140 Source: Adopted from the data collected from GCI 2009-10, 2011-12 and 2015-16
1.4.2 Scarcity of finance/loans
Lack of public financing and expertise is a major barrier to project execution around the
globe, which prompted the government to seek foreign support and encourage the private sector
to become involved in developing infrastructure (Business Monitor International, 2016).
In summary, the primary reasons for scarcity of finance/loans are: perception of country
risk, lenders’ fear and credibility of the host government, lack of predictability in government
decisions, institutional capacity concerns, the enforceability of contracts, and the regulatory
framework and its transparency (Smith, 2007).
Pakistan has particular challenges that limit its ability to develop its infrastructure
facilities. As mentioned earlier, a lack of public resources causes budget deficits and high levels
of public debt (refer to the summary of recent trends in Table 1.3). In addition, limited
participation by the private sector in infrastructure development may also continue to impede
infrastructure growth in Pakistan. On the other hand, identifying strategies to bridge the gap
31
between infrastructure service demand and supply is an enormous challenge the country has to
deal with due to the importance of infrastructure development in the economy. New avenues to
increase infrastructure investment may be found elsewhere. Empirical studies suggest that PPP
may be a valuable solution to the infrastructure challenge; see, for example, (Adrias, 2010;
Pereira & Andraz, 2005; Peter, 2010).
1.4.3 Brief introduction to PPP
PPP involve the public sector authority and private sectors working together to provide
services. Under a PPP arrangement, the private sector performs a function on behalf of the
public sector for a contracted time period, and assumes financial, technical and operational risk
in the project. The private party’s compensation is based on its performance (availability of
service and quality of the service). A PPP allows each partner to concentrate on activities that
best suit their skills. For the public sector that means focusing on developing policies and
identifying service needs, while for the private sector the key is delivering those needs
efficiently and effectively [at an affordable price] (IPDF, 2006).
PPP procurement is based on output specification. In PPP procurement, the government
defines the required service and leaves the design and planning of the project to the private
party. In this way optimal risk associated with the project from the project design stage through
to operation and service delivery is transferred to the private party. In some circumstances
design requirements may not be left entirely to the discretion of the private party and the public
sector may specify some inputs (IPDF, 2006). The advantages and disadvantages of PPP will
be discussed in detail in Chapter 3. The PPP model has been successfully adopted in many
countries for various purposes including the provision of infrastructure services.
PPP programs have been successfully adopted in both developed and developing
countries such as the United Kingdom, Canada, the United States of America, Australia, Japan,
Netherlands and Hungary (European Commission Directorate-General Regional Policy, 2004;
European PPP Expertise Centre, 2012). To overcome funding shortages, developing countries
such as India, Mexico, Sri Lanka, Bangladesh and Nepal have also increasingly resorted to the
PPP approach and have successfully implemented various PPP projects.
The PPP model is financially strong and technically sound, as well as having
management efficiency, credibility and the goodwill of the partners (Bovis, 2015; Graeme,
2018; PPPIRC, 2018). Its successful implementation in many other countries suggests that it
may be a suitable model for Pakistan to explore, to see whether it can help address the country’s

32
infrastructure shortfall. Unfortunately, there do not appear to be any relevant studies on using
the PPP model in the context of Pakistan’s infrastructure development. This thesis examines
Pakistan’s capacity to use the PPP procurement model for infrastructure development and, if
capacity is lacking, what the major impediments are.
1.5 Research questions and objectives
The research questions answered by this thesis concern the major impediments to PPP
implementation in Pakistan and how they affect PPP implementation.
General Research Questions
• What is the current status of private participation in infrastructure investment in Pakistan?
If this participation is not extensive, why not?
• Has the PPP model been used effectively in Pakistan to proactively involve the private
sector in infrastructure development? If not, why not and what are the major obstacles?
• Are institutional impediments the most critical to the effective adoption of the PPP model
for infrastructure development?
• What kind of institutional arrangements are needed and how can they be developed in
Pakistan to boost PPP undertakings for infrastructure development?
A set of specific empirically testable research questions was developed in order to answer the
general research questions.
Specific Research Questions
• Does institutional capacity (IC) have an effect on PPP implementation in Pakistan?
• Do the public and private sectors in Pakistan have the capacity to implement PPP
programs?
• Do other factors have an effect on PPP implementation in Pakistan? If so, what are these
factors and what is their relative impact?
The primary objective of this thesis is to identify the main obstacles to implementing
PPP in Pakistan, focusing on institutional, public-sector and private-sector impediments along
with other factors. The findings from this research will assist in identifying policy implications
and policy adjustments that can be made to encourage greater adoption of PPP to develop
infrastructure in Pakistan.

33
Research amis are to:
• Survey the current status of infrastructure development in Pakistan
• Evaluate contributions to infrastructure development by both the public and private sectors
• Examine the causes of the lack of implementation of PPP in Pakistan
• Develop a framework that helps to establish essential institutional arrangements conducive
to PPP adoption
• Draw out implications for policy development for effective PPP implementation in
Pakistan.
1.6 Methodology
The research underpinning this thesis used both quantitative and qualitative methods to
achieve the research objectives. Quantitative techniques were used for investment analysis
relative to PPP for the period 1991 to 2014. The quantitative/secondary data was collected from
the websites and reports of government authorities and multilateral agencies. A survey
questionnaire was used to collect qualitative/primary data from public and the private sectors
to assess each sector’s capacity to implement successful PPP program. Guidance from relevant
studies conducted by researchers from both developed and developing countries has been taken
to ensure the legitimacy of the information generated. The research methodology is described
in detail in Chapter Four.
Factor analysis was used to verify the variability of the observed variables used in the
questionnaire and reliability and consistency among questionnaire variables was tested by
Cronbach’s alpha. This thesis treated infrastructures (telecom, power and transport) as a panel
and specified relationships as a panel data model. Thus, the specification of the model was via
a panel vector auto regression (PVAR) model. The statistical properties of the panel variables
were checked for stationarity of the variable by panel unit root tests. The PVAR model is useful
because it captures both static and dynamic interdependence among panel variables of interest.
PVAR with exogenous variables was used to combine the quantitative variables and the survey
responses to articulate the effects of the variables (both quantitative and qualitative) in the
infrastructural development within Pakistan. An overview of the research design and thesis
contribution is provided in Table 1.6. The methodology is discussed in detail in Chapter Four.
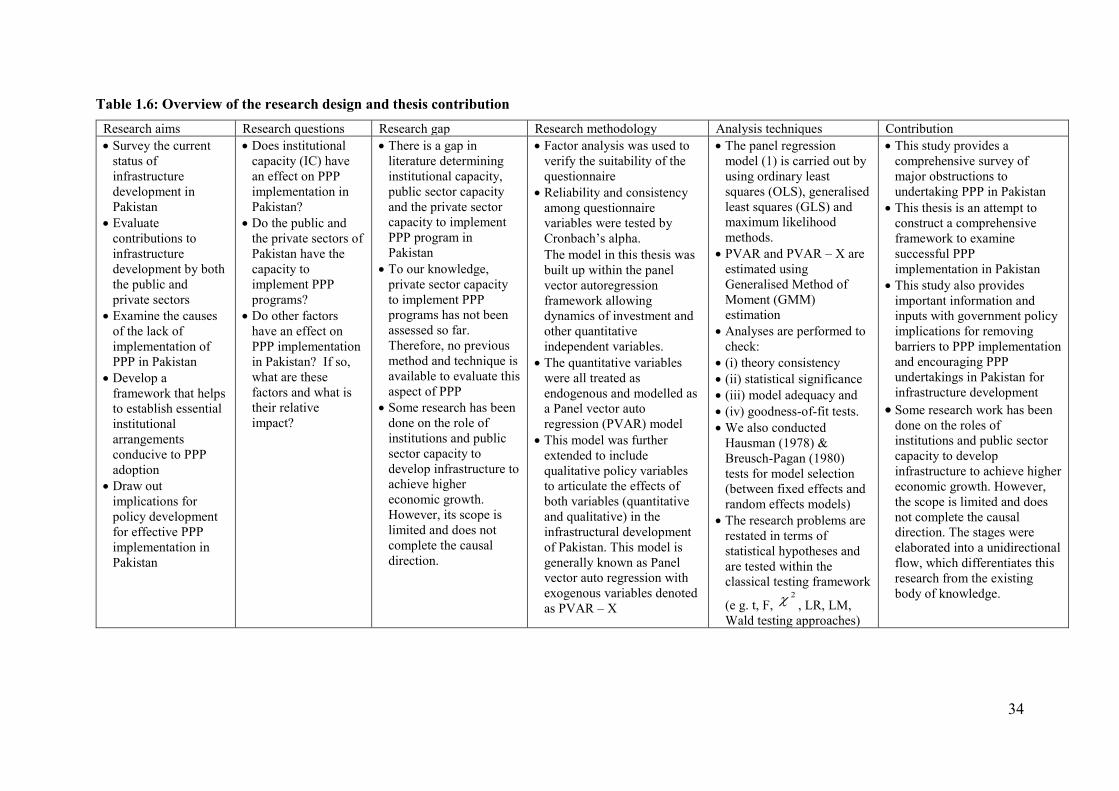
34
Table 1.6: Overview of the research design and thesis contribution Research aims Research questions Research gap Research methodology Analysis techniques Contribution • Survey the current
status of infrastructure development in Pakistan
• Evaluate contributions to infrastructure development by both the public and private sectors
• Examine the causes of the lack of implementation of PPP in Pakistan
• Develop a framework that helps to establish essential institutional arrangements conducive to PPP adoption
• Draw out implications for policy development for effective PPP implementation in Pakistan
• Does institutional capacity (IC) have an effect on PPP implementation in Pakistan?
• Do the public and the private sectors of Pakistan have the capacity to implement PPP programs?
• Do other factors have an effect on PPP implementation in Pakistan? If so, what are these factors and what is their relative impact?
• There is a gap in literature determining institutional capacity, public sector capacity and the private sector capacity to implement PPP program in Pakistan
• To our knowledge, private sector capacity to implement PPP programs has not been assessed so far. Therefore, no previous method and technique is available to evaluate this aspect of PPP
• Some research has been done on the role of institutions and public sector capacity to develop infrastructure to achieve higher economic growth. However, its scope is limited and does not complete the causal direction.
• Factor analysis was used to verify the suitability of the questionnaire
• Reliability and consistency among questionnaire variables were tested by Cronbach’s alpha.
• The model in this thesis was built up within the panel vector autoregression framework allowing dynamics of investment and other quantitative independent variables.
• The quantitative variables were all treated as endogenous and modelled as a Panel vector auto regression (PVAR) model
• This model was further extended to include qualitative policy variables to articulate the effects of both variables (quantitative and qualitative) in the infrastructural development of Pakistan. This model is generally known as Panel vector auto regression with exogenous variables denoted as PVAR – X
• The panel regression model (1) is carried out by using ordinary least squares (OLS), generalised least squares (GLS) and maximum likelihood methods.
• PVAR and PVAR – X are estimated using Generalised Method of Moment (GMM) estimation
• Analyses are performed to check:
• (i) theory consistency • (ii) statistical significance • (iii) model adequacy and • (iv) goodness-of-fit tests. • We also conducted
Hausman (1978) & Breusch-Pagan (1980) tests for model selection (between fixed effects and random effects models)
• The research problems are restated in terms of statistical hypotheses and are tested within the classical testing framework
(e g. t, F, 2 , LR, LM,
Wald testing approaches)
• This study provides a comprehensive survey of major obstructions to undertaking PPP in Pakistan
• This thesis is an attempt to construct a comprehensive framework to examine successful PPP implementation in Pakistan
• This study also provides important information and inputs with government policy implications for removing barriers to PPP implementation and encouraging PPP undertakings in Pakistan for infrastructure development
• Some research work has been done on the roles of institutions and public sector capacity to develop infrastructure to achieve higher economic growth. However, the scope is limited and does not complete the causal direction. The stages were elaborated into a unidirectional flow, which differentiates this research from the existing body of knowledge.

35
1.7 Econometrics to verify the results
The econometric models were estimated using the STATA program. They are
discussed in detail in Chapter Six.
1.8 Organisation of the Thesis
This thesis is organised into seven chapters. The first chapter provides the
background for the justification of the thesis, key facts relating to Pakistan’s economy and
comparisons of Pakistan to other South Asian countries. This chapter discusses the current
infrastructure investment trends and methods used in Pakistan and the current status of
private-sector investment in infrastructure development. The chapter also briefly identifies
the possible reasons for low private-sector participation in infrastructure development in
Pakistan. Justification for the thesis, research aims, research questions and research
objectives and the methodology for the data analysis techniques used to address the research
questions are also discussed in this chapter.
Chapter Two discusses the importance of infrastructure and provides a sector-wide
overview of the current status of infrastructure in Pakistan. This chapter also reviews
infrastructure investment planning, policies and trends in Pakistan. Causes of insufficient
infrastructure facilities in Pakistan and infrastructure projects financing models are also
discussed in this chapter, which serves as a background against which the remaining chapters
of the thesis can be read.
Chapter Three provides a critical literature review that examines empirical data from
previous studies dealing with the role of infrastructure, PPP and institutions in economic
growth. This section is divided into four sub-sections:
• The role of infrastructure in economic growth;
• PPP – a solution;
• Role of institutions in economic growth; and
• Review of investment theories in context of investment in public infrastructure.
The gaps in current literature is also identified in this chapter.
Chapter Four consists of a discussion of the assorted theoretical and methodological
approaches that have been used by various researchers for assessing institutional capacity,
public and the private sector capacity in implementation of PPP programs for infrastructure
development. In this chapter, research questions are translated into econometrically testable
36
hypotheses, other factors are discussed that have impacted on PPP implementation, the data
used for analysis is discussed, as are research methodology and estimation approaches in
detail.
Chapter Five presents a detailed discussion of primary data/qualitative data
collection approaches used in the studies that were undertaken as part of the thesis, together
with tabulation and representation of qualitative data in numerical values. This chapter
discusses the study type selection, data sources, the design of the questionnaire, econometric
equations and estimation techniques and the adoption of an estimation model. Preliminary
results are also presented in this chapter.
Chapter Six presents findings from the data analyses and discusses the findings as
they specifically relate to the research questions. This chapter also states the empirically
testable research hypotheses and provides hypotheses test results for pinpointing the causes
of obstructions of PPP implementation in Pakistan.
Chapter Seven summarises the key findings of the thesis and conclusions that can be
drawn and underlines the significance and contributions of the study to policy makers and
both the public and private sectors. This chapter discusses the implication of the findings,
the limitations of the study and policy development. Recommendations for future research
in the area are also made in this chapter.
37
Chapter Two: Current Status of Infrastructure in Pakistan
This chapter presents an overview of the current status of infrastructure development
in Pakistan. The overview draws primarily on policy documents and international economic
reports as there is little critical analysis of Pakistan’s infrastructure strengths and weaknesses
in the academic literature. Section 2.1 discusses common definitions and various
interpretations of the term “infrastructure”. Section 2.2 presents an overview of Pakistan’s
current infrastructure status with a discussion of historical trends and the increasing demands
placed on infrastructure and services. Pakistan’s infrastructure investment policies and
trends are addressed in Section 2.3. Section 2.4 explores major causes of insufficient
infrastructure in Pakistan and makes recommendations on how to boost Pakistan’s
infrastructure.
2.1 Defining infrastructure
The basic physical and organisational structures and facilities (e.g. buildings, roads,
power supplies) needed for the operation of a society or enterprise is called infrastructure
(Oxford Dictionary, 2018). Over time different researchers have defined infrastructure
differently. Various researchers (see Lakshmanan, 2008; Jamaluddin et al., 2007 and
INSTATE Pty. Ltd., 2001) refer to infrastructure as comprising two parts: the basic physical
structure (roads, buildings, power etc.) and the organisational structure (institutions). Other
researchers have distinguished between “hard” infrastructure i.e. large physical networks
necessary for the functioning of the economy, and “soft” infrastructure i.e. institutions
required to maintain the economy (Instate Pty. Ltd., 2001).
Other definitions of infrastructure are as follows:
Lakshmanan (2008) states that physical infrastructure covers telecommunication,
power and transportation and through its spillover effects can increase employment, income
and savings. It can also lead to higher living standards and eventually forward and backward
linkages to facilitate growth. Infrastructure development spreads its positive effects across
the economy. Social infrastructure includes water supply, sanitation, sewage disposal,
education and health, as primary services that have a direct impact on the quality of life.
Physical infrastructure and social infrastructure are interlinked, and both improve living
standards and accelerate growth rate.
Jamaluddin et al. (2007) classify infrastructure as:

38
• Physical infrastructure: transport, power, communication and agro-specific
infrastructure such as manufacturing of farm equipment, imports and exports
of farm products
• Financial infrastructure: banking services and life insurance corporations
• Social infrastructure: health, education, medical care, aged care, nutrition,
housing, water supply, sanitation, sewage collection and disposal, parks and
sports facilities.
Instate Pty. Ltd. is an advisory practice that undertakes research and analysis as
inputs for business managers and policy makers. Instate Pty. Ltd. (2001) asserts that the
most critical infrastructure for economic development is that which relates:
• Directly or indirectly, to the movement of people and goods – the physical
(hard) infrastructure such as the roads, the rail networks, the ports and power
stations etc.
• To quality of life – the social (soft) infrastructure such as hospitals, health
care facilities, social services, the art and the legal and regulatory systems
etc.
• To the generation, storage and sharing of knowledge – the knowledge
infrastructure (schools, colleges and universities, research bodies and
libraries etc.).
This thesis focuses on three sectors of physical infrastructure, namely
telecommunication, power and transport, with the objective of assessing their impact on the
economic growth of Pakistan.
2.1.1 Infrastructure improves standard of living
Infrastructure development has positive and significant effects on output and the
standard of living in the long-term (Peter et al. 2009). Additionally, improved infrastructure
facilites have important impacts on household welfare (Mensah et.al, 2014). A review of the
available literature has highlighted that infrastructure has a positive impact on economic
growth [see, for example, Alfredo and Jorge (2013); Pravakar Sahoo and Ranjan Kumar
Dash. (2013) and Minh (2012)]. Conversely, poor infrastructure reduces the profitability of
the manufacturing sector (Bjorvatn, 2000). An inadequate infrastructure network may imply
inefficiency in transportation of raw materials and possible increases in price. Therefore,
39
lack of infrastructure that connects growers, producers and consumers of final goods causes
inefficiencies and competitiveness problems, which may impede economic growth
(D´emurger, 2001). According to Aschauer (1993) there is a strong causal relationship
between public capital investment and both productivity and output. Further, new research
suggests that public infrastructure is also considered a factor of production along with factors
of such as land, labour and capital.
2.1.2 Infrastructure has positive effects on business
Infrastructure affects production activities in developing countries (Yoshino and
Nakahigashi, 2000). Infrastructure has positive effects in reducing production costs and
contributing positively to aggregate output and productivity (Ecurra et al. 2005; Bjorvatn,
2000; Andrews and Swanson, 1995). According to Nourzad et al. (2014), public
expenditures on infrastructure development increase the productivity of private investment
by improving production conditions. Infrastructure not only has an impact on output but also
attracts foreign direct investment (FDI). Several empirical studies have recognised that FDI
is one the factors of economic growth and concluded that FDI contributes to the living
standard of the host country by transfer of new technology (Nourzad et al. 2014).
2.2 Overview: ownership/control of Pakistani’s infrastructure assets
across each sector
As mentioned earlier, Pakistan is lagging behind in achieving its development goals
mainly because of poor infrastructure facilities compared with South Asian countries (Table
2.1 refer). A better infrastructure increases productivity, income and consumption levels,
which ultimately improves living standards (Kusharjantoa and Kim, 2011; Peter et al. 2009).
According to Mensah et al.’s (2014) study, improved infrastructure increases business
opportunities, improves public and private assets, increases household income and
consumption, reduces vulnerability, improves food security, increases access to natural
resources and eventually increases public wellbeing. Several empirical studies have shown
that poor infrastructure in developing countries has negative effects on economic growth
(see, for example, Lin and Doerte, 2012). Better strategies must be developed and put in
place to address Pakistan’s infrastructure challenge.

40
Table 2.1: Comparative Indicators of Infrastructure across South Asian Countries
Indicators Pakistan India Bangladesh Bhutan Nepal Sri Lanka 1990 2014 1990 2014 1990 2014 1990 2014 1990 2014 1990 2014
Population (millions) 103 185 508 1,295 106 169.1 765 18.8 28.2 20.8 Population growth (%) 2.9 2.1 2.1 1.2 2.5 1.2 1.2 1.4 2.5 1.2 1.2 0.9 Population density (people per sq.km) --- 240 --- 436 --- 1,222 --- 20 --- 197 --- 331 Mobile cellular subscription (% of population) --- 73.3 0 74.5 0 80 0 82.1 0 81.9 103.2 Individuals using the internet (% of population) --- 14 --- 18 --- 10 --- 34 --- 15 --- 26 Access to Electricity (% of total pop. Year 2012) 59.6 43.1 50.9 78.7 21.6 59.6 65.6 75.6 69.9 76.3 78.3 88.7 Access to improved water (% of total pop.) --- 91 70.5 94 68.1 87 72 100 92 96 Access to improved sanitation facilities (% of total pop.) --- 64 16.8 40 34.4 61 18.9 50 --- 46 --- 95 Telecom Density (% of Population) * --- 70.37 --- 72.94 --- 16 --- --- --- 18 --- 122 Road Density by Population (Road km/1,000 people) * --- 1.7 --- 3.8 --- 1.9 --- 6.5 --- 0.6 --- 4.7
Life expectancy (Total years. Data 2012) --- 65.7 --- 67.3 --- 70.9 --- 68.7 --- 68.8 --- 74.5 Source: Author (compiled from World Bank data, 2016; World Bank Indicators, 2015; *The World Bank Data, 2006)
41
Table 2.1 presents a brief comparison of basic infrastructure facilities available in
South Asian countries. The comparison shows that the basic infrastructure facilities in
Pakistan are inadequate and the country ranks lowest in South Asian countries. The country
also ranks the lowest in life expectancy (total years). While, population growth trend of
Pakistan in the year 2014 is the highest in the region.
The status of Pakistan’s infrastructure can be determined through an analysis of key
indicators. Tables 2.3 to 2.8 present sector specific comparative data including relevant
indicators for the period 1960 to 2015, with the objective of understanding how changing
conditions and demands on infrastructure have evolved over time. Pakistan’s growing
population continues to burden already strained infrastructure services.
2.2.1 Population and GDP Trends
As shown in Table 2.2, Pakistan has experienced a very large increase in population
since 1960, with population density increasing from 75.3 people/sq.km in 1970 to 240.1
people/sq.km in 2015. Conversely, overall Pakistan’s GDP has experienced a decline. Data
shows a decrease from Rupees (Rs.) 7.16 (million) in 1960 to Rs.1.42 (million) in 1970
peaking at Rs.9.15 (million) in 2010 before declining to Rs.1.13 (million) in 2015. The
annual average growth rate/compounded annual growth rate (CAGR)2 from 1960 to 2015 of
development expenditure as a percentage of GDP (0.29 percent) is lower than the population
growth (2.62 percent).
Table 2.2: Population growth and GDP from 1960 to 2015 Indicators 1960 1970 1980 1990 2000 2010 2015 Population (million) Population Density(people/sq.km) Population Growth Rate %
44.9 56
2.3
58.1 75.3
2.7
78.1 101.3
3.3
103 139.3
2.9
138 179.4
2.3
170 22.6
2.1
185 240.1
2.1 GDP (Rs. in millions) ^ Development Expenditure (% of GDP)
7.16 ---*
1.42 17.8
2.24 8.1
4.12 5.2
6.07 5.2
9.15 6.5
1.13 4.2
Source: compiled from Economic Survey of Pakistan, 1990-2015; FAO, 2015 and World Bank, 2016 *Data is not available ^ 1US$ = 121 Pak Rs. (as on 21/06/2018)
The substantial increase in population has placed additional demands on services and
driven the need for greater infrastructure development. Many areas of Pakistan’s
infrastructure are affected by the rising population growth, as shown in Table 2.3, including
2 Formula to calculate compound annual growth rate is: CAGR = (EV / BV)1/n - 1. Whereas, EV = Ending Value, BV = Base Value and n= Periods.

42
power, roads, railways, seaports, aviation and telecommunications. Comparative data in
relation to these areas are presented in Tables 2.4. to 2.9.
2.2.2 Telecommunications
The telecommunication sector has progressed in the past five decades, especially in
the most recent five-year period for which data is available (between 2010 and 2015). There
has been an increase in telephone line connections (64.71 percent of the total population)
with a CAGR of 7 percent, cellular subscriptions (73.4 percent of the total population) with
a CAGR of 53 percent from 1990 to 2015, and broadband penetration (13.5 percent of the
total population) with a CAGR of 79 percent from 2010 to 2015. However, as at 2015, 35.19
percent of the population still did not have a telephone line connection, 26.6 percent of the
population did not have a mobile phone connection and 86.5 percent of the population had
no access to internet facilities. A comparison of telecommunication access trends is
presented in Table 2.3.
Table 2.3: Comparative data of telecommunication from 1960 to 2015 Indicators 1960 1970 1980 1990 2000 2010 2015 Telephone Lines (million No.) Mobile Phones (per 100 people) Internet Connections (per 100 people)
0.1 ---* ---*
0.2 ---* ---*
0.6 ---* ---*
1.2 .0018
---*
3.3 0.2
---*
3.4 57.3
8
5.6 73.4 13.8
Source: Economic Survey of Pakistan, 1990-2015; FAO, 2015 and World Bank, 2016 *Service was not introduced in Pakistan
The use of information and communication technology (ICT) contributes to the
economic growth of a country. Farhadi, Ismail, and Fooladi (2012) used a sample of 159
countries and categorised them in to four groups (high income, upper middle, lower middle
and lower income) for the period 1998 to 2009. Their study revealed that: i) ICT has a
positive and significant effect on economic growth; ii) the majority of the countries
recognised the important effect of ICT on their economic growth; and iii) the more a country
uses ICT, the greater is its economic growth. Global ICT development from 1998 to 2009 is
presented in Figure 2.1.

43
Figure 2.1: Global ICT developments, 1998-2009
Source: Farhadi et al. (2012), page 1.
According to Atkinson and Stewart (2013) ICT helps economies to create high-
paying jobs, drives productivity and GDP growth, helps build high-growth companies,
creates new sectors and ways of doing business, and ICT is the key source of competitive
advantage and drives innovation. However, Pakistan is far behind in providing ICT facilities
to its citizens compared with the rest of the world. Pakistan ranked 124 and 112 out of 140
countries in 2016 for mobile telephone subscription and fixed-telephone line connections
respectively in the World Economic Forum’s Global Competitiveness report (World
Economic Forum, 2016).
2.2.3 Power (Electricity) Access and Consumption
Table 2.4 shows that in 1990, 59.6 percent of Pakistan’s population had access to
electricity. Since then, Pakistan has improved the population’s access to electricity
significantly with a CAGR of 1.83 percent from 1960 to 2015. In 2015, 93.6 percent of the
population had access to electricity, with the remaining 6.4 percent still deprived of it. In
addition, the consumption of electricity kilowatt-hour (kWh per capita) increased by
approximately threefold since 1980, putting greater pressure on already limited resources.
44
Table 2.4: Comparative access and consumption data for the power sector from 1960 to 2015
Indicators 1960 1970 1980 1990 2000 2010 2015 Access to Electricity (% of population) Consumption (kWh per capita)
--- ---
--- ---
--- 136.1
59.6 277.6
79.5 373.2
91.4 466.6
93.6 449.9
Source: Economic Survey of Pakistan, 1990-2015; FAO, 2015 and World Bank, 2016 Note: --- indicates data is not available
The CAGR of consumption (kWh per capita) was 3.63 percent from 1960 to 2015.
Therefore, the high consumption of electricity has resulted in a supply-demand gap that has
been evident for a number of years, resulting in frequent power outages. The Ministry of
Water and Power (2011) acknowledges that there was an estimated power shortfall of
5,000MW during 2010-11. During 2015 the demand for electricity was 18,400MW, while
supply was 14,400MW; resulting in a net deficit of 4000MW (Ministry of Water and Power,
2016). The electric supply is both insufficient and unreliable due to years of under
investment, leading to insufficient capacity to meet demand and affecting transmission and
distribution networks (BMI, 2012). In addition to the ongoing demand-supply gap,
Pakistan’s power services are also plagued with ageing transmission and distribution
infrastructure and mismanagement such as transmission and distribution losses (Business
Monitor International, 2016).
Pakistan’s electricity generation installed capacity is 25,100MW in 2017. At present
(2018), the country is generating 18,000MW. The average demand is 22,000MW and the
shortfall is 5000-6000MW. The principal sources of electricity generation are: oil (35.2
percent), hydro (hydel) (29.9 percent), gas (29 percent), and nuclear, solar and imported (6
percent). Electricity demand is expected to rise by 4-5 percent during the next 10 years, by
1,500MW approximately. These are conservative estimates due to an unbalanced energy
mix (power generation depends largely on crude oil rather than utilising other sources such
as coal, hydel and wind energy), diminishing domestic fuel reserves, increasing circular
debt3 and transmission hold-ups. The country has almost exhausted its natural gas reserves.
Supply of imported oil cannot be guaranteed due to oil price hikes that affect the budget and
its constant supply. The country has the potential to meet these energy challenges through
hydro-electric power, but there are environmental and political issues in building new dams,
3 See Glossary of Technical Terms.

45
such as equal distribution of water among provinces for farming purposes and people being
unwilling to evacuate their indigenous land for dams (Ministry of Water and Power, 2016).
Insufficient infrastructure may be a major or severe impediment to business
expansion, with power being the most critical bottleneck. All kinds of manufacturing
industries in Pakistan lose approximately 5-8 percent of their business as they do not fully
utilise their production capacity due to power-related problems (Nataraj, 2007). On a global
scale, Pakistan ranked only 129 out of 140 countries in 2016 for quality of electricity supply
in the World Economic Forum's Global Competitiveness report (World Economic Forum,
2016).
Pakistan’s power generation infrastructure is growing at a similar rate to its
population growth. This means that, at the current rate, Pakistan will not be able to improve
the electricity supply to its population, causing the supply-demand gap to persist unless
significant development occurs in this sector.
2.2.4 Transport Infrastructure
Transport infrastructure includes roadways, railways, air services and seaports.
These are discussed in the following sections.
2.2.4.1 Roadways Infrastructure
As a whole, the country has underperformed in developing new and paved roads
since its independence in 1947. There has been a fourfold increase in roadway development
from 70,500km in 1960 to 263,000km in total in 2015 with CAGR of 2.43 percent. However,
development stagnated between 2010 and 2015 with only 3000km of road being developed
in this period. The comparative data is shown in Table 2.5. During the financial year
2011/2012, the Pakistani Government temporarily shelved several projects in the transport
sector because of public funding constraints (Business Monitor International, 2012).
Table 2.5: Comparative data for the road sector from 1960 to 2015
Indicators 1960 1970 1980 1990 2000 2010 2015 Roadways (thousand km) Paved Road (km % over total roads) Registered Vehicles (million No.)
70.5 --- ---
74.1 --- 0.4
123.8 --- 0.8
279.3 54.0 2.1
255.3 56.0 4.5
260 72.6 7.8
263 70.2 15.1
Source: Economic Survey of Pakistan, 1990-2015; FAO, 2015 and World Bank, 2016

46
The significant rate of growth in the number of registered vehicles, along with slow
road development rates, suggests that unless there is dramatic development in this area, the
problems will increase and place heavy demands on an already strained system.
The present road infrastructure is not adequate to cater for the increased demand –
there has been a sixfold increase in the number of registered vehicles since 1990. The CAGR
of registered vehicles is 8.48 percent from 1960 to 2015. Due to insufficient development of
road infrastructure, the increased number of vehicles has resulted in terrible traffic jams,
pollution and road congestion. The quality of road infrastructure of Pakistan ranks 77 out of
140 countries in 2016 in the World Economic Forum's Global Competitiveness report
(World Economic Forum, 2016). A series of images has been included to illustrate the
severity of these issues.
Figure 2.2: Inadequate transport facilities
Source: Google Infrastructure Photos
Figure 2.3: Underdeveloped road infrastructure
Source: Google Infrastructure Photos
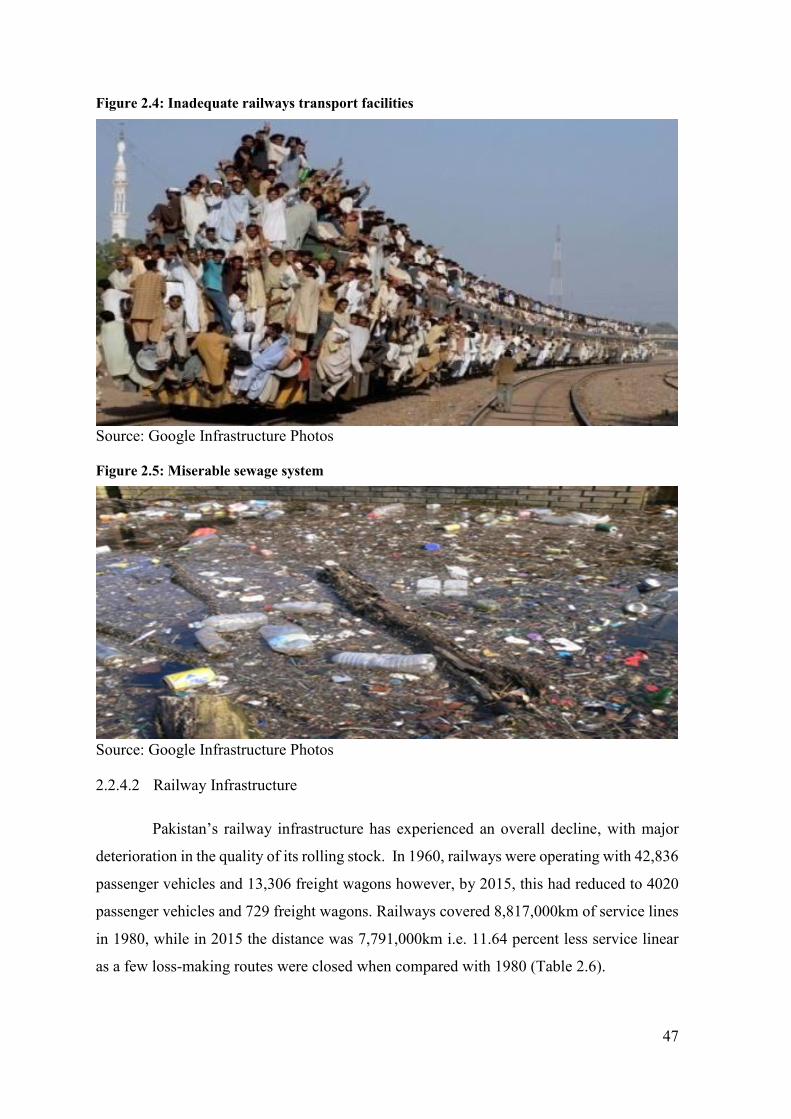
47
Figure 2.4: Inadequate railways transport facilities
Source: Google Infrastructure Photos
Figure 2.5: Miserable sewage system
Source: Google Infrastructure Photos
2.2.4.2 Railway Infrastructure
Pakistan’s railway infrastructure has experienced an overall decline, with major
deterioration in the quality of its rolling stock. In 1960, railways were operating with 42,836
passenger vehicles and 13,306 freight wagons however, by 2015, this had reduced to 4020
passenger vehicles and 729 freight wagons. Railways covered 8,817,000km of service lines
in 1980, while in 2015 the distance was 7,791,000km i.e. 11.64 percent less service linear
as a few loss-making routes were closed when compared with 1980 (Table 2.6).

48
Table 2.6: Comparative data for the railways sector from 1960 to 2015 Indicators 1960 1970 1980 1990 2000 2010 2015 Routes Cover (thousand km) Locomotives (No.) Passenger Vehicles Run (No.) Freight Wagons Run (No.)
--- ---
42,836 13,306
--- ---
30,830 15,407
8,817 960
30,706 13,184
8,775 753
30,054 13,088
7,191 597
20,577 7,191
7,191 528
16,079 7,172
7,791 452
4,020 729
Source: Economic Survey of Pakistan, 1990-2015; FAO, 2015 and World Bank, 2016
In addition to internal management issues of Pakistan Railways, there are two main
reasons for its decline. These are:
i) Construction of highways and motorways and establishment of road trucking
businesses, especially the publicly owned National Logistic Cell. Railway lines
are only laid down in the major cities and do not cover the most remote areas
of the country. Furthermore, Pakistan Railways does not have feeder routes for
bringing passengers and freight business to the main routes/rail stations.
ii) Pakistan Railways was not given importance equal to the road network. The
CAGR of the railway network from 1960 to 2015 was negative, such as: routes
covered (thousand km) -0.36 percent locomotives (No.) -2.12 percent
passenger vehicles run (No.) -1.39 percent, and freight wagons run (No.) -7.25
percent. The quality of railway infrastructure of Pakistan ranks 60 out of 140
countries in 2016 in the World Economic Forum’s Global Competitiveness
report (World Economic Forum, 2016).
The main line of Pakistan’s rail network extends from the northern regions of the
country, in particular the cities of Haripur and Havelian, to two of the major seaports in the
south at Karachi (Figure 2.2). Pakistan’s rail network covers only a small part of the country,
with a heavy reliance on road transport to connect the major trade centres. The rail network
has obviously suffered from severe underinvestment. The limited availability of rail services
impedes the country’s ability to facilitate trade effectively. This is evidenced by the absence
of a railway connection to the Gwadar port, which is the third largest international seaport
in Pakistan and located at a cross junction of international sea shipping and oil trade routes
(Business Monitor International, 2016).
Development of rail sector infrastructure would enable efficient (economical and
reliable) transport of cargo to seaports, through a reduced reliance on road transport. The
current degradation of the rail network could be detrimental to Pakistan’s import and export
goals. Further development in this area could see an increase in Pakistan’s export trade and
therefore improve the nation’s GDP (Pakistan Railways, 2015).

49
Figure 2.6: Geographical map of Pakistan
2.2.4.3 Air Transport
Air traffic experienced both growth and decline growth between 1960 and 2015.
Data show an increase in Pakistan’s airline fleet from 23 planes in 1960 peaking at 45 in
2000 before declining to 34 planes in 2015 (Economic Survey of Pakistan, 1990-2015 (Table
2.7). The increase in airline fleet numbers has resulted in an increase in passenger carrying
capacity, with a CAGR of 3.11 percent from 1960 to 2015. Importantly, there has been no
real progress in building new airports with the exception of one international airport under
construction in the capital city Islamabad, expected to be completed by the end of 2018.
Table 2.7: Comparative data for aviation from 1960 to 2015 Indicators 1960 1970 1980 1990 2000 2010 2015 Passengers Carried (thousand) Airline Fleet Route (thousand km)
--- 23 46
1336 23 87
3029 32 218
5180 43 255
5293 45 317
6588 40 424
5559 34 389
Source: Economic Survey of Pakistan, 1990-2015; FAO, 2015 and World Bank, 2016
The quality of airport infrastructure is also deteriorating significantly, resulting in
a low ranking over the past five years. The quality of air transport in Pakistan ranks 79 out
of 140 countries in 2016 in the World Economic Forum’s Global Competitiveness report
(Business Monitor International, 2016; World Economic Forum, 2016).
50
The development of the new international airports should stimulate Pakistan’s
economy during the development and post-completion phases. Tourism to Pakistan, and the
jobs it brings, has declined in part because many international airlines have discontinued
their flights to Pakistan due to a lack of state-of-the-art airport facilities.
2.2.4.4 Seaports
The number of seaports has increased from one to three, with an 86 percent increase
in cargo handling. However, Pakistan’s port infrastructure is inadequate considering its
focus on increasing imports and exports needs (Business Monitor International, 2016). Over
time the number of publicly owned vessels has reduced from 53 ships to nine ships during
1960 and 2015 (Table 2.8). As mentioned earlier, the Gwadar port, which can act as an
alternative route to Indian Ocean or South China Sea routes, has no railway connection. In
relation to seaport infrastructure, Pakistan ranks 66 out of 140 countries in 2016 in the World
Economic Forum’s (WEF) Global Competitiveness (GC) report (World Economic Forum,
2016). While the increase in seaports has been positive in relation to Pakistan’s import and
export goals, it is apparent that there are many opportunities for expansion in this area. A
rail connection to Gwadar would further increase the cargo handling capabilities of this port.
Table 2.8: Comparative data for seaports from 1960 to 2015 Indicators 1960 1970 1980 1990 2000 2010 2015 Seaports Cargo Handled (000 tons) Vessels
1 7,169
53
1 9,587
71
1 14,657
50
2 18,709
28
3 23,761
14
3 41,420
9
3 54,379
9 Source: Compiled from Economic Survey of Pakistan, 1990-2015; FAO, 2015 and World Bank, 2016
The geographical locations of Karachi Port, Muhammad Bin Qasim Port and Gwadar
port are indicated in Figure 2.6: Geographical map of Pakistan.
2.2.5 Implications of Infrastructure Deficiencies
Pakistan has fought four wars with India and martial law regimes have been imposed
four times, spread over almost all the decades since its independence in 1947. The major
events in Pakistan since independence are summarised in Table 2.9. The development
pattern of the period 1947 to 2015 has not been consistent. Some of the years experienced
growth, while others saw a decline in certain areas. After two months of independence,
Pakistan was at war with India, starting in 1947 and lasting for more than a year. Although
there was a dictatorship during the 1950s and 1960s, Pakistan’s economy flourished due to

51
increases in exports and an inflow of foreign aid and assistance. The country’s economy
showed a declining trend in 1970 due to political instability, war with India, oil price shocks,
nationalisation policy (nationalisation of major industries) and civil war in East Pakistan,
which ended in the emergence of the independent state of Bangladesh. Again, a military
dictator enforced martial law and assumed control of the country.
During the 1980s, defence spending levels were increased, coupled with extensive
involvement of the public sector in commercial activity, which discouraged and squeezed
out private investment and ultimately adversely affected the country’s growth. There was
vicious political instability during the 1990s, which negatively affected the growth rate of
the economy. Once again, a military dictator enforced undeclared martial law and seized
control of the country from the elected Prime Minister. In the 2000s, an economic reform
program was launched and a privatisation policy was implemented to sell publicly owned
loss-making entities. However, terrorist activities and targeted killings, which deterred
investors from investing in Pakistan, and a shortage of electricity and gas for the industrial
sector, slowed down the rate of investment during 2008 and 2009. Due to a rapid decline in
investment (public and private) the growth rate of the country became negative in the 2010s.
The global financial turmoil foreign private inflows negatively affected the demand for
Pakistani exports and foreign private inflows. However, investment and economic growth
increased slightly in the lead-up to the election during the financial year 2011-12.
52
Table 2.9: Major events in Pakistan since independence at a glance Period Events 1947 Pakistan is located in the north-western regions of South Asia. Pakistan achieved independence and was declared a sovereign nation following the end of the British
Raj on 14 August 1947. 1948 First war between India and Pakistan few months after independence. During this war, Pakistan losses were 6000 killed and 14,000 wounded. The war took place
between 22 October 1947 and 1 January 1949. A formal ceasefire was declared at 23:59 on the night of 31 December 1948. 1950s Pakistan’s exports were boosted and maintained a high level of economic growth during the Korean war. The first military dictator of Pakistan, General Ayub Khan,
enforced martial law and assumed control of the country on 8 October 1958 and ruled actively implemented economic management and reforms (Muhammad, 2014). This first martial law duration was 1958 to 1969.
1960s The country maintained a high and rapid growth rate due to inflow of foreign aid and assistance. Pakistan had its second war with India in 1965, between April 1965 and September 1965. In this war, 5800 Pakistani soldiers were killed. The economic policy and second development plan was replaced by a nationalisation program by the then government. The second martial law period was introduced and enforced by General Yahya Khan in 1969 ran from 1969 to 1971.
1970s The high growth rate seen in the 1960s could not continue during the 1970s due to a civil war in East Pakistan that ended in the emergence of the independent state of Bangladesh, oil price shock and a nationalisation policy (announced on 2 January 1972), which impacted on infrastructure development. Above all, the political instability after 1970-71 has been the major cause of deterioration in Pakistan. Pakistan had a third war with India in 1971. This war started on 3 December 1971 and ended on 16 December 1971. Pakistan suffered casualties of 8000 killed and 25,000 soldiers wounded. General Zia-ul-Haq military dictator of Pakistan enforced martial law and assumed control of the country on July 5 1977 and ended martial law on December 30 1985.
1980s Since then the country has invested in high levels of defence spending, which took up a significant fraction of scarce revenues and adversely affected public savings otherwise meant for development purposes. However, significant involvement of government in commercial activity squeezed out private investment and adversely affected its growth.
1990s The picture of the economy remained gloomy during the 1990s due to severe political instability. This instability negatively affected the growth rate of the economy. As a result, the growth rate fell from 6.2 percent in 1980s to 3.99 percent in the 1990s. On 28 May, 1998 Pakistan tested a nuclear bomb. Consequently, the country had to face financial hardships as a result of a reduction in financial assistance and sanctions from its international donors. In 1999 Pakistan had its fourth war with India. Pakistani losses were 453 killed and 665 wounded. This war took place between May and July 1999. In October 1999, General Perwaz Musharaf took control from the elected Prime Minister and assumed control of the country. The duration of Musharaf’s undeclared martial law was 12 October 1999 to July 11 2002.
2000s An economic reform program was launched in 2000, which included reforms in the banking and trade sectors, fiscal adjustment, privatisation of the energy sector, telecommunication sector and public sector industries such as cement factories, sugar mills and cooking oil factories. This played a vital role in the economic recovery of Pakistan. The rate of investment slowed during 2008 and 2009 due to terrorist activities and shortage of electricity and gas for the industrial sector.
2010s After rapid decline in investments during 2008-10, the growth rate of public and the private investment and economic growth in Pakistan become negative. The global financial turmoil hampered foreign private inflows and reduced the demand for Pakistani exports due to the recession in countries of the Organisation for Economic Co-operation and Development (OECD). OECD was founded in 1961 and has 37-member countries, to stimulate economic progress and world trade. However, investment and the economic growth had slightly increased due to the election period in 2011-12
Source: Economic Survey of Pakistan 1990-2016; Economic Times 1965; S.M. Burke 1974; Parvez, 1997; Muhammad, 2014; Maryam and Nazima, 2013.

53
However, the average annual growth of overall infrastructure facilities has been
lower than the population growth except in the telecommunication sector over the past five
decades. The comparative data show (Table 2.11: Details of Five-Year Development Plan)
that the development of public infrastructure in Pakistan has improved over the past 55
years, although at a slower rate than the population growth experienced (Economic Survey
of Pakistan, 1990-2015).
Infrastructure facilities currently do not meet the increasing demand of the
population. Pakistan’s current maintenance requirements are not being met, resulting in an
overall decline in the quality and performance of existing major infrastructure facilities.
Consequently, the infrastructure deficit may be a major impediment in the economic growth
of Pakistan. Pakistan ranks 98 out of 140 countries in 2016 for overall quality of
infrastructure in 2016 in the WEF’s GC report (World Economic Forum, 2016).
2.2.6 Summary
The World Bank (2012) states that public infrastructure in Pakistan has experienced
low levels of improvement over the past 50 years. Current infrastructure facilities in Pakistan
are not only inadequate, they could have a negative impact on economic growth.
Infrastructure facilities are also insufficient to meet the increasing demands of a fast-growing
population (an average annual growth rate of 2.62 percent). Table 2.2 highlights the limited
development of basic infrastructure such as power and roadways in comparison to the
population statistics for the country.
The rapid increase in population and urbanisation is challenging already inadequate
infrastructure services. Pakistan’s physical infrastructure needs major investments for new
developments, maintenance, expansion and modernisation of existing facilities, particularly
in remote and rural areas. While the average growth rate is appropriate in some areas,
infrastructure services must continue to grow and improve with the needs of the population.
The World Bank Indicators 2016 show that inadequate infrastructure services and
bottlenecks in infrastructure development may have been a hindrance in economic growth
in Pakistan. Table 2.9 provides a comparison of Pakistan’s basic infrastructure with its
neighbouring countries in the region with comparable geographic location, size or economic
development.
A comparison of infrastructure across South Asian countries shows that:
54
• Pakistan is not only the second most populous country in the region, it also
has the highest rate of population growth of up to 2.1 percent per annum with
population density of 240 people per sq.km and a maximum urbanisation of
32 percent.
• The only sector where Pakistan is ahead of other comparative regional
countries is access to electricity, with 93.6 percent of the population enjoying
this facility. However, despite the high percentage of access there is a major
power shortfall, as stated earlier. According to the World Bank (2012),
electricity generation in Pakistan is substantially lower than in other South
Asian countries except Bangladesh.
• The transport sector has seen a general upward trend in most South Asian
countries. Provision of total paved roads in Pakistan has improved markedly,
with the percentage rising to 72.6 percent of total roads in 2015, up from 54
percent to 65 percent in the 1980s (World Bank, 2012), while other countries
in the region have consistently underperformed in this area. Respectively,
Nepal and India have 53.9 percent and 53.8 percent of their total road length
paved. In terms of road density per 100sq.km of land area, Pakistan ranks
third (33 per 100sq.km of land area) in the region, with Sri Lanka at the top
of the list with 173.9. The worst-case scenario is evident in railway density
where Pakistan is the lowest in the region with 1.0 per 100sq.km of land area,
while Sri Lanka ranks number one on the list with 2.2 per 100sq.km of land.
• Likewise, there has been a steady rise in the telecommunications sector
across regional countries on the whole, however, Pakistan’s
telecommunications sector has yet to be developed. Sri Lanka ranks number
one for telecommunication density (i.e., 122 percent of the population)
followed by India with 72.94 percent and Pakistan with 70.3 percent of the
population. Despite that, the provision of mobile cellular subscription is the
lowest in the region. Internet services in Pakistan are not as developed as in
comparative countries, only exceeding Bangladesh in the region.
• When comparing economic growth in the form of GDP, Pakistan is the
second lowest in the region with 4.7 percent annual growth in GDP. Sri
Lanka has the lowest growth with a growth rate of 4.5 percent annually and
India has the highest GDP growth rate at 7.3 percent annually. Pakistan does

55
not have the same level of infrastructure services and support available to
meet the increasing demands of a growing population as do countries such as
India. A causal relationship could be established between infrastructure
development and economic growth. GDP growth is greater in those South
Asian countries that have a larger infrastructure supply. The statistics listed
in Table 2.10 suggest that overall economic growth is possible in the region,
provided that appropriate infrastructure and services are available. It will be
challenging for Pakistan to achieve higher economic growth with inadequate
and inefficient infrastructure facilities.
Infrastructure in Pakistan has improved over the past five decades; however, the
improvement has been the slowest for the majority of public infrastructure sectors among
the regional countries. This is a likely contributor to the low economic growth performance
of the country, which has remained at or below the median growth rate of other countries in
the world. In summary, the comparison presented above suggests that there is a substantial
demand-supply gap in Pakistan’s infrastructure when assessed against other South Asian
countries (World Bank, 2012). The next section, Section 2.3, presents a sector-wide
historical background of infrastructure investment policies and trends in Pakistan.
Table 2.10: Comparison of infrastructure across South Asian countries at 2015 Indicators Pakistan Bangladesh Bhutan India Nepal Sri Lanka Total Population (Million)
188.2 160.4 0.8 1282.3 28.4 21.6
Population Growth (annual %) 2.1 1.2 1.4 1.2 1.2 0.9 Population density (people per sq.km)
240 1222 20 436 197 331
Urban Population (% of Total) 32.0 28.0 - 30.0 18.0 15.0 GDP Growth (annual %) 4.7 6.1 5.5 7..3 5..4 4.5 Paved Road (% total roads) 72.6 - 34.2 53.8 53.9 - Road Density (per 100 sq. km of land area)
33.0 - 21.8 142.7 - 173.9
Railways Density (per 100 sq. km of land area)
1.0 1.9 - 2.0 - 2.2
Electricity (% of Population) 93.6 41.0 75.6 78.7 76.3 88.7 Telecom Density (% of Population)
70.37 16.0 - 72.94 18.0 122
Mobile cellular subscription (% of population)
73.3 80.0 82.1 74.5 81.9 103.2
Individuals using the internet (% of population)
14.0 10.0 34.0 18.0 15.0 26.0
Source: Author (compiled from the World Bank data, 2016. The World Bank Indicators, 2015-17 and Food Security Indicators, 2015)

56
2.3 Infrastructure investment planning, policies and trend in Pakistan
The main sources of information regarding infrastructure investment planning,
sector-wide annual reports, policies and trends in Pakistan are:
• Ministry of Finance, Pakistan – Economic Surveys of Pakistan;
• National Planning Board and Planning Commission of Pakistan – Five-Year
Development Plans;
• Ministry of Planning, Development and Reforms;
• Ministry of Information Technology – telecommunication sector;
• Ministry of Water and Power – power sector;
• Private Power Infrastructure Board (PPIB) – private investment in power
sector;
• Ministry of Railways – railways sector;
• Ministry of Ports and Shipping – Karachi Port, Muhammad Bin Qasim Port
and Gawadar Port for seaport sector;
• Pakistan International Airline – air transport; and
• National Highways Authority – roadways transport sector.
Immediately after Pakistan achieved independence in 1947, development plans
focused primarily on achieving high national income levels. The major objectives of these
plans, developed by the Planning Commission of Pakistan, were to: raise national income
and per capita income; increase production in agriculture and industrial sectors; improve
living standards; create employment opportunities; and increase economic development.
However, priority was given to the agricultural and industrial sectors.
The first development plan 1955-1960 was announced by the Planning Commission
of Pakistan late in 1957. The plan had certain handicaps and limitations such as: (i) the plan
did not receive full support until 1957; (ii) the financial resources of the plan fell short of
expectations; and (iii) total non-development expenditures exceeded its revenue receipts by
Pak Rs. 280 million. During the early period after independence, development expenditures
were regarded as the foundation for rapid progress in the future. Plans explicitly confirmed
that some sectors of the economy, such as the transport sector (including railways and
aviation), would be progressed more rapidly than others, to achieve higher growth (1st Five-
Year Plan 1955-1960, National Planning Board, Government of Pakistan).

57
In view of the anticipated 9 percent increase in population, an increase in national
income of 20 percent was targeted during 1960-65. In terms of projected sector-wide
expenditure distribution, private-sector expenditure was fixed at 54 percent, public sector at
30 percent and autonomous corporations (semi-public sector) at 16 percent.
As mentioned earlier, all development plans were revised in 1966 due to Pakistan’s
war with India and the worst economic conditions that Pakistan had experienced. There was
a great investment shift from consumer goods to capital goods industry in the development
plan of 1965-70. Therefore, 58 percent was allocated to the public sector for development
plans and the remaining 42 percent was targeted for the private sector. A total of 66 percent
of the total development plan was projected to finance from local sources (public
investment) and the remaining 34 percent through external sources (foreign aid and
assistance).
During 1983-88, the economy had grown at the projected average of 6.5 percent and
would have exceeded the target if not for severe droughts in 1986-87. In the early 1990s,
greater emphasis than ever before was given to increased private investment in all sectors of
the economy. Therefore, the private-to-public ratio of investment was expected to rise from
42:58 in 1988 to 48:52 in 1993. The sequence of five-year development plans and the periods
to which they relate are presented in Table 2.11.
Table 2.11: Details of Five-Year Development Plan
Plan Period 1st Five-year Plan 1955-1960 2nd Five-year Plan 1960-1965 3rd Five-year Plan 1965-1970 4th Five-year Plan 1970-1975 5th Five-year Plan 1978-1983 6th Five-year Plan 1983-1988 7th Five-year Plan 1988-1993 8th Five-year Plan 1993-1998 9th Five-year Plan 1997-2002 10th Five-year Plan 2010-2015 11th Five-year Plan 2013-2018
During 1993-98, it was planned to increase GNP by 8.1 percent, reduce population
growth up to 2.6 percent by 2000 and maximise utilisation of available investment resources
through technological changes. During 1993-94, policies of privatisation, deregulation and
market friendly environment were reinforced. A new concept of PPP was also introduced to
increase the private sector’s role in achieving higher growth. The medium-term development
58
framework (2005-10) of the Planning Commission of Pakistan emphasised upgrading
physical infrastructure for accelerating output growth. Therefore, telecommunications,
power and transport sectors were identified for the private sector participation through
privatisation and private partnerships for achieving Millennium Development Goals.
In 2014, the Ministry of Planning, Development and Reforms proposed enhancing
private sector participation to improve and develop better infrastructure facilities under a
PPP modality through comprehensive policy reforms. As a result, a few rental power
generation projects4 were developed through private investment. The Ministry of Planning,
Development and Reform (2014) also proposed that a Bureau of Infrastructure Development
(BID) be established to coordinate and oversee private sector participation in infrastructure
development. The BID was intended to serve as a focal point to facilitate the project approval
process and manage project financial arrangements (Ministry of Planning, Development and
Reform, 2014).
All development plans and polices were focused on solving the major problems of
the economy such as low investment and low productivity, heavy reliance on imported
energy, and low spending in social sectors including health and education. To present an
appropriate discussion on existing policies, it is necessary to understand the historical
background of Pakistan’s infrastructure trends and investment policies, the demand for
infrastructure facilities in the past, and how they have developed with the changing demands
of Pakistan’s population. Further, we need to establish whether infrastructure requirements
were fully met, and if not, identify why not. As noted in Section 2.1, this study focuses on
three sectors of physical infrastructure: telecommunications, power and transport. A
breakdown of each sector’s infrastructure investment policy is presented in the following
sections:
4 Rental power generation plants are set up to meet short-term and emergency requirements of a country and are typically commissioned within 4-6 months based on available technology. The rental periods are normally 5-7 years depending on the country’s need. Primarily, the concept was introduced in Pakistan in 2007 when two projects were awarded to GE and PPR, both from the USA, for 150MW and 136MW each. Rental power plants have now been set up in many countries such as the USA, UK, India, Bangladesh, Kuwait, Sri Lanka, Turkey, UAE, Saudi Arabia, Iraq and Palestine. (Murtaza Mohsin, 2009).

59
2.3.1 Telecommunications
Pakistan’s telecommunications network was greatly improved after independence.
The country did not inherit any international telecommunications system in 1947. At that
time, overseas telephone calls were only possible via Bombay (India, now known as
Mumbai). The country had 12,500 telephone connections in 1947, which increased to 37,000
in 1955. However, the number of telephone connections was planned to increase to 75,000
by 1960. A further substantial increase in telephone connections to 195,000 connections was
planned by 1970 (1-3 Five-Year Development Plans).
A large increase in communication traffic was experienced during 1978-1983, when
the system could not keep pace with the increasing demand, resulting in over-loading in the
telecommunications sector. Therefore, it was planned to clear the backlog in demand and
the expansion of telephone facilities to rural and underdeveloped areas. A target was set to
provide nationwide dialling facilities for 107 towns and cities by 1988 (6th Five-Year
Development Plan).
Telephone connection density was proposed to increase to 20.6 per 1000 population
by June 1993, compared with a density of 6.7 in June 1988. However, trunk call traffic was
estimated to increase at a rate of 14 percent per annum by 1998. Therefore, improving,
upgrading and extending Carrier Telephone Industries, Pakistan, to a telecommunication
training centre and manufacturer of telecom products, accessories and local network and
international gateway exchange through the installation of modern digital technology was
proposed to cope with the increase demand in the sector. Engaging the private sector in the
production of telecommunication equipment and Pakistan Telephone Corporation
operations was also planned.
Despite the proposed reform, telecommunications services were still beset by
mounting pressure to meet the rising demand for services and the extension of facilities to
remote and rural areas where they did not previously exist. The government also recognised
that there was room for improvement in the quality of service through adoption of modern
technology and operating procedures. Subsequently, the Ministry of Planning, Development
and Reform (2015) promulgated a strategy for developing the Information Technology (IT)
sector under the Public Sector Development Program (PSDP) 2014-15. The key goals of this
strategy were:

60
• International fibre bandwidth to be increased to develop e-commerce in the
country
• Wireless broadband networks to be extended to provide high speed internet
access for local use
• IT infrastructure to be improved to attract foreign IT companies to undertake
business in joint venture arrangements with domestic IT companies
• Data centres across the network to be created for growth of digital content to
increase economic activities, provision of improved social services and
expansion of local research
• Software Technology Parks to be set up to provide centres for value-added
activities such as increase in the use of IT and development of computer
software and applications
• Scholarships to be granted to 400 students to develop human resources
through a National ICT Scholarship Program
• A strategy for the sustainability of E-Government to be made to boost usage
of government online services, enhance efficiency and transparency in
governance.
2.3.2 Power
In 1960 the electric power policy set by the Ministry of Water and Power aimed to
achieve two major objectives by 1965. First, to meet the domestic and industrial demand for
electricity, the installed electric power capacity was to be increased from 905,500KW to
1,414,000KW5. Second, the Ministry aimed to provide abundant electric power at affordable
rates, to accelerate and strengthen agricultural and industrial development. In the next phase
of development (1965-1970) electric generation capacity was planned to increase to
2,270MW by extending existing power generation plants and constructing new ones. Third,
new transmission lines will be built and extended to serve additional generated electricity
and electrification of rural areas.
5 1 Mega-Watt = 1,000 Kilo-Watt

61
Consequently, electric generation capacity increased 20-fold between 1947 and
1970, from 130MW to 2590MW. Despite these improvements, the majority of the
population still had no access to electricity, with only 1.7 million out of a total population
of 132.3 million in 1970 registered as electricity consumers. Therefore, in the 4th
development plan 1970-1975 generation, transmission and distribution of electricity
throughout the country were given top priority (4th Five-Year Development Plan).
In July 1982, the maximum demand for electricity was recorded as 3050MW but this
was not met by the available power generation capacity, leading to power load-shedding (a
temporary reduction in a supply of electricity as a method of reducing the demand on the
generator). Consequently, it was then proposed to increase the installed electric generation
capacity up to 6849MW by 1988. These power generation targets had still not been met by
1993. Only 2018MW was installed against the planned addition to increase installed power
generation capacity to 3795MW. This resulted in only 53 percent of the target being
achieved. The main reasons for the shortfall were that the execution of a number of power
generation projects was delayed. In 1993 the demand was projected to 9570MW. Therefore,
the installed capacity was again targeted to increase to 13,112MW by the end of 1993.
Once again, 9.6 percent of the target had not been achieved due to resource
constraints and physical implementation delays. Besides these problems, private sector
power projects were also delayed due to overly optimistic and unachievable initial estimates
of completion timeframes and financing arrangements for the projects. During 1993-98, the
privatisation of the power sector was planned alongside the development of new power
projects through private investment to increase the power generation capacity and utilisation
of financial and managerial skills of the private sector.
According to AJC Consulting6 (2015), the Government of Pakistan has developed
and implemented four power policies through the Private Power & Infrastructure Board
(PPIB). To invite private investment in the country’s electricity generation sector, PPIB
announced:
• The first Policy for Private Power Generation Projects in 1994
• The second Policy for Hydropower Generation Projects in 1995
• The third Policy for Private Power Generation Projects in 1998
6 AJC Consulting provides management consultancy services to a variety of business sectors.
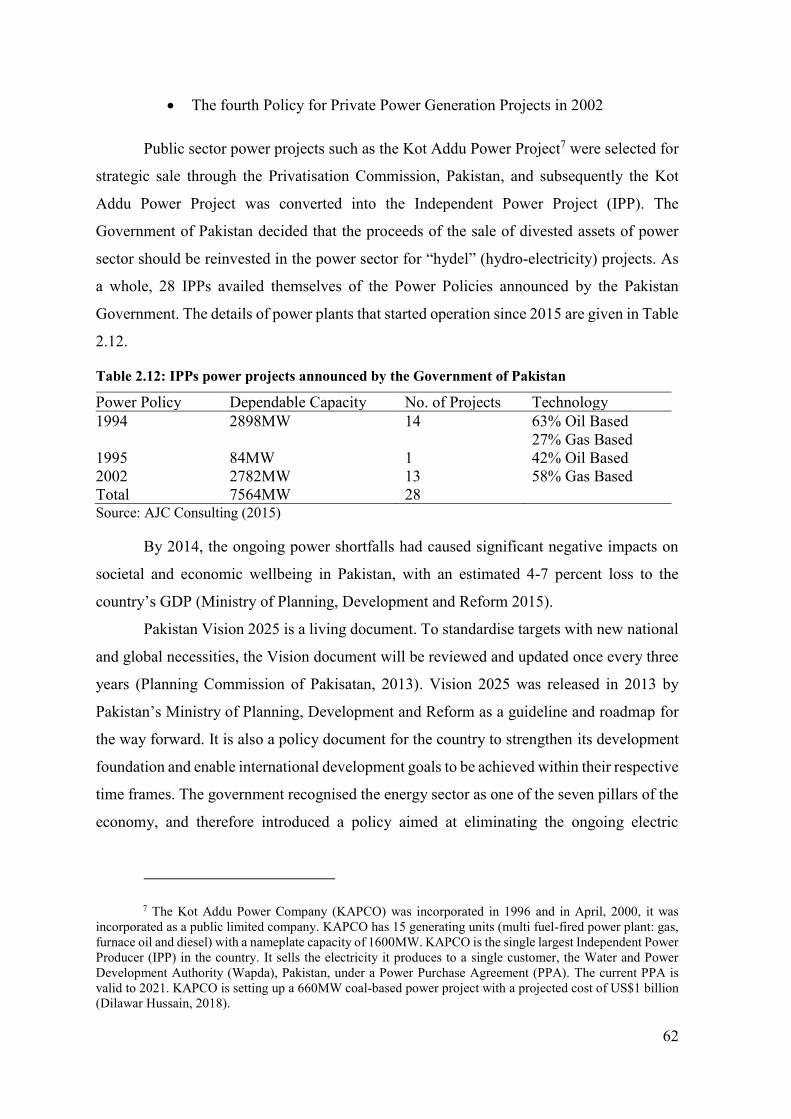
62
• The fourth Policy for Private Power Generation Projects in 2002
Public sector power projects such as the Kot Addu Power Project7 were selected for
strategic sale through the Privatisation Commission, Pakistan, and subsequently the Kot
Addu Power Project was converted into the Independent Power Project (IPP). The
Government of Pakistan decided that the proceeds of the sale of divested assets of power
sector should be reinvested in the power sector for “hydel” (hydro-electricity) projects. As
a whole, 28 IPPs availed themselves of the Power Policies announced by the Pakistan
Government. The details of power plants that started operation since 2015 are given in Table
2.12.
Table 2.12: IPPs power projects announced by the Government of Pakistan
Power Policy Dependable Capacity No. of Projects Technology 1994 2898MW 14 63% Oil Based
27% Gas Based 1995 84MW 1 42% Oil Based 2002 2782MW 13 58% Gas Based Total 7564MW 28 Source: AJC Consulting (2015)
By 2014, the ongoing power shortfalls had caused significant negative impacts on
societal and economic wellbeing in Pakistan, with an estimated 4-7 percent loss to the
country’s GDP (Ministry of Planning, Development and Reform 2015).
Pakistan Vision 2025 is a living document. To standardise targets with new national
and global necessities, the Vision document will be reviewed and updated once every three
years (Planning Commission of Pakisatan, 2013). Vision 2025 was released in 2013 by
Pakistan’s Ministry of Planning, Development and Reform as a guideline and roadmap for
the way forward. It is also a policy document for the country to strengthen its development
foundation and enable international development goals to be achieved within their respective
time frames. The government recognised the energy sector as one of the seven pillars of the
economy, and therefore introduced a policy aimed at eliminating the ongoing electric
7 The Kot Addu Power Company (KAPCO) was incorporated in 1996 and in April, 2000, it was incorporated as a public limited company. KAPCO has 15 generating units (multi fuel-fired power plant: gas, furnace oil and diesel) with a nameplate capacity of 1600MW. KAPCO is the single largest Independent Power Producer (IPP) in the country. It sells the electricity it produces to a single customer, the Water and Power Development Authority (Wapda), Pakistan, under a Power Purchase Agreement (PPA). The current PPA is valid to 2021. KAPCO is setting up a 660MW coal-based power project with a projected cost of US$1 billion (Dilawar Hussain, 2018).
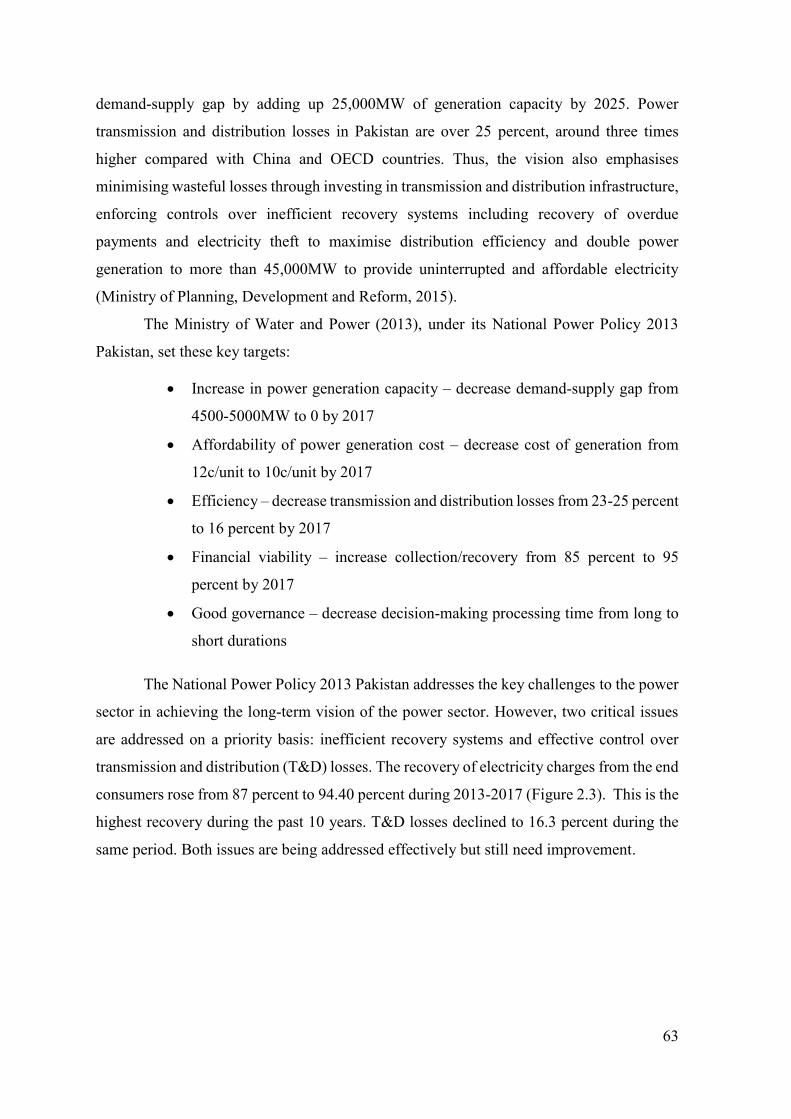
63
demand-supply gap by adding up 25,000MW of generation capacity by 2025. Power
transmission and distribution losses in Pakistan are over 25 percent, around three times
higher compared with China and OECD countries. Thus, the vision also emphasises
minimising wasteful losses through investing in transmission and distribution infrastructure,
enforcing controls over inefficient recovery systems including recovery of overdue
payments and electricity theft to maximise distribution efficiency and double power
generation to more than 45,000MW to provide uninterrupted and affordable electricity
(Ministry of Planning, Development and Reform, 2015).
The Ministry of Water and Power (2013), under its National Power Policy 2013
Pakistan, set these key targets:
• Increase in power generation capacity – decrease demand-supply gap from
4500-5000MW to 0 by 2017
• Affordability of power generation cost – decrease cost of generation from
12c/unit to 10c/unit by 2017
• Efficiency – decrease transmission and distribution losses from 23-25 percent
to 16 percent by 2017
• Financial viability – increase collection/recovery from 85 percent to 95
percent by 2017
• Good governance – decrease decision-making processing time from long to
short durations
The National Power Policy 2013 Pakistan addresses the key challenges to the power
sector in achieving the long-term vision of the power sector. However, two critical issues
are addressed on a priority basis: inefficient recovery systems and effective control over
transmission and distribution (T&D) losses. The recovery of electricity charges from the end
consumers rose from 87 percent to 94.40 percent during 2013-2017 (Figure 2.3). This is the
highest recovery during the past 10 years. T&D losses declined to 16.3 percent during the
same period. Both issues are being addressed effectively but still need improvement.
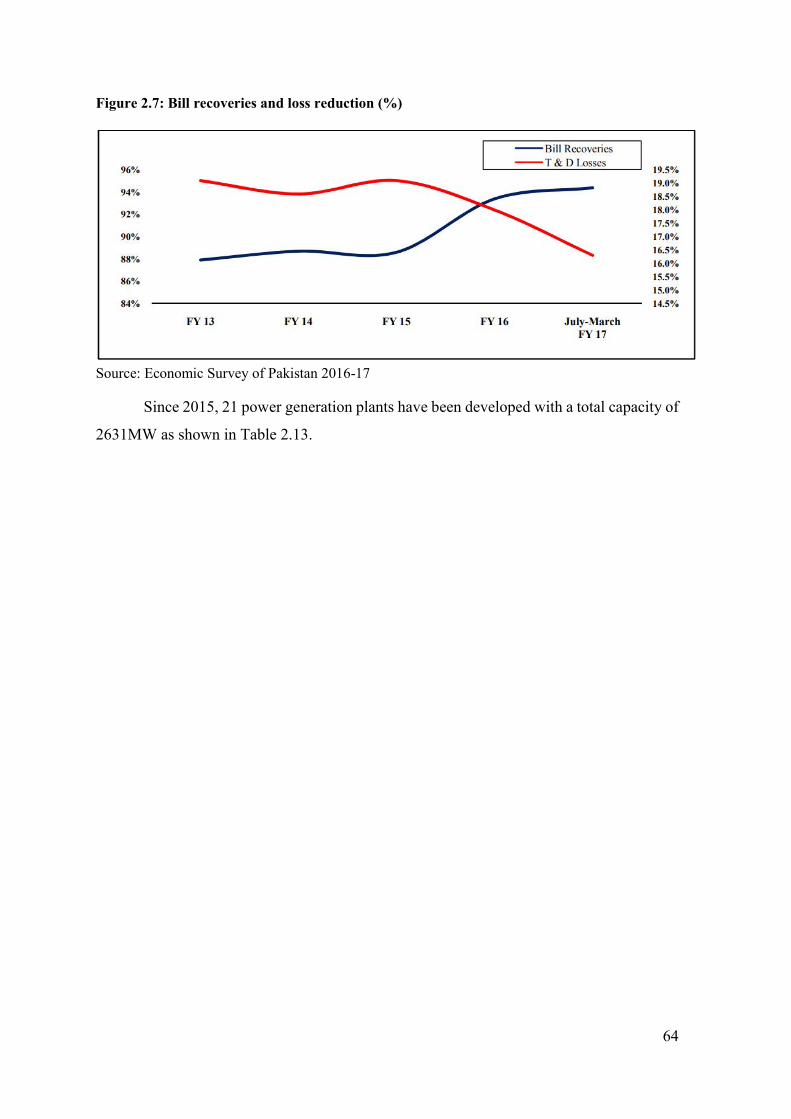
64
Figure 2.7: Bill recoveries and loss reduction (%)
Source: Economic Survey of Pakistan 2016-17
Since 2015, 21 power generation plants have been developed with a total capacity of
2631MW as shown in Table 2.13.

65
Table 2.13: List of Power Plants that have Started Operation since 2015
Source: Economic Survey of Pakistan, 2016-17
2015 2016 2017 Plant Name Fuel Type Installed
Capacity (MW)
Plant Name Fuel Type Installed Capacity
(MW)
Plant Name Fuel Type Installed Capacity
(MW) RYKML Bagasse 30 Apollo Solar Solar 100 Fatima Coal/Bagasse 120 FWEL-I Wind 50 Best Green Solar Solar 100 Hamza Bagasse 15 Quaid Azam Solar 100 Crest Energy Solar Solar 100 Bhiki Gas 760 Nandipur Furnace Oil 425 Younus Wind 50 Dawood Wind Wind 50 Sapphire Wind 50 Metro Wind 50 Sachal Wind Wind 50 Chiniot Bagasse 62 Tapal Wind 30 Master Wind 50
Tenaga Wind 50 Gul Ahmed Wind 50 Chashnupp-III Nuclear 340 Total 717 919 995
66
2.3.3 Transport
After independence, production in some sectors increased considerably and
generated heavy demand for transport services and facilities. An estimated increase of 23
percent in railways passenger-miles, 33 percent in freight ton-miles and 25 percent in cargo
handling in the port was experienced in the years following independence (1947). The
Planning Commission8 (1960) reported that demand for road transport had increased about
40 percent during 1960-1965. By contrast, providing the required investment to cover the
increasing demand of transportation facilities in full was not possible. Therefore, a small
amount was allocated in relation to the rising transportation needs (2nd Five-Year
Development Plan).
Currently, the transport sector contributes approximately 10 percent to the Pakistani
GDP and more than 6 percent of employment is linked to this sector. Pakistan’s Vision 2025
aims to achieve a reduction in transportation costs and high-speed connectivity (from farm
to market) between rural areas and markets and urban centres. The Vision 2025 policy also
targets the transport network between economic hubs such as Karachi seaport, Muhammad
bin Qasim port and Gawadar seaport and high-capacity transportation corridors connecting
major regional trading partners. The Vision 2025 has set targets for the transport sector to
raise road-density levels. The transport sector policy also outlines strategies to increase
roadways, railways and airport density. Therefore, a multi-modal transport system will be
established in light of Transport Strategy 2014-15 (Ministry of Planning, Development and
Reform, 2015). The transport policy focuses on:
• Rehabilitating and upgrading the existing transport infrastructure
• Enhancing the role of private sector participation and institutional capacity
building for transport sector development
• Using modern technology, procedures and processes by research and
development to increase sector efficiency.
8 The Planning Commission is a financial and public policy development institution of the Government of Pakistan. The Commission comes under the Ministry of Planning, Development and Reforms. It undertakes research and state policy development initiatives for the growth of national economy and the expansion of the public and state infrastructure, in collaboration with the Ministry of Finance.
67
2.3.3.1.1 Road sector
The 2nd Five-Year Development Plan emphasised road sector improvement.
Therefore, it was planned to construct and improve 3875km of roads by 1960. In 1960 the
country had 70,500km of paved roads. It was planned to improve existing roads of 250km
by 1965, and to develop paved roads of 12,750km by 1970, with the construction of new
roads of 1310km and improvement of existing roads of 3500km by 1975. Consequently, by
1988 the country had 113,000km of paved roads with an average density of 0.16km per
square km of area, which was about one-third of the generally accepted standard for
developing countries with similar topography and level of economic development. A
deficiency of 247,000km of roads was calculated. Besides this shortfall, structural
deficiencies of existing roads of about 6000km were identified. In 1983, construction of
5800km of new roads and improvement of 7860km of existing roads was proposed by 1988.
In addition, a rural road construction program for the construction of 40,000km of road was
planned to be launched by 1988.
In 1993, the average road density of Pakistan was 0.21km/sq.km, far less than the
generally accepted standard of 0.5km/sq.km for developing countries with similar
topography (Ministry of Planning, Development and Reform, 2015). This prompted a
proposal to give the highest priority to improve and upgrade the existing road network to fill
the gap and optimally utilise the system for speedy economic growth by 1998. Pakistan’s
Vision 2025 targets raising road density to 0.45km/sq.km by increasing the existing road
national network from around 260,000km to 358,000km (Ministry of Planning,
Development and Reform, 2015).
2.3.3.2 Railways sector
During 1960-1965, railways continued to develop and replace rolling stock,
rehabilitate equipment and tracks and modernise railways signalling systems. Specific
objectives were set to increase passenger traffic by 20% (6400 million) and freight miles by
40% (5260 million ton-miles) during the same period. Rehabilitating and upgrading railways
had been ongoing since independence. In 1978, further targets were set as to: upgrade
railways tracks, rehabilitate 74 broken locomotives and order 105 new locomotives,
manufacture 400 new carriages and replace 248 existing carriages and acquire 152 new
traffic carriages by 1983.
68
The rail sector had only partially achieved its major targets by 1988 in terms of
renewing 555km of rail tracks and 740km of sleepers, rehabilitating 42 locomotives and
acquiring 90 new locomotives. Targets were exceeded for passenger carriages,
manufacturing 525 passenger coaches and 130 bogie hopper trucks, in addition to work on
the telecommunication system and signalling project being completed. In 1988, a target was
set to manufacture a further 300 passenger carriages, 200 wagons and freight wagons and to
renew 650km of rail track by 1993. A number of uneconomic lines were selected for closure,
to minimise losses on railways operations during 1993-1998.
2.3.3.3 Air transport sector
At the time of independence, Pakistan’s airline had a new comprehensive
development plan under consideration. However, no final decision had been taken while
preparing the first Five-Year Development Plan for 1955-1960. However, the purchase of
nine aircraft, including two long-distance and seven medium distance aircraft, had been
included in the 1st Five-Year Development Plan. In 1960, it was estimated that the national
airline would carry about 52 million ton-miles of long-distance freight traffic per year and
the service would extend to the Middle East and Europe by 1965. In addition, skills, up-to-
date knowledge and know-how capabilities were to be built up for the manufacture of light
aircraft for charter operations, agricultural pest control, flight training and feeder aircraft
operations to the level of short take-off and landing aircraft by 1975.
In 1983, it was recognised that the inadequate infrastructure was a major deficiency
in the air transport sector and passenger and freight handling capacity of all major airports.
This sector needed improvement and expansion to fulfil long-term air traffic requirements.
The proposed development program for 1983-1988 was:
• To develop new terminal buildings and facilities as commercial ventures in the
cities of Karachi, Lahore and Islamabad
• To augment physical infrastructure of all airports to meet future traffic
requirements
• In case of emergencies, Nawab Shah Airport was to be used as an alternative
airport to Karachi (see Figure 2.2)
• New airports to be constructed at Chilas and Hunza division (see Figure 2.2)
• To ensure operational safety, high priority was given to improving and
augmenting air navigation and communication systems.
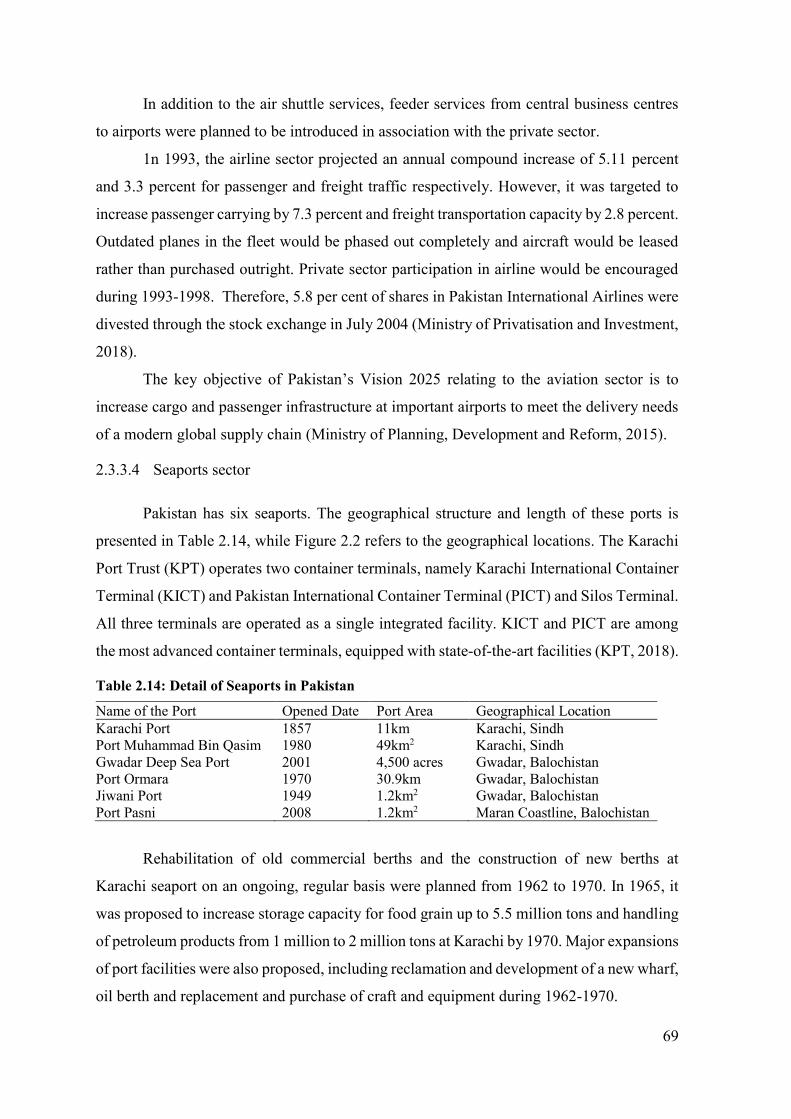
69
In addition to the air shuttle services, feeder services from central business centres
to airports were planned to be introduced in association with the private sector.
1n 1993, the airline sector projected an annual compound increase of 5.11 percent
and 3.3 percent for passenger and freight traffic respectively. However, it was targeted to
increase passenger carrying by 7.3 percent and freight transportation capacity by 2.8 percent.
Outdated planes in the fleet would be phased out completely and aircraft would be leased
rather than purchased outright. Private sector participation in airline would be encouraged
during 1993-1998. Therefore, 5.8 per cent of shares in Pakistan International Airlines were
divested through the stock exchange in July 2004 (Ministry of Privatisation and Investment,
2018).
The key objective of Pakistan’s Vision 2025 relating to the aviation sector is to
increase cargo and passenger infrastructure at important airports to meet the delivery needs
of a modern global supply chain (Ministry of Planning, Development and Reform, 2015).
2.3.3.4 Seaports sector
Pakistan has six seaports. The geographical structure and length of these ports is
presented in Table 2.14, while Figure 2.2 refers to the geographical locations. The Karachi
Port Trust (KPT) operates two container terminals, namely Karachi International Container
Terminal (KICT) and Pakistan International Container Terminal (PICT) and Silos Terminal.
All three terminals are operated as a single integrated facility. KICT and PICT are among
the most advanced container terminals, equipped with state-of-the-art facilities (KPT, 2018).
Table 2.14: Detail of Seaports in Pakistan
Name of the Port Opened Date Port Area Geographical Location Karachi Port 1857 11km Karachi, Sindh Port Muhammad Bin Qasim 1980 49km2 Karachi, Sindh Gwadar Deep Sea Port 2001 4,500 acres Gwadar, Balochistan Port Ormara 1970 30.9km Gwadar, Balochistan Jiwani Port 1949 1.2km2 Gwadar, Balochistan Port Pasni 2008 1.2km2 Maran Coastline, Balochistan
Rehabilitation of old commercial berths and the construction of new berths at
Karachi seaport on an ongoing, regular basis were planned from 1962 to 1970. In 1965, it
was proposed to increase storage capacity for food grain up to 5.5 million tons and handling
of petroleum products from 1 million to 2 million tons at Karachi by 1970. Major expansions
of port facilities were also proposed, including reclamation and development of a new wharf,
oil berth and replacement and purchase of craft and equipment during 1962-1970.

70
Traffic through the ports increased about 15.5 percent during 1969-1970 and it was
estimated that the traffic would increase from 15.8 to 29.5 million tons in 1974-1975,
however, the facilities at that point were inadequate. Therefore, short-term measures were
proposed such as improvement in cargo handling and clearance and diversion of maximum
imported cargo to other ports. It was also proposed to develop additional port facilities, either
as a second port or expansion of Karachi Port as a long-term measure.
The port facilities were considerably improved between 1978 and 1983. Based on
the cargo traffic movement in 1983, cargo traffic was projected to increase at a rate of 7
percent per annum over the next five years (by 1988). Consequently, it was planned to use
the optimum capacities of both Karachi Port and Port Qasim in addition to creating a
National Port Authority to manage both ports including a mini-port (the third port) at
Gwadar. In 1988, it was planned to develop seaport infrastructure, railways and road
transport facilities including encouraging the private sector to participate in cargo handling
and transportation of containers to enable efficient container movement.
Seaport traffic was projected to increase at a rate of 3.6 percent per annum from 1993
to 1998. The port facilities would be supported and augmented with intermodal
infrastructure to ensure maximum utilisation of container movement. Therefore, railways
would be geared towards container movement. Further, the private sector would be
encouraged to participate in the expansion of port infrastructure including cargo handling,
construction of a container and oil terminal at Port Qasim and construction of a deep-sea
port at Gwadar by 1998. The present seaport infrastructure requires significant investment
to upgrade cargo handling facilities. Therefore, under Vision 2025 it is proposed that seaport
facilities be upgraded to meet global efficiency and cargo-handling standards and shipping
services (Ministry of Planning, Development and Reform, 2015). However, in late 2015, the
port was officially leased to China for 43 years, until 2059. Gwadar Port became formally
operational on 14 November 2016 (Dawn.com, 2016). A total of 80.4 metric tons of cargo
(imports plus exports) was handled during financial year 2016-17 (Economic Survey, 2017-
18).
In summary, the infrastructure investment pattern in Pakistan has shown
considerable fluctuation and decline over time. Public sector infrastructure allocations was
12.3 percent in 1970s, 4 percent in the 1980s and 3 percent in the 1990s (Looney, 1997).
The plans for physical infrastructure development in Pakistan have never been achieved
according to their planned targets, thus increasing the infrastructure demand versus supply
71
gap. However, Pakistan’s economy progressed between 1960 and 1965. Although it was
ruled by a military regime, the country was successful in gaining foreign aid and
international financial assistance. The causes and reasons of inadequate physical
infrastructure facilities in Pakistan are identified in the next section 2.4.
2.4 Causes of insufficient infrastructure facilities in Pakistan
The principal causes for ongoing inadequate infrastructure facilities in Pakistan may
be studied in two phases:
• Lack of managerial capacity and skilled human resources
• Lack of financial resources and budgetary constraints
2.4.1 Lack of managerial capacity and skilled human resources
Since independence, a persistent problem with Pakistan’s economy has been low
productivity and the inability to achieve self-sustainability due to reliance on imports rather
than domestic industries. The country has also suffered a shortage of equipment, material
and skilled human resources, and this has hindered implementation of development plans
(National Planning Board, 1957).
Between 1 July 1965 and 30 June 1966, all sectors of the economy increased. The
targeted development plans were achieved as the actual growth rate surpassed the projected
growth rate. GNP recorded a growth of 30 percent compared with the proposed rate of 24
percent in the development plan 1965-70 and per capita income grew by 15 percent
compared with the projected 12 percent over the planning period (National Planning Board,
1960, 1965).
However, during 1970-75 the performance of all sectors of the economy fell far
behind projections. There was a substantial decline in the growth rate particularly, in large
scale industry, due to the third war with India that started on 3 December 1971 and ended
on 16 December 1971 with the emergence of the independent state of Bangladesh (formerly
East Pakistan) (Planning Commission of Pakisatan, 1970).
All plans for 1970-75 were abandoned after the separation of Bangladesh (East
Pakistan), and only annual plans were prepared. During 1971-72, the annual growth rate had
declined by 6.8 percent due to the war with India, strict credit policies and the East Pakistan
crisis that led to the formation of Bangladesh (Five-Year Development Plan (1978-1983).
The social sector, including housing, health and education, was not given due attention in

72
planning during the same period. In 1977, the military took over the government, martial
law was imposed and civilian government policies were suspended. The military, rather than
government departments, drafted the development plan for the next five years (1978-1983).
The development plan was implemented in very difficult and unfavourable conditions due
to a rapid increase in imports and a fast decrease in foreign exchange reserves. Consequently,
no major new projects were planned and priority was given to completing ongoing projects
only. During the military regime, the private sector played a limited role in infrastructure
development (Planning Commission of Pakisatan, 1970, 1988).
The major issue in implementing infrastructure development plans during the period
of martial law was the inadequate capacity of public-sector organisations to execute plans
and implement projects. Lack of management and adequate capacity resulted in time and
cost overruns of the projects. Consequently, some projects of an operational nature were
affected. Project execution lagged far behind the schedule, so the expected benefits from the
projects could not be realised in time. Therefore, experienced and qualified professionals
were needed at a managerial level in the project executing organisations to ensure proper
implementation and achievement of planned objectives (Ministry of Planning Development
and Reform, 2015).
2.4.2 Lack of financial resources and budgetary constraints
Developing countries such as Pakistan finance public infrastructure projects through
various resources such as tax revenues, bilateral and multilateral lenders and private
investment. Despite borrowing from domestic commercial banks, government security
bonds and international financial institutions such as the International Monetary Fund, the
World Bank and the Asian Development Bank, Pakistan also depends on external financial
assistance to cover its budget deficit. During the financial year 2009-10, external assistance
was lower than the expected level, which led to sharp cutbacks in expenditure for the PSDP
(Ministry of Finance, 2011). According to credit rating9 agency Moody’s (2012), Pakistan’s
broad policy framework has not been robust enough to ensure support from donors and
creditors or to effectively contain macroeconomic imbalances that have arisen since the
global financial crisis in 2008.
9 See Glossary of Technical Terms.
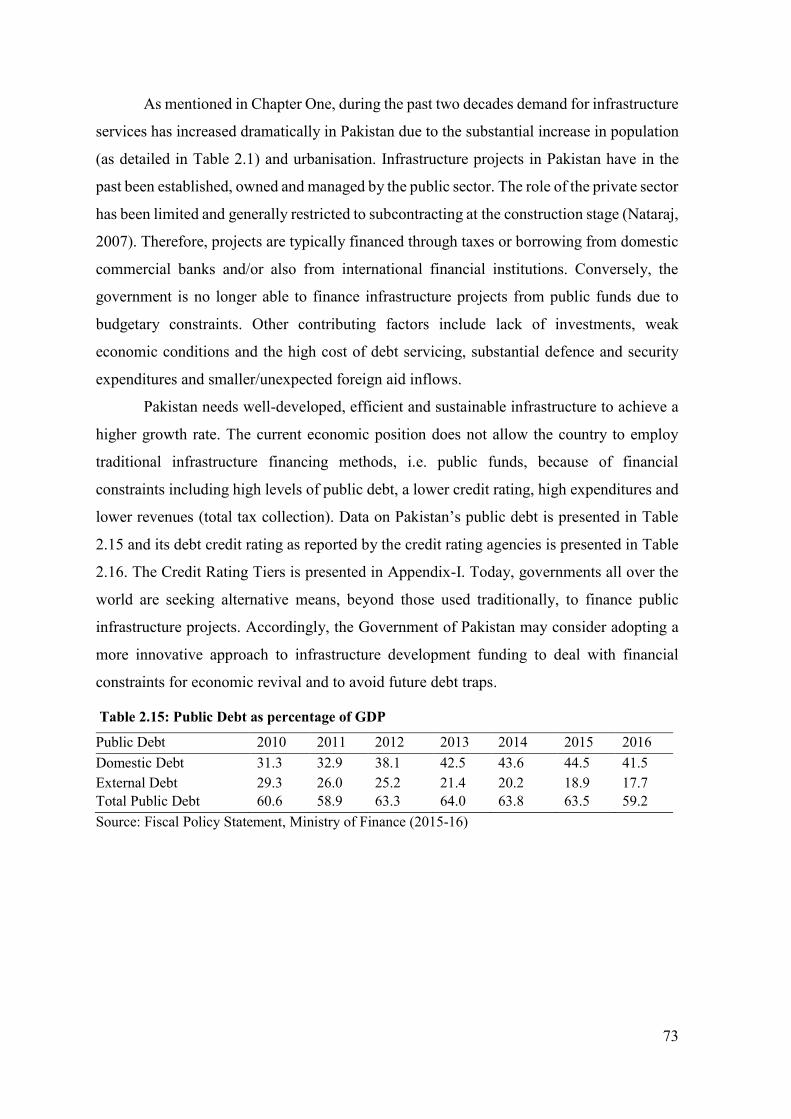
73
As mentioned in Chapter One, during the past two decades demand for infrastructure
services has increased dramatically in Pakistan due to the substantial increase in population
(as detailed in Table 2.1) and urbanisation. Infrastructure projects in Pakistan have in the
past been established, owned and managed by the public sector. The role of the private sector
has been limited and generally restricted to subcontracting at the construction stage (Nataraj,
2007). Therefore, projects are typically financed through taxes or borrowing from domestic
commercial banks and/or also from international financial institutions. Conversely, the
government is no longer able to finance infrastructure projects from public funds due to
budgetary constraints. Other contributing factors include lack of investments, weak
economic conditions and the high cost of debt servicing, substantial defence and security
expenditures and smaller/unexpected foreign aid inflows.
Pakistan needs well-developed, efficient and sustainable infrastructure to achieve a
higher growth rate. The current economic position does not allow the country to employ
traditional infrastructure financing methods, i.e. public funds, because of financial
constraints including high levels of public debt, a lower credit rating, high expenditures and
lower revenues (total tax collection). Data on Pakistan’s public debt is presented in Table
2.15 and its debt credit rating as reported by the credit rating agencies is presented in Table
2.16. The Credit Rating Tiers is presented in Appendix-I. Today, governments all over the
world are seeking alternative means, beyond those used traditionally, to finance public
infrastructure projects. Accordingly, the Government of Pakistan may consider adopting a
more innovative approach to infrastructure development funding to deal with financial
constraints for economic revival and to avoid future debt traps.
Table 2.15: Public Debt as percentage of GDP
Public Debt 2010 2011 2012 2013 2014 2015 2016 Domestic Debt 31.3 32.9 38.1 42.5 43.6 44.5 41.5 External Debt 29.3 26.0 25.2 21.4 20.2 18.9 17.7 Total Public Debt 60.6 58.9 63.3 64.0 63.8 63.5 59.2 Source: Fiscal Policy Statement, Ministry of Finance (2015-16)
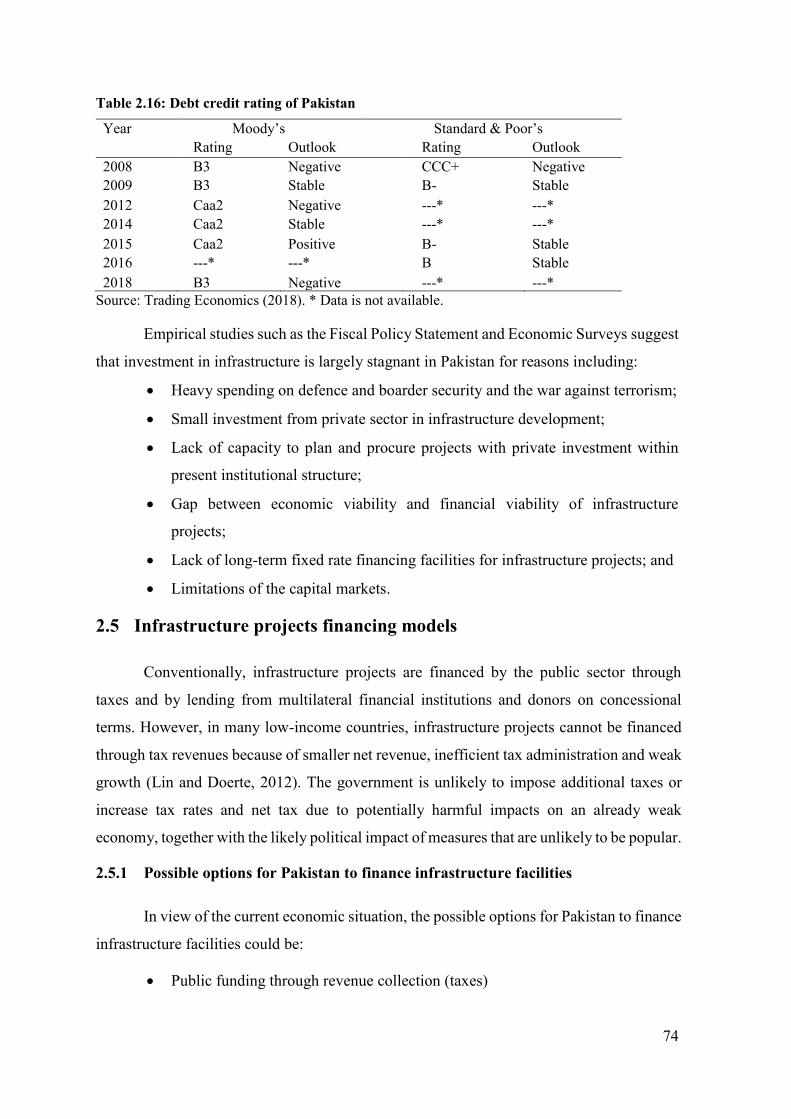
74
Table 2.16: Debt credit rating of Pakistan
Year Moody’s Standard & Poor’s Rating Outlook Rating Outlook 2008 B3 Negative CCC+ Negative 2009 B3 Stable B- Stable 2012 Caa2 Negative ---* ---* 2014 Caa2 Stable ---* ---* 2015 Caa2 Positive B- Stable 2016 ---* ---* B Stable 2018 B3 Negative ---* ---*
Source: Trading Economics (2018). * Data is not available.
Empirical studies such as the Fiscal Policy Statement and Economic Surveys suggest
that investment in infrastructure is largely stagnant in Pakistan for reasons including:
• Heavy spending on defence and boarder security and the war against terrorism;
• Small investment from private sector in infrastructure development;
• Lack of capacity to plan and procure projects with private investment within
present institutional structure;
• Gap between economic viability and financial viability of infrastructure
projects;
• Lack of long-term fixed rate financing facilities for infrastructure projects; and
• Limitations of the capital markets.
2.5 Infrastructure projects financing models
Conventionally, infrastructure projects are financed by the public sector through
taxes and by lending from multilateral financial institutions and donors on concessional
terms. However, in many low-income countries, infrastructure projects cannot be financed
through tax revenues because of smaller net revenue, inefficient tax administration and weak
growth (Lin and Doerte, 2012). The government is unlikely to impose additional taxes or
increase tax rates and net tax due to potentially harmful impacts on an already weak
economy, together with the likely political impact of measures that are unlikely to be popular.
2.5.1 Possible options for Pakistan to finance infrastructure facilities
In view of the current economic situation, the possible options for Pakistan to finance
infrastructure facilities could be:
• Public funding through revenue collection (taxes)
75
• Lending from international financial institutions
• Capital market
• Infrastructure financing facilities
• Issuance of international bonds
• Private sector participation
2.5.1.1 Public funding through revenue collection (taxes)
The fiscal performance review of Pakistan from various Economic Surveys of Pakistan
from 1991 to 2017 revealed that overall performance of key macroeconomic indicators such
as total revenue collection, total expenditures, public debt and fiscal deficit has been deviating
from fiscal targets for decades. For instance, during the financial year 2011, both revenues and
expenditures have missed targets, leading to a budget deficit. Gross revenue collection was
12.1 percent lower (tax collection fell 6.4 percent and non-tax collections were 23.6 percent
below the target), while total expenditures (current and development) were 2.4 percent higher
than the budgetary estimates. PSDP spending was 24 percent lower than the target. The budget
deficit has been around 4-6 percent of GDP during the past two decades, while the budget
deficit during the financial year 2011-12 was 4 percent of GDP10 (Ministry of Finance, 2012).
Conversely, as noted above, the government cannot increase its revenues by imposing
additional taxes, or increase tax rates and net tax, due to adverse effects on the weak economy
and for political reasons (Ministry of Finance, 2012).
2.5.1.2 Lending from international financial institutions
Under the FRDL Act 200511, the country cannot borrow more than 60 percent of
GDP. However, during the financial year 2011, the country’s public debt reached at its
highest limits i.e. 59.3 percent of GDP. The total public debt in terms of revenue had
increased 64 percent in 2013. The lending option from international financial institutions is
not workable for the time being. Secondly, the country’s credit rating is low and may not be
10 FRDL Act, 2005 amended in 2016 as part of the Financial Bill. FRDL limits the federal fiscal deficit excluding foreign grants to 4 percent of gross domestic product during the three years, beginning from the financial year 2017-18, and maintaining it at a maximum of 3.5 percent of gross domestic product thereafter (Ministry of Finance, 2016).
11 FRDL Act 2005 ensures that within a period of two financial years, beginning from the financial year 2016-17, the total public debt shall be reduced to 60 percent of the estimated gross domestic product (Ministry of Finance, 2016).
76
strong enough to convince international financial institutions (creditors) to lend money to
Pakistan (Ministry of Finance, 2011).
2.5.1.3 Capital market
The country’s capital market is very limited, with only three stock exchanges, one in
each of the main cities (Karachi, Lahore and Islamabad). Therefore, the limited capital
market network is unable to encompass the country’s total savings and, in particular, attract
investors from small cities and remote areas.
2.5.1.4 Infrastructure financing facilities
Governments use specialised financing facilities to offer financial support and
encourage private funding for provision of infrastructure services (Klingebiel, Ruster, &
World Bank, 2000). Infrastructure projects typically require long-term investment (10-20
years). However, traditional lending resources (commercial banks) do not offer long-term
loans facilities for large infrastructure projects.
2.5.1.5 Issuance of international bonds
This option may not attract international investors as credit rating agencies have
assessed that the country’s susceptibility to event risk is high due to uncertainty of returns,
exchange rate exposure and higher transaction costs. According to Standard and Poor’s
August, 200912assessment, Pakistan’s credit rating is B-. This means the country is more
vulnerable to adverse business, financial and economic conditions but currently has the
capacity to meet financial commitments. However, Moody’s Investors Service has declared
in its annual report in February 2012 that Pakistan’s credit rating is B3, which reflects the
country’s low economic, institutional and government financial strengths, and its high
susceptibility to event risk. Moody’s assessment is based on four factors: economic strength
– which is characterised as “low”; institutional strength – “low”; government financial
strength – “low”; and susceptibility to event risk – “high”. Details of various credit rating
tiers and credit rating definitions by major credit rating agencies are placed in Appendix-I
and Appendix-II respectively (Moody’s, 2012).
12 Ratings from “AA” to “CCC” may be modified by the addition of a plus (+) or minus (-) sign to show relative standing within the major rating categories. Negative means that a rating may be lowered.

77
Moody’s (2012) further explains that Pakistan's “low” economic strength reflects the
weak economic growth trend since the 2008 global financial crisis, a trend that has also been
constrained by policy framework weakness and structural weaknesses. Macroeconomic
imbalances caused a high level of inflation and pressures on the government’s payments
position in the second half of 2011. The second factor, Pakistan's “low” institutional strength,
is partly a reflection of the fractious character of politics. The third factor, “low” government
financial strength, reflects the presence of a high debt burden and large refinancing
requirements.
2.5.1.6 Private sector participation
Social and economic infrastructure contributes immensely to all economic activities,
improves living standards and human welfare and also has considerable potential for
reducing poverty directly. Many countries have employed several different financing
methods for infrastructure development but they are still short of the required infrastructure
facilities (Adeniyi, Aje, & Ogunsemi, 2011).
Presently, concurrent budgetary stringencies and demand for improvement in public
facilities have persuaded governments to involve the private sector for provision of public
infrastructure facilities, to harness private investments and achieve better value for money13
(Grimsey & Lewis, 2004). Procurement of public infrastructure by getting the private sector
to design, finance, build, operate and maintain it for a contract period is a well-established
practice in Europe, the US and Australia (Cheung, Chan, & Kajewski, 2012). Cheung, Chan,
and Kajewski (2009) referring to Walker et al. (1995) suggested three reasons for
participation of private sector in infrastructure development: i) the private sector saves
project costs in planning, design and construction, relieves administrative burdens and
avoids bureaucratic formalities; ii) the private sector can provide better service to the public
sector and maintain balance risk-return structure; and iii) the private sector can mitigate the
financial burden of the government. The key reasons several governments have joined hands
with the private sector are to have access to finance, use of modern technologies, managerial
proficiency and good entrepreneurial spirit (Adeniyi et al., 2011).
13 See Glossary of Technical Terms.

78
The success of private sector participation in the provision of public infrastructure
typically lies in the commitment and competence of the public management, government
guarantee for project implementation, favourable economic conditions, stable political and
social environments, selection of an appropriate concessionaires and availability of financial
markets (Cheung et al., 2012). Adeniyi et al. (2011) noted that a transparent and sound
regulatory framework is necessary for private-sector participation in infrastructure
development, including respect for contract agreements, protection from expropriation,
quick and satisfactory dispute settlement and legitimate recovery of costs and profit
proportional to the project-related risks undertaken. Samii, Van, and Bhattacharya (2002)
have identified that the private and public sectors must have a symmetry in commitment and
objectives, intensive communication and good working relations for successful participation
of the private sector in infrastructure development.
Regan, Smith, and Love (2009) point to the advantages of private participation in
infrastructure development over traditional procurement methods as: i) improved public
services and qualitative user outcomes; ii) reduced procurement costs and improved value
for money outcomes; iii) delivery of projects on budget and on time; iv) improved project
management – integration of design and construction processes and full lifecycle costing;
and v) introduction of innovation and new technologies. Private sector participation in
infrastructure development brings new investment opportunities and increased efficiency in
project delivery (Van Ham & Koppenjan, 2001).
2.5.2 Infrastructure project financing structure in Pakistan
Overall infrastructure investment of Pakistan primarily relies on public sector
development plans. Foreign direct investment and private sector participation in
infrastructure development are other sources of fixed capital formation.
2.5.2.1 Public Sector Development Program
The PSDP and the Annual Development Program (for federal and provincial
governments) are developed at federal level by the Planning Commission, Ministry of
Planning, Development and Reforms. These are the main mechanisms for implementing
public-sector economic plans as well as the major source of public sector investment in
Pakistan. Public funds are allocated through the PSDP to develop infrastructure, and to fund
poverty alleviation programs through generating employment opportunities. The aim is to
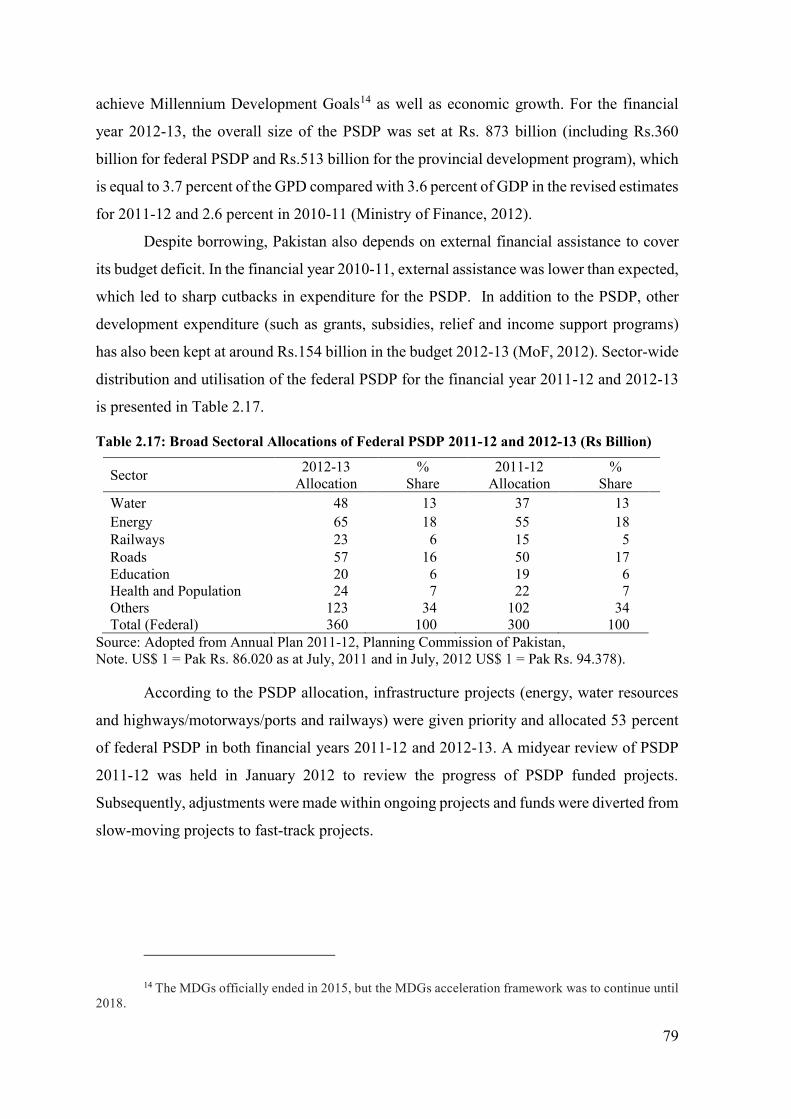
79
achieve Millennium Development Goals14 as well as economic growth. For the financial
year 2012-13, the overall size of the PSDP was set at Rs. 873 billion (including Rs.360
billion for federal PSDP and Rs.513 billion for the provincial development program), which
is equal to 3.7 percent of the GPD compared with 3.6 percent of GDP in the revised estimates
for 2011-12 and 2.6 percent in 2010-11 (Ministry of Finance, 2012).
Despite borrowing, Pakistan also depends on external financial assistance to cover
its budget deficit. In the financial year 2010-11, external assistance was lower than expected,
which led to sharp cutbacks in expenditure for the PSDP. In addition to the PSDP, other
development expenditure (such as grants, subsidies, relief and income support programs)
has also been kept at around Rs.154 billion in the budget 2012-13 (MoF, 2012). Sector-wide
distribution and utilisation of the federal PSDP for the financial year 2011-12 and 2012-13
is presented in Table 2.17.
Table 2.17: Broad Sectoral Allocations of Federal PSDP 2011-12 and 2012-13 (Rs Billion)
Sector 2012-13 Allocation
% Share
2011-12 Allocation
% Share
Water 48 13 37 13 Energy 65 18 55 18 Railways 23 6 15 5 Roads 57 16 50 17 Education 20 6 19 6 Health and Population 24 7 22 7 Others 123 34 102 34 Total (Federal) 360 100 300 100
Source: Adopted from Annual Plan 2011-12, Planning Commission of Pakistan, Note. US$ 1 = Pak Rs. 86.020 as at July, 2011 and in July, 2012 US$ 1 = Pak Rs. 94.378).
According to the PSDP allocation, infrastructure projects (energy, water resources
and highways/motorways/ports and railways) were given priority and allocated 53 percent
of federal PSDP in both financial years 2011-12 and 2012-13. A midyear review of PSDP
2011-12 was held in January 2012 to review the progress of PSDP funded projects.
Subsequently, adjustments were made within ongoing projects and funds were diverted from
slow-moving projects to fast-track projects.
14 The MDGs officially ended in 2015, but the MDGs acceleration framework was to continue until 2018.

80
2.5.2.2 Private sector participation in infrastructure in Pakistan
Over the past five decades, public infrastructure in Pakistan has made some progress.
However, the rate of improvement has been slowest for the majority of public infrastructure
sectors compared with other similar countries, due to the weak economic growth
performance of the country. Furthermore, infrastructure improvement has been insufficient
to improve the infrastructure conditions of Pakistani citizens (Norman & Tomoko, 2012).
According to Business Monitor International (2016) Pakistan’s construction sector
is facing hardships due to lack of protection for property owners, limited government
spending and a worsening security situation, which continues to deter private investment
and particularly foreign investors. Although the country has the potential for substantial
infrastructure growth, it has suffered from years of underinvestment. A number of
infrastructure projects are currently planned/in the pipeline in Pakistan. Many projects are
receiving funding from regional bodies such as the Asian Development Bank. Pakistan also
receives infrastructure investment from China. Power infrastructure is the focus of
investment as the country attempts to address its electricity generation shortfall. The power
sector has numerous issues such as a high level of circular debt from the public and private
sectors15. In short, currently all infrastructure sectors are suffering from a high deficit
(Business Monitor International, 2016).
Generally, infrastructure projects in Pakistan are financed through public investment.
According to the Public-Private Infrastructure Advisory Facility (PPIAF) and World Bank’s
database, 64 infrastructure projects with a total investment of US$28,553 million16 were
developed with private-sector participation during the period 1990 to 2011. Of these, a
maximum of 50 projects were developed in the energy sector with US$10,933 million, while
the telecom sector was successful in attracting the highest investment of US$16,262 million
for six projects. However, the water sector was neglected by the private sector and received
no investment. A brief overview of the status of yearly and sector-wide infrastructure
projects with private-sector participation is provided in Table 2.15.
15 The Independent Power Producers (IPPs) in Pakistan most operate oil-fired or coal-fired plants. The Pakistani government provides them the fuel for which the IPPs need to pay. Public owned electricity boards procure power from the IPPs and distribute it to the general public. Eventually, they charge the public and need to pay the IPPs. Often, the electricity boards are unable to pay the IPPs for the power procured and in turn, IPPs are unable to pay the Government for the fuel supplied (Gourishankar, 2017) 16 AUS$1 = US$1.35 (on 23/06/2018. Oanda Currency Converter. https://www.oanda.com/currency/converter)

81
The trend in infrastructure investment in Pakistan from 1981 to 2010 as a percentage
of GDP is shown in Figure 2.4. The investment trend illustrates that private investment has
exceeded public investment in the most recent decade. However, private sector investment
in Pakistan is still the lowest compared with its neighbouring countries.
Figure 2.8: Total infrastructure investment (public and private) from 1981 to 2009 as percent of GDP
Source: Business Monitor International (2016)
The trend in Pakistan’s investment (public and private) in the electricity sector shows
that public investment has been a dominant force over the past three decades and is still a
primary source of investment. In the 1980s, investment in the electricity sector was
completely dependent on the public sector, which steadily rose above 2.5 percent of GDP.
The level of public investment in the power sector (electricity generation) dropped in 1997
and has declined to less than 0.5 percent of GDP in the 2000s due to government’s strategic
plan of 1992 for restructuring the power sector that called for privatisation of electric power.
Subsequently, private investment experienced a sharp increase totalling roughly 1 percent
of GDP in 1995, but the boom lasted only for the following few years. Over the past decade,
private investment reached about 0.5 percent of GDP and continued to decrease to about 0.2
percent of GDP in 2010 (Figure 2.5).

82
Figure 2.9: Electricity sector investment (public and private) from 1981 to 2009 as percent of GDP
Source: Business Monitor International (2016)
Private investment in transportation and telecommunication is aggregated, while
public investment can be disaggregated between the two sectors due to the availability of
data. Public investment in the transport sector consistently declined in the 1980s and
stagnated during the 1990s. In 2004, public investment in the transport sector rose slightly,
but it again decreased over recent years and hit the lowest record of less than 0.3 percent of
GDP in 2010.
Overall, public investment in the telecommunications sector is on a declining trend.
In 1980s public investment increased and maintained its level in the 1990s. However, it has
declined significantly since 2003. In contrast to the declining trend in public investment,
private investment in transport and telecommunication rose considerably after 2002. In the
1980s and 1990s, private investment in the two sectors amounted to less than or close to 1
percent of GDP but jumped to 4 percent in 2006. The increase in private investment was
caused by the increasing participation of private sector in the telecommunication services
(see Figure 2.6).
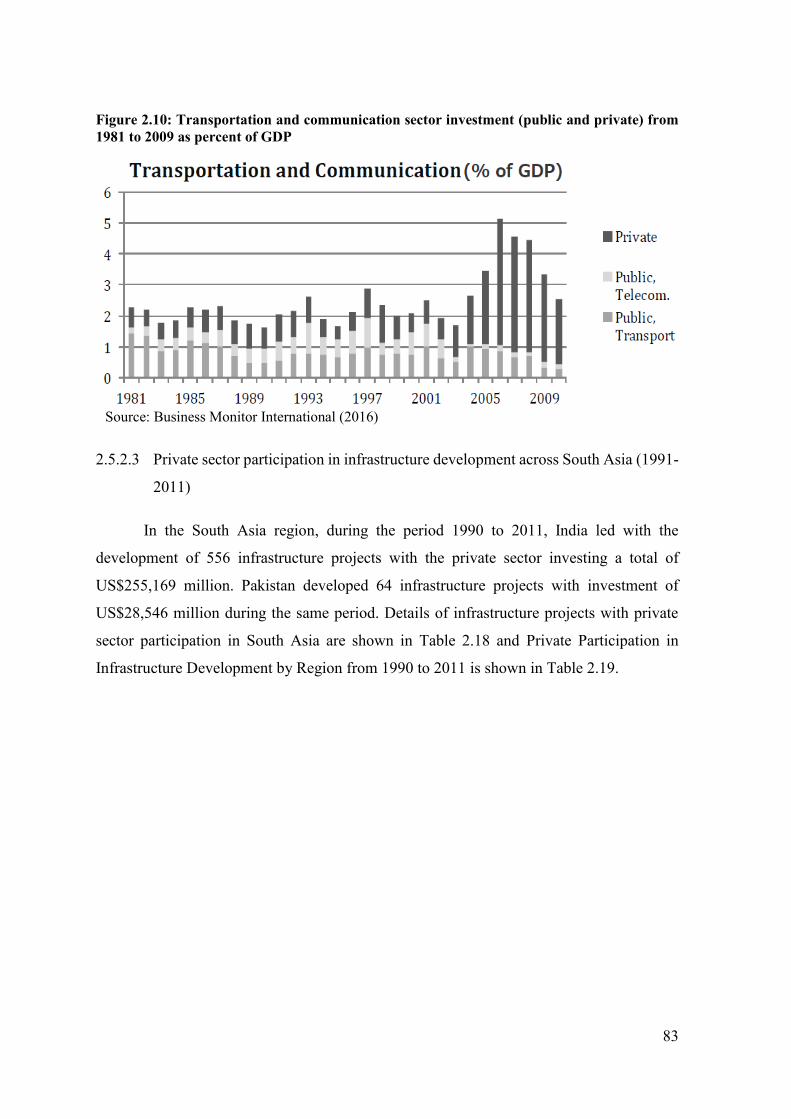
83
Figure 2.10: Transportation and communication sector investment (public and private) from 1981 to 2009 as percent of GDP
Source: Business Monitor International (2016)
2.5.2.3 Private sector participation in infrastructure development across South Asia (1991-
2011)
In the South Asia region, during the period 1990 to 2011, India led with the
development of 556 infrastructure projects with the private sector investing a total of
US$255,169 million. Pakistan developed 64 infrastructure projects with investment of
US$28,546 million during the same period. Details of infrastructure projects with private
sector participation in South Asia are shown in Table 2.18 and Private Participation in
Infrastructure Development by Region from 1990 to 2011 is shown in Table 2.19.
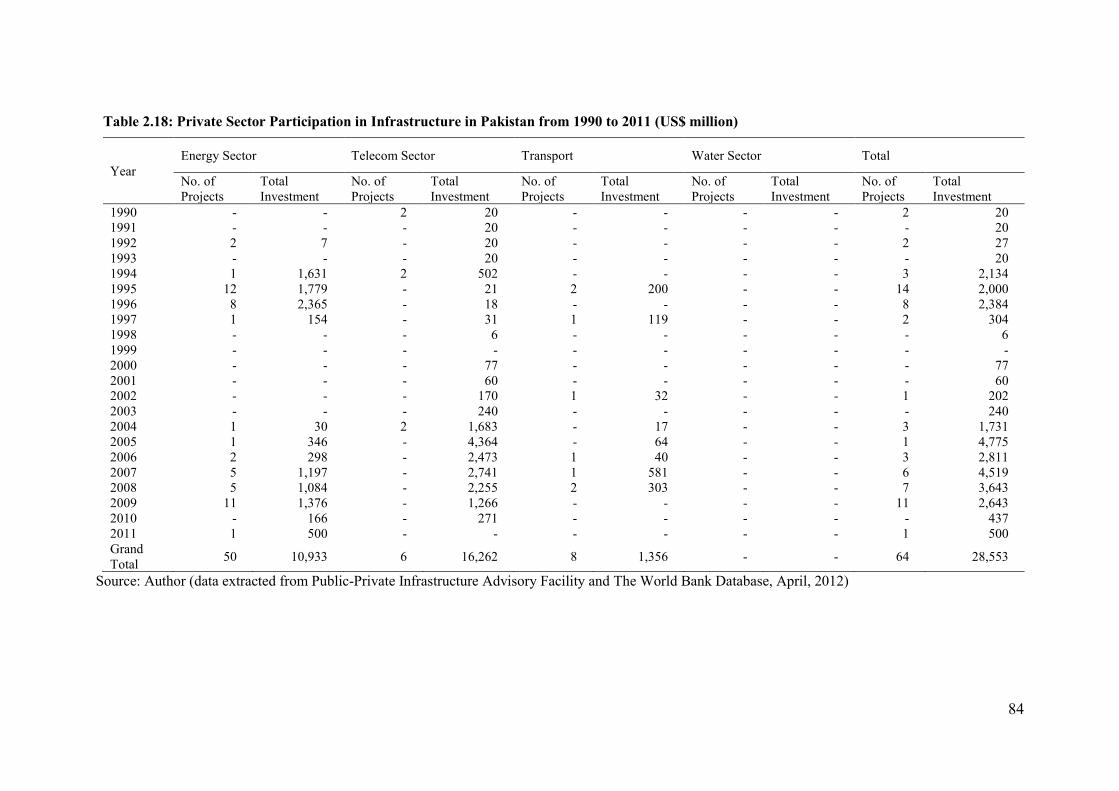
84
Table 2.18: Private Sector Participation in Infrastructure in Pakistan from 1990 to 2011 (US$ million)
Year Energy Sector Telecom Sector Transport Water Sector Total
No. of Projects
Total Investment
No. of Projects
Total Investment
No. of Projects
Total Investment
No. of Projects
Total Investment
No. of Projects
Total Investment
1990 - - 2 20 - - - - 2 20 1991 - - - 20 - - - - - 20 1992 2 7 - 20 - - - - 2 27 1993 - - - 20 - - - - - 20 1994 1 1,631 2 502 - - - - 3 2,134 1995 12 1,779 - 21 2 200 - - 14 2,000 1996 8 2,365 - 18 - - - - 8 2,384 1997 1 154 - 31 1 119 - - 2 304 1998 - - - 6 - - - - - 6 1999 - - - - - - - - - - 2000 - - - 77 - - - - - 77 2001 - - - 60 - - - - - 60 2002 - - - 170 1 32 - - 1 202 2003 - - - 240 - - - - - 240 2004 1 30 2 1,683 - 17 - - 3 1,731 2005 1 346 - 4,364 - 64 - - 1 4,775 2006 2 298 - 2,473 1 40 - - 3 2,811 2007 5 1,197 - 2,741 1 581 - - 6 4,519 2008 5 1,084 - 2,255 2 303 - - 7 3,643 2009 11 1,376 - 1,266 - - - - 11 2,643 2010 - 166 - 271 - - - - - 437 2011 1 500 - - - - - - 1 500 Grand Total 50 10,933 6 16,262 8 1,356 - - 64 28,553
Source: Author (data extracted from Public-Private Infrastructure Advisory Facility and The World Bank Database, April, 2012)

85
Table 2.19: Private Participation in Infrastructure Development by Region from 1990 to 2011 (US$ million)
Region Energy Sector Telecom Sector Transport Water Sector Total
No. of Projects
Total Investment
No. of Projects Total Investment No. of
Projects Total Investment No. of Projects
Total Investment No. of Projects Total
Investment Bangladesh 21 1,397 12 6,099 5 - - - 38 7,496 India 220 117,420 37 81,196 287 56,198 12 355 556 255,169 Nepal 5 273 3 135 - - 1 - 9 408 Pakistan 50 10,933 6 16,258 8 1,355 - - 64 28,546 Sri Lanka 13 448 7 2,602 1 240 - - 21 3,290 Grand Total 309 130,471 65 106,290 301 57,793 13 355 688 294,909 Source: Author (data extracted from Public-Private Infrastructure Advisory Facility and World Bank Database, April, 2012) US$ 1 = 121 Pak Rs., AUS$ 1 = 89.90 Pak Rs. and AUS$ 1 = 1.35 US$ (as on 23/06/2018. Oanda Currency Converter. https://www.oanda.com/currency/converter)
86
2.6 The way forward
This chapter has provided an overview of the current status of infrastructure
development in Pakistan and a comparison with infrastructure across South Asian countries.
The status of infrastructure development including infrastructure investment, planning, policies
and trends in Pakistan has been explored. This chapter also has discussed infrastructure project
financing structure in Pakistan comprising private-sector participation in infrastructure in
Pakistan and across South Asian countries. Major events in Pakistan since the country’s
independence in 1947 were examined. This chapter also reviewed the causes of insufficient
infrastructure facilities by examining the key indicators of the economy.
The chapter concludes that infrastructure in Pakistan has improved over the years but
improvement has been slowest in the majority of public infrastructure sectors compared with
countries in the region. This slow development of Pakistani infrastructure has several reasons,
including lack of public financing and a declining trend in infrastructure investments.
Therefore, this situation probably contributes to the low economic growth performance of the
country.
Public-private partnerships may be the best option for Pakistan to improve and develop
infrastructure facilities in the present situation, as discussed in Chapter One. These schemes
are sometimes referred to as PPP, P3 or 3P. A literature review of the benefits and drawbacks
of PPP is provided in Chapter Three.

87
Chapter Three: Literature Review
This chapter provides a critical review of the existing literature concerning the topic of
public-private partnerships (PPP). An overview of the evolution of PPP is given in Section 3.1.
Section 3.2 presents an analysis of studies related to PPP evaluation. Evaluation of PPP
including advantages/benefits, disadvantages/weaknesses and their contribution to economic
growth is discussed in Section 3.3. Section 3.4 presents the key elements and barriers/issues in
implementation of a successful PPP program. The role of institutions and private-sector
participation in infrastructure development is presented in Section 3.5. Section 3.6 provides a
review of investment theories. The scope of the literature review and conclusions from its
analysis are presented in Section 3.7 and 3.8 respectively. Section 3.9 highlights various gaps
in the existing literature that require research attention.
3.1 Evolution of public-private partnerships
In the modern age, PPP for infrastructure development has become an important
development option for governments around the world (Aschauer, 2000b; Grimsey & Lewis,
2007a; Pereira & Andraz, 2005). Despite the fact that PPP has become popular and is being
implemented by governments, its definition, historical origins, and net benefits are still debated
(Grimsey & Lewis, 2017; Pereira & Andraz, 2005). PPP might be an effective solution to
contemporary financial constraints and budgetary imbalances, and offer value for money, if no
other infrastructure investment model is viable. However, the exact nature of PPP must be
made clear. It is also important to ascertain the evolutionary process in the provision of public
infrastructure on PPP modality. Therefore, it is necessary to examine the origins of PPP and to
establish a moderate but comprehensive definition.
3.2 Origin of PPP
Private-sector participation in infrastructure development is not a new concept. History
indicates that there has always been some degree of public sector and private sector cooperation
over the centuries (Hodge & Greve 2009; Wettenhall, 2003). For example, in the 17th century,
the private sector contributed to the development of the transport sector (construction of roads
and canals) in Europe and the United States (UNESCAP, 2007). In the 19th century, consortia
of private parties built many American railways. (Grimsey & Lewis, 2004) cited earlier work
of Briggs (1959) and Court (1962) that the mid-19th century is considered the grand era of
private-sector involvement in infrastructure development, encompassing the boom period of
88
British railway construction in the late 1840s. Consequently, construction of railways gave rise
to economic activity as the majority of the total population were engaged in railway
construction activities in that phase. In 1853 railways were first introduced to the Indian
subcontinent through private investment initiatives (UNESCAP, 2007).
Today, PPP have become attractive to governments all over the world as an off-budget
mechanism for providing infrastructure services, as this model may not require any immediate
cash investment by government agencies. As briefly described in Chapter One, PPP are
commercial transactions/contracts between the public and the private sector in which they
jointly develop projects and deliver services and share project-related resources, costs and
risks. Under a PPP contract, organisations from the private sector perform functions on behalf
of the public sector. The private sector may acquire the use of public property for its own
commercial purposes, and receive benefits, charges or fees from the users or the customers for
the services provided to them (IPDF, 2007).
An early form of PPP is the ancient concept of tolled roads, which have been used since
Romans times. Toll money collected from road users was used to maintain roads and bridges.
Britain also passed legislation in 1555, The Highways Act 1555 17, to ensure maintenance of
roads. According to that statute, local parishes were responsible for repairing the roads in their
own areas. For that reason, unpaid and unskilled surveyors were appointed in each parish. The
parishioners were called on to contribute services to the repair of the roads in that parish. Rich
people were obliged to send horses, carts and ploughs, while others had to work for six
consecutive days each year under the surveyor’s authority. This compulsory labour system was
abolished in 1835 in Britain, while a similar system in the United States operated into the 20th
century in some rural areas. This system proved to be ineffective and inefficient because the
local community had neither the capabilities nor resources and most importantly did not have
the motivation to carry out road maintenance. Therefore, deteriorated road conditions and fast-
growing traffic flow led to the development of the next phase i.e. turnpikes18 (Grimsey &
Lewis, 2007a).
17 The Highways Act 1555 was the first statute of Highways (an act for amending of highways). It was an Act of the Parliament of England passed in 1555 and later extended as the Highways Act 1563 (Tanner, 1922, p. 498).
18 See Glossary of Technical Terms.

89
3.2.1.1 Turnpike
The name “Turnpike” derived from the hinged barrier (spiked spear or English “Pike”)
that was fixed across roads and blocked passage until swung open for toll payers. Turnpike is
another term for a toll road. The turnpike19 is a road partly or wholly paid for by fees collected
from the users at tollgates. Turnpikes are the foundation of contemporary infrastructure
building, operation and transfer systems (Albalate, 2014).
3.2.1.2 British turnpikes
The tollgates in England were first authorised by law in 1364. Grimsey and Lewis
(2004) cite earlier work by Cossons (1934) who stated that the first turnpike was established in
1663 to raise funds for the repair and improvement of the roads. The British Turnpikes Act
granted permission to place three tollgates to collect the tolls at a specified rate on vehicles and
livestock passing on a particular section of road over a period of 21 years. It was expected that
within this period the debt for construction of the road would be paid off, and the road would
then reopen free of charge. In this way, the customary formula of transferring the cost of road
maintenance from the public to the users was established by early in the 18th century.
The first so-called “turnpike trusts” were established in 1706-07 to improve the section
of the London-Holyhead highway between Fornhill and Stony Stratford. By 1840 there were
about 1000 turnpike trusts Acts in force, promoted by town councils, manufacturers,
merchants, landowners and farmers, including those responsible for maintaining at least a part
of the road in question. The Trustees of the turnpike trusts were granted power to raise capital,
generally at 4-5 percent, to develop new roads or improve old ones in a particular locality. The
responsibility for maintenance and construction of the roads was given to appointed surveyors,
19 Road with turnpike – in former times, a road that travellers were allowed to use only after paying a toll at the turnpike. Road barrier – a gate formerly used to bar the way on to a section of road or a bridge until a toll had been paid. Toll road – a motorway on which a toll is charged. Drivers usually receive a ticket when they start their journey and pay a fee at the end that depends on the length of journey. Electronic tickets – tolls are automatically calculated as a vehicle passes under a tolling point. Presently, there are many options available for toll payment. For example, in Australia, payment can be paid online, by phone or visiting a participating retailer. Pass products are available from the toll payment providers for occasional use. However, opening of an account may suit regular users. Toll road payment may be paid in advance before travel, registration of licence plate of the vehicle or setting up an account (video account, tag account and business account). When an account holder, tag holder and registered licence plate vehicle passes under the tolling point, the payment provider records an image of the number plate or detects a tag and deducts the toll amount from the registered vehicle account. If toll payment is not paid before travel or paid within three days of travel, the vehicle’s registered owner will receive an unpaid toll notice from the toll road’s payment provider. The notice will include toll payment instructions and may include additional fees.

90
who were usually involved in supervising the operations of a number of turnpikes. Construction
techniques were left to the discretion of the local engineers. The collection of the toll was
franchised to “farmers” who paid a fixed amount to the trust in return for toll collection right
on particular gates on the turnpike (an early example of subcontracting or outsourcing). After
1773, toll farming leases were auctioned, initially to local businessmen and ultimately to larger
groups, which might buy leases to a number of turnpikes (Grimsey & Lewis, 2007a).
3.2.1.3 The United States turnpikes
The first turnpike road in the US was formed by a Virginian Act in 1785 and by 1840s
a total of about 1600 turnpike companies were active/licensed. The first major toll road in the
United States was the “Philadelphia” and “Lancaster Turnpike”, built in the 1790s, within
Pennsylvania, connecting Philadelphia and Lancaster.
It links Lancaster, Pennsylvania, and Philadelphia at 34th Street, with a total length of
62 miles (99.8km.). A copy of the contract of the Philadelphia and Lancaster Turnpike Road is
at Figure 3.1 and an image is at Figure 3.2 (U.S. Department of Transportation Federal
Highway Administration, 2018).
Figure 3.1: Copy of contract of Philadelphia and Lancaster Turnpike Road
Source: (U.S. Department of Transportation Federal Highway Administration, 2018)

91
Figure 3.2: Image of Philadelphia and Lancaster Turnpike Road
Source: (U.S. Department of Transportation Federal Highway Administration, 2018)
In the first half of the 19th century, there were more private toll roads than public roads
(Estache, 2000). However, not everyone paid the toll. Massachusetts legislation exempted
people going to churches, those on military duty and those doing business within the toll-gated
town in New York. Toll gates were placed at 10-mile intervals, to allow locals on short journeys
to travel freely. Towns and citizens were expecting economic spillovers into their locality due
to the improved transport and communication systems. Indeed, the economic prosperity of the
towns was linked to the success of the turnpikes. In the United States, turnpikes were leased
for 99 years and ownership was expected to revert to the states (Estache, 2000).
In the second half of the 19th century, France introduced extensive concession schemes
to finance its infrastructure networks. Water, electricity, railways and tramway networks were
designed, financed and operated by private operators under long-term concession contracts.
Under these concessions, infrastructure assets were returned to the public authority at the end
of the contract. As a consequence of the 1929 financial crisis that heralded the start of the Great
Depression (lasting from 1929-1930) and World War II (1939-1945), numerous concessions
were nationalised and returned to the state. Thereafter, major infrastructure projects were
launched on a public funding basis through public works contracts (European PPP Expertise
Centre, 2012).
Subsequently, public services and infrastructure in France split into two separate
systems: the PPP-based private concession system known as “delegation de service public”
(outsourcing of public facilities) and the “dirigiste system of gestion directe” (interfering
92
system of direct management), where the infrastructure or service is built and/or operated
directly through state-owned entities. However, most concessions were taken over by the
government when private companies got into financial crisis as the tolls charged were regulated
and price increases were lower than the inflation rate (European PPP Expertise Centre, 2012).
3.3 Current situation
Over the past three decades, public investment in infrastructure has reduced in many
countries because of deficit budgeting. For example, government budgets aim for more
spending on infrastructure than revenue available to pay for the spending. Consequently, many
governments have sought to adopt new ways of delivering infrastructure facilities through
private-sector partnerships. At present, three countries, namely Australia, Canada and the
United Kingdom, have extensive experience in providing infrastructure services in
collaboration with the private sector. Since the start of the 2000s, a number of Western
countries and emerging economies in Asia, the Middle East and Eastern Europe have
introduced extensive legislation for private-sector participation in public infrastructure
development. Conversely, the private sector recognised the financial benefits of funding,
constructing and operating infrastructure assets, whether in the form of long-term concession
contracts or permanent ownership (Alfen, 2010).
Private concessions never completely disappeared in France and still exist in various
contractual forms, especially in the municipal services sector. Since the end of the 1990s, the
PPP procurement method in France has made a strong comeback in relation to the design,
financing and operation of infrastructure projects. Almost all French public services are open
to concession schemes at the local level under “delegation de gestion contracts” (management
delegation contracts). In the UK, a private finance initiative (PFI) was first introduced in 1992
by the Conservative Government led by John Major. This was the first systematic program
focused on encouraging PPP. The program aimed at reducing public-sector borrowing
requirements. Later, in 1997, the UK Labour government led by Tony Blair expanded the PFI
program with an emphasis on achieving “value for money (VoF)”20, primarily through
appropriate risk allocation between public and private partners (Allen, 2001).
20 See Glossary of Technical Terms.
93
By 25 June 2018, PPP had delivered 700 UK infrastructure projects with a total of £56
billion of private-sector capital investment. The PPP infrastructure projects included new
schools, hospitals, roads, housing, prisons, and military equipment and accommodation
(Government Digital Service UK, 2018).
3.3.1.1 PPP structure and models
There are many forms of PPP. The contract between the public-sector authority and the
private party defines the nature of the partnership between the parties. This partnership can
take many different forms and range from a fairly simple contractual agreement, such as
supplying a specific service (e.g. garbage collection), to complex arrangements such as the
construction, operation, maintenance, finance and provision of an infrastructure service e.g.
construction of a new airport (IPDF, 2007). In a PPP, the public and private sectors join forces
to design, finance, build, manage or maintain infrastructure projects. The exact nature of the
PPP depends upon the allocation of risks and responsibilities. Some of the common structures
in PPP (Regan, 2009; UNESCAP, 2007) 21are:
• Service Contracts Outsourcing/contracting out
• Management Contracts
o Supply or Service Contract
o Maintenance Management
o Operational Management
o Lease
• Standard International Build-Own-and-Transfer (BOT) variants:
o Build-Own-and-Transfer (BOT)
o Build-Lease-and-Transfer (BLT)
o Build-Own-and-Operate (BOO)
▪ Licensing:
✓ Quantity Licensing
✓ Quality Licensing
21 The United Nations Economic and Social Commission for Asia and the Pacific (USESCAP) was established in 1947 with its headquarters in Bangkok, Thailand. USESCAP is the regional development division of the United Nations for the Asia-Pacific region. USESCAP is made up of 53-member states and nine associate members. USESCAP promotes rigorous analysis and peer learning in the areas of work. It translates its findings into policy dialogues and recommendations and provides good development practices, knowledge sharing and technical assistance to member States in the implementation of its recommendations.

94
o Build-Transfer-and-Operate (BTO)
o Rehabilitate-Operate-and-Transfer (ROT)
o Rehabilitate-Own-and-Operate (ROO)
o Design, Finance, Build, Operate and Transfer (DFBOT)
o Concession
o Franchise
• Private Finance Initiative (PFI)
o Annuity Model
Brief descriptions of the common structures in PPP are given below:
• Service contracts outsourcing/contracting out: under this method the authority
retains ownership and control of all assets and property. The private party performs a
specific service, within specific specifications for a relatively short period of time. The
duration of these contracts is from one to three years. This method reduces the
procurement cost and overstaffing, and improves service delivery, introduces new
technology and improves productivity especially in the industrial sector.
• Management contracts: generally, transfer more risks and responsibility to the
private party than a service contract. They can be implemented in a short time and are
the least complex in nature. The private partner is not expected to invest in facility
improvement but may be responsible for routine maintenance. Efficiency gains may
be limited. All risks are borne by the public partner. Management contracts are mainly
used for existing infrastructure assets and are usually awarded for three to five years.
o Supply or service contract: involve the supply of equipment, raw material,
power, energy and labour and are typical examples of this method. Only non-
core activities of an organisation such as catering, medical, luggage handling,
security and transport services can be undertaken by the private partner. The
duration of these contractual arrangements is one to three years.
o Maintenance management: sometimes the private vendor/supplier can also
be engaged for maintenance of assets procured by them. Assets management
contracts are popular with the transport sector. These are usually awarded for
three to five years.
o Operational management: these are also common in the transport sector for
providing non-transport elements of transport operations, such as the ticketing
95
and reservation systems for public transport. Length of these agreements is
from three to five years.
o Lease: under this contractual management the private-sector service provider
becomes the asset manager of the existing publicly owned facility or acquires
land for its own exploitation. The leaser/operator collects the authorised tariff
from the users and earns profits generated by improved efficiency. The private
party generally is not expected to invest in facility improvement. The main
benefits of this type of lease are that: it can be implemented within a short span
of time; and a reasonable private investment is possible under long-term
agreements. However, weaknesses include: almost all risks are borne by the
public sector; and the lease offers little incentive for the private sector to invest.
These types of contracts are generally used for existing infrastructure assets.
Leases require considerable regulatory oversight. A lease contract can be
anywhere between five to 15 years.
• Standard international build-own-and-transfer (BOT) variants: these are
contractual arrangements whereby the private party undertakes the
financing/construction of a given infrastructure service and its
operation/maintenance as per output specification and service levels prescribed by
the private party. The private party usually transfers the facility to the public
authority at the end of the fixed term. The duration of BOT model contracts is 15
to 30 years. The common variants of these type of PPP scheme are:
o Build-own-and-transfer (BOT): the private party operates the facility over a
fixed period during which it is permitted to charge facility users appropriate
tolls, fees, rentals and charges not exceeding those proposed in its bid to cover
its investments, operating and maintenance expenses in the project.
o Build-lease-and-transfer (BLT): under this contractual arrangement the
private party returns the facility to the authority. This is done through a lease
arrangement for a fixed period.
o Build-own-and-operate (BOO): the private party builds the facility under a
contractual arrangement with the authority and recovers its investments and
operational/maintenance costs by collecting tolls, rent, fees and charges from
the users. Licensing may be considered a variant of the BOO model of private
participation.

96
▪ Licensing: the government grants licences to a private party to provide
services such as fixed line and mobile telephony, internet service,
television and radio broadcast, public transport and catering services on
the railways and airlines. It allows competitive pressure in the market by
allowing multiple operators. There are two type of licensing:
✓ Quantity licensing by setting limits through quantity licensing, the
government is able to ensure reasonable competition between service
providers and adjust supply between one area and other.
✓ Quality licensing: this does not place any restriction on the number
of providers or the amount of service produced but specifies the
quality of service that needs to be provided. The government may get
a fee and a small share of the revenue earned by the private sector
under the licensing arrangement.
o Build-transfer-and-operate (BTO): the private party constructs the facility
under traditional procurement methods, transfers its title to the authority and
operates the facility to specified standards on the authority’s behalf under
agreed terms.
o Rehabilitate-operate-and-transfer (ROT): the existing facility is turned over
to the private partner to renovate, remodel, refurbish or rehabilitate and
operate/maintain for a franchise period. At the expiry date the ownership of the
facility is returned to the public authority.
o Rehabilitate-own-and-operate (ROO): the existing facility is turned over to
the private partner to renovate/rehabilitate and operate/maintain in perpetuity,
provided the operator does not violate specified franchised terms.
o Design, finance, build, operate and transfer (DFBOT): here the authority
defines the service required and invites tenders for the complete design, finance
and construction of an infrastructure facility by a private party. The private
party operates the facility to specified standards on behalf of the authority and
returns the asset to the authority on expiry of the agreement.
o Concession: the private party takes over operation/maintenance including
rehabilitation/upgrade/capital investment and enhancement of an existing
facility from the authority for a concession period. The private party pays a
concession fee to the authority. The authority may also contractually require its
97
partner to share with it a portion of the profits. Although this traditional model
is straightforward to implement, all risks are borne by the authority, and the
project may attract only low private investment and limited innovation. Typical
concession periods range between five and 50 years.
o Franchise: under a franchise arrangement the concessionaire provides services
that are fully specified by the franchising authority and takes on all commercial
risks. This form of private-sector participation is historically popular in
providing urban bus and rail services. The length of these agreements is from
three to seven years.
• Private finance initiative (PFI): a PFI model is similar to the Build-Own-and-
Operate model in that the private sector partner builds, owns and operates a facility.
However, the public sector purchases the services from the private sector through a
long-term agreement. A PFI project, therefore, creates direct financial obligations for
the government (the private partner is paid regularly from public money, purely based
on its performance during the contract period. Payments to the private partner are
deducted/reduced if performance targets are missed). In the PFI model, asset
ownership at the end of the contract period may or may not be transferred to the public
sector. The duration of PFI is 10 to 30 years. The PFI model also has many variants:
o Annuity model: under this arrangement a selected private bidder is awarded a
contract to develop a section of the highway and maintain it over the whole
contract period. The private bidder is compensated with fixed semi-annual
payments for their investments in the project. In this arrangement the
concessionaire does not need to bear the commercial risks involved with the
project operation. The PFI model has been used for developing social
infrastructure such as schools and hospital buildings.
3.4 Definition and characteristics of PPP
Presently, there is no single universal definition of PPP (Lakshmanan, 2008). The
meaning of PPP is different at national and international levels, and even when comparing
different national infrastructure sectors (Alfen, 2010). A review of the literature indicates that
there are as many definitions and meanings of PPP as corresponding publications or practical
contexts in which the term is used. Several definitions are provided below:
• A PPP is a joint venture between the public and private sector. The expertise and
98
resources of both the public and private sectors are supplemented to provide services to
the public at the best value for money over the contract period of the partnership (Adrias,
2010).
• Jingfeng, Yajun, J., and Qiming (2009) refer to a definition provided by the Canadian
Council for PPP (2001), that a PPP is a cooperative venture between the public and
private sectors, built on the expertise of each partner that best meets clearly defined public
needs through the appropriate allocation of resources, risks and rewards.
• PPP are forms of cooperation between the public and private sectors for the funding,
construction, renovation, management or maintenance of infrastructure or the provision
of a service (Regan, 2009).
• The Planning Commission of India in its Guidelines for Financial Support to Public
Private Partnerships in Infrastructure (2006:8) defines “Public Private Partnership Project
means a project based on a contract or concession agreement, between a Government or
statutory entity on the one side and a private-sector company on the other side, for
delivering an infrastructure service on payment of user charges22”.
• According to the United Nations Economic Commission for Europe (UNECE) (2008: 1)
PPP that aim at financing, designing, implementing and operating public sector facilities
and services have three main characteristics, namely: a) long-term service provisions
(sometimes up to 30 years); b) transfer of risks to the private sector; and c) different forms
of long-term contracts drawn up between legal entities and public authorities.
The United Nations refers to PPP as “innovative methods used by the public
sector to contract with the private sector who bring their capital and their ability to
deliver projects on time and to budget, while the public sector retains the responsibility
to provide these services to the public in a way that benefits the public and delivers
economic development and improvement in the quality of life” (UNECE, 2008:1).
• The World Bank, Financial and Private Sector Development Vice Presidency (2006:1)
describes PPP as “long-term arrangements in which the governments purchases services
under a contract either directly or by subsidising supplies to consumers. In other PPP
models, the government bears substantial risks – for example, by guaranteeing revenue
or returns – on projects that sell directly to consumers”.
22 See Glossary of Technical Terms.
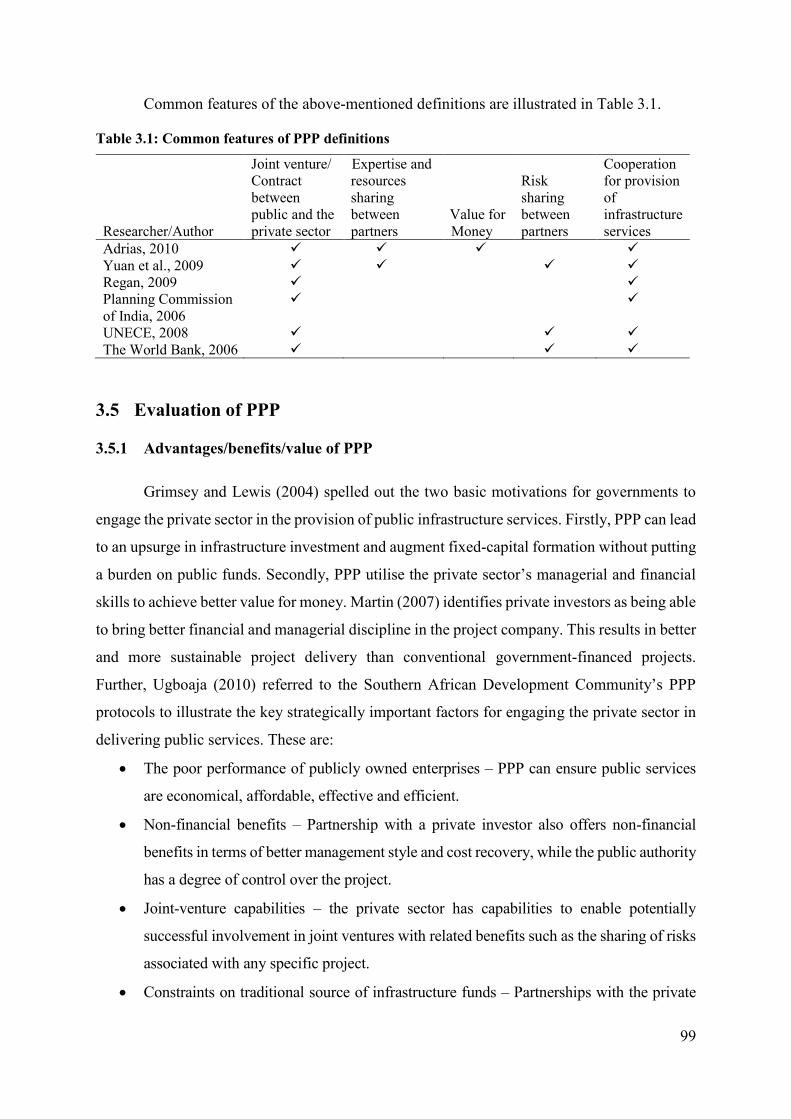
99
Common features of the above-mentioned definitions are illustrated in Table 3.1.
Table 3.1: Common features of PPP definitions
Researcher/Author
Joint venture/ Contract between public and the private sector
Expertise and resources sharing between partners
Value for Money
Risk sharing between partners
Cooperation for provision of infrastructure services
Adrias, 2010 ✓ ✓ ✓ ✓ Yuan et al., 2009 ✓ ✓ ✓ ✓ Regan, 2009 ✓ ✓ Planning Commission of India, 2006
✓ ✓
UNECE, 2008 ✓ ✓ ✓ The World Bank, 2006 ✓ ✓ ✓
3.5 Evaluation of PPP
3.5.1 Advantages/benefits/value of PPP
Grimsey and Lewis (2004) spelled out the two basic motivations for governments to
engage the private sector in the provision of public infrastructure services. Firstly, PPP can lead
to an upsurge in infrastructure investment and augment fixed-capital formation without putting
a burden on public funds. Secondly, PPP utilise the private sector’s managerial and financial
skills to achieve better value for money. Martin (2007) identifies private investors as being able
to bring better financial and managerial discipline in the project company. This results in better
and more sustainable project delivery than conventional government-financed projects.
Further, Ugboaja (2010) referred to the Southern African Development Community’s PPP
protocols to illustrate the key strategically important factors for engaging the private sector in
delivering public services. These are:
• The poor performance of publicly owned enterprises – PPP can ensure public services
are economical, affordable, effective and efficient.
• Non-financial benefits – Partnership with a private investor also offers non-financial
benefits in terms of better management style and cost recovery, while the public authority
has a degree of control over the project.
• Joint-venture capabilities – the private sector has capabilities to enable potentially
successful involvement in joint ventures with related benefits such as the sharing of risks
associated with any specific project.
• Constraints on traditional source of infrastructure funds – Partnerships with the private

100
sector seen as a useful tool in bridging the gap between public investment and limited
budgets.
Private investment for infrastructure development can reduce government budgetary
constraints (see, for example, Public-Private-Partnership in Infrastructure Resource Center);
(Cheung et al., 2012; IPDF, 2007; Jamali, 2004; OECD, 2010; PPPIRC, 2018; Satish, 2009).
However, Alfen (2010) warns that absolute reliance on the private sector for infrastructure
development cannot produce the expected results. Conversely, entire dependence on the public
sector is also not a viable option for achieving the desired outcomes. Therefore, PPP have
become popular globally as an alternative procurement option for the public sector and a good
investment opportunity for private investors (MoF Lithuania, 2018). Empirical studies suggest
that the PPP procurement method is considered most attractive in terms of its positive factors.
The Confederation of British Industry23 (2007) states that PPP have more functions and
characteristics than merely being used to supplement public sector infrastructure investment
through private-sector participation. The key advantages/benefits/value of PPP are presented
in Table 3.2.
23 The Confederation of British Industry works with policymakers for delivering a healthy environment for businesses, jobs creation and driving economic growth and prosperity.

101
Table 3.2: Advantages/benefits/value of PPP Advantages/benefits/ value of PPP
Main results Author (Year)
Value for money
PPP endeavour to ensure best value for money by minimising project costs and improving performance by improving quality of the service, and ensure availability and affordability of the service. PPP ensure public services are economical, affordable, effective and efficient. PPP ensures the best interest of stakeholders of PPP project.
(Alfen, 2010; Herpen, 2002; OECD, 2010; Rosenau, 1999)
Single point of responsibility There is a single point of responsibility for the design, finance, construction and service delivery (DFCS) in the PPP procurement method.
(Hodge & Greve, 2009; Paul, 2003; Peter, 2010)
Price Certainty
PPP offer greater price certainty. As the price of the project services is determined for the future on the basis of current economic conditions and future projections.
(IPDF, 2007; Jin & Zhang, 2011)
Buildability
The contractor is responsible for DFCS. The contractor endeavours that the project is more likely to be “buildable” than is the case under other procurement methods.
(Bovis, 2015; OECD, 2010)
Risk sharing
PPP assign risk based on the resources and abilities of the partners. All project-related risks are shared between the contracting partners according to their capacities and abilities.
(Johnston & Kouzmin, 2010; Peter, 2010; Ugboaja, 2010)
Within Budget and Speedy Completion of Project
PPP deliver projects efficiently and effectively (better and early project delivery and effective of use resources). (; A. & J., 1995; Cheung et al., 2012; Graeme, 2018; Jingfeng et al., 2009; Spackman, 2002)
Lower government borrowing PPP generally provide public services cheaply and quickly and can reduce pressure on government budgets. (Gordon, 1992; Graeme, 2018; Martin, 2007; Spackman, 2002)
Introduction of Innovation & use of modern technology
PPP are a way of introducing innovation and modern technology in infrastructure development through private investment.
(PPPIRC, 2018)
Asset management implementation
A PPP project is maintained for the full life of the project. It involves replacement, upgrading and repairs in order to gain the benefits from the PPP project throughout its entire life.
(Adrias, 2010; IPDF, 2007; Jin & Zhang, 2011; MoF Lithuania, 2018)
Ongoing performance standards The PPP procurement model considers performance. Payments may be deducted and/or stopped if services are not delivered according to contractual requirements and predefined service standards.
(IPDF, 2007; Regan, 2009)
Output based specification Under PPP procurement, the public sector focuses on the output specification and benefits from the start of the project.
(Ahlstrom, 2010; Dawson, 2006; Ugboaja, 2010)
Improved service quality and higher standard of living
The countries with a large number of PPP projects generally enjoy better infrastructure. As a result, their populations enjoy a higher standard of living, better prices and increased levels of productivity through innovation and use of modern technology.
(Andrews & Swanson, 1995; EIU, 2012; Koppenjan & Bert, 2009)
PPP encourages private sector investment
Public investment crowds in private investment and has strong and positive effects on output. Also, increases in public sector investment in infrastructure development increase the revenue of private investment.
(Aschauer, 1989; Mares et al., 2002; Pereira & Roca-Sagales, 2001; PPPIRC, 2018)
Avoid large up-front capital expenditure
PPP is a procurement method that avoids large public up-front capital expenditure on infrastructure development. (Adeniyi et al., 2011; Cheung et al., 2012; PPPIRC, 2018)
Non-financial benefits
PPP have various non-financial benefits in terms of better managerial efficiency and cost recovery, rigorous risk analysis/allocation, new and innovative approach and capability of assets operation and maintenance.
(Martin, 2007; OEDC, 2010; Regan, 2008; Ugboaja, 2010)
102
Researchers point out that PPP models have substantial benefits/advantages in services
delivery, which are not achieved via the traditional public infrastructure investment model
(Podriguez, 2018; Regan, 2008). Regan further states that the traditional procurement models
are based on lowest-cost evaluations, which are the worst performing models of the state
procurement options. Peter (2010) concludes that PPP is the best method of procurement
especially to deliver large, complex and expensive projects, achieving significant savings in
both time and cost. However, Regan (2008) cautions that it is a difficult task to compare
different procurement methods over different time frames and measurement criteria and that
evidence exists of better procurement outcomes with methods that employ a full or partial
output specification.
3.5.2 Weaknesses/disadvantages of PPP
Apart from the advantages and benefits of PPP, there are also negative aspects in PPP
procurement methods, as presented in Table 3.3.
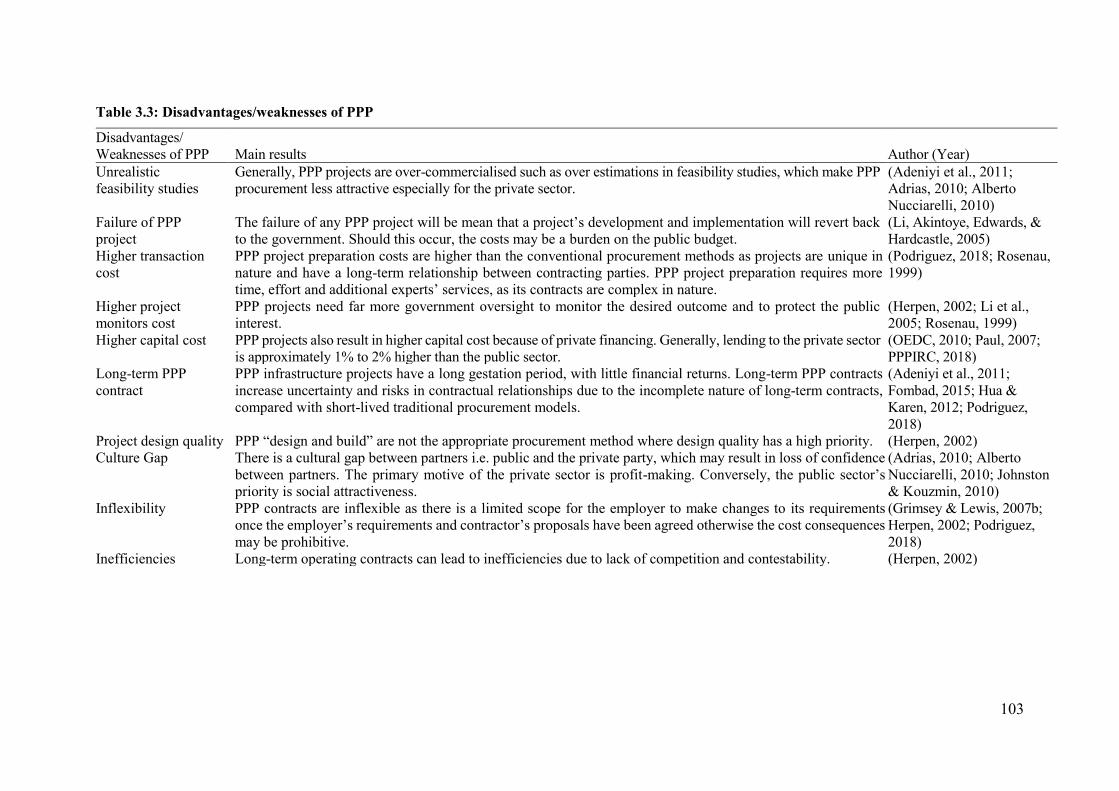
103
Table 3.3: Disadvantages/weaknesses of PPP
Disadvantages/ Weaknesses of PPP Main results Author (Year) Unrealistic feasibility studies
Generally, PPP projects are over-commercialised such as over estimations in feasibility studies, which make PPP procurement less attractive especially for the private sector.
(Adeniyi et al., 2011; Adrias, 2010; Alberto Nucciarelli, 2010)
Failure of PPP project
The failure of any PPP project will be mean that a project’s development and implementation will revert back to the government. Should this occur, the costs may be a burden on the public budget.
(Li, Akintoye, Edwards, & Hardcastle, 2005)
Higher transaction cost
PPP project preparation costs are higher than the conventional procurement methods as projects are unique in nature and have a long-term relationship between contracting parties. PPP project preparation requires more time, effort and additional experts’ services, as its contracts are complex in nature.
(Podriguez, 2018; Rosenau, 1999)
Higher project monitors cost
PPP projects need far more government oversight to monitor the desired outcome and to protect the public interest.
(Herpen, 2002; Li et al., 2005; Rosenau, 1999)
Higher capital cost PPP projects also result in higher capital cost because of private financing. Generally, lending to the private sector is approximately 1% to 2% higher than the public sector.
(OEDC, 2010; Paul, 2007; PPPIRC, 2018)
Long-term PPP contract
PPP infrastructure projects have a long gestation period, with little financial returns. Long-term PPP contracts increase uncertainty and risks in contractual relationships due to the incomplete nature of long-term contracts, compared with short-lived traditional procurement models.
(Adeniyi et al., 2011; Fombad, 2015; Hua & Karen, 2012; Podriguez, 2018)
Project design quality PPP “design and build” are not the appropriate procurement method where design quality has a high priority. (Herpen, 2002) Culture Gap
There is a cultural gap between partners i.e. public and the private party, which may result in loss of confidence between partners. The primary motive of the private sector is profit-making. Conversely, the public sector’s priority is social attractiveness.
(Adrias, 2010; Alberto Nucciarelli, 2010; Johnston & Kouzmin, 2010)
Inflexibility PPP contracts are inflexible as there is a limited scope for the employer to make changes to its requirements once the employer’s requirements and contractor’s proposals have been agreed otherwise the cost consequences may be prohibitive.
(Grimsey & Lewis, 2007b; Herpen, 2002; Podriguez, 2018)
Inefficiencies Long-term operating contracts can lead to inefficiencies due to lack of competition and contestability. (Herpen, 2002)
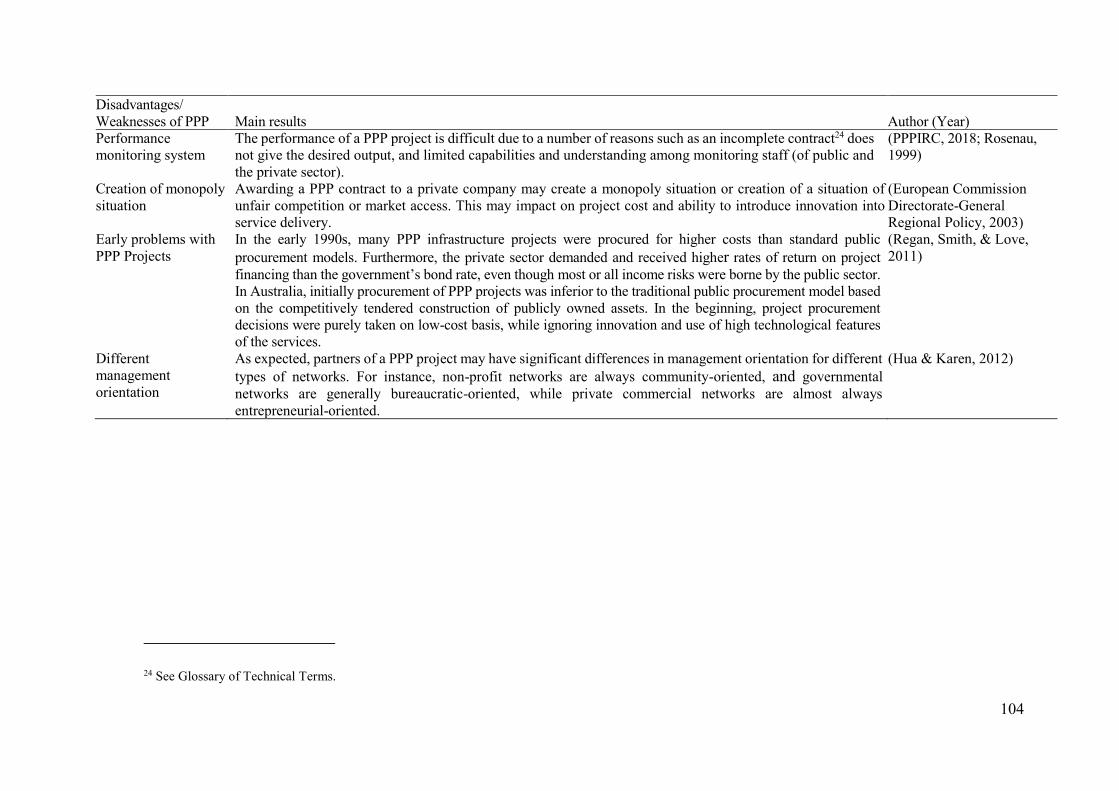
104
Disadvantages/ Weaknesses of PPP Main results Author (Year) Performance monitoring system
The performance of a PPP project is difficult due to a number of reasons such as an incomplete contract24 does not give the desired output, and limited capabilities and understanding among monitoring staff (of public and the private sector).
(PPPIRC, 2018; Rosenau, 1999)
Creation of monopoly situation
Awarding a PPP contract to a private company may create a monopoly situation or creation of a situation of unfair competition or market access. This may impact on project cost and ability to introduce innovation into service delivery.
(European Commission Directorate-General Regional Policy, 2003)
Early problems with PPP Projects
In the early 1990s, many PPP infrastructure projects were procured for higher costs than standard public procurement models. Furthermore, the private sector demanded and received higher rates of return on project financing than the government’s bond rate, even though most or all income risks were borne by the public sector. In Australia, initially procurement of PPP projects was inferior to the traditional public procurement model based on the competitively tendered construction of publicly owned assets. In the beginning, project procurement decisions were purely taken on low-cost basis, while ignoring innovation and use of high technological features of the services.
(Regan, Smith, & Love, 2011)
Different management orientation
As expected, partners of a PPP project may have significant differences in management orientation for different types of networks. For instance, non-profit networks are always community-oriented, and governmental networks are generally bureaucratic-oriented, while private commercial networks are almost always entrepreneurial-oriented.
(Hua & Karen, 2012)
24 See Glossary of Technical Terms.

105
The literature review has identified the following controversial aspects of PPP
procurement methods:
• Public investment in infrastructure is unlikely to have a perceptibly positive effect on
economic growth if projects are developed based on political not economic reasons,
which also crowds out private investment (Alsalam, Beider, Gramp, & Webre, 1998)
• The performance of a PPP project, for example the availability of services according to a
pre-agreed standard, can be monitored through predetermined criteria. However,
practical understanding of effective monitoring processes and the capacity of the
monitoring staff of both public and the private sector to perform monitoring tasks
effectively and consistently is limited (Rosenau, 1999).
• The value for money from a specific PPP can be calculated using a public-sector
competitor25 (PSC) apparatus (public sector estimation about the project prior to calling
for bids) but a PSC may portray a false picture. A PSC is based on a theoretical
estimation, which is usually different from the real situation/estimation (Alfen, 2010;
Herpen, 2002; OEDC, 2010; Rosenau, 1999).
• PPP encourage private-sector investment and provide “level playing fields” (equal
opportunities) for all potential investors by using open bidding processes. However,
simultaneously, this may create a monopolistic situation by awarding a PPP contract to a
private company and/or delegating exclusive rights to a private investor for performing a
specific function or delivering a particular service (Andrews & Swanson, 1995; EIU,
2012; Erenburg, 1994; European Commission Directorate-General Regional Policy,
2003; Koppenjan & Bert, 2009; Pereira & Andraz, 2005). There may be substantial
conflicting interests between the partners as the public sector aims to provide social and
economic benefits to the community, while the private sector’s sole motive is primarily
to protect its investment and earn profits out of PPP projects (Johnston & Kouzmin,
2010).
3.5.3 Contribution of PPP to economic growth
PPP improve infrastructure facilities and play important roles in enhancing economic
growth (Ugboaja, 2010). Kolzow (1994) suggests that PPP may blend the common interests
25 See Glossary of Technical Terms.

106
of public and private organisations through some structure (like project risk and profit sharing)
to increase infrastructure investment for achieving common objectives (economic growth) of
the community. Private sector participation and private financing (domestic and foreign) in
infrastructure are claimed to be essential for countries’ sustainable economic growth (Tennant,
Kirton, & Abdulkadri, 2011). Barro and Sala-i-Martin (2001) confirm that joint public and
private investment has a positive impact on growth. PPP create more job opportunities, reduce
investment costs/expenditures for the government and subsequently increase the economic
growth rate (Lin & Doemeland, 2012). A number of studies in Britain and Australia in recent
years point to significant benefits in health, education and justice user outcomes from services
delivered by PPP models that are not being achieved with the traditional model (Regan, 2008).
The aforesaid advantages/benefits of PPP directly or indirectly contribute to economic growth.
The ways PPP may contribute to economic growth are discussed below:
3.5.3.1 New sources of capital investment
Jingfeng et al. (2009) consider that PPP in infrastructure development act as engines of
growth. PPP provide new sources of investment capital for required infrastructure projects, free
up government resources and fuel growth through innovation and technology, provided the
right factors are in place. These factors are: the number of PPP projects, value for money and
a suitable PPP procurement model, combined with supportive policies. Strategy& (2008)26
states PPP may improve public satisfaction in terms of convenience and quality of public
services at affordable prices.
3.5.3.2 Use of private-sector skills and investment
PPP maximise the use of private-sector skills (IPDF, 2007). According to Kolzow
(1994) and Strategy& (2008), PPP bring private investment to the market while creating long-
term employment, increasing efficiency and productivity, reducing costs, generating more
wealth and a higher standard of living and strengthening the economy.
26 PricewaterhouseCoopers (PwC) is a multinational professional services network. PwC’s consulting team “Strategy&” was formed on March 31 2014, when Booz & Company combined with PwC to establish a new kind of consulting team and to offer strategy-through-execution services.
107
3.5.3.3 Increase public capital stock
PPP help in building infrastructure. Increases in public infrastructure capital reduces
private sector costs (Berndt, 1992). Public infrastructure also contributes to the economy across
various dimensions, for instance, in inter-industry input-output linkages. For example,
transport projects may create linkages with real estate, steel industry and civil construction.
Also, the private sector indirectly benefits from lower operation costs upon completion of these
projects (Chan, Wang, & Ke, 2009). Andrews and Swanson (1995) and Aschauer (1989b) also
confirm that an increase in the public stock of capital increases return to private capital, which
crowds in private capital accumulation. Albala-Bertrand and Mamatzakis (2004) assessed the
movement in the level of infrastructure investment on cost structure, private investment and
productivity in Chile. They found that investment in infrastructure reduced production costs
within the economy, which generated positive flow-on effects to productivity. In addition,
infrastructure capital formation asserts a positive cost-share effect on private capital. Paul
(2003) and Munnell (1990) assert that public capital has a significantly positive impact on
private sector productivity. However, Bjorvatn (2000) revealed that in transition and
developing economies, poor infrastructure reduces the profitability of the manufacturing sector
and might inhibit industrialisation.
3.5.3.4 Reduce public borrowings
PPP reduce government sovereign debt/borrowings27 (government debt, public debt
and national debt) and associated risks, drive the creation of local long-term capital markets,
utilise efficiencies of the private sector in running public services and stabilise economic
growth, creating more employment opportunities and certainty (job security) (Jin & Zhang,
2011; Kolzow, 1994). On the other hand, the deadweight costs of public debt and taxation
reduce returns to the private sector which, in turn, limits growth. Conrad (1997) found that if
the investment is paid by taxation, then the optimal level of investment is lower than any
another financing method.
27 See Glossary of Technical Terms.

108
3.5.3.5 Increase living standards
Ugboaja (2010) Ugboaja (2010) asserts that countries with a large number of PPP
projects generally have better infrastructure. As a result, these countries enjoy a higher standard
of living, better prices and increased levels of productivity through innovation and use of new
technology. Aschauer (2000a) considers public infrastructure to be a factor of production. A
decline in public capital decreases productivity, whereas Ahlstrom (2010) and Dawson (2006)
assert that innovation, such as achieved through successful PPP, produces new goods and
services, increases productivity, creates job opportunities, and increases per capita income, thus
improving living standards and ultimately generating economic growth.
As discussed earlier, the PPP procurement method helps in infrastructure development.
Numerous studies have demonstrated that infrastructure investment has a positive and
permanent effect on economic growth. Infrastructure investment impacts mainly on the supply
side of the economy by improving economic efficiency, resource allocation and productivity
(Sanchez-Robles, 1998). The endogenous growth model of Barro (1990) showed that increases
in government spending on infrastructure for the home country result in higher growth rates
and improvement in the terms of trade (Ghosh & Mourmouras, 2002).
3.6 Implementation of PPP
3.6.1 Essential ingredients to carry out PPP
Researchers around the globe appear keen to explore the basic ingredients for
developing a successful PPP program (see, for example, Chan et al., 2009; Jooste & Raymond,
2009; Nisar, 2011; Regan et al., 2009; UNESCAP, 2010). Numerous studies have been done
on the subject so far in developing countries, for instance, Bangladesh, China, India,
Indonesia, Kazakhstan, Mongolia, Nepal, Philippines, Thailand, Vietnam and 19 Latin
American and Caribbean countries (EIU, 2012). Therefore, it is difficult for the authorities to
understand which findings are and are not applicable to the context of any developing country.
There are no tailor-made PPP contracts that fit all PPP projects. Ismail (2013) investigated
PPP critical success factors (CSF) in Malaysia and discovered that PPP have the unique
characteristics of a particular country. Therefore, adopting the success factors of other
countries may not provide the complete list of CSFs for PPP implementation in Malaysia. In
PPP, the project functions transferred to the private party may vary from contract to contract.
Project-related risks and responsibilities are typically allocated to the partners according to
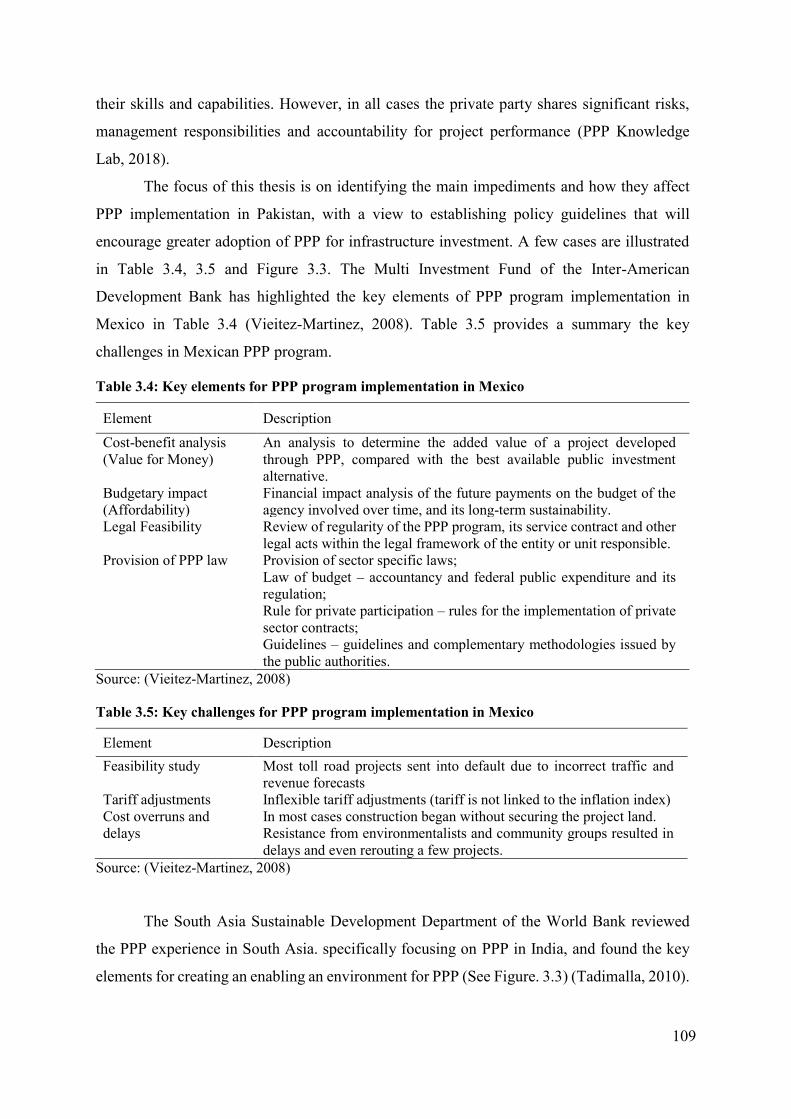
109
their skills and capabilities. However, in all cases the private party shares significant risks,
management responsibilities and accountability for project performance (PPP Knowledge
Lab, 2018).
The focus of this thesis is on identifying the main impediments and how they affect
PPP implementation in Pakistan, with a view to establishing policy guidelines that will
encourage greater adoption of PPP for infrastructure investment. A few cases are illustrated
in Table 3.4, 3.5 and Figure 3.3. The Multi Investment Fund of the Inter-American
Development Bank has highlighted the key elements of PPP program implementation in
Mexico in Table 3.4 (Vieitez-Martinez, 2008). Table 3.5 provides a summary the key
challenges in Mexican PPP program.
Table 3.4: Key elements for PPP program implementation in Mexico
Element Description Cost-benefit analysis (Value for Money)
An analysis to determine the added value of a project developed through PPP, compared with the best available public investment alternative.
Budgetary impact (Affordability)
Financial impact analysis of the future payments on the budget of the agency involved over time, and its long-term sustainability.
Legal Feasibility Review of regularity of the PPP program, its service contract and other legal acts within the legal framework of the entity or unit responsible.
Provision of PPP law Provision of sector specific laws; Law of budget – accountancy and federal public expenditure and its regulation; Rule for private participation – rules for the implementation of private sector contracts; Guidelines – guidelines and complementary methodologies issued by the public authorities.
Source: (Vieitez-Martinez, 2008)
Table 3.5: Key challenges for PPP program implementation in Mexico
Element Description Feasibility study Most toll road projects sent into default due to incorrect traffic and
revenue forecasts Tariff adjustments Inflexible tariff adjustments (tariff is not linked to the inflation index) Cost overruns and delays
In most cases construction began without securing the project land. Resistance from environmentalists and community groups resulted in delays and even rerouting a few projects.
Source: (Vieitez-Martinez, 2008)
The South Asia Sustainable Development Department of the World Bank reviewed
the PPP experience in South Asia. specifically focusing on PPP in India, and found the key
elements for creating an enabling an environment for PPP (See Figure. 3.3) (Tadimalla, 2010).

110
Figure 3.3: Key elements in creating a PPP enabling environment focusing on India
Source: (Tadimalla, 2010)
Furthermore, the literature review has pointed out that the success factors of PPP
projects can vary in different infrastructure sectors and jurisdictions. However, there is a need
to identify common factors irrespective of geographical location (Cheung et al., 2012). The
following section classifies the findings of previous researchers regarding implementing a
successful PPP program.
3.6.1.1 Public policy
Public policy provides precise guidelines regarding necessary action to be taken by the
administrative authority of a country or individual state regarding a number of issues, in a
manner consistent with the overarching law and institutional practices in place. Public policy
is developed under the auspices of the national constitutional laws and regulations and cannot
propose any actions that contravene the existing legal framework (Norwich University Public
Administration, 2014). As previously noted, governments are facing growing demands to find
alternative ways to finance infrastructure projects. Where publicly funded financial resources
are scarce, governments may have to decide to focus on formulating public policies as the best
option for funding needed infrastructure (Mona, Jean-Francois, & Etienne, 2006). Empirical
studies suggest PPP can be effective in supplementing government resources and contribute to
Define responsibilities, processes and procedures PPP Policy
PPP Law
Enabling Regulations
▪ Enunciation of appropriate policy, legal and institutional framework (overall, sector) • PPP Policy, Toll Policy, Standard Documents and
Procedures ▪ Provision of support for meeting govt. obligations
• VGF, PDF, Availability Payment, Guarantees
▪ Empowerment & building capacities of the ministries/agencies and dedicated PPP units
▪ Safeguard to mitigate contingent liabilities risk ▪ Communication with stakeholders
Issues and Sector Notes
▪ Govt. commitment to adopt PPP as an infrastructure strategy
Legal framework for implementing PPP policy
In implementing most of the above functions, governments often find it useful to establish a dedicated cross-sector unit/facility
Institutions, Capacity Building
and Advocacy
Regulation Strategy
Support to implementation of PPP policy
Describe sector-specific on key aspects of PPP policy
111
growth in the presence of supportive policies and well-established institutional framework
(Strategy&, 2008).
3.6.1.1.1 PPP guidelines
The success of a PPP scheme depends on clear PPP guidelines, and public policy
(Cheung et al., 2012; Ugboaja, 2010). The availability of other guidance materials is a
prerequisite for the successful implementation of a PPP. These may include material such as
PPP standard documents, infrastructure sector specific guidance, PPP standard model contracts
(templates) and PPP project preparation guidelines.
3.6.1.1.2 Public policy
Koppenjan and Bert (2009) note that public administration, policies, laws and
institutions are the key drivers of private sector participation in infrastructure services
provision. Ugboaja (2010) asserts that lack of a comprehensive PPP policy is a threat to a PPP
project.
3.6.1.1.3 The investment policy
Investment policies frameworks should not focus only on attracting investment but also
have defined objectives for any specific PPP project. The review of literature suggested that
effective and efficient institutions have a positive impact on the investment climate,
infrastructure development and economic growth. Javier and Carmen (2011) found that well-
developed institutions have positive relationships with public infrastructure for achieving
income growth and poverty reduction, whereas institutional weakness is a poverty trap.
Therefore, the economy can take full advantage of infrastructure investment (including private
investment) in the presence of the efficient institutional structure. Regan (2004) noted that
established infrastructure, government institutions and regional development policies can
create a favourable environment to attract public and private investment. Regional growth and
investment returns are greater when the government has consistent policies and provides
complementary institutional frameworks such as political stability, rule of law, an independent
judicial system and well-established and regulated capital markets. Well-functioning
institutions together with policy reforms and public sector initiatives in infrastructure
investment may increase private investment and the certainty of profit and reduce private costs.

112
3.6.1.1.4 Private sector participation
Public organisations charged with executing PPP infrastructure projects should have
clear policies for developing and implementing these projects, together with an enabling
environment28 for private sector participation in the project’s development.
3.6.1.2 Required institutional framework
Institutions have both formal and informal features. Formal institutions are a set of
explicit, detailed, coded rules that are applied within defined limits, while informal institutions
are a set of social conventions, customs, norms and prevalent social rules that are widely
followed in a given society. Broadly, institutions provide a systematic framework that reduces
uncertainty, establishes property rights and “the rules of the game”, and provides the choices
available to individuals and groups (Jose, 2004; Durham, 2004). Here are a few definitions of
institutions:
• The World Bank (2009) states that institutions provide public facilities including health
care, education, social and economic justice, property rights, rule of law and provision of
investment-friendly climate.
• Institutions create incentives that favour cooperative solutions in which cumulative
experiences and collective learning are best utilised and thereby minimise transaction costs
(North, 1997).
• Institutions have clear objectives and clarity of purpose, create interactions between formal
and informal institutions and bring them together, help reduce transaction costs,
demonstrate adaptiveness to external and internal conditions/environment, have
appropriate scale with respect to their size and scope and can ensure compliance to rules
and objectives (Gandhi et. al, 2009).
North (1994) suggests that institutions such as governments29 set “the rules of the
game”, the humanly devised constraints (rules and regulations) that structure human interaction
(dealings and communication). These constraints are made up of formal constraints (such as
rules, laws, constitutions), informal constraints (such as norms of behaviour, conventions, self-
28 See Glossary of Technical Terms. 29 The term "institution" refers to the rules of the game, whereas "organization" refers to players of the
game.

113
imposed codes of conduct such as those set by professional bodies), and their enforcement
characteristics. The term “organisation” denotes a group of individuals bound by some
common purpose to achieve objectives. Organisations include political bodies (political parties,
regulatory agencies), economic bodies (firms, trade unions), social bodies (churches, clubs),
and educational bodies (schools, universities) (North, 1990). Broadly, institutions provide a
systematic framework that reduces uncertainty, establishes property rights and “the rules of the
game”, and provides the choices available to individuals and groups (Durham, 2004).
Empirical studies have shown that institutional development is the foundation of
economic growth. Institutional development provides a conducive business environment in the
economy in terms of protection of property rights and certainty of returns. The World Bank
(2009) suggests that the basis for the growth of any country depends on: i) the attitude of public
officials; and ii) the role of institutions in providing public facilities including health care,
education, social and economic justice, property rights, rule of law and provision of an
investment-friendly climate. A stable macroeconomic environment, generalised access to the
world economy, protection of individual property rights and spending in public infrastructure
provide benefits for all. Institutions affect economic performance because of their effects on
transaction costs and productivity (Albert and Wouter, 2011). However, the effects of policies
and institutional structure vary from country to country depending on each country’s phase of
development (Romain et al., 2011).
However, this study indicates that a common understanding of the relative roles of
formal institutions, political bodies and economic bodies is necessary for PPP program
implementation. Cheung et al. (2012) identify favourable legal frameworks, institutional
structures, stable macroeconomic conditions and administrative set-ups as essential
components for a successful PPP program. Jamali (2004) also found an effective and efficient
institutional structure (legal and regulatory frameworks) is an essential element of successful
public partnerships with the private sector. Dani Rodrik (2002) argued that institutions affect
growth. The examples of empirical relationships between institutions, investment and growth
are:
i. free market institutions have a positive effect on growth;
ii. economic liberalism affects growth and investment;
iii. political stability may stimulate investment;
114
However, a successful PPP program requires an effective institutional framework that
includes those institutions that are involved in PPP projects and have the capacity to implement
a PPP program.
Li et al. (2005) conducted a study in the UK and found that the lack of an institutional
framework is a significant constraint on the adoption of a successful PPP model. According to
UNESCAP (2010), an institutional framework supportive of a PPP should have appropriate
governing rules and clearly defined regulations, an independent accountable PPP unit/board,
an enabling environment for private sector participation, effective monitoring systems, and the
capability to select appropriate PPP projects and transparent bidding processes. This
framework includes:
➢ PPP project management and supervision – a prudent administration is essential for
successful PPP program implementation. For instance, there must be annual planning and
budgeting for PPP projects and periodic monitoring to review the progress of PPP projects
(Adeniyi et al., 2011).
➢ PPP facilitating/coordinating agency – an agency should be established at government
level with primary responsibility for promoting, facilitating and coordinating PPP projects
(Vieitez-Martinez, 2005). A further step is proposed by the IPDF (2007), which suggested
establishing a PPP unit within all government agencies (including federal, provincial and
municipal level) to develop projects based on PPP principles.
Institutional capacity means the readiness of public institutions (which involve the
development of infrastructure) to carry out infrastructure projects using PPP models. For
instance, capacity may incorporate the following:
• Institutional framework: quality of institutional design, the PPP contract and expropriation
risk (Economist Intelligence Unit, 2009);
• Operational maturity: experience and qualification, public capacity to plan and oversee
PPP projects (Economist Intelligence Unit, 2009);
• Supportive legal and regulatory framework: Judicial independence, dispute-resolution
mechanisms, consistency and quality of PPP regulations and fairness/openness of bids and
contract changes (Economist Intelligence Unit, 2009);
• Accountability: whereby officials are answerable to the entity from which they derive their
authority, work is conducted according to agreed rules and standards and reported fairly
and accurately (De, 2010);
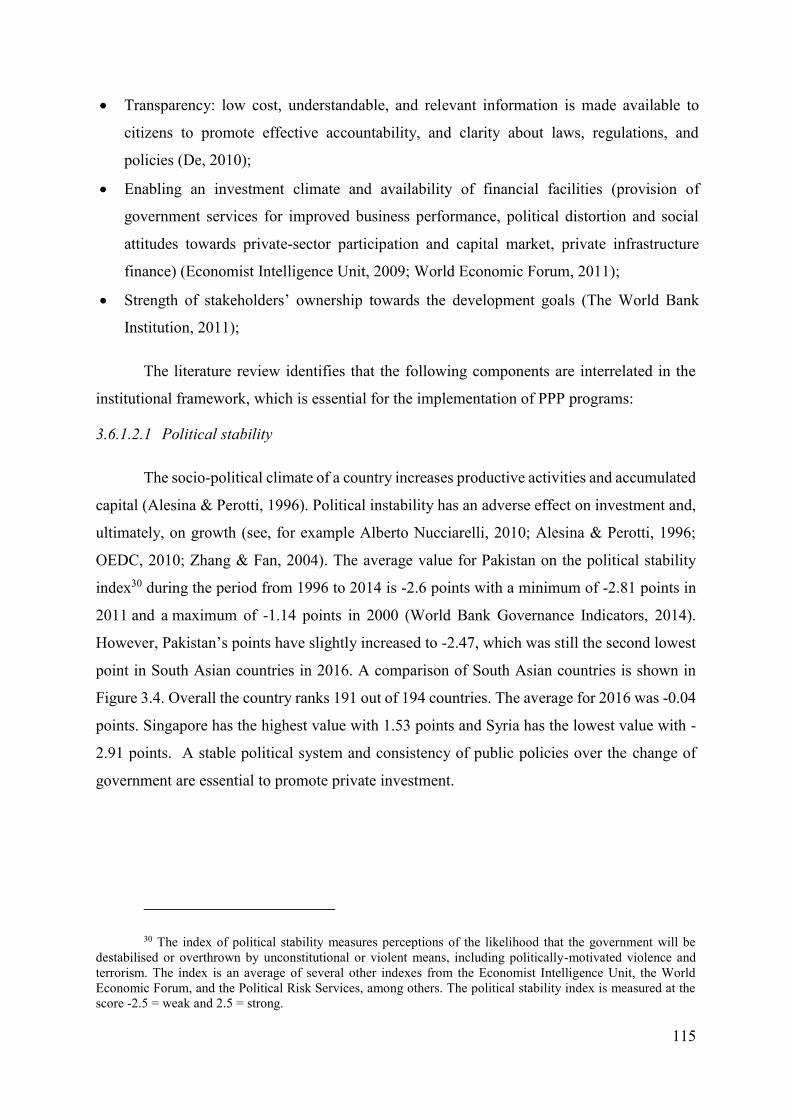
115
• Transparency: low cost, understandable, and relevant information is made available to
citizens to promote effective accountability, and clarity about laws, regulations, and
policies (De, 2010);
• Enabling an investment climate and availability of financial facilities (provision of
government services for improved business performance, political distortion and social
attitudes towards private-sector participation and capital market, private infrastructure
finance) (Economist Intelligence Unit, 2009; World Economic Forum, 2011);
• Strength of stakeholders’ ownership towards the development goals (The World Bank
Institution, 2011);
The literature review identifies that the following components are interrelated in the
institutional framework, which is essential for the implementation of PPP programs:
3.6.1.2.1 Political stability
The socio-political climate of a country increases productive activities and accumulated
capital (Alesina & Perotti, 1996). Political instability has an adverse effect on investment and,
ultimately, on growth (see, for example Alberto Nucciarelli, 2010; Alesina & Perotti, 1996;
OEDC, 2010; Zhang & Fan, 2004). The average value for Pakistan on the political stability
index30 during the period from 1996 to 2014 is -2.6 points with a minimum of -2.81 points in
2011 and a maximum of -1.14 points in 2000 (World Bank Governance Indicators, 2014).
However, Pakistan’s points have slightly increased to -2.47, which was still the second lowest
point in South Asian countries in 2016. A comparison of South Asian countries is shown in
Figure 3.4. Overall the country ranks 191 out of 194 countries. The average for 2016 was -0.04
points. Singapore has the highest value with 1.53 points and Syria has the lowest value with -
2.91 points. A stable political system and consistency of public policies over the change of
government are essential to promote private investment.
30 The index of political stability measures perceptions of the likelihood that the government will be destabilised or overthrown by unconstitutional or violent means, including politically-motivated violence and terrorism. The index is an average of several other indexes from the Economist Intelligence Unit, the World Economic Forum, and the Political Risk Services, among others. The political stability index is measured at the score -2.5 = weak and 2.5 = strong.
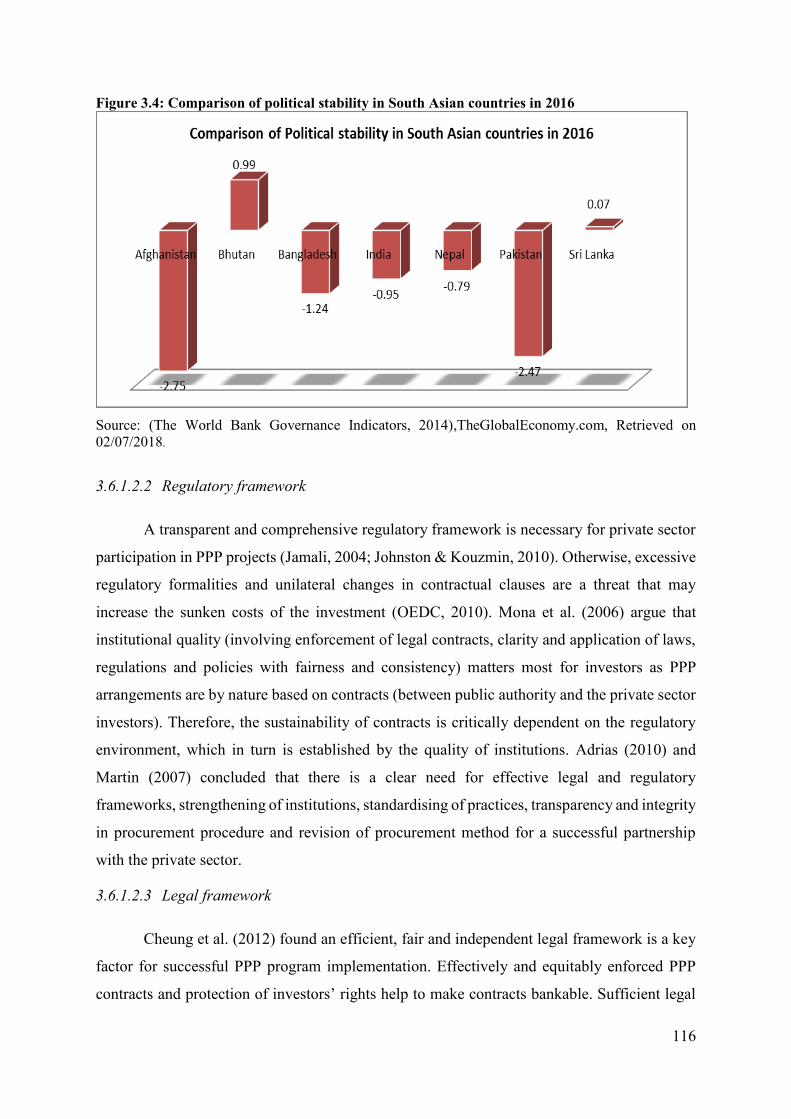
116
Figure 3.4: Comparison of political stability in South Asian countries in 2016
Source: (The World Bank Governance Indicators, 2014),TheGlobalEconomy.com, Retrieved on 02/07/2018.
3.6.1.2.2 Regulatory framework
A transparent and comprehensive regulatory framework is necessary for private sector
participation in PPP projects (Jamali, 2004; Johnston & Kouzmin, 2010). Otherwise, excessive
regulatory formalities and unilateral changes in contractual clauses are a threat that may
increase the sunken costs of the investment (OEDC, 2010). Mona et al. (2006) argue that
institutional quality (involving enforcement of legal contracts, clarity and application of laws,
regulations and policies with fairness and consistency) matters most for investors as PPP
arrangements are by nature based on contracts (between public authority and the private sector
investors). Therefore, the sustainability of contracts is critically dependent on the regulatory
environment, which in turn is established by the quality of institutions. Adrias (2010) and
Martin (2007) concluded that there is a clear need for effective legal and regulatory
frameworks, strengthening of institutions, standardising of practices, transparency and integrity
in procurement procedure and revision of procurement method for a successful partnership
with the private sector.
3.6.1.2.3 Legal framework
Cheung et al. (2012) found an efficient, fair and independent legal framework is a key
factor for successful PPP program implementation. Effectively and equitably enforced PPP
contracts and protection of investors’ rights help to make contracts bankable. Sufficient legal

117
resources at reasonable costs must be available to deal with legal issues and required
documentation (Cheung et al., 2012). Disputes between parties need to be resolved according
to law and contracts without lengthy appeals. Further, a comprehensive, transparent and
effective dispute-resolution mechanism combined with an established independent arbitration
system helps to ensure stability in the PPP program. A successful public partnership with the
private sector demands an effective and efficient institutional structure including the legal and
regulatory framework (Jamali, 2004). The legal structure builds up the principle of
transparency and competition and indirectly provides government assistance to the private
sector for the acquisition of land for projects, grant of foreign exchange facility and protection
against nationalisation (Fombad, 2015; Ismail, 2013).
The literature reviewed broadly shows that the following facilitate trade and
transactions, promote investors’ confidence including FDI and develop capital markets:
i) the judicial system – institutions of enforcement of private property rights (which are
vital for fostering sustainable growth process); and
ii) the institutions of rule of law (which matter most for economic growth) (The Pak
Bankers, 2011).
Emmanuel et al. (2011) suggest that state political institutions are prerequisites for the
smooth operation of economic institutions and policy implementation. According to Tavares
(2004), the judicial system may affect economic performance i.e. enforcement of property
rights, execution of contracts and facilitation of exchanges between business partners. Mo
(2011) concludes that public good governance determines the quality of institutional structures
and develops public policies and infrastructure that are supportive of business activities within
an economy. Accordingly, well-functioning state institutions, such as political institutions, the
judicial system, the financial system and effective governance play significant roles in
implementing PPP to achieve economic and social development parameters.
Empirical evidence suggests that PPP projects develop infrastructure and further play
an important role in determining economic and social development. However, the success of a
PPP scheme depends on clear PPP guidelines and policies, appropriate legal framework, and
institutional and administrative set-ups (Paul, 2010). Public administration, policies, laws and
institutions are the key drivers of private-sector participation in infrastructure services
provision (Joop and Bert, 2009). Effective legal and regulatory frameworks are essential:
strengthening of institutions, standardising of practices, transparency and integrity in

118
procurement procedure and revision of procurement methods for successful public partnership
with the private sector (Adrias, 2010; Smith, 2007 and Dima, 2004).
The primarily established institutional structure is a prerequisite for good governance,
political stability, the rule of law, an efficient financial system, an independent judicial system
and microeconomic stability. In addition, the set-up of professional and skilled organisational
is the key to implementing public policies successfully. In light of findings from the literature
review, established institutional frameworks and professional and competent organisational
structures consisting of the private sector and the public sector jointly may attract infrastructure
investment.
3.6.1.2.4 Financial framework
Many researchers (Cheung et al., 2012; Ismail, 2013; Li et al., 2005; Zhang & Fan,
2004) have discovered that availability of project finance is the key to the success of private-
sector participation in public infrastructure projects. Private investors must have affordable
lending facilities. Further, domestic capital markets may be capable of providing finance for
infrastructure projects. The financial sector must have the capacity to provide risk-hedging
instruments (finance the possibility of loss in an investment). The financial structure of a
country and its economic growth are strongly correlated (Luintel, 2008) . The development of
the financial sector also has a long-term impact on GDP. Indicators of financial development
developed by International Monetary Fund are presented in Table 3.6.
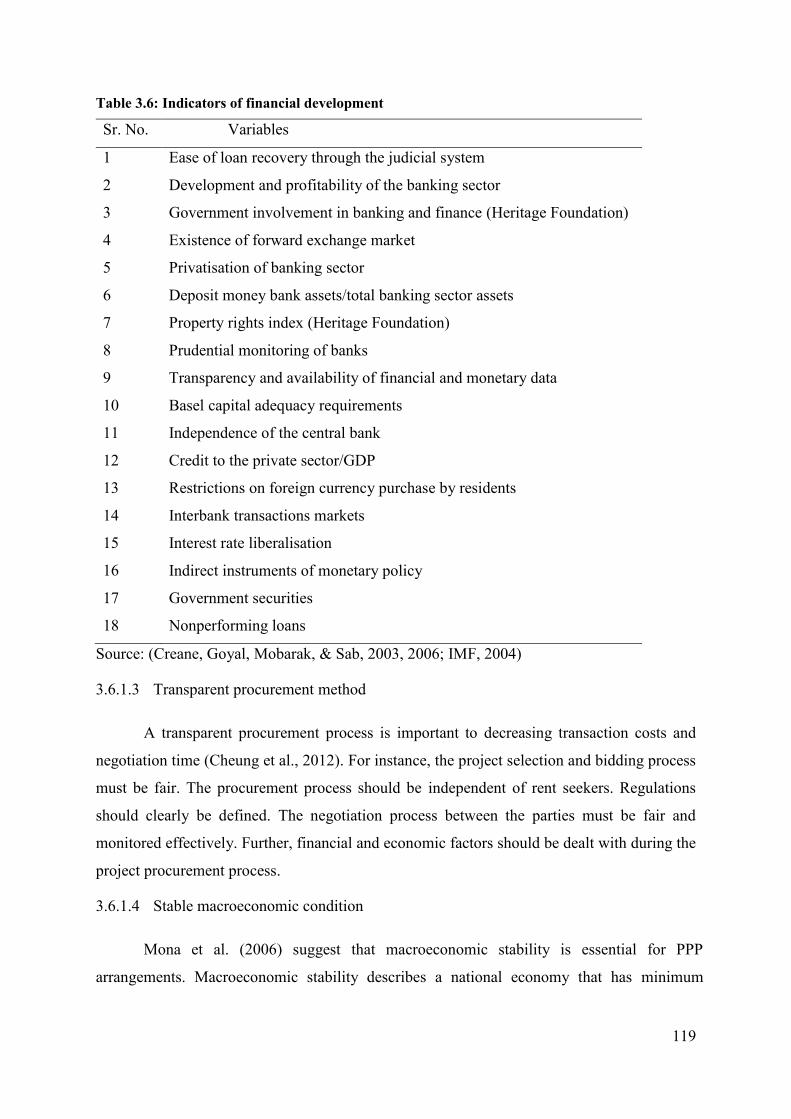
119
Table 3.6: Indicators of financial development
Sr. No. Variables
1 Ease of loan recovery through the judicial system
2 Development and profitability of the banking sector
3 Government involvement in banking and finance (Heritage Foundation)
4 Existence of forward exchange market
5 Privatisation of banking sector
6 Deposit money bank assets/total banking sector assets
7 Property rights index (Heritage Foundation)
8 Prudential monitoring of banks
9 Transparency and availability of financial and monetary data
10 Basel capital adequacy requirements
11 Independence of the central bank
12 Credit to the private sector/GDP
13 Restrictions on foreign currency purchase by residents
14 Interbank transactions markets
15 Interest rate liberalisation
16 Indirect instruments of monetary policy
17 Government securities
18 Nonperforming loans
Source: (Creane, Goyal, Mobarak, & Sab, 2003, 2006; IMF, 2004)
3.6.1.3 Transparent procurement method
A transparent procurement process is important to decreasing transaction costs and
negotiation time (Cheung et al., 2012). For instance, the project selection and bidding process
must be fair. The procurement process should be independent of rent seekers. Regulations
should clearly be defined. The negotiation process between the parties must be fair and
monitored effectively. Further, financial and economic factors should be dealt with during the
project procurement process.
3.6.1.4 Stable macroeconomic condition
Mona et al. (2006) suggest that macroeconomic stability is essential for PPP
arrangements. Macroeconomic stability describes a national economy that has minimum

120
vulnerability to external shocks and increases its prospect for sustained growth. Macroeconomic
stability acts as a safeguard against currency and interest fluctuations in the international market
(International Monetary Fund, 2014; Ismail, 2013). Therefore, stable macroeconomic conditions
reduce uncertainty and encourage investors to focus on productive decisions rather than on
trying to mitigate high risks. Consequently, it induces private investors and particularly foreign
investors to participate in infrastructure development.
3.6.1.5 Public-sector capacity and PPP
Stephan and Raymond (2009) observed that infrastructure development is generally
hindered by two broad public-sector constraints: lack of public capital (lack of funds for
establishing a new infrastructure and maintaining and upgrading existing infrastructure) and
lack of public-sector capacity (lack of resources and specialised expertise e.g. financial
capability and managerial skills). Both capacity gaps (lack of capital and lack of public-sector
capacity) lead to private-sector involvement in developing, financing and maintaining of
infrastructure facilities. The authors investigated public-sector capacity in two categories: i)
defining capacity in terms of the functions that the public sector executes; and ii) defining
capacity in terms of the level of which it is found in the public sector.
➢ Capacity embedded in public sector functions – the functions delivered by the public
authority31. This approach identifies three broad types of capacity: i) strategic capacity;
ii) executive capacity; and iii) political (or institutional) capacity. Table 3.7 describes the
functional classification of capacity.
Table 3.7: Functional classification of capacity
Functional area Description
Strategic capacity Ability to identify problems and to deliver policy advice to decision
makers
Executive capacity Ability to operate government programs/ability to implement
policies/ability to deliver services
Political capacity Ability to define rules and regulations, resolve conflicts and
respond to citizens.
Source: Stephan and Raymond (2009)
31 Throughout this thesis, the focus in relation to public authority is on the executive branch of government. Although this might include inputs into the judiciary and legislative branches, a detailed discussion of their specific roles is beyond the scope of this thesis.

121
➢ Capacity embedded in the public sector level – the capacity embedded in different levels
of the public sector. The authors concluded public sector capacity in three broad types of
capacity: i) capacity embedded at the human level in the skills and capabilities of public
sector employees; ii) capacity at the organisational level contained in processes,
structures, management systems and relationships; and iii) capacity at an institutional
level, consisting of both the rules, norms and standards of the public context, as well as
the macroeconomic and political environment. Table 3.8 describes the level classification
of capacity.
Table 3.8: Level classification of capacity
Functional area Description
Human level Human resources – the capacity of the individual public sector employees
and service delivery capability
Organisational
level
Organisations – management style of public sector organisations
Bureaucratic capability – both financial and administrative capability
The task network – the set of organisations involved in accomplishing
given tasks
Institutional level Rules and procedures set for public sector and the financial resources at
its disposal
Institutional development including community participation
Investment climate
The creation of an enabling environment, with appropriate policy and
legal frameworks
National checks and balances institutions; public attitudes towards private
sector involvement in infrastructure.
Source: Stephan and Raymond (2009)
Major success factors of PPP implementation are summarised in Table 3.9.
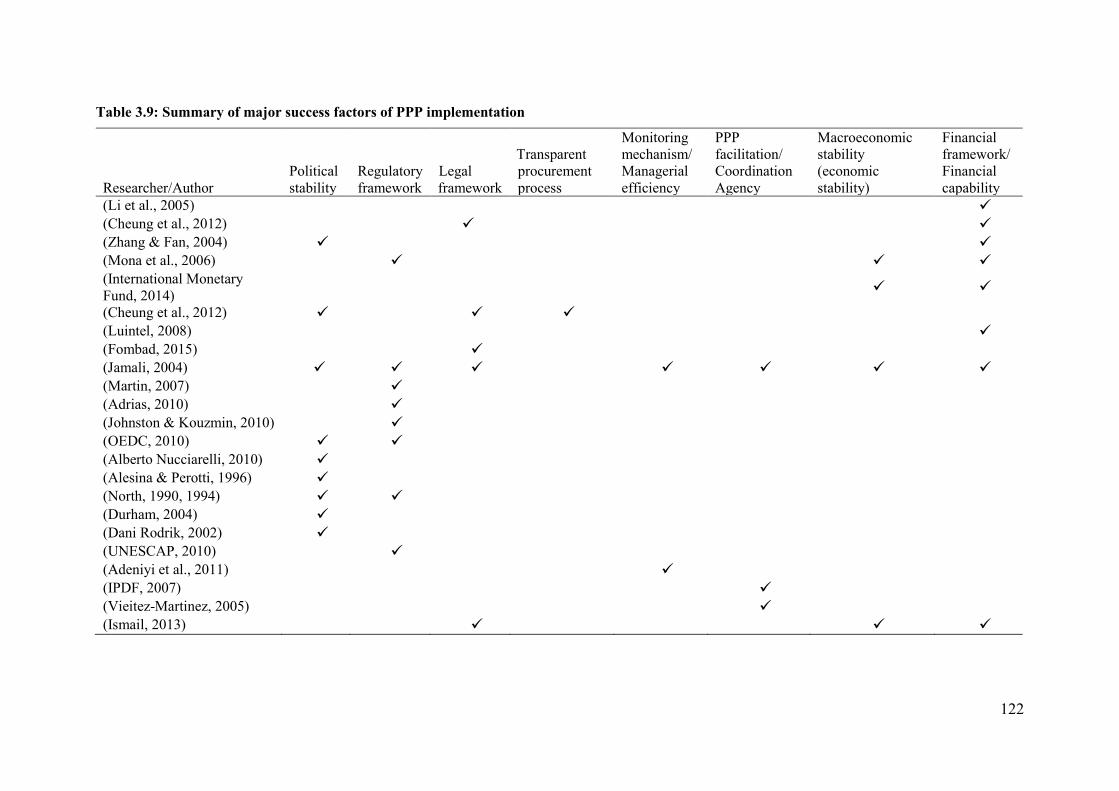
122
Table 3.9: Summary of major success factors of PPP implementation
Researcher/Author Political stability
Regulatory framework
Legal framework
Transparent procurement process
Monitoring mechanism/ Managerial efficiency
PPP facilitation/ Coordination Agency
Macroeconomic stability (economic stability)
Financial framework/ Financial capability
(Li et al., 2005) ✓ (Cheung et al., 2012) ✓ ✓ (Zhang & Fan, 2004) ✓ ✓ (Mona et al., 2006) ✓ ✓ ✓ (International Monetary Fund, 2014)
✓ ✓ (Cheung et al., 2012) ✓ ✓ ✓ (Luintel, 2008) ✓ (Fombad, 2015) ✓ (Jamali, 2004) ✓ ✓ ✓ ✓ ✓ ✓ ✓ (Martin, 2007) ✓ (Adrias, 2010) ✓ (Johnston & Kouzmin, 2010) ✓ (OEDC, 2010) ✓ ✓ (Alberto Nucciarelli, 2010) ✓ (Alesina & Perotti, 1996) ✓ (North, 1990, 1994) ✓ ✓ (Durham, 2004) ✓ (Dani Rodrik, 2002) ✓ (UNESCAP, 2010) ✓ (Adeniyi et al., 2011) ✓ (IPDF, 2007) ✓ (Vieitez-Martinez, 2005) ✓ (Ismail, 2013) ✓ ✓ ✓
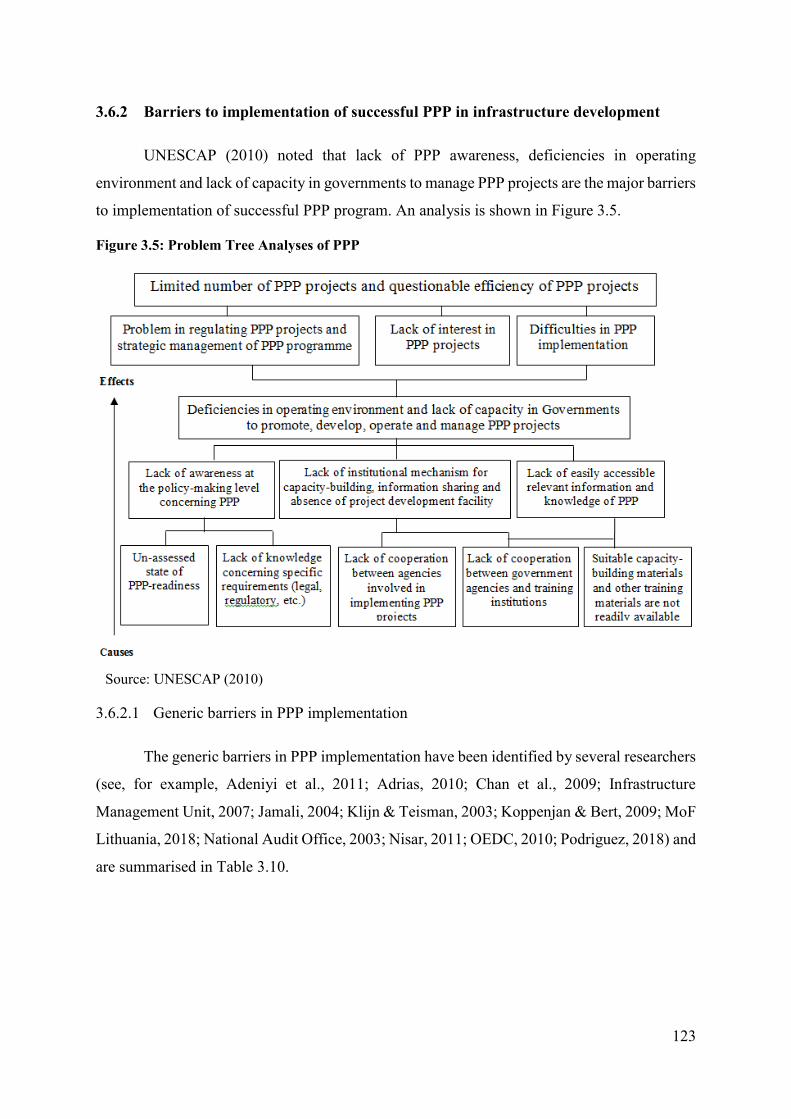
123
3.6.2 Barriers to implementation of successful PPP in infrastructure development
UNESCAP (2010) noted that lack of PPP awareness, deficiencies in operating
environment and lack of capacity in governments to manage PPP projects are the major barriers
to implementation of successful PPP program. An analysis is shown in Figure 3.5.
Figure 3.5: Problem Tree Analyses of PPP
Source: UNESCAP (2010)
3.6.2.1 Generic barriers in PPP implementation
The generic barriers in PPP implementation have been identified by several researchers
(see, for example, Adeniyi et al., 2011; Adrias, 2010; Chan et al., 2009; Infrastructure
Management Unit, 2007; Jamali, 2004; Klijn & Teisman, 2003; Koppenjan & Bert, 2009; MoF
Lithuania, 2018; National Audit Office, 2003; Nisar, 2011; OEDC, 2010; Podriguez, 2018) and
are summarised in Table 3.10.

124
Table 3.10: Generic barriers in PPP implementation
Barriers in PPP implementation
Description
Administrative/ Rules and Regulations Delay in project execution Public sector experience and qualification Financial sector Unrealistic feasibility study
• Governance – bureaucratic approvals and formalities are involved in project initiative
• Modifications in original project design increase cost • Lack of coordination at the federal, provincial and municipal level • Lack of unidirectional policy framework • Lines of demarcation and frequent conflict between state agencies may cause
problems for PPP projects/actors/barriers against cooperation • Apprehension of the government agencies to lose public control over project
management • Inconsistency of public policies • Investment policies frameworks have a focus only to attract investment rather
than any defined objectives • Excessive regulations and complex legal framework • Judicial system is not supportive to PPP • Inflexible tariff adjustment (tariff is not adjusted according to change in
consumer price index) • Land acquisition is constrained where federal and provincial priorities are
divergent • Overlapping role of various state agencies • Lengthy delays due to lack of PPP awareness • Lengthy delays due to political debates • Lengthy delays in negotiations between contracting parties • Delay due to resistance from community groups and environmentalists • Delay due to modifications in original project design • No use of public sector competitor/benchmark PPP model prior to request for
bids • Lack of experience and appropriate skills to implement PPP projects by the
public sector • Lack of specialised research for PPP in Pakistan • Frequent turnover of staff/PPP specialists due to better opportunities in the
private sector side • Lack of established debt market for long-term financing instruments for
infrastructure investment • Non-existence of specialised infrastructure financing institution • Unrealistic financial models (unrealistic revenue and expenditure) • Unrealistic assumptions in feasibility studies
Nataraj (2007) summarises the experiences and lessons learned from PPP programs
undertaken within Mexico, Chile, the United States, and the Philippines:
i. Governments are weak in making enabling policies and regulatory framework;

125
ii. There has been a lack of capacity to meet long-term equity and debt financing needed
by infrastructure projects;
iii. There has been a lack of credible, bankable infrastructure projects; and
iv. There has been a lack of capacity in public institutions and officials to manage the
PPP process.
Espelt (2015) studied the “lesson learned and the best practices in PPP in Latin America
and the Caribbean” and found that:
i. Government involvement – PPP law needs to be created in such a way that structures
government involvement in PPP projects;
ii. Specific PPP law – PPP law must illuminate a legal environment which provides a
stable support system for private sector participation in PPP contracts;
iii. PPP Unit – the government must set up a PPP unit to ensure that the PPP is designed
by following solid criteria that allows for adequate transfer of risks between public
and the private sectors and generates value for money when compared with
traditional forms of project promotion;
iv. Capacity building – training in the public and private sectors to ensure successful
application of PPP projects;
v. Development of Guidelines and Methodologies – PPP guidelines and methodologies
are needed to identify, select, evaluate and structure PPP projects.
3.6.2.2 PPP failure factors
Several authors (see, for example, Confederation of British Industry, 2007; Li et al.,
2005; Rosenau, 1999; Wijeweera, 2010; Zhang & Fan, 2004) identify the main causes of PPP
failure as:
• Unidentified economic and social targets
• Resources and competences of the contracting partners are not identified effectively
• Poor feasibility study and weak business plan (expected service demand and required
services are not properly identified)
• PPP contracts are aimed at long-term (more than 10 years) therefore it is difficult to
foresee future contingencies.
126
3.6.3 PPP studies in the context of South Asia
The literature review suggests that at present, a substantial amount of research has been
done on the subject of PPP in the perspective of developed and developing countries. However,
there are few studies that have examined PPP issues for South Asian developing countries and
particularly in the context of Pakistan. The few exceptions are the study by Nataraj (2007) and
Infrastructure Management Unit (2007).
Nataraj (2007) addresses the PPP status of India, Pakistan and Sri Lanka and suggests
a few policy measures targeted towards the growth of PPP in India. Based on global experience
with PPP, Nataraj identifies constraints associated with the PPP method and how these may
impact upon India and other South Asian countries. The Infrastructure Management Unit of
the Planning Commission of Pakistan, (2007) in its report Constraints to Private Investment in
Infrastructure: Diagnostic Report ascertains generic constraints to PPP programs in Pakistan.
This report focuses on PPP constraints and does not cover the entire spectrum of PPP
implementation framework.
3.7 Role of institutions and private-sector participation in infrastructure
development
Institutions have both formal and informal features. Formal institutions are a set of
explicit, detailed, coded rules which are applied within their defined limits, while informal
institutions are a set of social conventions, customs, norms and prevalent social rules, which
are widely followed in a given society. Broadly, institutions provide a systematic framework
that reduces uncertainty, establishes property rights and “the rules of the game”, and provides
the choices available to individuals and groups (Durham, 2004; Tavares, 2004). North (1994)
defines institutions as the rules of the game: the humanly devised constraints that structure
human interaction. They are made up of formal constraints (such as rules, laws, constitutions),
informal constraints (such as norms of behaviour, conventions, self-imposed codes of conduct),
and their enforcement characteristics. “Organisation” denotes a group of individuals bound by
some common purpose to achieve objectives. Organisations include political bodies (political
parties, regulatory agencies), economic bodies (firms, trade unions), social bodies (churches,
clubs), and educational bodies (schools, universities) (North, 1990).
New institutional economics (NIE) focuses on the social and legal norms and rules that
underlie economic activities. Among many aspects in current NIE analysis are: transaction
127
costs, property rights, contractual safeguards, organisational arrangements, credible
commitments, modes of governance, enforcement mechanisms, monitoring costs, surrounding
uncertainty, asymmetric information, persuasive abilities, human assets, social capital, social
norms, and bargaining strength, etc. (Klaes, 2000; Lueck, 2008).
Institutional economics focuses on understanding the role of the evolutionary process
and the role of institutions to determine economic behaviour (Albelda, Gunn, & Waller, 1987).
Institutions are the rules of the game in the economy, and “organisations” (“the players of the
game”) arise in response to the institutional structure. North (1994) explains: “It is the
interaction between institutions and organisations which shapes the institutional evolution of
the economy.” The characteristics of institutions include organisational activities, procedural
devices and regulatory framework. Tridico (2007) argues that if formal economic institutions
are ignored then informal institutions prevail. They may be illegal, such as the Mafia, organised
crime, corrupt bureaucracy, negative informal economic networks and lobbies etc. These
informal institutions will generate an illegal economy. Consequently, economic
underdevelopment forces will prevail, human development will be lowered and transaction
costs will increase.
According to the World Bank report The Atlas of Global Development (2009), during
the past 15 years there was an increase in economic growth rate particularly in those countries
that opened their economies to trade and investment, maintained sound policies and
strengthened their political and law enforcement institutions. Economists have acknowledged
that the quality of institutional structure in terms of protection of property rights, enforcement
of contracts, efficient judicial systems, public administration, control of corruption and market
regulations play an important role in strengthening long-run economic performance (Tebaldi
& Elmslie, 2008). Dawson (2006) notes that: i) economic liberalism affects growth and
investment; ii) free market institutions have a positive effect on growth; iii) political stability
may stimulate investment; and (iv) the promoting liberalism is an effective policy framework
to enhance growth.
Research (Escobal & Ponce, 2011) has found that strong institutions have positive
relationships with public infrastructure for achieving income growth and poverty reduction,
whereas institutional weakness is one of the poverty traps. Therefore, the economy can take
full advantage of infrastructure investment (including private investment) in the presence of
efficient institutional structure. Regan (2004) noted that established infrastructure, government
institutions and regional development polices can create a favourable environment to attract

128
public and private investment. Regional growth and investment returns are greater when
government has consistent policies and provides complementary institutional frameworks such
as political stability, rule of law, an independent judicial system and well-established and
regulated capital markets. Well-functioning institutions together with policy reforms and
public sector initiatives in infrastructure investment may increase private investment, certainty
of profit, and reduce private costs (Ali, 2003).
The Atlas of Global Development (2009), suggests that the basis for growth of any
country depends on: i) the attitude of public officials; and ii) the role of institutions in providing
public facilities including health care, education, social and economic justice, property rights,
rule of law and provision of investment-friendly climate. A stable macroeconomic
environment, generalised access to the world economy, protection of individual property rights
and spending in public infrastructure provide benefits to all. Institutions affect economic
performance because of their effects on transaction costs and productivity (Albert & Wouter,
2011). However, the effects of policies and institutional structures vary from country to country
depending on each country’s phase of development (Romain, Romain, & Fabrice, 2011).
The growth literature broadly shows that: i) institutions of enforcement of private
property rights (which are vital for fostering sustainable growth process); and ii) institutions of
rule of law (which matter most for economic growth) facilitate trade and transactions, promote
investors’ confidence including FDI and develop capital markets (The Pak Banker, 2011).
Flachaire, García-Peñalosa, and Konte (2014) suggest state political institutions are
prerequisites for the smooth operation of economic institutions and policy implementation.
According to Tavares (2004), the judicial system may affect economic performance i.e.
enforcement of property rights, execution of contracts and facilitating exchanges between
business partners. Mo (2011) concludes that public good governance determines the quality of
institutional structures and develops public policies and infrastructure that are supportive of
business activities within an economy. Accordingly, well-functioning state institutions, such
as political institutions, the judicial system, the financial system and good governance, play
significant roles in implementing PPP to achieve economic and social development parameters.
Paul (2010) notes that PPP shape up infrastructure and further play an important role in
determining economic and social development. However, the success of the PPP scheme is
dependent on clear PPP guidelines and policy, appropriate legal frameworks, and institutional
and administrative set-ups (Espelt, 2015). Public administration, policies, laws and institutions
are the key drivers of private sector participation in infrastructure services provision

129
(Koppenjan & Bert, 2009). Effective legal and regulatory frameworks are essential, which are
strengthening of institutions, standardising of practices, transparency and integrity in
procurement procedure and revision of procurement methods for successful public partnerships
with the private sector (Adrias, 2010; Jamali, 2004; Martin, 2007).
Government is primarily responsible for strengthening institutional structures and the
formation of sound business-friendly policies to attract private investment (domestic and
foreign investment) for providing infrastructure facilities to achieve development goals. Hence,
at this stage, a simple question arises about why developing countries would not adopt better
institutional frameworks. In response to this question, Cavalcanti (2005) argues that firstly,
some vested interest groups erect barriers in providing social infrastructure and strengthening
of institutions. Secondly, Europeans had adopted different colonisation policies in different
colonies with different institutions.
The WEF in Global Competitiveness Reports 2009 – 2018 have provided
benchmarking tools to identify competitiveness. It has grouped all components into 12 pillars
of competitiveness and categorised them into three stages (Figure 3.6). However, it is clear that
different pillars affect different countries differently according to their development phases.
These pillars are not independent: not only are they related to each other, they tend to reinforce
each other. For example, innovation is not possible without basic requirements i.e. institutional
development and basic infrastructure.
Stage-I of development – “Factor Driven” is a turning point for economies. Well-
functioning public and private institutions: increase well-developed infrastructure services, a
stable macroeconomic framework, more job opportunities, increase in income level and living
standard, and literate and healthy workforce. At this stage countries may be at a low level of
productivity and import goods and services to meet their requirements.
As wages rise with advancing development, countries move into the Stage-II of
development – “Efficiency-Driven”. Then countries must be able to develop more efficient
production process and increase product quality. At this point, competitiveness is increasingly
driven by higher education, training, specialised labour force, market size, availability of
affordable finances and use of modern technology. At this stage countries may become self-
sufficient due to increase in productivity.
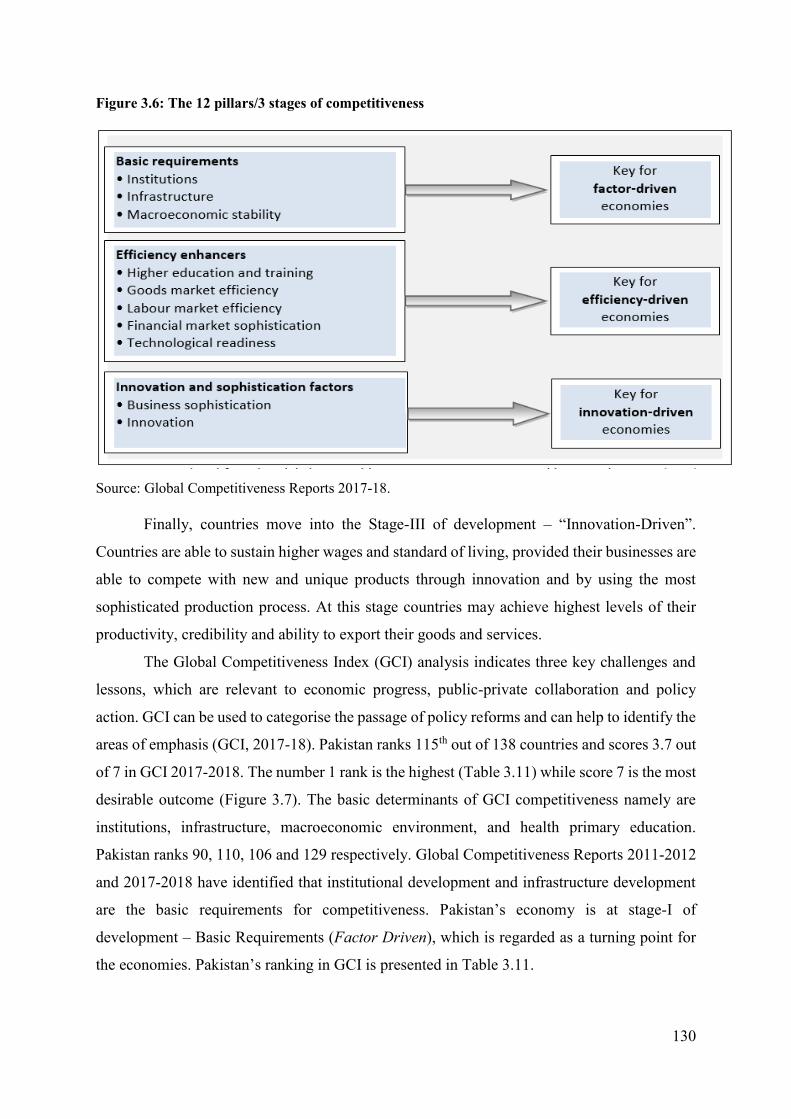
130
Figure 3.6: The 12 pillars/3 stages of competitiveness
Source: Global Competitiveness Reports 2017-18.
Finally, countries move into the Stage-III of development – “Innovation-Driven”.
Countries are able to sustain higher wages and standard of living, provided their businesses are
able to compete with new and unique products through innovation and by using the most
sophisticated production process. At this stage countries may achieve highest levels of their
productivity, credibility and ability to export their goods and services.
The Global Competitiveness Index (GCI) analysis indicates three key challenges and
lessons, which are relevant to economic progress, public-private collaboration and policy
action. GCI can be used to categorise the passage of policy reforms and can help to identify the
areas of emphasis (GCI, 2017-18). Pakistan ranks 115th out of 138 countries and scores 3.7 out
of 7 in GCI 2017-2018. The number 1 rank is the highest (Table 3.11) while score 7 is the most
desirable outcome (Figure 3.7). The basic determinants of GCI competitiveness namely are
institutions, infrastructure, macroeconomic environment, and health primary education.
Pakistan ranks 90, 110, 106 and 129 respectively. Global Competitiveness Reports 2011-2012
and 2017-2018 have identified that institutional development and infrastructure development
are the basic requirements for competitiveness. Pakistan’s economy is at stage-I of
development – Basic Requirements (Factor Driven), which is regarded as a turning point for
the economies. Pakistan’s ranking in GCI is presented in Table 3.11.

131
Table 3.11: Pakistan’s overall score and rank in Global Competitiveness Index 2007-08 to 2017- 18
Year Overall Score Overall Rank GCI Index 2017-2018 (out of 137) 3.7 115 GCI Index 2016-2017 (out of 138) 3.5 122 GCI Index 2015-2016 (out of 140) 3.4 126 GCI Index 2014-2015 (out of 144) 3.4 129 GCI Index 2013-2014 (out of 148) 3.4 133 GCI Index 2012-2013 (out of 144) 3.5 124 GCI Index 2011-2012 (out of 142) 3.6 118 GCI Index 2010-2011 (out of 139) 3.6 123 GCI Index 2009-2010 (out of 133) 3.5 101 GCI Index 2008-2009 (out of 134) 3.6 101 GCI Index 2007-2008 (out of 131) 3.8 92 Source: Global Competitiveness Reports 2009-2010, 2011-12 & 2017-18.
The comparison of South Asian countries shows that Pakistan scores/ranks lowest
(score 3.7/7 and rank 115/138) in GCI 2017-18, while India is at the top with 4.6 score and 40
rank. A comparison is shown in Figure 3.7 and Table 3.12.
Figure 3.7: Comparison of GCI 2017-18 in South Asian countries (Overall Score 7)
Source: Global Competitiveness Reports 2017-18.
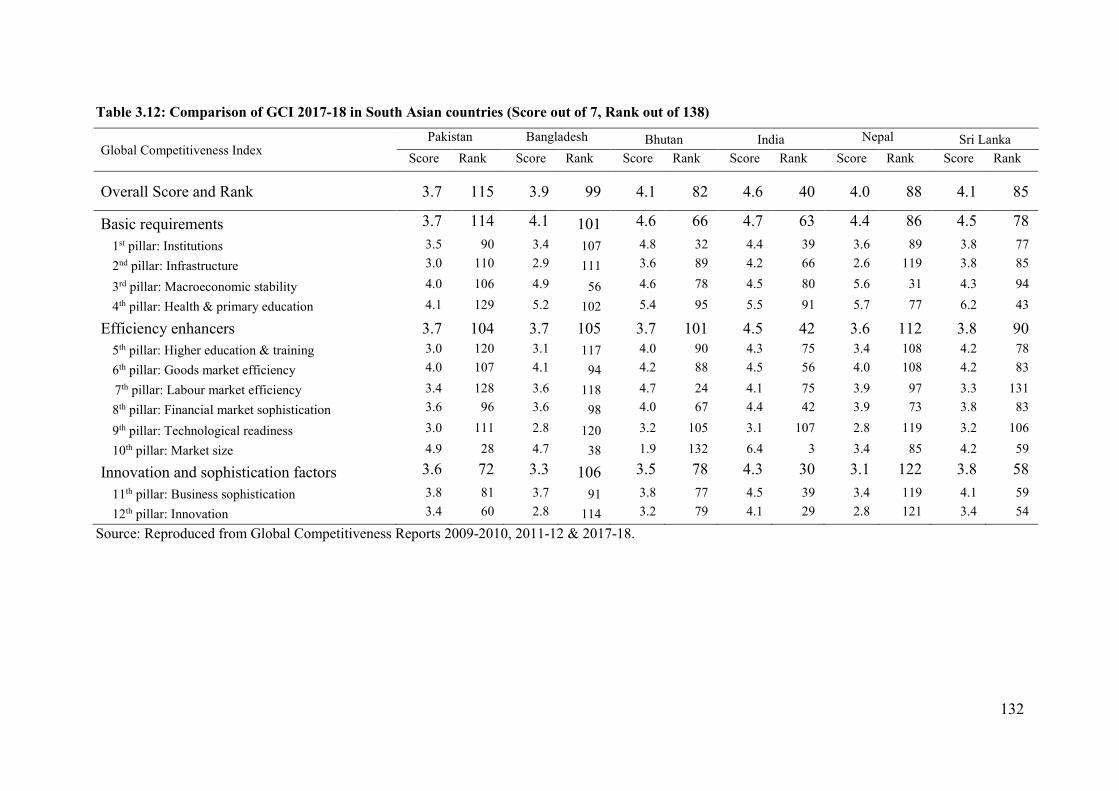
132
Table 3.12: Comparison of GCI 2017-18 in South Asian countries (Score out of 7, Rank out of 138)
Global Competitiveness Index Pakistan Bangladesh Bhutan India Nepal Sri Lanka
Score Rank Score Rank Score Rank Score Rank Score Rank Score Rank
Overall Score and Rank 3.7 115 3.9 99 4.1 82 4.6 40 4.0 88 4.1 85
Basic requirements 3.7 114 4.1 101 4.6 66 4.7 63 4.4 86 4.5 78 1st pillar: Institutions 3.5 90 3.4 107 4.8 32 4.4 39 3.6 89 3.8 77 2nd pillar: Infrastructure 3.0 110 2.9 111 3.6 89 4.2 66 2.6 119 3.8 85
3rd pillar: Macroeconomic stability 4.0 106 4.9 56 4.6 78 4.5 80 5.6 31 4.3 94
4th pillar: Health & primary education 4.1 129 5.2 102 5.4 95 5.5 91 5.7 77 6.2 43
Efficiency enhancers 3.7 104 3.7 105 3.7 101 4.5 42 3.6 112 3.8 90 5th pillar: Higher education & training 3.0 120 3.1 117 4.0 90 4.3 75 3.4 108 4.2 78 6th pillar: Goods market efficiency 4.0 107 4.1 94 4.2 88 4.5 56 4.0 108 4.2 83
7th pillar: Labour market efficiency 3.4 128 3.6 118 4.7 24 4.1 75 3.9 97 3.3 131 8th pillar: Financial market sophistication 3.6 96 3.6 98 4.0 67 4.4 42 3.9 73 3.8 83
9th pillar: Technological readiness 3.0 111 2.8 120 3.2 105 3.1 107 2.8 119 3.2 106
10th pillar: Market size 4.9 28 4.7 38 1.9 132 6.4 3 3.4 85 4.2 59
Innovation and sophistication factors 3.6 72 3.3 106 3.5 78 4.3 30 3.1 122 3.8 58 11th pillar: Business sophistication 3.8 81 3.7 91 3.8 77 4.5 39 3.4 119 4.1 59 12th pillar: Innovation 3.4 60 2.8 114 3.2 79 4.1 29 2.8 121 3.4 54
Source: Reproduced from Global Competitiveness Reports 2009-2010, 2011-12 & 2017-18.
133
3.8 Review of investment theories
The research objectives of this thesis, inter alia, is to survey the current status of
infrastructure development in Pakistan and to evaluate contributions of both the public and
private sectors to infrastructure development. Therefore, it is imperative to identify the purview
of infrastructure investment through public and private partnerships. The purpose of reviewing
investment theories is to identify which investment theory is supporting PPP investment. This
section presents the review of various investment theories.
3.8.1 Neoclassical theory of investment (NTI)
Neoclassical theories represent a radical shift away from International Dependence
Theories. Neoclassical theories argue that governments should not intervene in the economy.
However, they also argue that real-world markets are perfectly competitive and economies
naturally reach equilibrium over time (Blinder, 2002; Pressman, 2011). In other words, these
theories claim that an unobstructed free market is the best means of inducing rapid and
successful development. In neoclassical macroeconomics, output is a function of employment
given the capital stock, and output growth is determined by the interest rate in capital markets,
which is linked to the demand of investment with the supply of savings (Gordon, 1992). In view
of the neoclassical theory of optimal capital accumulation, investment is modelled as adjusted
capital aggregate at an optimal level, assuming perfect competition and profit maximisation and
well-behaved neoclassical production function (Crotty, 1992; Pressman, 2011).
Neoclassical (NC) is anti-Keynes, under which planned savings and planned investment
are assumed to be identical ex-ante32 (predicted results). There is no connection between past
and present in terms of investment, because of capital malleability (flexibility). NTI also
assumes that the future is certain, in which case the interest rate is a risk-free rate. The ideal
properties of the investment under certainty mean perfectly competitive capital markets, where
there are no transaction costs, no taxes and equal information of all market participants (Gordon,
1992).
Neoclassical theory does not give importance to complete information about the future
state of the economy, mainly because of reversible investment and reversible debt. In this case
32 See Glossary of Technical Terms.

134
investment decisions are riskless and mistakes are relatively costless. Besides, capital goods
can also be resold to retire the debt burden (James, 1992). In view of its classical basis, money
plays no role in determination of value and prices of production. Neither is there an instrumental
role for uncertainty. Expectations are stabilised by the institutional environment. These aspects
interface with the Post-Keynesian vision (Kerr, 2005).
3.8.2 Keynesian investment theory
The theories forming the basis of Keynesian economics were first presented in The
General Theory of Employment, Interest and Money, published in 1936. According to Fletcher
(1989) Keynesian economics advocates a mixed economy where the private sector plays a
primary role, but government and the public sector plays a significant role. Keynesian
economics argues that private-sector decisions sometimes lead to inefficient macroeconomic
outcomes and, therefore, advocates active policy responses by the public sector, including
monetary policy (actions by the central bank) and fiscal policy (actions by the government) to
stabilise output over the business cycle33 (O'Sullivan & Sheffrin, 2003). A variant business
cycle34 is the most serious economic problem according to most Keynesians. Thus, Keynesians
advocate active stabilisation policies to reduce the scale of the business cycle. Public policies
can be used to increase aggregate demand and economic activity, reducing unemployment and
depression. For example, when the unemployment rate is very high, a government can use an
expansionary monetary policy35.
The Keynesian investment model served as the economic model during the time of the
Great Depression, World War II and the postwar economic expansion 1945-1973. Keynes
argued that the solution to the Great Depression was to increase economic activities by
stimulating investment through some combination of two approaches: 1) reduction in interest
rates; and 2) government investment in infrastructure. Public investment injects income, which
results in more spending in the general economy. This in turn stimulates aggregate demand,
more production, investment and spending and so forth. A number of activities will be started
as a result of initial stimulation, and the total increase in economic activity will be manifold of
the original investment (Blinder, 2002).
33 See Glossary of Technical Terms. 34 See Glossary of Technical Terms. 35 See Glossary of Technical Terms.

135
Keynesian investment and financing decisions require complete information regarding
the behaviour of price, products and profits for decades into the future. Conversely, there is no
scientific formula to calculate predictability. Firms operate under uncertainty. Therefore, most
crucial economic decisions must be taken in ignorance and uncertainty based on “animal
spirits”36 (human emotions that drive consumer confidence) or the state of confidence of
business executives, which indeed influence investment, income and employment (Crotty,
1980).
3.8.3 Post-Keynesian investment theory
Post-Keynesian economics mainly focuses on macroeconomic issues such as financial
instability, inflation, exchange rate regimes, trade deficits and unemployment (Pressman,
2011). Neo-Keynesian (NK) investment theory determines saving, rather savings determine
investment. Post-Keynesians (PK) primarily focus on understanding the process through which
investment, savings, and financing decisions are determined in a monetary economy in which
the future is uncertain, production takes time, the capital stock is not malleable (flexible), and
an efficient spot market for durable goods does not exist (Crotty, 1980).
Institutionalist and post-Keynesians (IPK) support Keynes and Kalecki in arguing that
savings do not determine investment. Rather profit expectations, interest rates and the
availability and the cost of finance are the important influences on investment, not the flow of
savings (Niggle, 2006). IPK strongly believes in demand-management intervention, arguing
that the economy is inherently unstable and that intervention is needed to ensure stable
conditions for investment and long-run growth. Uncertainty indicates great risk for many
crucial decisions and the resultant instability of expectations regarding profits from investment
and future price of assets. Economic instability and financial instability are dialectically
interactive and must be constrained with appropriate institutions (Niggle, 2006; Sloman &
Norris, 2008). Salient features of IPK are:
• Aggregate demand
• Savings and investment
• Inflation and employment
36 See Glossary of Technical Terms.

136
• Uncertainty
• Exchange rate
• Financial market regulations
3.8.3.1 Aggregate demand
IPK advocates demand-enhancing policy and supports aggregate demand (Peter, 2010).
Insufficient aggregate demand causes low growth as well as recession. Kerr (2005) cites
Harcourt (1999B) and Dow (1996) that post-Keynesianism should be a situation and issue-
specific method of doing political economy. Methodological approach under post-Keynes
theories is an open-systems approach. The open system allows for creativity and the
independent evolution of behaviour and institutions. In this way, a number of Post-Keynesian
investment theories are compatible with the more general principle of effective demand. IPK
sees a strong reinforcing link between demand, cycles, and growth: high demand leads to high
investment and capacity utilisation, which leads to high investment and then higher productivity
in the next period (higher growth).
3.8.3.2 Savings and investment
Profit expectations, interest rates and the availability and the cost of finance are the
important influences on investment, not the flow of savings. Kerr (2005) cites Robinson and
Asimakopulos’s proposal that accumulation and profitability have a two-sided relationship.
Actual investment is a major determinant of current profits, while current profits are major
determinants of expected profits, which in turn determine planned accumulation in situations
of given financial conditions and long-term expectations. Therefore, PK investment theory has
a strong link with investment growth and profitability.
3.8.3.3 Inflation and employment
IPK prioritises full employment over low inflation. Inflation can be seen as a result of
distributional struggles between capital and labour, which can lead to “cost push” inflation.
Institutions which socially control wages, prices, and the distribution of income are necessary
for full employment and price stability (Niggle, 2006).
PK investment function is unstable, therefore the PK vision is one of instability and
disequilibrium. The role of uncertainty in investment decision-making is a key concern of Post-
Keynesian economics (Poitras, 2002). Uncertainty has given a new concept to international
137
economic system. In an uncertain world, future market valuations are always uncertain. Keynes
and Post-Keynesians have rejected the classical theory of an efficient market. Because of the
uncertainty, previous data is not valid anymore for rational expectations and forecasting. Hence,
the existing result cannot provide accurate future information and free markets are not
necessarily efficient (Alves, Ferrari, & De Paula, 1999; Ökten, 2011).
3.8.3.4 Uncertainty
Uncertainty means that a future payment may have more than one value. Uncertainty
cannot be estimated because it is based on probability distribution (Gordon, 1992). Uncertainty
is created by the infinite number of future outcomes which are possible at a given point in time
(Poitras, 2002). Uncertainty implies great risk for many crucial decisions and the resultant
instability of expectations regarding profits from investment and future price of assets (Niggle,
2006). Uncertainty involves unmeasurable and unknowable probabilities. However, past
evidence is no guide when events happen irregularly or the situation extends far into the future
(Pressman, 2011).
Uncertainty arises when we do not know what others will do and when their behaviour
is unpredictable. At a macroeconomic level, uncertainty leads to under investment and
unemployment. This situation requires remedial measures through government institutional
intervention to implement policies effectively. Similarly, uncertainty at a microeconomic level
also needs government intervention to improve economic outcomes. Uncertainty does not
preclude systematic relationships; rather institutions which evolve to accommodate its effects
are likely to provoke stability. In PK macroeconomics, government plays an effective role to
reduce uncertainty and improve economic performance (Pressman, 2011). The role of primary
institutions is to accommodate the uncertainty in economic processes. This is the reason why
institutions are so central to Post-Keynesian theory (Kerr, 2005).
3.8.3.5 Exchange rate
Most IPK economists favour some form of exchange rate regime which would reduce
exchange rate instability (Kerr, 2005). Ökten (2011) cites Davidson (1998) and Wray (1996)
that in an uncertain world, reliance on historical or current market data for forecast future prices
is not reliable. Unpredictability of future prices can have really costly consequences for the
aggregate real income of the community. Therefore, it is obvious that exchange rates must be

138
fixed. Otherwise, a flexible exchange system will raise speculation to a currency and decrease
investment and growth.
Keynes was firmly against the gold standard (i.e. one particular type of fixed exchange
rate regime). Keynes claims that only “fluctuating” exchange rates could maintain wages as
stable in the face of an aggregate demand shock. Fixed exchange rates would lead to a greater
destabilisation of domestic incomes by causing problems of effective demand through wage
adjustment (Ökten, 2011). However, Post-Keynesians have rejected the flexible exchange rates
concept. PK states that flexible exchange rates will destabilise expectations (destabilise the
prices of goods and services) that would encourage speculation. On the other side, it will
discourage future contracts that may seize the economic activities in the nation and the world
economy Ökten (2011) cites (Morengos, 2001, p.695; Wray,1996,p.143; Davidson,
1994,p.238-9). That is why IPK economists favour some form of exchange-rate regime which
would reduce exchange-rate instability. Neo-Keynesians see financial instability and crises as
occasional episodes, which can be handled on an ad hoc basis. IPK favours financial market
regulation and sees unregulated markets as enhancing instability.
3.8.3.6 Financial market regulations
Financial markets and money are central to IPK macroeconomics. PK considers the
roles of institutions and conventions in economic processes rather than deferring to market
coordination as a universal explanation. Further, institutions are necessary to accommodate
uncertainty surrounding many economic decisions (Niggle, 2006; Ökten, 2011).
3.8.4 Conclusion of investment theories
In the view of neoclassical theorists, the theory of value and distribution develops the
surplus approach. Normal prices are determined by the conditions of reproduction and the
distribution of the surplus over the wages as a normal rate of profit in each line of capital.
Money plays no role in determination of value and prices of production. Neither is there an
instrumental role for uncertainty. Expectations are stabilised by the institutional environment.
These aspects interface with the PK vision (Kerr, 2005).
Keynesians see economy as a monetary production economy, put into motion by the
effects of volatile investment expenditure which governs the level of output and employment.
Finance, particularly for investment, plays an important role and money is endogenous. The
distribution of income between wages and profits is central to growth. More precisely, Keynes

139
recommends leveraging up, which means increase in capital investment with borrowing
(Poitras, 2002). Keynes rejects neoclassical value and distribution theory for industry as a whole
(Niggle, 2006).
The Post-Keynesian approach has adopted much of what neoclassical and Keynes
proposed, and states that this work has to be reworked and moulded to fit the contemporary
social setting. For both Keynes and Post-Keynesians, uncertainty plays a central role in the
investment process (Poitras, 2002). Instability is not as important a concern in new Keynesian
economics, and financial markets are discussed mainly as an afterthought (Niggle, 2006).
The following five key aspects distinguish PK economics from neoclassical economics:
1) A recognition that the future is uncertain rather than the future can be predicted with
some probability distribution;
2) Individual decision-making depends on social factors such as habits and emulation
rather than individual rational choice;
3) A belief that economic analysis should examine economies that move through
historical time rather than economies that naturally reach some equilibrium;
4) A recognition that real-world markets are not perfectly competitive;
5) A focus on income effects rather than on substitution effects (Pressman, 2011).
The PK approach tends to see individuals within the context of structures in the form of
institutions, conventions, classes, the State, and all underlying individual behaviour. Individuals
are interdependent, they act in groups. The whole is more than the sum of its parts (Kerr, 2005).
PK models are characterised by systemic risk or uncertainty. For instance, no one can guarantee
that hyperinflation (rapid monetary inflation that is great enough to threaten a nation’s
economic stability) or the collapse of financial asset prices and depression will not occur in the
future (Crotty, 1996). PK accepts the existence of oligopolistic firms (an economic condition
in which there are so few suppliers of a product that one supplier’s actions can have a significant
impact on prices and on its competitors) but emphases the need to regulate them in the best
public interest (Pressman, 2011).
According to Lin and Doemeland (2012) several core aspects of the Post-Keynesian
approach support its positive impact on growth, such as infrastructure investment through
private sector, which is likely to have a positive impact on GDP rather than increase government

140
consumption. Lin and Doemeland (2012) analysed that scaling-up of infrastructure investment
would go beyond the traditional Keynesian approach. These dimensions are:
i) Decrease in government direct spending in the domestic economy;
ii) For the growth-lifting strategy, government should focus on implementing austerity
measures, structural and policy reforms for private-sector participation for increasing demand
in short-term and growth prospects in long-term; and
iii) For infrastructure-initiative, government could use existing financial resources
efficiently and improve policies and institutional environment to attract private investment.
This thesis focuses on PK investment theory to develop infrastructure investment
estimation model. IPK proposes “demand-led” growth economics. IPK considers the roles of
institutions and conventions in the economic process rather than deferring to market
coordination as a universal explanation and the primary institution for accommodating the
uncertainty surrounding many economic decisions about money. PK and IPK public-spending
approaches are rich and have more explanatory power and more usefulness in formulation of
macro policy.
3.9 Scope of the literature review
The literature review has helped in identifying the current research gaps and problems
in the study area. The key aspects that have been investigated via the literature review are
summarised below:
➢ The origin and evolution of PPP and found that PPP is not a new concept of the
contemporary era. There has always been some extent of cooperation between public and
private sector over the centuries. Present PPP structures and models including advantages
and disadvantages and essential ingredients of a successful PPP implementation were also
investigated.
➢ The role of institutions and private sector participation in infrastructure development has
uncovered that institutional framework may be given priority which can attract private
investment for achieving the desired objectives of PPP.
➢ A review of investment theories has defined the domain of PPP investment. In other words,
the review of investment theories has identified that PPP investment is being embraced
under the auspices of Post-Keynesian investment theory.
141
3.10 Literature review conclusions
In general, infrastructure is recognised as a key element of economic and social
development. Improved quality and service coverage in physical infrastructure projects is
essential for a country’s economy and the livelihood of its people. But tight fiscal constraint
requires an innovative approach that moves away from the traditional way to finance
infrastructure projects by public funding. Therefore, a solution could be to take an initiative to
establish partnerships with private-sector investors in terms of PPP that could meet the
increasing infrastructure services demand without burden on public budget. Public
infrastructure expansion in Pakistan has created a need for private-sector investment due to
public budget constraints.
PPP procurement methods are considered the most attractive in terms of positive factors
such as introduction of new technology, cost effectiveness and improved quality of service
delivery. The literature review has pointed out a number of significant benefits for infrastructure
services delivered by PPP models that are not being achieved with the traditional model and
suggests that traditional procurement models are based on lowest-cost evaluation, which are the
worst performing of the state procurement options.
Although it is a difficult task to compare different procurement methods over different
time frames and measurement criteria, evidence exists of better procurement outcomes with
methods that employ a full or partial output specification. The literature review has revealed
that PPP is the best method of procurement specially to deliver large, complex and expensive
projects, achieving significant savings in both time and cost. However, there are some
weaknesses in PPP procurement methods such as:
i) Lack of institutional framework;
ii) Lack of capacity in both public and the private sector (at the working level)
concerning project development and implementation;
iii) Over-commercialisation of projects; and
iv) High participation cost and time. Consequently, theses weaknesses need to be
addressed to make PPP procurement more attractive for infrastructure services
delivery.
142
3.10.1 Concluding remarks
It has been revealed from the literature review of PPP that the establishment of
institutional frameworks should be given priority for achieving the desired objectives of PPP.
A successful PPP program needs to develop:
➢ Institutional frameworks to generate enabling environments which can attract private
investment including reduction of public-sector participation in infrastructure services
provision;
➢ Capacity of both public and the private sectors to participate in PPP projects;
➢ Higher transparency in bidding processes; and
➢ Equal access for both public and private sectors to financing facilities and capital market.
Further, success factors of PPP programs include realistic feasibility studies, accurate
economic and environmental appraisal, and effective risk analysis and risk mitigation
mechanisms.
3.10.2 PPP is a valuable solution to the current infrastructure challenges in Pakistan
It is recognised from the empirical studies that infrastructure is an integral part of
economic and social development in any economy. Pakistan is lagging behind in achieving its
development goals mainly because of poor infrastructure facilities. Financial constraint is one
of the major impediments in infrastructure development, combined with other problems such
as poor infrastructure planning, policy and management. Infrastructure projects in Pakistan are
mostly financed by the public sector through taxes and or by lending from multilaterals financial
institutions and donors on concessional terms.
However, infrastructure projects cannot be financed thought tax revenues because of
smaller tax net, inefficient tax administration and weak economic growth in Pakistan. Besides,
government cannot impose additional taxes, increase tax rates and tax net due to political
reasons. Therefore, new avenues to increase infrastructure investment may be found elsewhere,
beyond the scope of public resources. In this situation/context private sector participation in
terms of PPP can be a part of the solution to the infrastructure financing and management
problem.

143
3.11 Identification of literature gaps
Various aspects of PPP have been explored by past researchers, such as determinants
of PPP in infrastructure development, increasing construction and operational efficiency,
reasons for implementing PPP, PPP success and failure factors, macroeconomic analysis of
PPP, assessment methods of gaining efficiency of PPP projects, enhancing value for money in
PPP projects, study of various PPP models, improving service delivery, reducing costs,
fostering services expansion, bringing efficiency, and productivity.
To date, most of the existing literature has concentrated on identifying the key critical
success factors in PPP implementation, PPP procurement mechanisms, management and
lessons learned from completed projects. Therefore, the overall emphasis of the existing
literature is generally concerned with PPP projects procurement mechanisms, PPP projects
management and performance of PPP projects. A summary of past research is illustrated in
Figure 3.8, which shows that research on PPP has focused primarily on two aspects,
procurement and performance (parts 1 and 2 of Figure 3.8).
Figure 3.8: Summary of existing PPP research
Source: Author

144
Part 1 reflects project procurement processes, management and operation of PPP
projects. Existing research in this part focuses on PPP procurement processes:
➢ PPP needs and options/models analysis, legal, technical, financial and environmental due
diligence, market test – affordability and value for money test;
➢ Bidding process – determination of viability gap funding37 (VGF) needs for PPP projects
and negotiations between contracting parties (public-sector authority and the private
investors);
➢ Risk mechanisms – risk identification, risk analysis and risk mitigation; and
➢ Project management – key performance indicators for project monitoring, tariff adjustment
in accordance with consumer price index, and payment mechanisms including users’
charges and unitary charges38 or payments.
Part 2 emphasises the performance of PPP projects/service delivery. Earlier research
focused on PPP completed projects, which provides useful information and case studies
including success and failure stories of PPP projects, and comparison of PPP projects with
traditional procurement methods.
Part 3 is the focal point between part 1 and part 2. The research objectives of this thesis
in Part 3 are composed of three key elements of successful implementation of PPP:
➢ Capacity of institutional framework – transparent procurement process, probity and
enforcement of PPP contracts, availability of fast-track dispute-resolution, opportunity of
private-sector participation in project development, capital market capacity to finance
infrastructure projects;
➢ Public-sector capacity – PPP awareness and ownership at highest leadership level, PPP
expertise and experience of the organisation, financial and managerial capacity of the
organisation to implement PPP projects and organisational capacity to select right PPP
model for suitable projects; and
➢ Private-sector capacity – PPP expertise and experience of the organisation, competency and
qualification (work plan and methodology) ability to identify project/sector-related issues
and approaches to address them, financial and managerial capacity of the organisations to
implement PPP projects.
37 See Glossary of Technical Terms. 38 See Glossary of Technical Terms.
145
Part 3 (capacity of institutions, public-sector contracting authority and the private-sector
investors) plays a pivotal role as a bridge to connect Part 1 (project procurement and
management of PPP projects) and Part 2 (performance of PPP project/service delivery) right
from the beginning/first step of the PPP project, i.e. project feasibility study and procurement
to the last step i.e. service delivery of the PPP project. Accordingly, Part 3 needs to be
strengthened to achieve intended project objectives, which are to ensure availability of the
services at agreed service delivery standards and an affordable price. However, all three factors
must be considered for a successful implementation of a PPP program.
This thesis focuses on Part 3 as no study has been carried out to determine the capacity
of institutions, public sector and the private sector to implement PPP programs in the
perspective of Pakistan, which is shown as Part 3 in Figure 3.8.
The lack of research on PPP in relation to developing countries in South Asia warrants
increased research efforts. This thesis is an attempt to contribute to this area by examining PPP
program implementation issues concerning Pakistan. It constitutes the first empirical attempt
to identify key determinants of PPP performance with reference to Pakistan such as:
➢ What are the major impediments, and their affects, of PPP implementation in Pakistan? ➢ What kind of institutional arrangements are needed and how can they be developed in
Pakistan to boost PPP undertakings for infrastructure development? ➢ Do the public sector and the private sector have the capacity to implement PPP programs
in Pakistan?
Research methodological issues for the studies undertaken for this thesis are discussed
in Chapter Four.

146
Chapter Four: Research Methodology
In this chapter the methodology used to answer the research questions is described. The
studies undertaken were analysed using both qualitative and quantitative techniques. Section
4.1 describes the conceptual framework used to assess institutional, private sector and the public
sector capacity and other factors to implement PPP program in Pakistan. Research hypotheses
are also presented in this section. Section 4.2 examined the modelling issues. Section 4.3
describes the data used for this study.
4.1 Conceptual Considerations
The objective of the overall thesis is to identify the main obstacles to implementation of
a successful PPP program for infrastructure development in Pakistan. As noted in the previous
chapter (refer to Section 3.8 and 3.9) various factors can affect the successful implementation
of a PPP program. The major ones can be summarised below:
• Institutional capacity
• Organisational capacity
o Private sector capacity
o Public sector capacity
• Other factors.
The relationships between the above-mentioned factors, the implementation of PPP
programs and how they will affect a country’s economic growth is illustrated in Figure 4.1.
Empirical studies reviewed in Chapter Three (refer to Section 3.8 and 3.9) pointed out that
determining the specific roles of PPP investment in infrastructure development and economic
growth is neither simple nor straightforward. To summarise, the performance of PPP in
infrastructure development is associated with the institutional quality/capacity, organisational
capacity and other factors to play their due role effectively. In this conceptual model,
organisational capacity was segregated into two components: private-sector capacity and the
public sector’s capacity to implement a PPP program. Collectively, both capacities perform an
important role in successful PPP program implementation. The relationship states that an
increase in physical infrastructure investment positively affects total investment, government
purchases, GDP and ultimately economic growth. Note: a detailed examination of purely private

147
investment in infrastructure development is beyond the scope of this thesis which focuses on
identifying the factors that underpin succeful implentation of PPP programs.
The significance of each of the factors shown in Figure 4.1 are now discussed in detail,
together with the relevant links to the research questions set for the thesis.
Figure 4.1: Possible interrelationship
Institutional capacity and PPP
As mentioned in Chapter Three, institutional capacity means readiness of public
institutions (which involve the development of infrastructure) to carry out infrastructure projects
using PPP models.
Organisational capacity and PPP

148
The factors impacting on the effectiveness of organisational set-up include structures,
procedures, human resources, administrative actions, and other resources that public and private
stakeholders bring together to achieve a development goal (The World Bank Institution, 2011).
In this thesis, the organisational capacity is taken to comprise both private-sector capacity and
the public sector’s capacity to implement PPP projects.
Other factors
The proposed conceptual model (Figure 4.1) shows that there are a few other factors, to
address for a successful implementation of a PPP program.
Finally, if all components of the proposed conceptual model are implemented
effectively, they can contribute to encouraging investment in physical infrastructure and have
a significant impact on economic growth in terms of GDP as shown in Figure 4.1. The following
section presents research hypotheses to verify the research questions in a testable form.
4.2 Research questions and research hypotheses
The research questions are set up as econometrically testable research hypotheses
corresponding to model 1 of Section 4.3. The primary data (survey quesionnaire data –
qualitative data) sources were used to address the research questions. The preliminary test
results are provided in Chapter Five.
Question 1. Does institutional capacity have an effect on PPP implementation in Pakistan?
To address this research question, a variable was created called “institutional capacity”
(IC). IC assessment scoring criteria were developed in light of The World Bank Institute’s
(2011) Capacity Development and Results Framework (CDRF) and Economists’ Intelligence
Unit’s (2009) model/scoring criteria to evaluate the role of state institutions in implementing
PPP programs in Pakistan. This variable is ordinal by construction. IC has six levels of variables.
The scoring criteria are developed on a five-point Likert scale (1=lowest and 5=highest). IC is
evaluated by asking the following questions to the survey participating organisations. Further
details about the survey and data collection procedure are given in Chapter Five.
1. Does a PPP unit/board exist in your organisation?
2. Are procurement methods transparent?
3. Are PPP contracts enforced?
4. Do dispute-resolution mechanisms (DMRs) exist?
5. Does your organisation allow private-sector participation (PSP) in project development?
149
6. Are domestic capital markets (DCMs) capable of providing finance for infrastructure
projects?
The following hypotheses can be tested to address the above research question:
Institutions in Pakistan have the capacity to implement PPP programs.
0H : IC = 0
1H : IC 0
This hypothesis is tested in a total investment model, public investment model and
private investment models. If we do not reject the null hypotheses 0H then institutional capacity
(IC) does not have the capacity and is a barrier to adopting PPP procurement methods for
infrastructure investment in Pakistan.
Question 2. Does the private sector have the capacity to implement PPP programs in
Pakistan?
Private-sector capacity is essential for a successful PPP implementation. Therefore, the
private sector should have:
➢ PPP-related expertise, qualifications and risk-mitigation capacity and the ability to
identify project/sector-related problems and have the approaches to address these;
➢ Financial capacity to develop, operate and maintain PPP projects and have long-term
financing facilities for PPP infrastructure projects, as well as the capacity to mitigate
financial risk effectively;
➢ Financial, operational and managerial capacity to deliver PPP projects successfully; and
➢ Capacity to mitigate project-related risks effectively.
A variable “Private sector capacity (PVC)” was created to assess the effect of private-
sector capacity. Research findings of Tahir (2011), Jin and Zhang (2010), UNESCAP-PPP
Network (2010), Stephan and Raymond (2009), Yuan et al., (2009), Chan et al. (2009), Klijn
and Teisman (2003), NAO (2003), and WBI CDRF (2011) have been elaborated to measure the
readiness of the private and public sectors as well to implement successful PPP programs in
Pakistan.

150
The scoring criteria is developed on a five-point Likert scale (1=lowest and 5=highest)
to estimate PVC variables. PVC is evaluated by asking the following four questions to the
private sector survey participating organisations.
1. Does your organisation have PPP experience in the relevant sector?
2. Does your organisation have competency and qualification (work plan and
methodology)?
3. Does your organisation have financial capacity?
4. Does your organisation have managerial skills to implement PPP?
This research question can be tested by the following hypotheses:
The private sector in Pakistan has the capacity to implement PPP programs.
0H : PVC = 0
1H : PVC 0
If the null hypotheses 0H is rejected then it is obvious that the private sector in Pakistan
does have the capacity to engage in PPP procurement methods for infrastructure investment.
Question 2.1. Do other factors have an effect on PPP implementation in Pakistan?
As stated, other factors such as good governance, availability of specific PPP legislation,
sector-specific guidelines, an effective judicial system, experienced and skilled human
resources and access to the affordable financial facilities can play an important role in the
success of PPP projects. These factors may be supportive to develop a successful PPP project
with the help of well-functioning institutions and capacity building of both the private sector
and the public sector.
The literature reviewed in Chapter Three revealed that private firms can contribute to PPP
via innovation, new technology, efficient management and financial practices that can improve
the quality of services offered to the public sector. Public investment may crowd in private
investment (including FDI). Subsequently, infrastructure projects may be developed on PPP
modality. Simultaneously, well-functioning institutions and infrastructure investment through
PPP may contribute to achieving high growth.
Economic growth requires sound policies, strong and focused institutional structures,
experienced and skilled organisational structures along with the supportive association of line
agencies. In fact, there are many determinants of competitiveness that are undoubtedly complex
in nature. Therefore, a harmonised policy framework is needed to steer all the key stakeholders
151
of the economy in one direction to achieve higher growth as a whole. Nevertheless, in
developing countries, particularly in the context of Pakistan, very little attention is paid to
examining institutional quality and capacity, private- and public-sector skills and the capacity
to develop public infrastructure with private sector participation.
In order to consider other factors that may have an impact on PPP program
implementation in Pakistan, a variable called “Other Factors in PPP implementation (OF)” was
developed. Twenty-five possible factors were considered and measured on a 5-point Likert
scale (the detail of each factor is provided in the questionnaire in Appendices 5.1 and 5.2).
Thereafter, the other factors were divided up into four sections: i) Admin/Rules & Regulations
)( 1OF ; ii) Delay in Project execution )( 2OF ; iii) Public & Private Sectors’ Experience and
Qualification )( 3OF ; and iv) Unrealistic Feasibility Study )( 4OF . Survey participants were also
given the option to identify additional factors if they are experiencing any kind.
In the private-sector investment model, a variable called “other factors” can be tested
to verify the impact of other factors on private-sector investment in Pakistan by testing the
following hypotheses:
0H : 04321 ==== OFOFOFOF
1H : 04321 OFOFOFOF
There was a need to test jointly the significance of institutional capacity (IC), private-
sector capacity (PVC) and the other factors (OF) to PPP implementation in Pakistan. This can
be achieved by testing the following hypotheses:
6 1 7 2 8 3 9 4
6 1 7 2 8 3 9 4
0 ( , , , )
1 ( , , , )
: 0
: 0IC PVC AllOFs OF OF OF OF
IC PVC AllOFs OF OF OF OF
H
H
= = =
If the null hypotheses 0H is rejected, then institutional capacity, private-sector capacity
and all other factors have an impact jointly on the adoption of PPP procurement methods for
infrastructure investment in Pakistan.
The interaction between public-sector capacity and private-sector capacity was tested to
establish their effects on public infrastructure investment.
Question 3. Does the public sector have the capacity to implement PPP programs in
Pakistan?
152
A variable called “Public sector capacity” (PBC) was developed to assess the public
sector capacity to implement a successful PPP program in Pakistan. In summary, the public
sector should have:
➢ PPP awareness, ownership and expertise to implement PPP.
➢ Expertise and PPP-related experience and qualification to select the right PPP model
and project.
➢ Operational and managerial capacity to deliver PPP projects successfully.
➢ The capacity to mitigate project-related risks effectively.
➢ Effective services monitoring mechanisms.
PBC is evaluated by asking the following questions to the public-sector survey
participating organisations.
1. Does the Chief Executive of your organisation have PPP awareness and ownership?
2. Does your organisation have PPP experience?
3. Does your organisation have the financial capacity to implement PPP?
4. Does your organisation have managerial skills to implement PPP?
5. Does your organisation have the capacity to select the right PPP model and project?
The influence of public-sector capacity (PBC) on PPP undertakings for infrastructure
development can be tested by the following hypotheses:
The public sector in Pakistan has the capacity to implement PPP programs.
0H : PBC = 0
1H : PBC 0
If the null hypotheses 0H is rejected then it is evident that the public sector in Pakistan
does have the capacity to take up PPP procurement methods for infrastructure investment.
4.3 Research Methodology
PPP and institutions collectively perform an important role in economic growth.
Initially, PPP provides investment for infrastructure development (economic, social and
financial), which contributes to economic growth (Lin and Doerte, 2012). Proficient public and
private sectors and well-functioning state institutions are essential to implement successful PPP

153
programs (planning, procuring, developing and monitoring). Empirical evidence suggests that
public and private-sector partnerships may provide investment for infrastructure development,
which contributes to economic growth. Proficient public and private sectors and well-
functioning state institutions are essential to implement a successful PPP program (planning,
procuring, developing and monitoring). Therefore, to describe the role of physical infrastructure
development, institutional frameworks, private-sector and public-sector capacity to manage
PPP projects effectively and efficiently to achieve higher economic growth in Pakistan were
combined.
It was noted in Chapter Three that Keynesian and Post-Keynesian investment theory
advocates demand-enhancing policy and expansionary macroeconomic policies (Blinder,
2002). Institutionalist and Post-Keynesian (IPK) recognise that there is a strong reinforcing link
between demand, cycles, and growth: high demand leads to high investment and capacity
utilisation, which leads to high investment and then higher productivity in the next period
(higher growth) (Kerr, 2005). Therefore, in this study, infrastructure investment analyses the
impacts of private and public investment in infrastructural development. The private and public
investment functions are estimated separately by physical infrastructure applying multiple
regression methods and jointly by using panel vector autoregression (PVAR) to uncover the
effect of cross-sectoral causality.
In the regression context the dependent variable of the regression model is the
investment and the independent variables include GDP, interest rates of Pakistan, institutional
capacity, public-sector capacity, private-sector capacity and other factors involved in
implementation of PPP programs in Pakistan. Under the PVAR framework, all the quantitative
variables were treated as the dependent variable with sectors playing the role of the panel. The
model is a long panel (where the time period is larger than the physical infrastructure sectors).
The physical infrastructure includes the power sector (total investment by both public and
private sectors), telecommunications sector (total investment by both public and private sectors)
and the transportation sector (total investment by both public and private sectors). However,
the transport sector consists of roadways, railway, airports and seaports. The qualitative
independent (explanatory) variables were collected through a questionnaire. As mentioned
earlier, the qualitative explanatory variables were measured on a 5-point Likert scale (1=lowest
and 5=highest order of preferences).
154
The collected data were tabulated and further checked for various basic statistical
properties including the dependency of the qualitative data and stationarity of the quantitative
variables. Once the data properties are satisfied, the model could be estimated within the
multiple regression frameworks. In adopting a multiple regression model, care must be taken
because our investment variable is different for different sectors. Consequently, the cross-
correlation would provide useful information about cross-sectoral dependence in investment.
Further, the mean investment for different sectors could be different. Therefore, the model in
this study was built up within the panel vector autoregression framework allowing dynamics of
investment and other quantitative independent variables. The next panel regression model is
presented below.
Panel regression model
The panel regression that we use takes the following specific form:
1 2 3 4 5 6 1 7 2
8 3 9 4
log log log(1)
e it i e t e t it it it it it
it it it
INV GDP IR IC PBC PVC OF OFOF OF e
= + + + + + + + ++ + +
Where
• i = Telecommunications, Power and Transport.
• itINV (in $US millions) denote the total, public, and private investment in the i th sector
at time t.
• IC, PBC and PVC represent institutional capacity, public-sector capacity and private-
sector capacity respectively.
• The parameter i is the effect of the i th sector.
• is the intercept parameter.
• j ( 9.......2,1=j ) is the unknown coefficient associated with the respective variables.
• i is the i th panel specific effect
• ite is the random error term with certain distributional assumptions.
• OF represent other factors.
Panel vector autoregression (PVAR) The quantitative variables were all treated as endogenous and modelled as a PVAR
model. The random effects PVAR model can be written as follows:
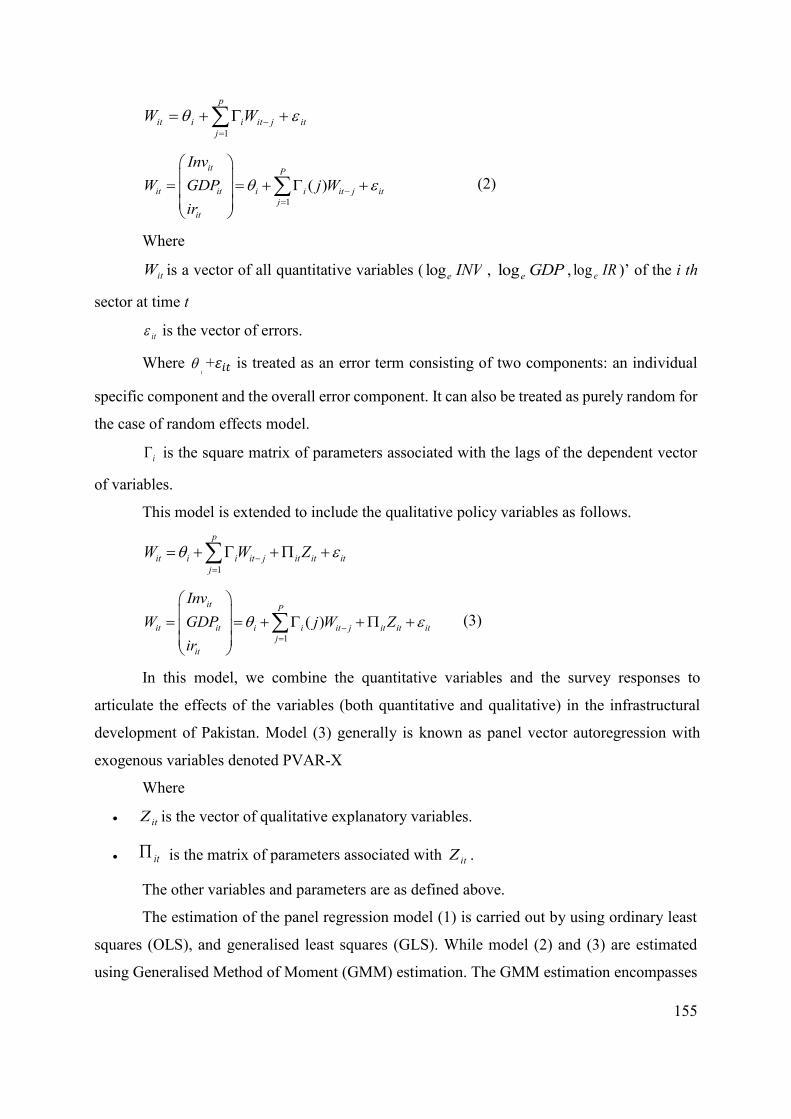
155
it
p
jjitiiit WW ++=
=−
1
1( )
it P
it it i i it j itj
it
InvW GDP j W
ir −
=
= = + +
(2)
Where
itW is a vector of all quantitative variables ( INVelog , GDPelog , IRelog )’ of the i th
sector at time t
it is the vector of errors.
Where i
+𝜀𝑖𝑡 is treated as an error term consisting of two components: an individual
specific component and the overall error component. It can also be treated as purely random for
the case of random effects model.
i is the square matrix of parameters associated with the lags of the dependent vector
of variables.
This model is extended to include the qualitative policy variables as follows.
1
p
it i i it j it it itj
W W Z −=
= + + +
1( )
it P
it it i i it j it it itj
it
InvW GDP j W Z
ir −
=
= = + + +
(3)
In this model, we combine the quantitative variables and the survey responses to
articulate the effects of the variables (both quantitative and qualitative) in the infrastructural
development of Pakistan. Model (3) generally is known as panel vector autoregression with
exogenous variables denoted PVAR-X
Where
• itZ is the vector of qualitative explanatory variables.
• it is the matrix of parameters associated with itZ .
The other variables and parameters are as defined above.
The estimation of the panel regression model (1) is carried out by using ordinary least
squares (OLS), and generalised least squares (GLS). While model (2) and (3) are estimated
using Generalised Method of Moment (GMM) estimation. The GMM estimation encompasses
156
OLS, two-stage least squares, (2SLS), and instrumental variable (IV). The GMM has an
advantage in that it produces consistent and asymptotically normally distributed estimates.
These properties are useful for developing the statistical tests of our research hypotheses.
The post-estimation analysis was performed to check (i) theory consistency, (ii)
statistical significance, (iii) model adequacy and (iv) goodness-of-fit tests. Hausman (1978) &
Breusch-Pagan (1980) tests for model selection (between fixed effects and random effects
models) were also conducted, and a Lagrange multiplier (LM) test for serial correlation. Once
the model satisfied most of the model selection criteria, the model was then used for testing the
research hypotheses and reporting the empirical results. The research problems were restated
in terms of statistical hypotheses and tested within the classical testing framework (e g. t, F, 2 , LR, LM, Wald testing approaches.)
The PVAR and PVAR-X models are estimated using Abrigo and Love (2015) in
STATA, while the panel regression is estimated using xtset code in STATA. The empirical
modelling approaches and the results used to address the research questions are detailed in
Chapter Six.
4.4 Estimation approaches
In this thesis, both quantitative and qualitative data have been used to address the
research questions. For the qualitative data, factor analysis was used to test the suitability and
reliability of the survey data. Cronbach alpha ( ) was also used to measure the reliability and
internal intensity of a set of questions which were asked in the survey questionnaire. As far as
the historical panel data is concerned, a range of panel unit root tests were applied to check for
stationarity of the variables under study. Once the variables were found first difference
stationary then a panel cointegration test among the variables was used to avoid spurious panel
regression results. It was found that the nonstationary variables were not cointegrated.
Consequently, PVAR in difference was used, which is considered one of the key empirical tools
in modern macroeconomics and appears to be an appropriate modelling strategy in this situation.
The PVAR model was extended to the PVAR-X model by combining the survey data with time-
series data to address the objective of this thesis. Model estimation techniques are described in
the following section, whereas empirical results are presented in Chapter Six Section 6.2.

157
Figure 4.2: Flowchart of estimation approaches
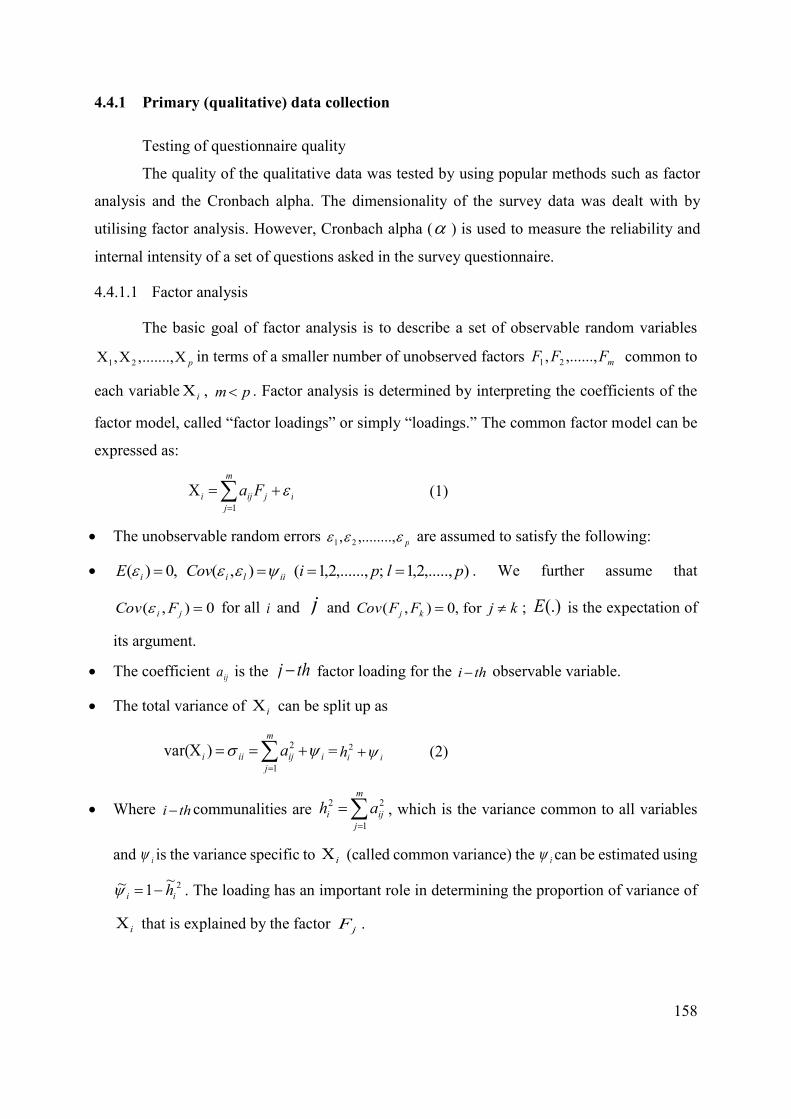
158
4.4.1 Primary (qualitative) data collection
Testing of questionnaire quality
The quality of the qualitative data was tested by using popular methods such as factor
analysis and the Cronbach alpha. The dimensionality of the survey data was dealt with by
utilising factor analysis. However, Cronbach alpha ( ) is used to measure the reliability and
internal intensity of a set of questions asked in the survey questionnaire.
4.4.1.1 Factor analysis
The basic goal of factor analysis is to describe a set of observable random variables
pX.......,,X,X 21 in terms of a smaller number of unobserved factors mFFF ,......,, 21 common to
each variable iX , pm . Factor analysis is determined by interpreting the coefficients of the
factor model, called “factor loadings” or simply “loadings.” The common factor model can be
expressed as:
=
+=m
jijiji Fa
1X (1)
• The unobservable random errors p ,........,, 21 are assumed to satisfy the following:
• ),.....,2,1;,......,2,1(),(,0)( plpiCovE iilii ==== . We further assume that
0),( =ji FCov for all i and j and kjFFCov kj = for,0),( ; (.)E is the expectation of
its argument.
• The coefficient ija is the thj − factor loading for the thi − observable variable.
• The total variance of iX can be split up as
=
+==m
jiijiii a
1
2)Xvar( = iih +2 (2)
• Where thi − communalities are =
=m
jiji ah
1
22 , which is the variance common to all variables
and i is the variance specific to iX (called common variance) the i can be estimated using
2~1~ii h−= . The loading has an important role in determining the proportion of variance of
iX that is explained by the factor jF .

159
• The pairwise “partial correlation” between the variables after controlling for all other
variables should be small compared to the original variables.
Sampling accuracy of the partial correlations can be measured by using Kaiser’s
Measure of Sampling Adequacy. The unobserved factors can be estimated using either by a
principal factor analysis or maximum likelihood method. Factor analysis does not provide
unique solutions by either of these methods. To overcome this problem, an orthogonal
transformation of the factor loadings using VARIMAX rotation due to Kaiser (1958) can be
utilised. The factors that explain the least amount of variance are generally discarded.
4.4.1.2 Cronbach alpha
The Cronbach alpha ( ) is used as a measure of reliability and internal intensity of
a set of questions in a survey instrument. The Cronbach alpha ( ) is computed using the
following formula:
−−
==
21
2
11 X
N
ii
NN
Where N is the number of items in the scale, 2i is the variance of item i ( i =1, 2,..,
N ), and 2X is the variance of the observed total test scores of the construct/factor.
Traditionally a high value of 7.0 implies a high internal consistency of the construct X.
4.4.2 Secondary data collection (Quantitative)
In addition to the survey data, we also used historical data including investment (both
public and private), real GDP, and interest rates (10 years) in this thesis. These variables are
transformed into natural logarithmic form. The logarithmic transformation of the series is useful
first to handle the exponential growth of the series and secondly, to stabilise the variability of
the economic series. This section discusses panel unit root tests, panel cointegration test,
estimating panel regression, PVAR and panel vector auto regression combining with survey
data (PVAR-X).

160
4.4.2.1 Panel unit root test
The time-series property of the data is conducted by panel unit root tests. The unit root
nonstationarity of the variables within the panel framework is tested utilising the following
panel unit root tests.
1. The Levin-Lin and Chu (LLC) test (2002)
2. The Im, Pesaran and Shin test (1997)
3. The Maddala and Wu test (1999) (Fisher-type test)
4. Hadri test (2000)
4.4.2.1.1 The Levin-Lin and Chu (LLC) test (2002)
The Levin-Lin-Chu (LLC) test can be seen as an extension of Dickey-Fuller /
Augmented Dickey-Fuller test based on the following model
ittilti
p
lltiiit tyyy +++++= −
=− ,
11, (This model allows for panel fixed
effects, i , and time fixed effects, t )
The null hypotheses of this test are against the alternative, 0:1 H . The t-statistic
of the test converges to Normal (0, 1) distribution in large samples.
4.4.2.1.2 The Im, Pesaran and Shin test (1997)
The Im-Pesaran-Shin (IPS) test is based on the mean of the individual unit root statistics
of panel variables. The test uses a standardised t-bar statistic based on the following model.
ittilti
p
lltiiiit tyyy +++++= −
=− ,
11,
The null hypothesis is 0:0 =iH for all i against the alternative 0:1 iH for at least
one i.
The individual ADF t-statistics are used to form the test statistic =
=N
ii
tN
t1
1
, ( N is the
number of panels).
The IPS statistic converges to a standard normal variate sequentially as →T followed by
→N .

161
4.4.2.1.3 The Maddala and Wu test (1999) (Fisher-type test)
The Maddala & Wu (MW) Test (Fisher-type test) is based on the p-value ( )i of
individual ADF t-statistics for testing the null hypothesis 0:0 =iH for all i against the
alternative 0:1 iH for some i by estimating the IPS ADF model as above. The test statistic
is =
−=N
ii
1ln2 . This statistic has a 2 - distribution with 2N degrees of freedom.
4.4.2.1.4 Hadri test (2000)
The Hadri test is similar in spirit to Kwiatkowski-Phillips-Schmidt-Shin regression-based
null of stationarity versus the alternative of the non-stationary test. The Hadri test is based on
the residuals obtained from the following.
ititit ry += and itiitit try ++= . Where ititit vrr += −1 . After repeated substitution, it can be
written itiitit try ++= as it
t
titiiit vtry +++=
=10
or, itiiit etry ++= 0 , where it
t
titit ve +=
=1
. It is
assumed that it are i.i.d, 0)( =itE and 0)( 22 = itE . Further, 0)( =itvE and
0)( 22 = vitvE . The stationarity hypothesis is simply 02 =v . So, under the null hypothesis
ity is stationary around a level in model ititit ry += and trend stationary in the model
itiitit try ++= .
If 02 =v , then ite is identical to it . Whereas if 02 v then ite is nonstationary. So, the locally
best invariant test and /or the LM test is to test the 0:0 =H against 0:1 H , where 2
2
v= .
4.4.2.2 Panel Cointegration test
Once the panel unit root tests have been performed and variables have been found to be
stationary in first difference, one must test for cointegration to avoid spurious panel regression.
The test for panel cointegration among the variables is conducted by utilising a Persyn &
Westerlund (2008) Error-Correction based cointegration test for the panel data. Persyn &
Westerlund have developed four tests: two are group mean tests (denoted Gt and Ga
respectively) and the other two are panel tests (denoted pt and pa respectively). If the

162
nonstationary variables are not cointegrated, then PVAR in difference might be an appropriate
modelling strategy.
In the panel VAR regression model our objective is to establish linkages between public
and private partnerships in the context of Pakistan to: i) evaluate contributions of public and the
private sectors to infrastructure development; ii) examine the causes of the lack of PPP
undertakings; iii) identify a framework which helps establish essential institutional
arrangements conducive to PPP adoption; and iv) draw implications for policy development to
implement PPP in Pakistan effectively.
4.4.2.3 Panel regression
A common pooled panel data regression model may take the form: it it ity x = + + ,
where y is dependent and x is the independent variable, and are unknown parameters,
the suffices i and t indicate individual and time index respectively. The error it has an
important role in the analysis of panel data. In fixed effects model it is assumed to vary non-
stochastically over i or t making the fixed effects model analogous to a dummy variable model
in one dimension. In a random-effects model it is assumed to vary stochastically
over i or t requiring special treatment of the error variance matrix (Hsiao et al., 1999). The
preliminary analysis of choosing between a random-effect model and a fixed-effect model was
done by utilising a Hausman (1978) test and a Bruesch Pagan (1979) test and a random-effect
model was retained. The theoretical development of panel data regression is presented in the
next step.
In this study, three variables jointly were modelled, which can be expressed in VAR
form. The Sims (1980) VAR is extended within panel VAR (PVAR) context as the data is panel
data.
4.4.2.4 PVAR
The VAR appears to be a multivariate generalisation of univariate autoregressive models.
Secondly, VAR turns out to be one of the key empirical tools in modern macroeconomics (Del
Negro and Schorfheide, 2011). The VAR basically is used for two purposes i.e. macroeconomic
forecasting and structural analysis. VAR often provides superior forecasting and sometimes
elaborates theory based on simultaneous equation models.
In the classical univariate regression analysis of economic variables, the variables are
classified into response (dependent) variables and explanatory (independent) variables to study

163
the linkages among economic variables. At the outset, however, when it is not clear which of
the variables is/are to be treated as response and which to be treated as explanatory variables,
Sims’ (1980) modelling methodology is perhaps very promising. Sims’ methodology treats all
the underlying response variables as endogenous and is modelled within the multivariate
autoregression framework. These models are widely known as vector autoregressive (VAR)
models.
Basic VAR uses only time dimension of the data. While PVAR uses both time
dimension and panel specific effects jointly. The PVAR also increases the degrees of freedom
and treat the individual specific heterogeneity. PVAR is used as it clearly defines the impact of
each variables in the panel. The VAR models are also used to investigate the short-run dynamics
among economic variables under various shocks. In other words, VAR can be used to
investigate the response to shocks. For example, what would happen to the prices and output
if a demand shock hit? Another use of VAR is to analyse the sources of business cycle
fluctuations or it can provide the benchmark against which modern dynamic macroeconomic
theories can be evaluated. In short, with the statistically acceptable model, one can produce a
forecast and structural VAR specification and estimation. In this context, one can analyse the
impact of innovation through impulse response analysis and can also understand the forecast-
error variance decompositions. One important aspect of VAR is the determination of VAR
order. VAR order selection is usually undertaken by utilising the multivariate AIC, BIC, and
Hannan & Quinn among other statistics.
The VAR model can easily be estimated by the OLS method. The OLS thus obtained are
consistent and asymptotically efficient. The number of parameters in the VAR model increases
as an increase in the variables and the lag order of the VAR.
There is an issue of whether the variables in a VAR need to be stationary. Sims (1980),
Stock & Watson (1990) recommend against differencing even if the variables in a VAR contain
a unit root. If the variables in a VAR are difference stationary and the variables are cointegrated,
then VAR in difference is misspecified. In this situation, the appropriate modelling approach
would be a vector error correction (VEC) model. In this case, the VEC Model is appropriate in
explaining both the short-run and long-run dynamics of the data generating process.
A useful extension of VAR is the panel VAR (PVAR). This model combines the time-
series and cross-sectional dimension. Panel gives more information on data, more variability
among variables, more degrees of freedom and more efficiency. Both cross-sectional and time-

164
series units are considered jointly in this specification. The PVAR model is useful because it
captures both static and dynamic interdependence among panel variables of interest. It
incorporates time variations in coefficients and in the variance of the shocks. PVAR further
accounts for cross-sectional dynamic heterogeneities. It allows for cross-sectional dependence
among shocks and cross-sectional interactions in short-run dynamics.
The general form of the panel VAR model of order p can be written in the following form:
itipitpitit ++++= −− .......11 (1)
Where it is a vector of dependent variables of interest, )....3,2,1( pjj = is a coefficient
matrix, it is a ( 1)m vector of the error term and i is a ( 1)m vector of panel variable
specific effect (which can be fixed or random).
The roots of the determinantal equation ( mI - jj
p
jzA
=1) = 0 are assumed to lie outside the
complex unit circle for stationarity of the time series of interest. Where Im is a ( m m ) identity
matrix.
We can rewrite (1) more compactly as:
itiitit AX ++= (2)
Where '
, 1 , 2 ,( , ,......... )it i t i t i t p− − − = is a )1( mp vector.
In this study, =it )'ln,ln,(ln irgdpinv , the variables are in natural logarithm.
If the panel unit root tests of the previous section confirm that the variables lninv, lngdp and
lnir are first differenced stationary, i. e. if )1(~ Iit , then )0(~ Iit . Therefore, we can
rewrite (1) or equivalently (2) in terms of differenced variable as.
itipitpitit ++++= −− ...11
Or equivalently
itiitit A ++= (3)
Where the notations are as described above. In this study, a simple PVAR (1) model is
selected by the multivariate AIC criterion. The model 3 becomes:
itiitit Y ++= −11 (4)
Where 1 is a (3x3) unknown matrix of coefficients to be estimated using the sample data.
Since the variables are first differenced stationary, the variables ( it ) were tested for
165
cointegration. Persyn and Westerlund (2008) test found no support of panel cointegration. Thus,
the differenced series were used to analyse the linkages among the variables using (4). The
tools employed by PVAR analysis are Granger-Causality, impulse response analysis and
variance decomposition. These techniques are helpful in understanding the dynamic
interrelationships among the economic variables in formulating of a more structured economic
model.
The parameters of the model (4) can be estimated by using an equation-by-equation OLS
method, see Abrigo and Love (2015). However, because of lagged dependent variables on the
right-hand-side of the model (1), the OLS would be biased even with large N and T, see Nickell
(1981). Following Abrigo and Love (2015), The generalised method of moment (GMM)
estimators were used, which were consistent and asymptotically normal.
The STATA codes (see Abrigo and Love, 2015) are used for estimation and for testing the
relevant hypotheses to serve the purpose of the thesis. The empirical results are provided in
Section 6.2.
4.4.2.5 Panel vector auto regression combining with survey data (PVAR-X)
As mentioned earlier PVAR-X is an extended version of panel VAR model. PVAR-X may
be extended to include extraneous variables. These variables can be based on survey data or on
some other useful variables that are expected to provide more specific objectives of the
research. Both the PVAR and PVAR-X models are used to address the research questions stated
in Chapter One.
4.5 Data
In this study, both primary data and secondary data are used. The primary dataset was
collected using a survey questionnaire (Appendices 5.1 and 5.2). The secondary dataset was
collected for the period from 1991 to 2014, from various sources including the World Bank,
DX-time data base and the Pakistan statistical year book. PPP was introduced in Pakistan in the
early 1990s that is why the time period 1991 to 2014 is chosen. Major secondary data sources
included:
• Investment in both the private sector and the public sector in physical infrastructure i.e.
telecommunication, power and transport sector.
• GDP in real term based on the year 2010.

166
• The interest rate has been taken as a variable in the investment model instead of
unemployment and inflation. Because there is an inverse relationship between the rate
of unemployment and inflation. In other words, decreased unemployment (or increased
levels of employment) in an economy correlates with higher rates of 10 years. An
interest rate of 10 years maturity period was used. Further, Institutionalist and post-
Keynesian theory adheres to Keynes and Kalecki in arguing that savings do not
determine investment. Profit expectations, interest rates and the availability and the cost
of finance are the important influences on investment – not the flow of savings (Chris,
2006). The quantitative variables are summarised in Table 4.1.
Table 4.1: Summary of quantitative variables for the period 1991-2014
Variable Description Data Source
Total investment (INV)
Total of public-sector investment and the private-sector investment in telecoms, power and transport sectors. Transport sector includes roadways, railways, air transport and seaports.
The World Bank database
Private investment (INV1)
Private-sector investment in telecoms, power and transport sectors.
The World Bank database
Public investment (INV2)
Public-sector investment and the private-sector investment in telecoms, power and transport sectors.
The World Bank database
GDP GDP in real terms based on the year 2010. The World Bank database
Interest rate (IR) Interest rate of 10 years of maturity period State Bank of Pakistan
167
Chapter Five: The Survey and Preliminary Results
This chapter presents the methodology used for the primary data (survey data) collection
procedure and the development of the survey questionnaire and discusses limitations/problems
in the survey data collection. Section 5.1 describes the design and administration of the survey
questionnaire. Descriptive statistics and preliminary results are discussed in Section 5.2.
Section 5.3 summarises the survey results.
5.1 The Survey
5.1.1 The questionnaire
A questionnaire was designed to examine the impact of private and public-sector
capacity and institutional barriers to developing physical infrastructure including
telecommunications, power and transportation (railways, roadways, airports and seaports)
through PPP in Pakistan. Two questionnaires are shown in Appendix-III and Appendix-IV
respectively. The public-sector survey questionnaire had 10 main question sections, with
subsets of questions under several of the main sections. The private sector questionnaire had
nine main question sections, with subsets of questions under several of the main sections. Most
questions were measured by a Likert scale that ranged from 1-5 (1=lowest, 5=highest order of
preferences)
Some questions required only a dichotomous “yes” or “no” answer. At the end of these
questions, participants were offered the opportunity to provide additional comments, if any.
Descriptions and objectives/justifications for each of the questions in the survey questionnaire
are given below:
• Question 1. Personal information – sought personal information about the survey
participants, such as their gender and age. This question investigated the experience and
educational background of the participants and their employment profiles such as job
title, qualifications and tenure in their current job.
• Question 2. Information of the organisation – sought organisational information about
the main employer of the survey participants. The intention of this question was to elicit
information about the work experience and the background of the organisation: the
name and address of the organisation, date of inception, line/sector of the organisation
and whether their organisation was involved in PPP projects.

168
• Question 3. Importance of infrastructure39 – consists of two sub-questions:
a. Infrastructure and the performance of your organisation – contained a subset of
nine questions that sought to identify the perceived importance of infrastructure to
the performance of the organisations; for example agreement or disagreement with
statements such as better infrastructure helps organisations to reduce their operating
costs, improves their labour and capital productivity, their service delivery and
operational networks, increase their business opportunities, revenue and
profitability.
b. Infrastructure and the economic growth of Pakistan – contained a subset of six
questions that evaluated how much infrastructure can help Pakistan to increase
market size, public revenue, public capital stocks and productivity and to create
employment opportunities and improves people’s living standards.
• Question 4. Public- and private-sector capacity assessment – public-sector
questionnaire contained a subset of five questions, while private-sector questionnaire
contained a subset of four questions. The underlying principle of these questions was to
determine whether the PPP model is being used effectively in Pakistan to proactively
involve both sectors in infrastructure development. If it is not, the questions then
enabled an understanding of why and the major obstacles? In other words, this
information measured the readiness of both sectors to become involved in PPP projects
at an operational/working level.
• Question 5. Institutional capacity assessment – public-sector questionnaire contained a
subset of six questions, while the private-sector questionnnaire contained a subset of
five questions. The rationale for this question was to identify how public institutional
capacity influences public and private-sector infrastructure investment in Pakistan.
• Question 6. Availability of guidance materials40 – contained a subset of threee
questions. These questions were measured on a “Yes” or “No” basis. These questions
confirmed that availability of PPP guidance material is essential to implement PPP
39 Question 3 to 10 were evaluated on a Likert 5-point scale (1=lowest and 5=highest) except question 6 which was measured on a “Yes” or “No” basis.
40 Question 6 was beyond the scope of this thesis and was not included in the analysis.
169
programs effectively. This question was beyond the scope of this thesis and was not
included in the analysis.
• Question 7. Barriers to PPP program implementations in Pakistan – contained a subset
of 25 questions. Theses questions identified whether governance-admin/rules and
regulations, delays in PPP project execution, public and private-sectors participant PPP
experience and qualification, and unrealistic feasibility study are barriers to PPP
implementation in Pakistan.
• Question 8. What are the key factors that can drive successful PPP programs in
Pakistan?41 This question provided an opportunity to survey participants about key
factors which can drive successful PPP programs in Pakistan. This was an open-ended
question and beyond the scope of this thesis and was not included in the analysis.
• Question 9. Suggest changes in laws, regulations and administrative procedures
required for successful implementation of PPP in Pakistan, if any42. This question
provided an opportunity to survey participants to propose necessary changes in laws,
regulations and administrative procedures for successful implementation of PPP in
Pakistan. This was an open-ended question and beyond the scope of this thesis and was
not included in the analysis.
• Question 10. Private-sector investment and the performance of your organisation –
public-sector questionnaire contained a subset of 10 questions which were asked in
relation to the public-sector organisations to investigate the perceived effects of private-
sector investment on the performance of the public-sector organisations. For instance,
agreement or disagreement with statements such as private investment helps public
organisations to introduce modern technology to their operations, reduces their
operating costs and increases their revenues, improves their labour and capital
productivity, improves public amenity, service delivery and operational networks,
brings forward public investment and creates job opportunities.
41 Question 8 was beyond the scope of this thesis and was not included in the analysis. 42 Question 9 was beyond the scope of this thesis and was not included in the analysis.
170
5.1.2 Administration of the survey
An information sheet (placed at Appendix-V) was attached to the survey questionnaire,
explaining the objectives of the study and its relevant variables (as this thesis mainly focuses
on PPP implementation and selected/investigated determinants of PPP implementation in
Pakistan) and assuring respondents’ confidentiality. The information sheet invited participants
to take part in this study voluntarily. The information sheet also contained the researcher’s
contact details so that the respondents could send their questionnaire responses directly to the
researcher or notify the researcher if they had any concerns or questions. To increase the
response rate, an offer was made that, at the end of the study, a copy of the aggregated results
would be provided to the survey participants if they desired. However, no one requested a copy
of the aggregated results.
Initially, the researcher met with some of the proposed survey participants in November
2013 before sending them the survey questionnaire. This was the preferred approach for two
main reasons. Firstly, it introduced respondents to the objectives of the research and allowed
them to discuss the research topic to assess their response. Secondly, before finalising the
survey questionnaire it was intended to incorporate their suggestions and perceptions of issues
that obstruct attracting private-sector investment and impede implementation of PPP programs
in Pakistan. These preliminary meetings with survey participants helped to modify and improve
the questionnaire. Subsequently, the questionnaire was sent via email to the chief executive
officers/top management of those industries which are involved in implementing PPP in
Pakistan. These executives included infrastructure experts, sector consultants, investment
companies, lenders, construction companies, engineering consulting companies, transaction
advisory firms including chartered accountants and legal advisers. A survey questionnaire was
also sent to the public sector stakeholders involved in infrastructure development in Pakistan,
such as the telecommunications sector, power sector, road sector, railways sector, seaports,
aviation, banking, public sector, PPP facilitating and coordinating organisations, and regulatory
authorities of Pakistan.
In this study, care was taken in selecting the survey participants. Therefore, the survey
questionnaires were sent/limited to those professionals, senior managers, directors and chief
executive officers of public and private-sector organisations involved in infrastructure facility
development and/or had an interest in PPP projects and had the professional commitments and
expertise to assess the questions carefully before answering them. In total 149 survey
171
questionnaires were distributed. The survey was conducted from December 2013 to June 2014.
In the beginning, the response rate was very low (below 7 percent) so reminders were sent to
those who did not respond. Survey participants were also contacted via telephone and any
queries were discussed, explained and answered. Participants were reassured that their
responses were confidential. However, the response rate was not encouraging despite repeated
reminders through telephone calls and emails. Consequently, the researcher organised in-person
interviews with the survey participants on a visit to Pakistan in March 2014 to obtain completed
survey questionnaires.
As a result, 67 (about 45percent) responses were received in total, of which 50 (75
percent) were obtained through in-person interviews, 10 (15 percent) via phone calls and seven
(about 10 percent) by emails. The completed questionnaires received were from 11 industries
including: telecommunications, power sector, transport (roadways, railways, seaports and
aviation), legal adviser project financing, project finance and transaction advisory services,
banking sector, investment companies, sector experts/principal facilitator and coordinator for
PPP in Pakistan, engineering consulting firms, construction companies (roads, bridges, canals
and buildings) and regulators, facilitator of the stock exchange. Finally, industries directly
involved and most relevant to implementing PPP in Pakistan were selected from the 67 overall
responses. Therefore, a short-list of 40 relevant questionnaires from three industries
(telecommunications, power sector, transport) was selected for analysis. Responses from 27
participants were not included in the analysis as these were not directly involved in PPP and
developing infrastructure facilities. This resulted in the small sample size of the analysed
questionnaire. A flowchart of administration of survey questionnaire is provided in Figure 5.1.
5.1.3 Challenges in the initial data collection
The data collection process had some limitations, which are discussed below:
• The main reason for a low response rate from survey participants was their lack of PPP
awareness. Most people in Pakistan do not have a concept of PPP.
• The targeted participants were only public- and private-sector organisations directly
involved in providing infrastructure services and engaged in infrastructure development
in Pakistan. This means one questionnaire was sent to the head of each organisation.
• Survey participants were unwilling to participate.
• Participants did not have a research orientation due to limited exposure to research
related activities.
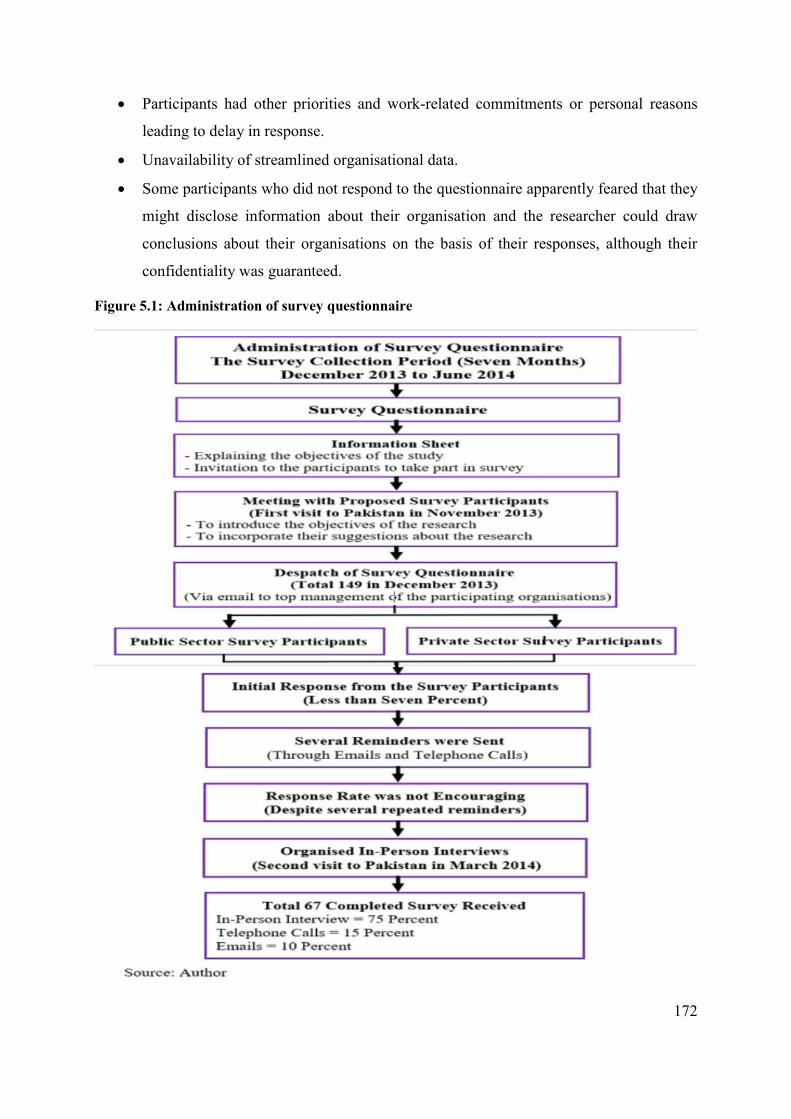
172
• Participants had other priorities and work-related commitments or personal reasons
leading to delay in response.
• Unavailability of streamlined organisational data.
• Some participants who did not respond to the questionnaire apparently feared that they
might disclose information about their organisation and the researcher could draw
conclusions about their organisations on the basis of their responses, although their
confidentiality was guaranteed.
Figure 5.1: Administration of survey questionnaire

173
5.2 Descriptive statistics and preliminary results
This section presents descriptive analysis, description of the participants including
gender, age group, qualification, work experience (years) and tenure in their current job. Sector-
wide descriptive statistics of the survey participants in terms of frequency and percentage are
presented in Table 5.1.
Table 5.1: Sector-wide detail of data collection
Sector Frequency Percentage %
Public 12 30
Private 28 70
Total 40 100
Source: Survey questionnaire
In this survey, 70 percent of respondents were from the private sector and 30 percent
from the public sector. Industry-wide details of data collection shows that more than half the
participants (55 percent) were from the transport sector. The transport sector consists of four
sub-sectors: i) railways, ii) roadways, iii) airports, and iv) seaports. Participants in the survey
from the power sector were the second largest in number (30 percent). At present, a number of
private-sector investors are involved in the power sector. The smallest number of participants
(15 percent) came from the telecommunications sector, because of the small number of private
investors in that sector. Industry-wide details of the data collection are presented in Table 5.2.
Table 5.2: Industry-wide detail of data collection
Sector Frequency Percentage %
Telecommunication 6 15 Power 12 30 Transport 22 55
Total 40 100 Source: Survey questionnaire
5.2.1 Description of the survey participants (Question set 1 and 2)
Descriptive statistics for the demographics of survey participants comprising the profile
of the participants are presented in terms of frequency and percentage in Table 5.3.

174
Table 5.3: Descriptive statistics of participants
Description Frequency Percentage % Gender: Male Female
38 2
95.0 5.0
Age group in years: ≤ 30 31-40 41-50 ≥ 51
1 4
13 22
2.5 10.0 32.5 55.0
Qualification: Intermediate Graduate Master PhD
2 8
29 1
5.0 20.0 72.5 2.5
Work Experience (years): 1-5 6-10 11-15 ≥ 16
1 3 6
30
2.5 7.5 15.0 75.0
Tenure with the current job: 1-5 6-10 11-15 ≥ 16
4 5 9
22
10.0 12.5 22.5 55.0
Source: Survey questionnaire Table 5.3 highlights the descriptive statistics of the survey participants who responded to
this study. As mentioned earlier, to obtain authentic feedback and reliable data from survey
participants, chief executive officers and the top position holders of the organisations were
approached. Descriptive statistics for the demographics of survey participants indicates the
following profile:
• Gender – because of the culture of the society, male participation was 95 percent, while
female participation was 5 percent.
• Age group – the participants below or equal to 30 years were the smallest number (2.5
percent), participants aged between 31-40 years were the second smallest group (10
percent) and participants aged between 40-50 years were the second largest group (32.5
percent). In contrast, participants older than 51 years were the largest group (55 percent).
As the targeted survey participants were the heads of organisations, 87.5 percent of
participants were aged 40 or over.

175
• Qualifications – most participants held masters degrees (72.5 percent), some held
graduation degrees (20 percent) and intermediate degrees (5 percent). Only 2.50 percent
of participants held PhD degrees.
• Work experience – 75 percent of participants had work experience of 16 years or more,
followed by those who had work experience of 11-15 years (15 percent). Participants
had worked for 1-5 years were the lowest in number (2.5 percent).
• Tenure with current job – more than half of the survey participants (55 percent) had
been working in the current job/organisation for 16 years or more while 22.5 percent of
participants had worked in their current job/organisation from 11-15 years. In other
words, 77.5 percent of survey participants had been working in their current
job/organisation for 10 years or more. Participants who had worked for their current
job/organisation from 1-5 years were the smallest group (10 percent).
5.2.2 The importance of infrastructure (Question set 3-A)
The purpose of the question about “importance of infrastructure” was to assess whether
improved and better infrastructure could help organisations to reduce their costs, improves their
productivities, business opportunities and increase their revenues, as well as helping Pakistan
to achieve higher economic growth. The responses of the survey participants are interpreted on
the basis of mean, median and mode. Each question was measured by their maturity level (from
lowest level to highest level) on a Likert 5-point scale. The question comprised the following
two sub-questions:
i. Infrastructure and performance of your [participant’s] organisation. To attain detailed
statistics about the impact of better and improved infrastructure on the organisations,
the question had nine sub-questions. The industry-wide responses of the survey
participants are presented in Table 5.4.
ii. Infrastructure and the economic growth of Pakistan. To evaluate the effects of better and
improved infrastructure on the economy of Pakistan the question contained six sub-
questions. The industry-wide responses of survey participants are shown in Table 5.5.
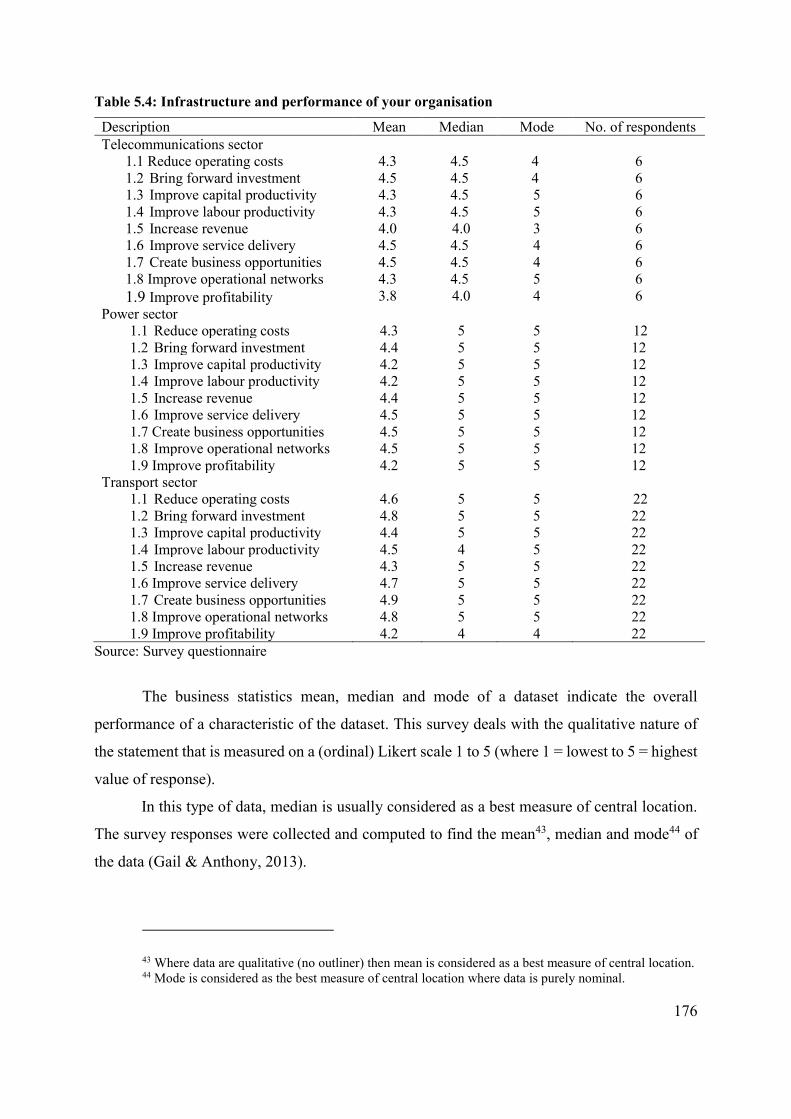
176
Table 5.4: Infrastructure and performance of your organisation
Description Mean Median Mode No. of respondents Telecommunications sector
1.1 Reduce operating costs 4.3 4.5 4 6 1.2 Bring forward investment 4.5 4.5 4 6 1.3 Improve capital productivity 4.3 4.5 5 6 1.4 Improve labour productivity 4.3 4.5 5 6 1.5 Increase revenue 4.0 4.0 3 6 1.6 Improve service delivery 4.5 4.5 4 6 1.7 Create business opportunities 4.5 4.5 4 6 1.8 Improve operational networks 4.3 4.5 5 6 1.9 Improve profitability 3.8 4.0 4 6
Power sector 1.1 Reduce operating costs 4.3 5 5 12 1.2 Bring forward investment 4.4 5 5 12 1.3 Improve capital productivity 4.2 5 5 12 1.4 Improve labour productivity 4.2 5 5 12 1.5 Increase revenue 4.4 5 5 12 1.6 Improve service delivery 4.5 5 5 12 1.7 Create business opportunities 4.5 5 5 12 1.8 Improve operational networks 4.5 5 5 12 1.9 Improve profitability 4.2 5 5 12
Transport sector 1.1 Reduce operating costs 4.6 5 5 22 1.2 Bring forward investment 4.8 5 5 22 1.3 Improve capital productivity 4.4 5 5 22 1.4 Improve labour productivity 4.5 4 5 22 1.5 Increase revenue 4.3 5 5 22 1.6 Improve service delivery 4.7 5 5 22 1.7 Create business opportunities 4.9 5 5 22 1.8 Improve operational networks 4.8 5 5 22 1.9 Improve profitability 4.2 4 4 22
Source: Survey questionnaire
The business statistics mean, median and mode of a dataset indicate the overall
performance of a characteristic of the dataset. This survey deals with the qualitative nature of
the statement that is measured on a (ordinal) Likert scale 1 to 5 (where 1 = lowest to 5 = highest
value of response).
In this type of data, median is usually considered as a best measure of central location.
The survey responses were collected and computed to find the mean43, median and mode44 of
the data (Gail & Anthony, 2013).
43 Where data are qualitative (no outliner) then mean is considered as a best measure of central location. 44 Mode is considered as the best measure of central location where data is purely nominal.

177
For the telecommunications, power and transport sectors, the median response to each
of the set of questions slightly varies from question to question which indicates each of the
questions has a high median value that supports the need for infrastructure development in
Pakistan. These results indicate that improvement in infrastructure increases investment,
improves service delivery, operational networks and creates business opportunities in the
telecommunications, power and transport sectors.
The results show that the survey participants believed that improved and better
infrastructure could help their organisations to reduce costs, improve productivities, service
delivery and operational networks, and increase business opportunities and revenues.
5.2.3 Infrastructure and the economic growth of Pakistan (Question set 3-B)
Industry-wide survey results on the question of whether infrastructure development has
an impact on economic growth in Pakistan are presented in Table 5.5.
Table 5.5: Infrastructure and the economic growth of Pakistan
Description Mean Median Mode No. of respondents Telecommunications sector
1.1 Create employment opportunities 4.7 5.0 5 6 1.2 Increase public revenue 3.8 4.0 4 6 1.3 Increase market size 4.5 4.5 4 6 1.4 Increase public capital stocks 4.5 4.5 4 6 1.5 Increase productivity 4.5 4.5 5 6 1.6 Improve people’s standard of living 4.2 4.0 4 6
Power sector 1.1 Create employment opportunities 4.3 5 5 12 1.2 Increase public revenue 4.8 4 5 12 1.3 Increase market size 4.5 5 5 12 1.4 Increase public capital stocks 4.5 5 5 12 1.5 Increase productivity 4.3 5 5 12 1.6 Improve people’s standard of living 4.3 5 5 12
Transport sector 1.1 Create employment opportunities 4.7 5 5 22 1.2 Increase public revenue 3.7 3 3 22 1.3 Increase market size 4.4 5 5 22 1.4 Increase public capital stocks 4.9 5 5 22 1.5 Increase productivity 3.8 4 3 22 1.6 Improve people’s standard of living 3.7 4 3 22
Source: Survey questionnaire
The median response to each of the set of questions for telecommunications, power and
transport sectors varies slightly from question to question which indicates each of the questions

178
has a high median value. The high median value indicates that upgraded infrastructure has a
positive impact on economic activities in Pakistan.
Preliminary results suggest that improved and better infrastructure creates employment
opportunities, increases public revenue, market size, public capital stocks, productivity and
improves people’s living standards and contributes to achieve higher economic growth in
Pakistan.
5.2.4 Private sector investment and the performance of public organisations
The question relating to the impact of private investment on the public sector
organisations was asked to the public sector organisations only. Results of the survey
participants’ responses are presented in Table 5.6.
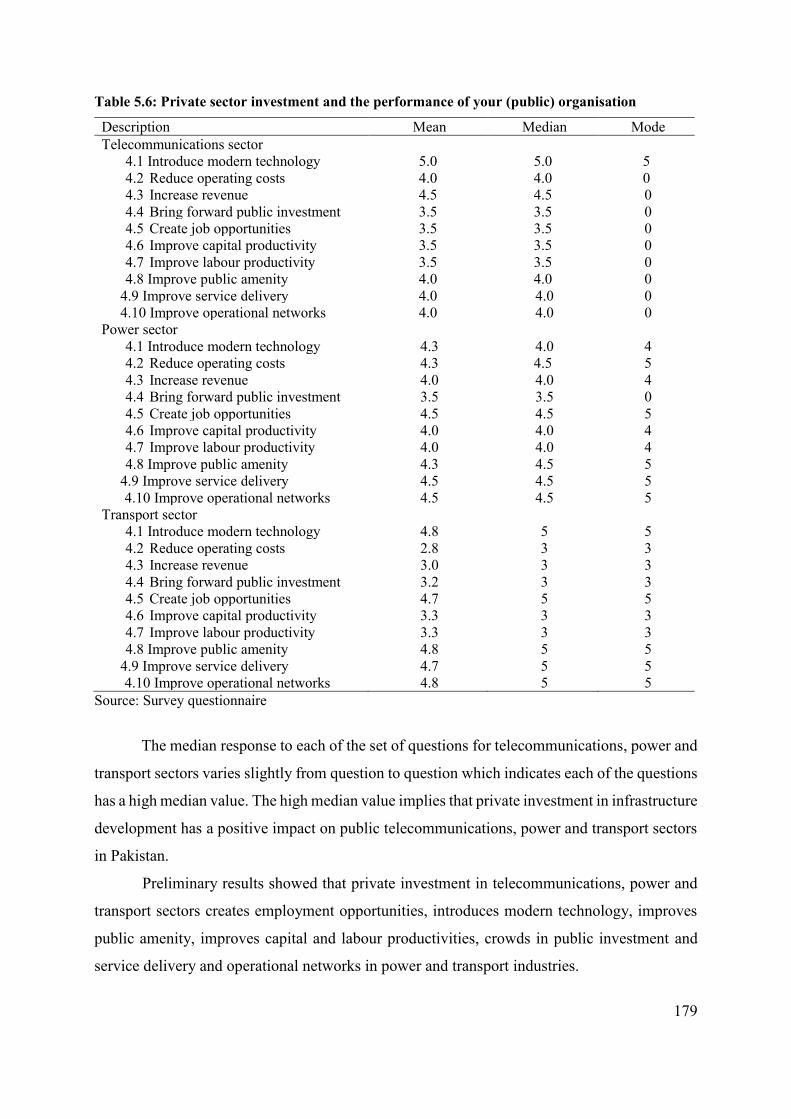
179
Table 5.6: Private sector investment and the performance of your (public) organisation
Description Mean Median Mode Telecommunications sector
4.1 Introduce modern technology 5.0 5.0 5 4.2 Reduce operating costs 4.0 4.0 0 4.3 Increase revenue 4.5 4.5 0 4.4 Bring forward public investment 3.5 3.5 0 4.5 Create job opportunities 3.5 3.5 0 4.6 Improve capital productivity 3.5 3.5 0 4.7 Improve labour productivity 3.5 3.5 0 4.8 Improve public amenity 4.0 4.0 0
4.9 Improve service delivery 4.0 4.0 0 4.10 Improve operational networks 4.0 4.0 0
Power sector 4.1 Introduce modern technology 4.3 4.0 4 4.2 Reduce operating costs 4.3 4.5 5 4.3 Increase revenue 4.0 4.0 4 4.4 Bring forward public investment 3.5 3.5 0 4.5 Create job opportunities 4.5 4.5 5 4.6 Improve capital productivity 4.0 4.0 4 4.7 Improve labour productivity 4.0 4.0 4 4.8 Improve public amenity 4.3 4.5 5
4.9 Improve service delivery 4.5 4.5 5 4.10 Improve operational networks 4.5 4.5 5
Transport sector 4.1 Introduce modern technology 4.8 5 5 4.2 Reduce operating costs 2.8 3 3 4.3 Increase revenue 3.0 3 3 4.4 Bring forward public investment 3.2 3 3 4.5 Create job opportunities 4.7 5 5 4.6 Improve capital productivity 3.3 3 3 4.7 Improve labour productivity 3.3 3 3 4.8 Improve public amenity 4.8 5 5
4.9 Improve service delivery 4.7 5 5 4.10 Improve operational networks 4.8 5 5
Source: Survey questionnaire
The median response to each of the set of questions for telecommunications, power and
transport sectors varies slightly from question to question which indicates each of the questions
has a high median value. The high median value implies that private investment in infrastructure
development has a positive impact on public telecommunications, power and transport sectors
in Pakistan.
Preliminary results showed that private investment in telecommunications, power and
transport sectors creates employment opportunities, introduces modern technology, improves
public amenity, improves capital and labour productivities, crowds in public investment and
service delivery and operational networks in power and transport industries.

180
5.2.5 Public sector capacity to manage PPP programs in Pakistan
The responses of the survey participants to questions about public sector capacity to
manage PPP programs in Pakistan for the period 1991-2014 appear in Table 5.7 and in Figure
5.1. Results of the survey data are presented in Table 5.8. The survey responses were
standardised to take care of variability in the responses for long time period survey.
Table 5.7: Public sector capacity to manage PPP program in Pakistan
Year Telecom Power Transport 1991 1.4 2.2 0.4 1992 1.4 2.2 0.4 1993 1.4 2.2 0.4 1994 1.4 2.2 0.4 1995 1.4 2.2 0.4 1996 1.4 2.2 1.2 1997 1.6 2.2 2.4 1998 1.4 0.8 2.8 1999 1.6 0.8 0.4 2000 1.6 1.0 0.4 2001 2.2 1.0 0.4 2002 2.2 1.0 0.6 2003 2.0 3.0 0.8 2004 2.0 3.0 0.8 2005 2.4 3.0 1.8 2006 2.0 2.2 2.0 2007 2.0 2.0 2.6 2008 1.6 2.0 2.6 2009 1.4 1.8 1.8 2010 1.4 1.8 2.0 2011 1.4 1.8 2.0 2012 1.4 1.8 2.0 2013 1.4 1.8 2.0 2014 1.4 1.8 2.0
Source: Survey questionnaire
The above table indicates yearly public-sector capacity of telecoms, power and transport
sectors for managing PPP programs in Pakistan. The score is measured on a (ordinal) Likert
scale 1 to 5 (where 1 = lowest to 5 = highest value of response).

181
Figure 5.2: Public sector capacity to manage PPP program in Pakistan
Source: Survey questionnaire
Figure 5.1 illustrates that there was high variation in public-sector capacity to manage
PPP programs during 1996-2007. After 2008 the capacity level was steady but do not able to
manage PPP program effectively. These results indicate that the top management of public
telecommunications, power and transport sectors are aware of PPP benefits but do not have
managerial, financial and monitoring capacity to implement a PPP program.
Table 5.8: Public sector capacity to manage PPP programs in Pakistan
Description Mean Median Mode Telecommunications
1.6 1.4 1.4 Power
1.9 2.0 2.2
Transport 1.4 1.5 0.4
Source: Survey questionnaire
Results shown in Table 5.8 indicate that the chief executives of organisations in
telecommunications, power and transport sectors are aware of PPP benefits but have limited
expertise and PPP-related experience, and limited managerial and financial capacity to
implement PPP projects, as well as no project monitoring mechanisms and support for PPP
programs.
The results will be further confirmed by economic analysis in Chapter Six.
0.0
1.0
2.0
3.0Ye
ar1
99
1
19
92
19
93
19
94
19
95
19
96
19
97
19
98
19
99
20
00
20
01
20
02
20
03
20
04
20
05
20
06
20
07
20
08
20
09
20
10
20
11
20
12
20
13
20
14
Sco
re
Period
Public sector capacity
Telecom Power Transport
Telecoms Power Transport
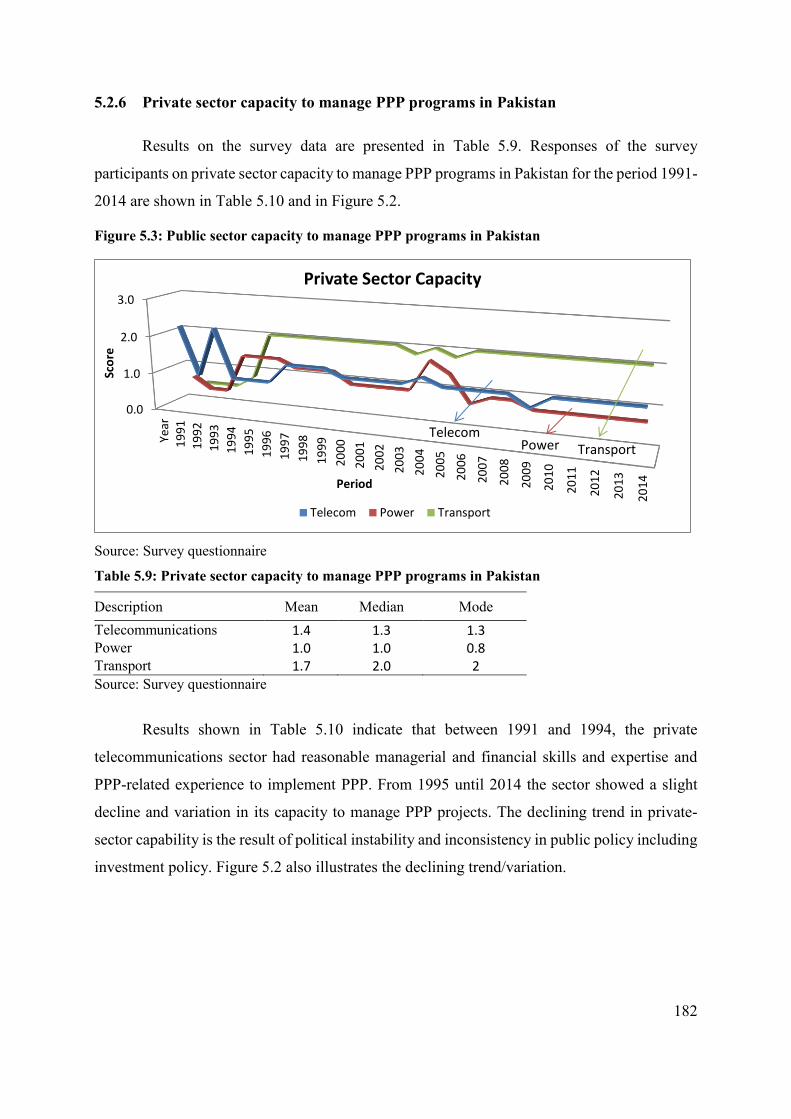
182
5.2.6 Private sector capacity to manage PPP programs in Pakistan
Results on the survey data are presented in Table 5.9. Responses of the survey
participants on private sector capacity to manage PPP programs in Pakistan for the period 1991-
2014 are shown in Table 5.10 and in Figure 5.2.
Figure 5.3: Public sector capacity to manage PPP programs in Pakistan
Source: Survey questionnaire
Table 5.9: Private sector capacity to manage PPP programs in Pakistan
Description Mean Median Mode Telecommunications 1.4 1.3 1.3 Power 1.0 1.0 0.8 Transport 1.7 2.0 2 Source: Survey questionnaire
Results shown in Table 5.10 indicate that between 1991 and 1994, the private
telecommunications sector had reasonable managerial and financial skills and expertise and
PPP-related experience to implement PPP. From 1995 until 2014 the sector showed a slight
decline and variation in its capacity to manage PPP projects. The declining trend in private-
sector capability is the result of political instability and inconsistency in public policy including
investment policy. Figure 5.2 also illustrates the declining trend/variation.
0.0
1.0
2.0
3.0
Year
19
91
19
92
19
93
19
94
19
95
19
96
19
97
19
98
19
99
20
00
20
01
20
02
20
03
20
04
20
05
20
06
20
07
20
08
20
09
20
10
20
11
20
12
20
13
20
14
Sco
re
Period
Private Sector Capacity
Telecom Power Transport
TelecomPower Transport

183
Table 5.10: Private sector capacity to manage PPP programs in Pakistan
Year Telecoms Power Transport 1991 2.3 0.8 0.5 1992 1.0 0.5 0.5 1993 2.3 0.5 0.5 1994 1.0 1.5 0.8 1995 1.0 1.5 2.0 1996 1.0 1.5 2.0 1997 1.5 1.3 2.0 1998 1.5 1.3 2.0 1999 1.5 1.3 2.0 2000 1.3 1.0 2.0 2001 1.3 1.0 2.0 2002 1.3 1.0 2.0 2003 1.3 1.0 1.8 2004 1.5 1.8 2.0 2005 1.3 1.5 1.8 2006 1.3 0.8 2.0 2007 1.3 1.0 2.0 2008 1.3 1.0 2.0 2009 1.0 0.8 2.0 2010 1.3 0.8 2.0 2011 1.3 0.8 2.0 2012 1.3 0.8 2.0 2013 1.3 0.8 2.0 2014 1.3 0.8 2.0
Source: Survey questionnaire
The above table indicates yearly private sector capacity of telecoms, power and
transport sectors for managing PPP programs in Pakistan. The score is measured on a (ordinal)
Likert scale ranges 1 to 5.
The private power sector did not have PPP-related expertise and experience and
financial and managerial skills from 1991 to 1993. From 1994, the sector slightly developed its
capacity but still did not have the financial capacity, the ability to identify project/sector related
problems or the means to address them. However, it has limited managerial capacity.
The private transport sector did not have PPP experience, expertise or the financial and
managerial capacity to operate and maintain PPP projects during 1991-1994. From 1995, the
sector began to develop its expertise and managerial and financial skills to manage PPP
programs. However, the private sector had neither the ability to identify the right project/ sector-
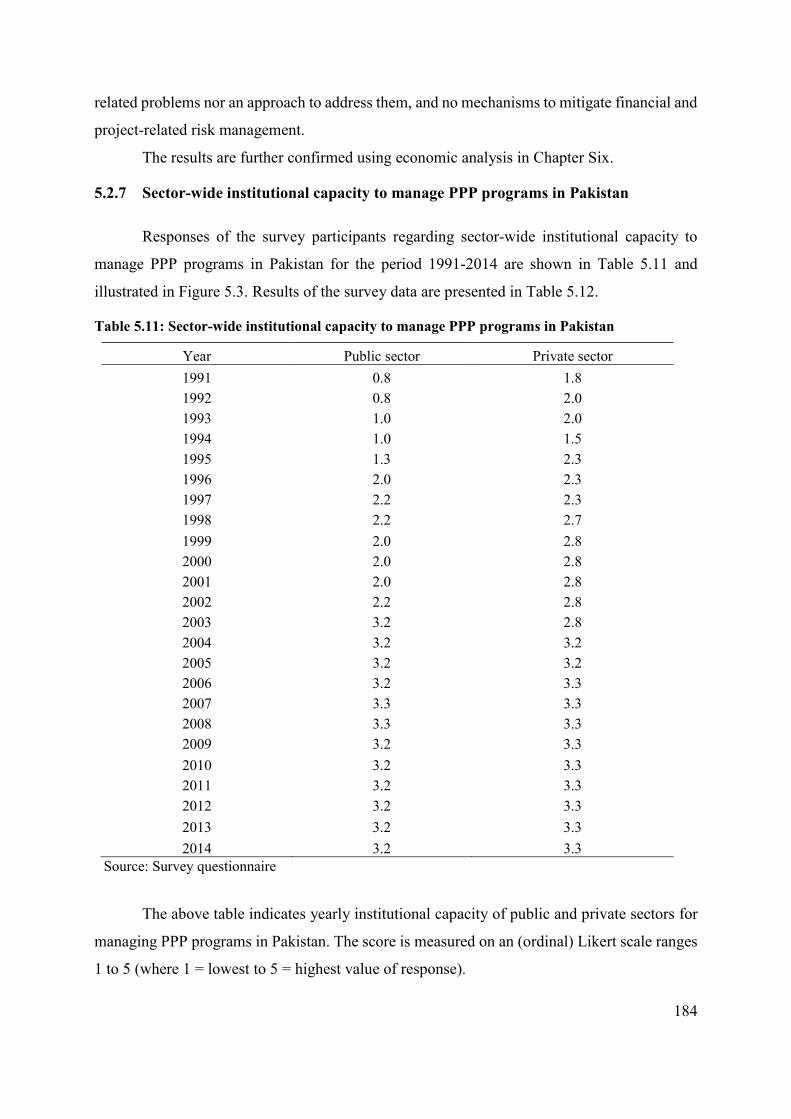
184
related problems nor an approach to address them, and no mechanisms to mitigate financial and
project-related risk management.
The results are further confirmed using economic analysis in Chapter Six.
5.2.7 Sector-wide institutional capacity to manage PPP programs in Pakistan
Responses of the survey participants regarding sector-wide institutional capacity to
manage PPP programs in Pakistan for the period 1991-2014 are shown in Table 5.11 and
illustrated in Figure 5.3. Results of the survey data are presented in Table 5.12.
Table 5.11: Sector-wide institutional capacity to manage PPP programs in Pakistan
Year Public sector Private sector 1991 0.8 1.8 1992 0.8 2.0 1993 1.0 2.0 1994 1.0 1.5 1995 1.3 2.3 1996 2.0 2.3 1997 2.2 2.3 1998 2.2 2.7 1999 2.0 2.8 2000 2.0 2.8 2001 2.0 2.8 2002 2.2 2.8 2003 3.2 2.8 2004 3.2 3.2 2005 3.2 3.2 2006 3.2 3.3 2007 3.3 3.3 2008 3.3 3.3 2009 3.2 3.3 2010 3.2 3.3 2011 3.2 3.3 2012 3.2 3.3 2013 3.2 3.3 2014 3.2 3.3
Source: Survey questionnaire
The above table indicates yearly institutional capacity of public and private sectors for
managing PPP programs in Pakistan. The score is measured on an (ordinal) Likert scale ranges
1 to 5 (where 1 = lowest to 5 = highest value of response).

185
Table 5.12: Sector-wide institutional capacity to manage PPP programs in Pakistan
Description Mean Median Mode Public sector 2.4 2.7 3.2 Private sector 2.8 2.8 2.8 Source: Survey questionnaire
Figure 5.4: Sector-wide institutional capacity to manage PPP programs in Pakistan
Source: Survey questionnaire
The responses of survey participants regarding sector-wise institutional capacity to
manage PPP programs in Pakistan indicate that in 1991 this capacity was at its lowest level.
However, capacity increased gradually over time and was at its highest level in 2014. Responses
of both sectors show that since 2000, institutions have been able to participate in transparent
procurement bidding processes, are familiar with dispute-resolution mechanisms, and have
opportunities for private-sector participation to develop infrastructure.
However, project monitoring systems at an institutional level are ineffective, their
negotiation processes poor, their arbitration period lengthy and complex, their rules, regulations
and procedures to involve the private sector in infrastructure development ambiguous, domestic
capital markets develop too gradually and risk-hedging instruments are still not robust enough.
In short, both public and the private sectors suggested that institutions did not have the capacity
to implement successful PPP programs and needed improvements.
0.0
1.0
2.0
3.0
4.0
19
91
19
92
19
93
19
94
19
95
19
96
19
97
19
98
19
99
20
00
20
01
20
02
20
03
20
04
20
05
20
06
20
07
20
08
20
09
20
10
20
11
20
12
20
13
20
14
Sco
re
Period
Sector-wide institutional capacity
Public sector Private sector
Public sector Private sector

186
5.2.8 Industry-wide institutional capacity to manage PPP programs in Pakistan
The responses of the survey participants to the industry-wide (telecoms, power and
transport) institutional capacity to manage PPP programs in Pakistan for the period 1991-2014
are shown in Table 5.13. Results of the survey data are presented in Table 5.14 and illustrated
in Figure 5.4.
Table 5.13: Industry-wide institutional capacity to manage PPP programs in Pakistan
Year Telecoms Power Transport 1991 1.3 2.8 1.0 1992 1.5 1.0 1.0 1993 1.5 1.0 1.3 1994 1.0 0.8 1.0 1995 1.0 1.2 2.0 1996 1.2 1.3 2.7 1997 1.2 1.3 2.7 1998 1.3 1.3 2.7 1999 2.5 1.3 2.2 2000 2.5 1.5 2.0 2001 2.7 1.7 2.0 2002 2.7 1.5 1.8 2003 2.7 2.7 2.3 2004 3.0 2.7 2.3 2005 3.0 2.7 2.5 2006 3.0 2.7 2.8 2007 3.0 2.5 2.8 2008 3.2 2.5 2.8 2009 3.0 2.5 2.8 2010 3.0 2.5 2.8 2011 3.0 2.5 2.8 2012 3.0 2.5 2.8 2013 3.0 2.5 2.8 2014 3.0 2.5 2.8
Source: Survey questionnaire
The above table indicates yearly institutional capacity of telecoms, power and transport
sectors for managing PPP program in Pakistan. The score is measured on a (ordinal) Likert
scale 1 to 5 (where 1 = lowest to 5 = highest value of response).
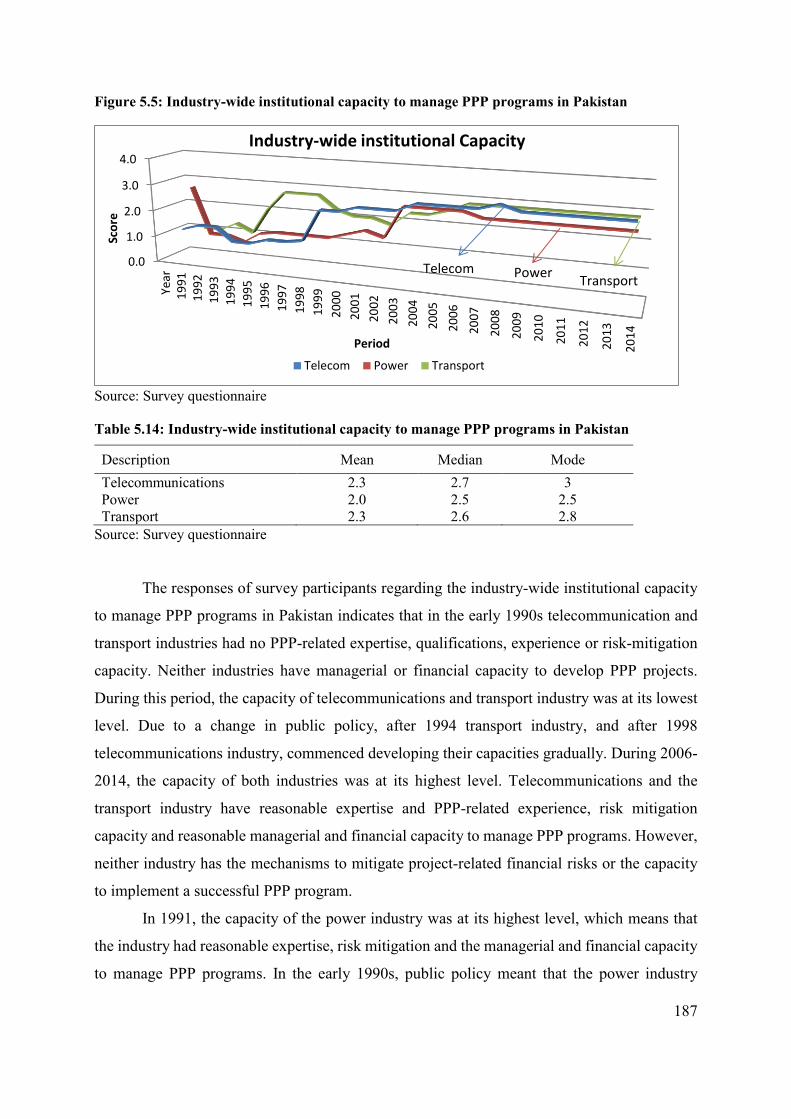
187
Figure 5.5: Industry-wide institutional capacity to manage PPP programs in Pakistan
Source: Survey questionnaire
Table 5.14: Industry-wide institutional capacity to manage PPP programs in Pakistan
Description Mean Median Mode Telecommunications 2.3 2.7 3 Power 2.0 2.5 2.5 Transport 2.3 2.6 2.8
Source: Survey questionnaire
The responses of survey participants regarding the industry-wide institutional capacity
to manage PPP programs in Pakistan indicates that in the early 1990s telecommunication and
transport industries had no PPP-related expertise, qualifications, experience or risk-mitigation
capacity. Neither industries have managerial or financial capacity to develop PPP projects.
During this period, the capacity of telecommunications and transport industry was at its lowest
level. Due to a change in public policy, after 1994 transport industry, and after 1998
telecommunications industry, commenced developing their capacities gradually. During 2006-
2014, the capacity of both industries was at its highest level. Telecommunications and the
transport industry have reasonable expertise and PPP-related experience, risk mitigation
capacity and reasonable managerial and financial capacity to manage PPP programs. However,
neither industry has the mechanisms to mitigate project-related financial risks or the capacity
to implement a successful PPP program.
In 1991, the capacity of the power industry was at its highest level, which means that
the industry had reasonable expertise, risk mitigation and the managerial and financial capacity
to manage PPP programs. In the early 1990s, public policy meant that the power industry
0.0
1.0
2.0
3.0
4.0Ye
ar1
99
11
99
21
99
3
19
94
19
95
19
96
19
97
19
98
19
99
20
00
20
01
20
02
20
03
20
04
20
05
20
06
20
07
20
08
20
09
20
10
20
11
20
12
20
13
20
14
Sco
re
Period
Industry-wide institutional Capacity
Telecom Power Transport
Telecom PowerTransport

188
developed few projects with private-sector participation. However, the industry could not
maintain its peak level of expertise and decreased to its lowest level during 1992-1995 due to
political instability (dismissal of two political governments on grounds of corruption without
completion of their tenure) and inconsistency of public policies. After 1996, the capacity of the
industry began improving gradually. However, until 2014 the power industry did not have the
capacity to implement a successful PPP program.
Preliminary results indicate that the telecommunications, power and transport industries
do not have the capacity to manage PPP programs in Pakistan effectively.
5.2.9 Sector-wide availability of guidance materials
Results based on responses from the survey participants on sector-wide availability of
PPP guidance material to implement PPP programs in the telecommunications, power and
transort industries for the period 1991-2014 are presented in Table 5.15 and graphically
presented in Figure 5.5.
Table 5.15: Industry-wide availability of guidance materials
Description Telecoms Power Transport
Yes % No % Yes % No % Yes % No % PPP standard documents/ sector-specific guidance 66.7 33.3 91.7 8.3 31.8 68.2 PPP standard model contracts 50.0 50.0 75.0 25.0 18.2 81.8 PPP project preparation guidelines 83.3 16.7 91.7 8.3 36.4 63.6 Source: Survey questionnaire
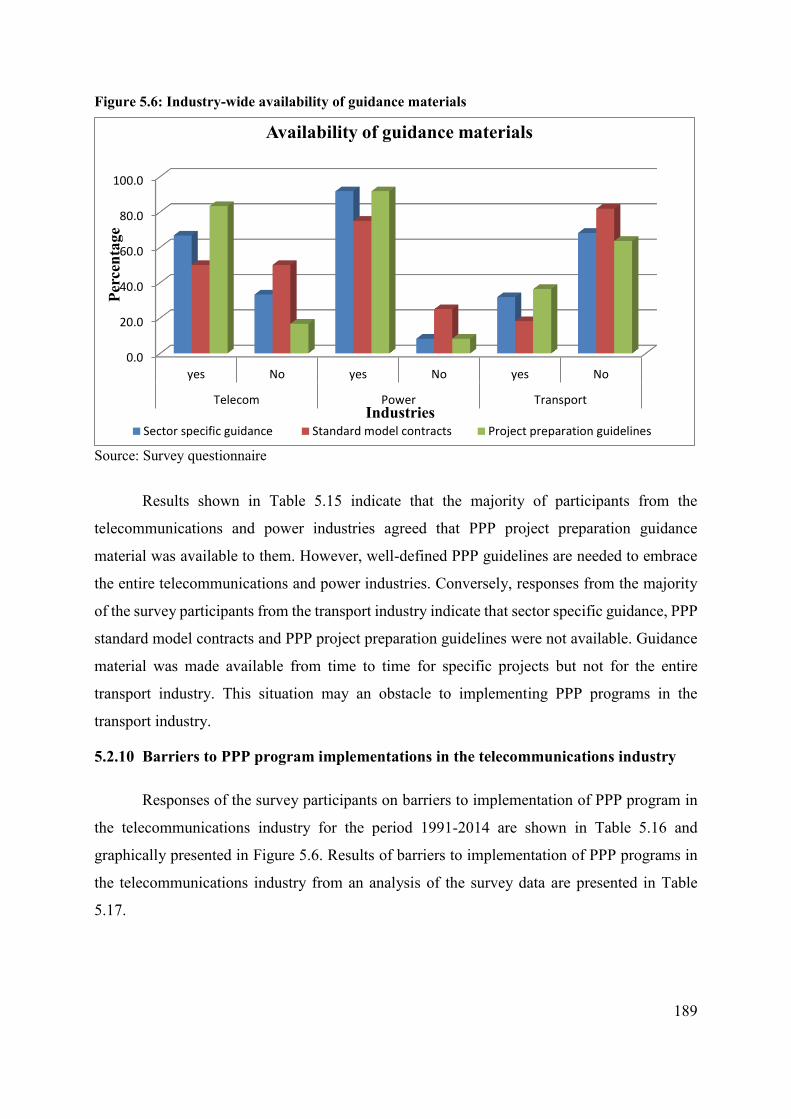
189
Figure 5.6: Industry-wide availability of guidance materials
Source: Survey questionnaire
Results shown in Table 5.15 indicate that the majority of participants from the
telecommunications and power industries agreed that PPP project preparation guidance
material was available to them. However, well-defined PPP guidelines are needed to embrace
the entire telecommunications and power industries. Conversely, responses from the majority
of the survey participants from the transport industry indicate that sector specific guidance, PPP
standard model contracts and PPP project preparation guidelines were not available. Guidance
material was made available from time to time for specific projects but not for the entire
transport industry. This situation may an obstacle to implementing PPP programs in the
transport industry.
5.2.10 Barriers to PPP program implementations in the telecommunications industry
Responses of the survey participants on barriers to implementation of PPP program in
the telecommunications industry for the period 1991-2014 are shown in Table 5.16 and
graphically presented in Figure 5.6. Results of barriers to implementation of PPP programs in
the telecommunications industry from an analysis of the survey data are presented in Table
5.17.
0.0
20.0
40.0
60.0
80.0
100.0
yes No yes No yes No
Telecom Power Transport
Perc
enta
ge
Industries
Availability of guidance materials
Sector specific guidance Standard model contracts Project preparation guidelines
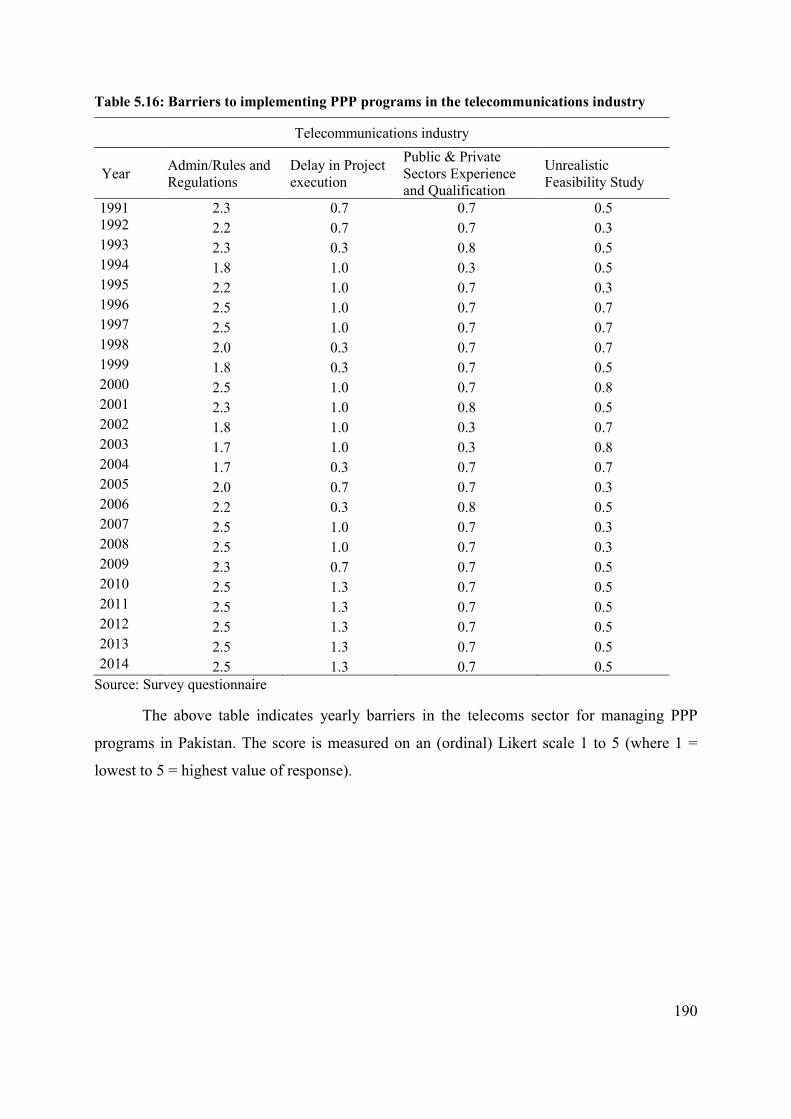
190
Table 5.16: Barriers to implementing PPP programs in the telecommunications industry
Telecommunications industry
Year Admin/Rules and Regulations
Delay in Project execution
Public & Private Sectors Experience and Qualification
Unrealistic Feasibility Study
1991 2.3 0.7 0.7 0.5 1992 2.2 0.7 0.7 0.3 1993 2.3 0.3 0.8 0.5 1994 1.8 1.0 0.3 0.5 1995 2.2 1.0 0.7 0.3 1996 2.5 1.0 0.7 0.7 1997 2.5 1.0 0.7 0.7 1998 2.0 0.3 0.7 0.7 1999 1.8 0.3 0.7 0.5 2000 2.5 1.0 0.7 0.8 2001 2.3 1.0 0.8 0.5 2002 1.8 1.0 0.3 0.7 2003 1.7 1.0 0.3 0.8 2004 1.7 0.3 0.7 0.7 2005 2.0 0.7 0.7 0.3 2006 2.2 0.3 0.8 0.5 2007 2.5 1.0 0.7 0.3 2008 2.5 1.0 0.7 0.3 2009 2.3 0.7 0.7 0.5 2010 2.5 1.3 0.7 0.5 2011 2.5 1.3 0.7 0.5 2012 2.5 1.3 0.7 0.5 2013 2.5 1.3 0.7 0.5 2014 2.5 1.3 0.7 0.5
Source: Survey questionnaire
The above table indicates yearly barriers in the telecoms sector for managing PPP
programs in Pakistan. The score is measured on an (ordinal) Likert scale 1 to 5 (where 1 =
lowest to 5 = highest value of response).

191
Figure 5.7: Barriers to implementing PPP programs in the telecommunications industry
Source: Survey questionnaire Table 5.17: Barriers to implementing PPP program in telecommunications industry
Description Mean Median Mode Barrier-1: Admin/Rules & Regulations 4.8 5 5 Barrier-2: Delay in project execution 4.4 4 4 Barrier-3: Public and private sectors experience and qualification 5.0 5 5 Barrier-4: Unrealistic feasibility study 4.9 5 5
Source: Survey questionnaire
In the telecommunications industry barrier 1, administrative and rules and regulations
barriers, was at its highest level during 1991-1997. There was variation/a slightly diminishing
trend in barrier 1 during 1998-2004. The level of barrier 1 again rose to the highest level during
2003-2012. However, the trend finally turned down after 2012. Administrative formalities and
rules and regulations are barriers to the implementation of PPP in the telecommunications
industry.
Barrier 2, delays in project execution, was at its lowest level during 1991-1993. During
1994-1997 and 2009-2013 the barrier was at its highest level. There was variation/a slightly
diminishing trend in barrier 2 during 1998-2008. The trend finally declined after 2013 but it
remains an obstacle in PPP implementation in the telecommunications industry.
Barrier 3, public and private sector’s experience and qualification, was at its highest
level from 1991-2013 and was a barrier to implementing PPP programs. Barrier 4, unrealistic
0
1
2
3
4
51
99
1
19
92
19
93
19
94
19
95
19
96
19
97
19
98
19
99
20
00
20
01
20
02
20
03
20
04
20
05
20
06
20
07
20
08
20
09
20
10
20
11
20
12
20
13
20
14
Period
Sco
re
Telecommunication industry
Telecom Bar_1 Telecom Bar_2 Telecom Bar_3 Telecom Bar_4
Barrier-1 Barrier-2Barrier-3 Barrier-4
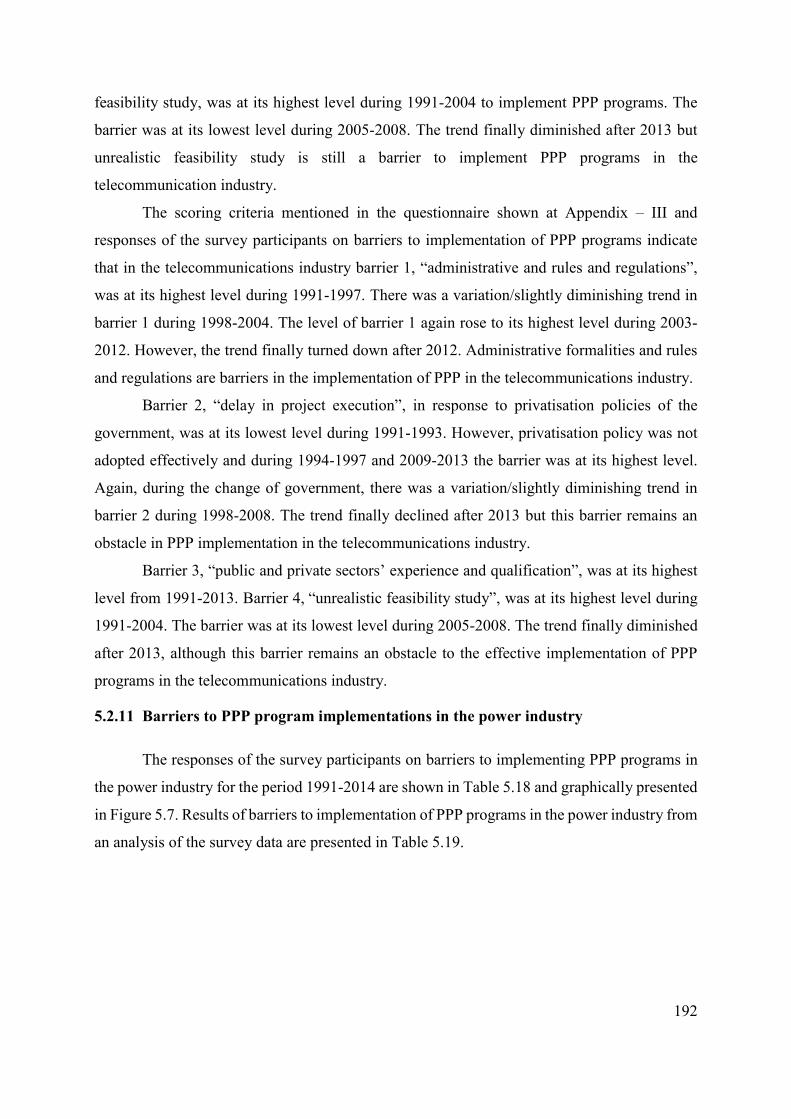
192
feasibility study, was at its highest level during 1991-2004 to implement PPP programs. The
barrier was at its lowest level during 2005-2008. The trend finally diminished after 2013 but
unrealistic feasibility study is still a barrier to implement PPP programs in the
telecommunication industry.
The scoring criteria mentioned in the questionnaire shown at Appendix – III and
responses of the survey participants on barriers to implementation of PPP programs indicate
that in the telecommunications industry barrier 1, “administrative and rules and regulations”,
was at its highest level during 1991-1997. There was a variation/slightly diminishing trend in
barrier 1 during 1998-2004. The level of barrier 1 again rose to its highest level during 2003-
2012. However, the trend finally turned down after 2012. Administrative formalities and rules
and regulations are barriers in the implementation of PPP in the telecommunications industry.
Barrier 2, “delay in project execution”, in response to privatisation policies of the
government, was at its lowest level during 1991-1993. However, privatisation policy was not
adopted effectively and during 1994-1997 and 2009-2013 the barrier was at its highest level.
Again, during the change of government, there was a variation/slightly diminishing trend in
barrier 2 during 1998-2008. The trend finally declined after 2013 but this barrier remains an
obstacle in PPP implementation in the telecommunications industry.
Barrier 3, “public and private sectors’ experience and qualification”, was at its highest
level from 1991-2013. Barrier 4, “unrealistic feasibility study”, was at its highest level during
1991-2004. The barrier was at its lowest level during 2005-2008. The trend finally diminished
after 2013, although this barrier remains an obstacle to the effective implementation of PPP
programs in the telecommunications industry.
5.2.11 Barriers to PPP program implementations in the power industry
The responses of the survey participants on barriers to implementing PPP programs in
the power industry for the period 1991-2014 are shown in Table 5.18 and graphically presented
in Figure 5.7. Results of barriers to implementation of PPP programs in the power industry from
an analysis of the survey data are presented in Table 5.19.

193
Table 5.18: Barriers to implementing PPP programs in the power industry
Power industry
Year Admin/Rules and Regulations
Delay in Project execution
Public & Private Sector’s Experience and Qualification
Unrealistic Feasibility Study
1991 4.3 4.3 4.3 4.3 1992 4.1 4.0 3.8 3.8 1993 4.0 4.0 3.8 3.8 1994 4.3 4.3 4.3 4.3 1995 4.2 4.2 4.2 4.2 1996 4.3 4.3 4.3 4.3 1997 4.3 4.3 4.3 4.3 1998 3.4 2.5 3.8 4.3 1999 3.4 2.5 3.8 4.3 2000 3.5 2.6 3.8 4.3 2001 3.5 2.6 3.8 4.3 2002 3.5 2.6 3.8 4.3 2003 3.5 2.6 3.8 4.3 2004 3.6 2.5 3.9 3.7 2005 3.4 3.2 3.8 3.7 2006 3.8 3.0 4.0 3.8 2007 3.8 3.0 4.0 3.8 2008 4.0 3.6 4.3 4.3 2009 4.0 3.6 4.3 4.3 2010 4.3 4.3 4.3 4.3 2011 4.1 4.0 3.8 3.8 2012 4.0 4.0 3.8 3.8 2013 4.3 4.3 4.3 4.3 2014 4.2 4.2 4.2 4.2
Source: Survey questionnaire
The above table indicates yearly barriers in the power sector for managing PPP
programs in Pakistan. The score is measured on an (ordinal) Likert scale 1 to 5 (where 1 =
lowest to 5 = highest value of response).

194
Figure 5.8: Barriers to implementing PPP programs in the power industry
Source: Survey questionnaire Table 5.19: Barriers to implementing PPP programs in the power industry
Description Mean Median Mode Barrier-1: Admin/Rules & Regulations 4.8 5 5 Barrier-2: Delay in project execution 4.3 4.5 5 Barrier-3: Public and private sectors experience and qualification 5.0 5 5 Barrier-4: Unrealistic feasibility study 5.0 5 5
Source: Survey questionnaire
Responses from survey participants on barriers to implementing PPP programs in the
power industry indicate that barrier 1, “administrative and rules and regulations”, was at its
highest level in the power industry during 1991-1996. The barrier decreased to its lowest level
during 1997-2004. The level again rose to its highest level after 2003. However, “administrative
and rules and regulations” is a barrier to implementing successful PPP program in the power
industry.
Barrier 2, “delay in project execution”, was at its highest level during 1991-1997.
During 1998-2010 the barrier was at its lowest level. There is a variation/slightly diminishing
trend in barrier 2 during 1998-2008. However, after variation, the trend increased to its highest
level after 2009 and remains a significant barrier to implementing a successful PPP program in
the power industry.
Barrier 3, “public and private sector’s experience and qualification”, was at its highest
level from 1991-2014. Barrier 4, “unrealistic feasibility study”, was at its highest level during
1991-2003. The barrier was at its lowest level in 2004. However, the trend rose to its highest
0
2
4
61
99
11
99
2
19
93
19
94
19
95
19
96
19
97
19
98
19
99
20
00
20
01
20
02
20
03
20
04
20
05
20
06
20
07
20
08
20
09
20
10
20
11
20
12
20
13
20
14
Sco
re
Period
Power industry
Power Bar_1 Power Bar_2 Power Bar_3 Power Bar_4
Barrier-1 Barrier-2 Barrier-3 Barrier-4

195
level again after 2005 and “public and private sector’s experience and qualification” is a barrier
to implementing successful PPP programs in the power industry.
5.2.12 Barriers to PPP programs implementations in the transport industry
Responses of survey participants on barriers to implementation of PPP programs in the
transport industry for the period 1991-2014 are shown in Table 5.20 and graphically presented
in Figure 5.8. Results from analysis of the survey data are presented in Table 5.21.
Table 5.20: Barriers to implementing PPP programs in the transport industry
Transport industry
Year Admin/Rules and Regulations
Delay in Project execution
Public & Private Sector’s Experience and Qualification
Unrealistic Feasibility Study
1991 4.3 4.3 4.3 4.3 1992 4.3 4.3 4.3 4.3 1993 4.1 3.8 3.6 3.6 1994 3.6 3.6 6.1 3.6 1995 3.5 3.5 3.5 3.9 1996 4.1 3.7 3.9 4.1 1997 4.1 3.7 3.9 4.1 1998 3.6 3.6 3.6 3.6 1999 3.6 3.6 3.6 3.6 2000 3.6 3.6 3.6 3.6 2001 3.6 3.6 3.6 3.6 2002 4.2 4.1 3.8 3.8 2003 3.2 2.8 2.9 3.2 2004 3.7 2.8 3.6 3.6 2005 4.3 3.6 3.6 4.3 2006 4.1 3.6 3.9 3.6 2007 4.0 3.5 3.8 4.0 2008 4.3 3.6 3.6 3.6 2009 4.3 3.6 4.3 3.6 2010 4.3 4.3 4.3 3.6 2011 4.3 4.3 4.3 4.3 2012 4.3 4.3 4.3 4.3 2013 4.3 4.3 4.3 4.3 2014 4.3 4.3 4.3 4.3
Source: Survey questionnaire The above table indicates yearly barriers in the transport sector for managing PPP
programs in Pakistan. The score is measured on an (ordinal) Likert scale 1 to 5 (where 1 =
lowest to 5 = highest value of response).
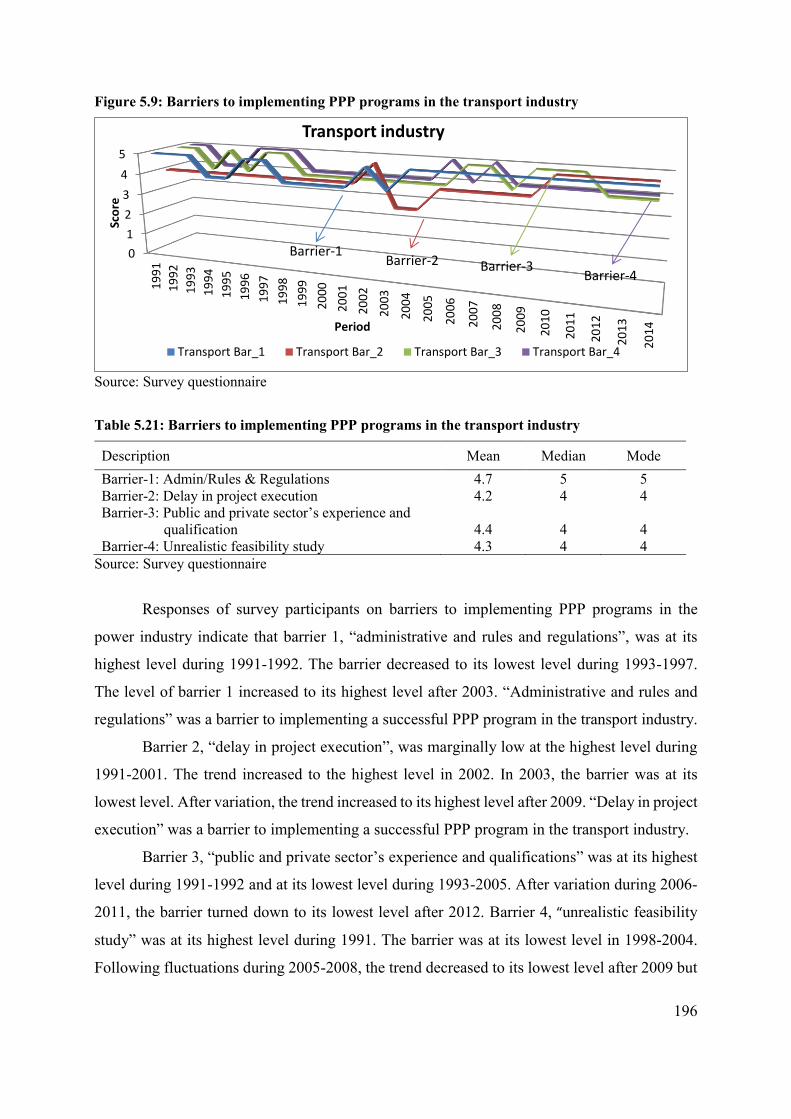
196
Figure 5.9: Barriers to implementing PPP programs in the transport industry
Source: Survey questionnaire Table 5.21: Barriers to implementing PPP programs in the transport industry
Description Mean Median Mode Barrier-1: Admin/Rules & Regulations 4.7 5 5 Barrier-2: Delay in project execution 4.2 4 4 Barrier-3: Public and private sector’s experience and qualification 4.4 4 4 Barrier-4: Unrealistic feasibility study 4.3 4 4
Source: Survey questionnaire
Responses of survey participants on barriers to implementing PPP programs in the
power industry indicate that barrier 1, “administrative and rules and regulations”, was at its
highest level during 1991-1992. The barrier decreased to its lowest level during 1993-1997.
The level of barrier 1 increased to its highest level after 2003. “Administrative and rules and
regulations” was a barrier to implementing a successful PPP program in the transport industry.
Barrier 2, “delay in project execution”, was marginally low at the highest level during
1991-2001. The trend increased to the highest level in 2002. In 2003, the barrier was at its
lowest level. After variation, the trend increased to its highest level after 2009. “Delay in project
execution” was a barrier to implementing a successful PPP program in the transport industry.
Barrier 3, “public and private sector’s experience and qualifications” was at its highest
level during 1991-1992 and at its lowest level during 1993-2005. After variation during 2006-
2011, the barrier turned down to its lowest level after 2012. Barrier 4, “unrealistic feasibility
study” was at its highest level during 1991. The barrier was at its lowest level in 1998-2004.
Following fluctuations during 2005-2008, the trend decreased to its lowest level after 2009 but
0
1
2
3
4
51
99
1
19
92
19
93
19
94
19
95
19
96
19
97
19
98
19
99
20
00
20
01
20
02
20
03
20
04
20
05
20
06
20
07
20
08
20
09
20
10
20
11
20
12
20
13
20
14
Sco
re
Period
Transport industry
Transport Bar_1 Transport Bar_2 Transport Bar_3 Transport Bar_4
Barrier-1Barrier-2 Barrier-3
Barrier-4
197
still, “unrealistic feasibility study” is a barrier to implementing successful PPP programs in the
transport industry.
5.3 Summary of the survey results
The results of the survey questionnaire showed that in 1991 Pakistani institutions did
not have the capacity to manage PPP programs but this capacity has been increasing since 1991
and was at its highest level in 2014. Several impediments still exist, such as ambiguous rules
and regulations, poor negotiation process, and financial and economic factors being disregarded
during the project procurement process. Dispute-resolution systems for PPP are undefined and
arbitration and appeals processes are lengthy and complex. Therefore, the preliminary results
suggest that institutional capacity is a barrier to implementing PPP programs in Pakistan and
this influences infrastructure investment in the country.
In early 1990s, the private sector could not play a role in infrastructure development in
Pakistan as it did not have PPP-related expertise, experience, financial or managerial skill.
However, preliminary results suggest that after the mid-1990s, the private sector began to
improve its expertise, managerial and financial skills to manage PPP programs. Nevertheless,
the sector neither has the ability to identify the right project/sector-related problems nor an
approach to address them. The sector also does not have mechanisms to mitigate financial and
project-related risk management. In Pakistan, the private sector lacks the capacity to participate
and manage PPP projects and has a barrier against taking part in public infrastructure
development.
The preliminary results indicate that the top management of the public sector is aware
of PPP benefits and the sector has an influence on PPP undertakings for infrastructure
development, but the sector is unable to attract private-sector investment due to its lack of
managerial, financial and monitoring capacity. The results also suggest that the public sector
does not have the capacity to mitigate project-related risks.
The preliminary results conclude that institutions and the private and public sectors do
not have the capacity to implement PPP programs effectively to develop infrastructure facilities
in Pakistan. The results will be further confirmed by using econometric analysis in Chapter Six.
198
Chapter Six Empirical Results and Interpretation
This chapter provides a detailed analysis of the statistical properties of the qualitative
and quantitative data used in this thesis. The chapter is organised as follows. Section 6.1 reports
the test results based on an analysis for determining the quality of the questionnaire, particularly
the suitability, reliability and internal consistency of the questionnaire by using factor analysis
and the Cronbach alpha ( ) criterion. Sector 6.2 provides data properties tested by applying
panel unit root test and panel cointegration test among the variables. Section 6.3 presents
empirical results and interpretation of the proposed estimated investment models (total
investment, private investment and public investment). Section 6.4 presents empirical results
and an interpretation of panel regression with exogenous variables which combine both
qualitative and quantitative information (combination of both survey and historical data). Panel
regression and panel regression with exogenous variables are estimated by using generalised
least square (GLS) estimation technique. Section 6.5 reports estimation and interpretation of
panel vector auto regression (PVAR) model. Section 6.6 provides estimation and interpretation
of panel vector auto regression with exogenous variables (PVAR – X). PVAR and the PVAR –
X were estimated by using generalised method of movement (GMM) estimation method.
Hypotheses tests results for the research questions are presented in Section 6.7. The concluding
remarks of the thesis and future research directions are highlighted in Chapter Seven.
6.1 Data analysis for quality test of the instrument
This section presents the internal consistency and reliability of the questionnaire by
Cronbach alpha ( ) and determination of the dimensionality of the variables issue resolved by
using factor analysis. As mentioned in Chapter Four the qualitative variables are restated below:
IC = institutional capacity
PBC = public sector capacity
PVC = private sector capacity
OF1 = factor1 (admin/rules and regulations)
OF2 = factor2 (delay in project execution)
OF3 = factor3 (public and private sectors experience and qualification)
OF4 = factor4 (unrealistic feasibility study)
The variables (qualitative) descriptions of this thesis are provided in Chapter Four.

199
6.1.1 Factor analysis
The factor analysis is conducted by using STATA and retained the number of factors
by using VARIMAX rotation. Factor analysis was conducted on each of the questions of the
questionnaire of the survey. The results of factor analysis determined the dimensionality of the
variables of the questionnaire. The results of the factor analysis along with the scree plot and
reliability test using Cronbach alpha ( ) criterion are presented in Table 6.1 and Figure 6.1 for
the first question (X1):
X1: The importance of infrastructure Table 6.1: Question X1 retains one factor
Variable Factor 1 q11: Reduce operating costs 0.85 q12: Bring forward investment 0.87 q13: Improve capital productivity 0.89 q14: Improve labour productivity 0.86 q15: Increase revenue 0.81 q16: Improve service delivery 0.78 q17: Create business opportunities 0.58 q18: Improve operational networks 0.75 q19: Improve profitability 0.82
Reliability coefficient: alpha = 0.92 (Factor retained: eigenvalues > 1)
Figure 6.1: Scree plot of eigenvalues after factor
Factor loading
The factor loadings provide information on the correlation of the factors and each of the
variables of the respective questions. There are nine (9) variables (sub-questions) in question
02
46
Eige
nval
ues
0 2 4 6 8 10Number
Scree plot of eigenvalues after factor
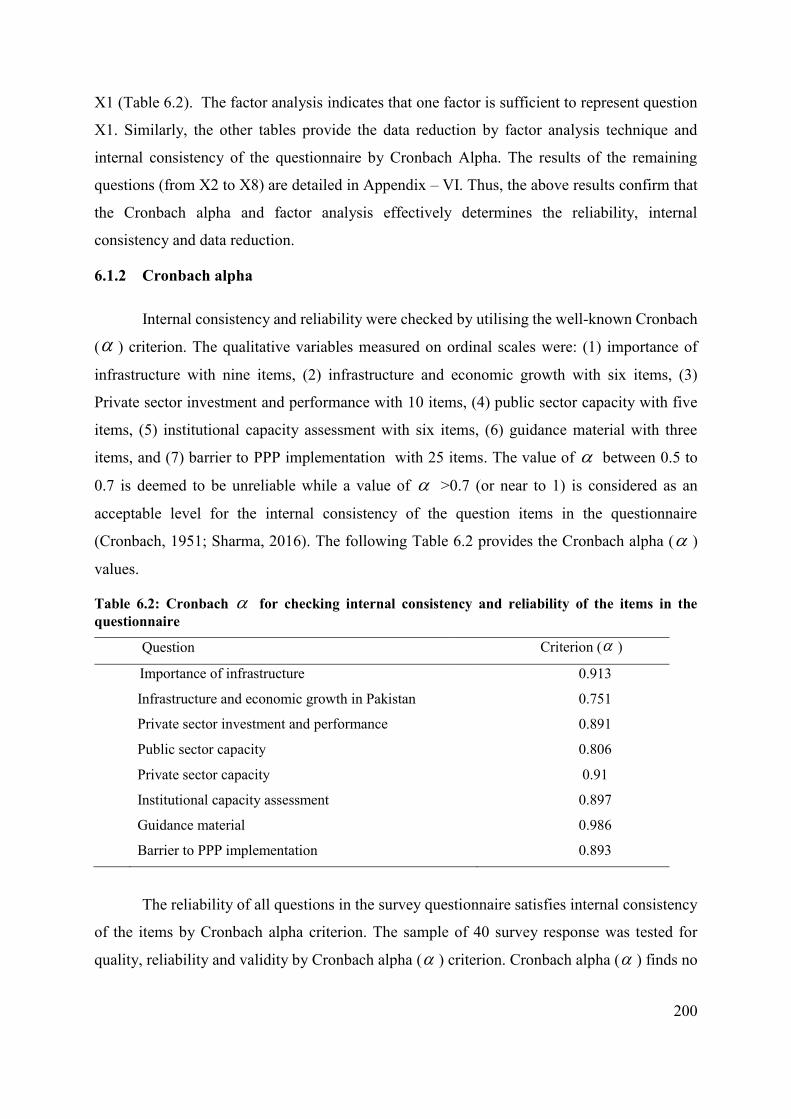
200
X1 (Table 6.2). The factor analysis indicates that one factor is sufficient to represent question
X1. Similarly, the other tables provide the data reduction by factor analysis technique and
internal consistency of the questionnaire by Cronbach Alpha. The results of the remaining
questions (from X2 to X8) are detailed in Appendix – VI. Thus, the above results confirm that
the Cronbach alpha and factor analysis effectively determines the reliability, internal
consistency and data reduction.
6.1.2 Cronbach alpha
Internal consistency and reliability were checked by utilising the well-known Cronbach
( ) criterion. The qualitative variables measured on ordinal scales were: (1) importance of
infrastructure with nine items, (2) infrastructure and economic growth with six items, (3)
Private sector investment and performance with 10 items, (4) public sector capacity with five
items, (5) institutional capacity assessment with six items, (6) guidance material with three
items, and (7) barrier to PPP implementation with 25 items. The value of between 0.5 to
0.7 is deemed to be unreliable while a value of >0.7 (or near to 1) is considered as an
acceptable level for the internal consistency of the question items in the questionnaire
(Cronbach, 1951; Sharma, 2016). The following Table 6.2 provides the Cronbach alpha ( )
values.
Table 6.2: Cronbach for checking internal consistency and reliability of the items in the questionnaire
Question Criterion ( )
Q1. Importance of infrastructure 0.913
Q2. Infrastructure and economic growth in Pakistan 0.751
Q3. Private sector investment and performance 0.891
Q4. Public sector capacity 0.806
Q5. Private sector capacity 0.91
Q6. Institutional capacity assessment 0.897
Q7. Guidance material 0.986
Q8. Barrier to PPP implementation 0.893
The reliability of all questions in the survey questionnaire satisfies internal consistency
of the items by Cronbach alpha criterion. The sample of 40 survey response was tested for
quality, reliability and validity by Cronbach alpha ( ) criterion. Cronbach alpha ( ) finds no
201
inadequacy of the survey response. Factor analysis was also used to find common factors that
linearly construct the original variables.
6.2 Quantitative data analysis
In this section, results are presented of tests to determine the statistical properties of the
variables. The tests applied the panel unit root tests and panel cointegration tests.
6.2.1 Panel unit root tests
The variables needed to be tested for unit root prior to applying for panel VAR
estimation. Consequently, each of the panel variables were tested for stationarity. Panel
stationarity tests were used and these established the order of integration. In the process of
testing non-stationarity, the four most popular tests were used namely, the Levine & Lin (LL)
Test, Im-Pesaran & Shin (IPS) Test, Maddala & Wu Test (known as Fisher’s test) and a
Residual-based LM Test (Hadri). The first three tests tested the non-stationarity versus
stationarity of the panel variables, while the last test tested for the stationarity versus non-
stationarity of the panels.
Panel VAR regression is a popular approach to establish linkages between public and
private partnership issues in the context of Pakistan to explore various policy issues for the
development of infrastructure for economic and social development of Pakistan such as to:
i. evaluate contributions to infrastructure development by both the public and the
private sectors;
ii. examine the causes of the lack of undertakings of PPP;
iii. develop a framework that helps to establish essential institutional arrangements
conducive to PPP adoption; and
iv. draw implications for policy development for effective PPP implementation in
Pakistan.
The panel unit root on each of the log-transformed series has been tested. The log series
was used because the change in the log of a variable represents proportionate change. Secondly,
logarithmic transformation reduces heterogeneity. The panel unit root tests results are presented
in Appendix – VII.
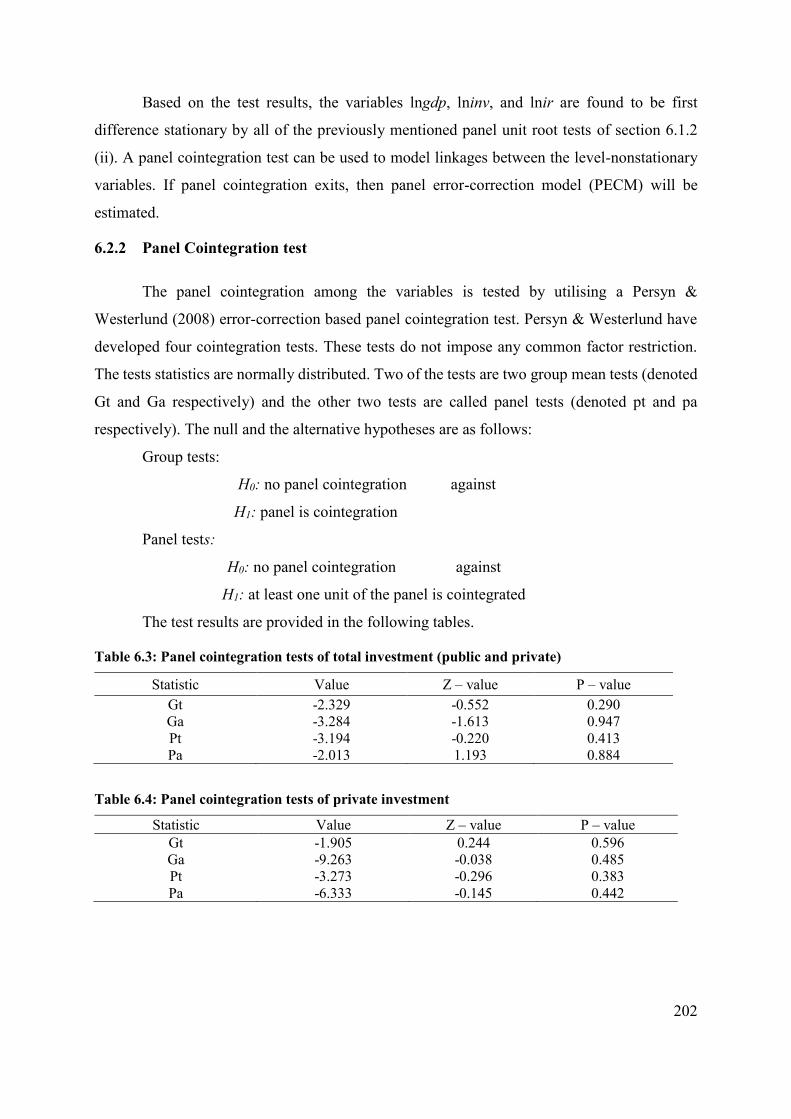
202
Based on the test results, the variables lngdp, lninv, and lnir are found to be first
difference stationary by all of the previously mentioned panel unit root tests of section 6.1.2
(ii). A panel cointegration test can be used to model linkages between the level-nonstationary
variables. If panel cointegration exits, then panel error-correction model (PECM) will be
estimated.
6.2.2 Panel Cointegration test
The panel cointegration among the variables is tested by utilising a Persyn &
Westerlund (2008) error-correction based panel cointegration test. Persyn & Westerlund have
developed four cointegration tests. These tests do not impose any common factor restriction.
The tests statistics are normally distributed. Two of the tests are two group mean tests (denoted
Gt and Ga respectively) and the other two tests are called panel tests (denoted pt and pa
respectively). The null and the alternative hypotheses are as follows:
Group tests:
H0: no panel cointegration against
H1: panel is cointegration
Panel tests:
H0: no panel cointegration against
H1: at least one unit of the panel is cointegrated
The test results are provided in the following tables.
Table 6.3: Panel cointegration tests of total investment (public and private)
Statistic Value Z – value P – value Gt Ga Pt Pa
-2.329 -3.284 -3.194 -2.013
-0.552 -1.613 -0.220 1.193
0.290 0.947 0.413 0.884
Table 6.4: Panel cointegration tests of private investment
Statistic Value Z – value P – value Gt Ga Pt Pa
-1.905 -9.263 -3.273 -6.333
0.244 -0.038 -0.296 -0.145
0.596 0.485 0.383 0.442
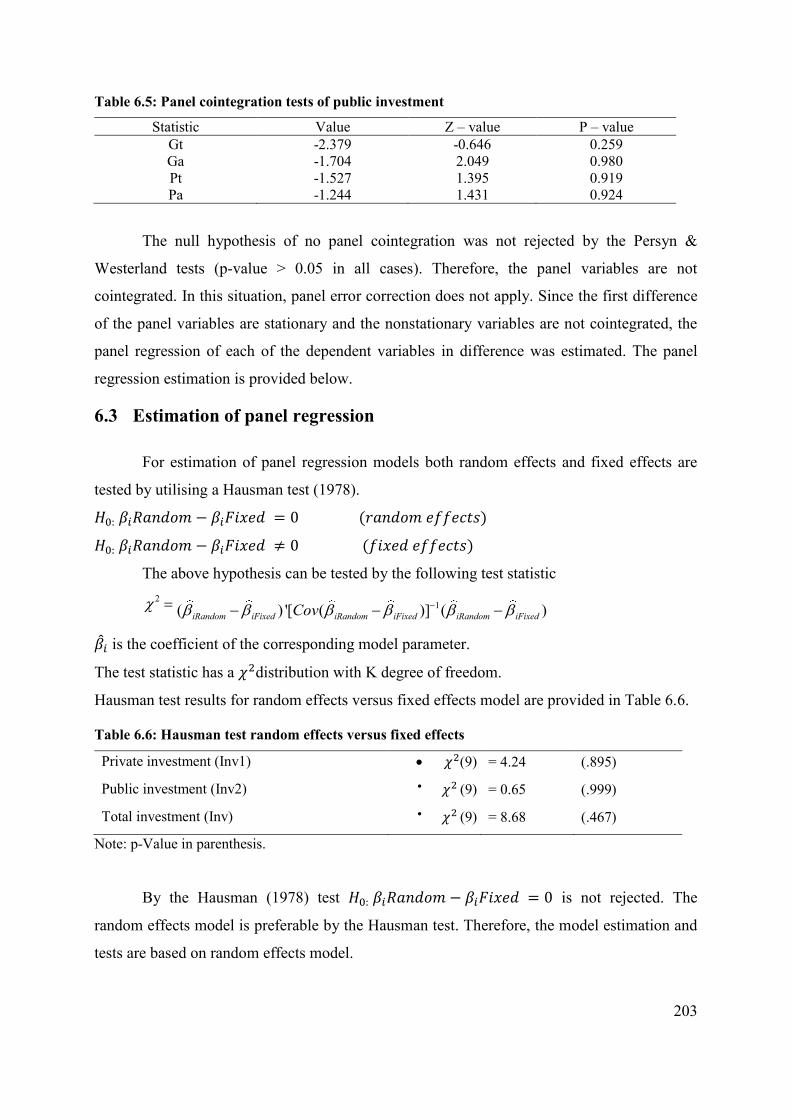
203
Table 6.5: Panel cointegration tests of public investment
Statistic Value Z – value P – value Gt Ga Pt Pa
-2.379 -1.704 -1.527 -1.244
-0.646 2.049 1.395 1.431
0.259 0.980 0.919 0.924
The null hypothesis of no panel cointegration was not rejected by the Persyn &
Westerland tests (p-value > 0.05 in all cases). Therefore, the panel variables are not
cointegrated. In this situation, panel error correction does not apply. Since the first difference
of the panel variables are stationary and the nonstationary variables are not cointegrated, the
panel regression of each of the dependent variables in difference was estimated. The panel
regression estimation is provided below.
6.3 Estimation of panel regression
For estimation of panel regression models both random effects and fixed effects are
tested by utilising a Hausman test (1978).
𝐻0: 𝛽𝑖𝑅𝑎𝑛𝑑𝑜𝑚 − 𝛽𝑖𝐹𝑖𝑥𝑒𝑑 = 0 (𝑟𝑎𝑛𝑑𝑜𝑚 𝑒𝑓𝑓𝑒𝑐𝑡𝑠)
𝐻0: 𝛽𝑖𝑅𝑎𝑛𝑑𝑜𝑚 − 𝛽𝑖𝐹𝑖𝑥𝑒𝑑 ≠ 0 (𝑓𝑖𝑥𝑒𝑑 𝑒𝑓𝑓𝑒𝑐𝑡𝑠)
The above hypothesis can be tested by the following test statistic 2 = 1( ) '[ ( )] ( )iRandom iFixed iRandom iFixed iRandom iFixedCov −− − −
��𝑖 is the coefficient of the corresponding model parameter.
The test statistic has a 𝜒2distribution with K degree of freedom.
Hausman test results for random effects versus fixed effects model are provided in Table 6.6.
Table 6.6: Hausman test random effects versus fixed effects
• Private investment (Inv1) • 𝜒2(9) • = 4.24 • (.895)
• Public investment (Inv2) • 𝜒2 (9) • = 0.65 • (.999)
• Total investment (Inv) • 𝜒2 (9) • = 8.68 • (.467)
Note: p-Value in parenthesis.
By the Hausman (1978) test 𝐻0: 𝛽𝑖𝑅𝑎𝑛𝑑𝑜𝑚 − 𝛽𝑖𝐹𝑖𝑥𝑒𝑑 = 0 is not rejected. The
random effects model is preferable by the Hausman test. Therefore, the model estimation and
tests are based on random effects model.
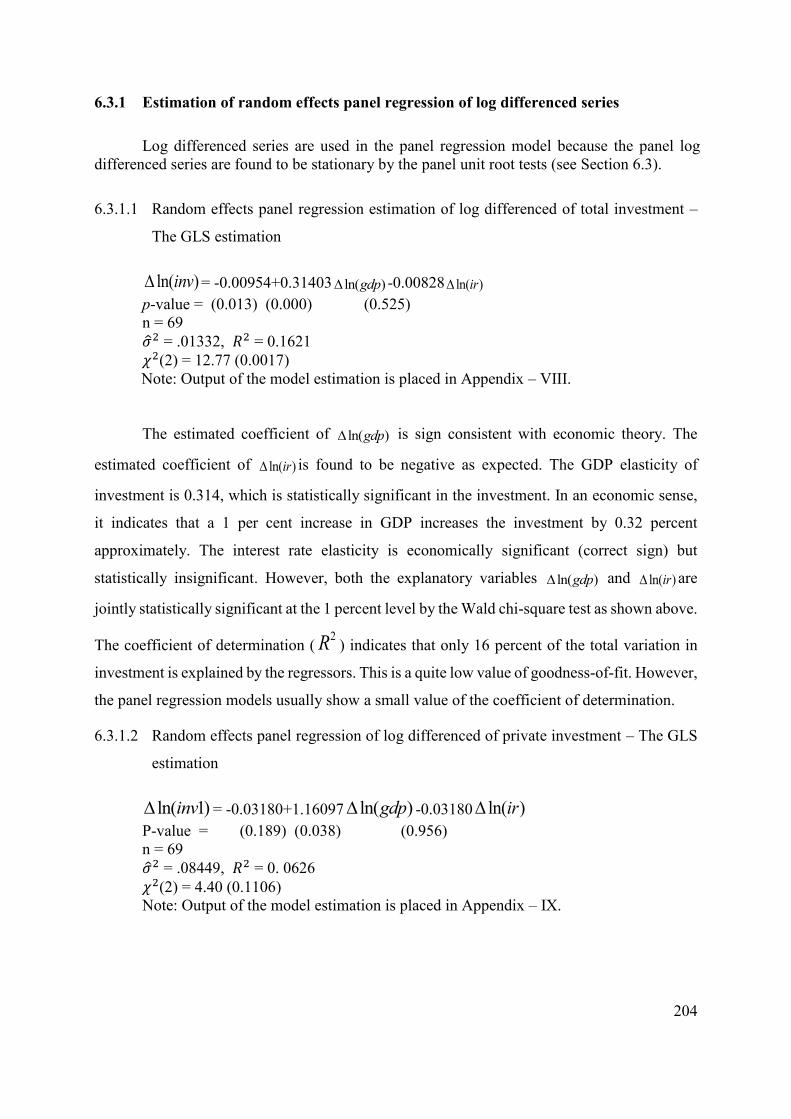
204
6.3.1 Estimation of random effects panel regression of log differenced series
Log differenced series are used in the panel regression model because the panel log differenced series are found to be stationary by the panel unit root tests (see Section 6.3).
6.3.1.1 Random effects panel regression estimation of log differenced of total investment –
The GLS estimation
ln( )inv = -0.00954+0.31403 ln( )gdp -0.00828 ln( )ir p-value = (0.013) (0.000) (0.525) n = 69 ��2 = .01332, 𝑅2 = 0.1621 𝜒2(2) = 12.77 (0.0017) Note: Output of the model estimation is placed in Appendix – VIII.
The estimated coefficient of ln( )gdp is sign consistent with economic theory. The
estimated coefficient of ln( )ir is found to be negative as expected. The GDP elasticity of
investment is 0.314, which is statistically significant in the investment. In an economic sense,
it indicates that a 1 per cent increase in GDP increases the investment by 0.32 percent
approximately. The interest rate elasticity is economically significant (correct sign) but
statistically insignificant. However, both the explanatory variables ln( )gdp and ln( )ir are
jointly statistically significant at the 1 percent level by the Wald chi-square test as shown above.
The coefficient of determination ( 2R ) indicates that only 16 percent of the total variation in
investment is explained by the regressors. This is a quite low value of goodness-of-fit. However,
the panel regression models usually show a small value of the coefficient of determination.
6.3.1.2 Random effects panel regression of log differenced of private investment – The GLS
estimation
ln( 1)inv = -0.03180+1.16097 ln( )gdp -0.03180 ln( )ir P-value = (0.189) (0.038) (0.956) n = 69 ��2 = .08449, 𝑅2 = 0. 0626 𝜒2(2) = 4.40 (0.1106) Note: Output of the model estimation is placed in Appendix – IX.

205
The estimated coefficient of ln( )gdp is sign consistent with economic theory45. The
estimated coefficient of ln( )ir is found to be positive, which is inconsistent with economic
theory and statistically insignificant46. The GDP elasticity of private investment is 1.161 which
is statistically significant in the private investment model. In economic sense, it indicates that
a 1 percent increase in GDP increases the private investment by 1.16 percent approximately.
Private investment is GDP elastic. However, both the explanatory variables ln( )gdp and
ln( )ir are jointly statistically insignificant by the Wald chi-square test (p-value <.01). The
( 2R ) indicates that only 6 percent of the total variation in private investment is explained by
the regressors. This is a quite low value of goodness-of-fit. As stated above, the panel models
usually show the small value of the coefficient of determination.
6.3.1.3 Random effects panel regression of log differenced of public investment – The GLS
estimation
ln( 2)inv = -0.00383+0.12966 ln( )gdp -0.00816 ln( )ir P-value = (0.066) (0.007) (0.251) n = 69 ��2 = .00732, 𝑅2 = 0.1084 𝜒2(2) = 8.02 (0.0181) Note: Output of data estimation is placed in Appendix – X.
The estimated coefficient of ln( )gdp is sign consistent with economic theory. The
estimated coefficient of ln( )ir is found to be negative as expected (consistent with economic
theory) but statistically insignificant. Generally, public decisions are taken by considering the
social aspects of the projects rather than financial and economic aspects. Hence, public
investment ignores the rate of interest when making investment decisions. Elasticity of the
growth rate of public investment is 0.13 percent with respect to the growth rate of GDP, which
45 It is economically meaningful and economic theory-based sign consistency. For example, GDP should be positively related to investment and interest rate is expected to have a negative impact on investment by the economic theory. It the theory consistency sign is not valid then the model /variables setup/measurement of variables could be doubtful. Therefore, the data should be changed logically.
46 Statistical significance can be achieved by using statistically significant tests. Statistical significance applies when p-value is less than .01 or .05 or .10 depending on which level is chosen by the researcher.
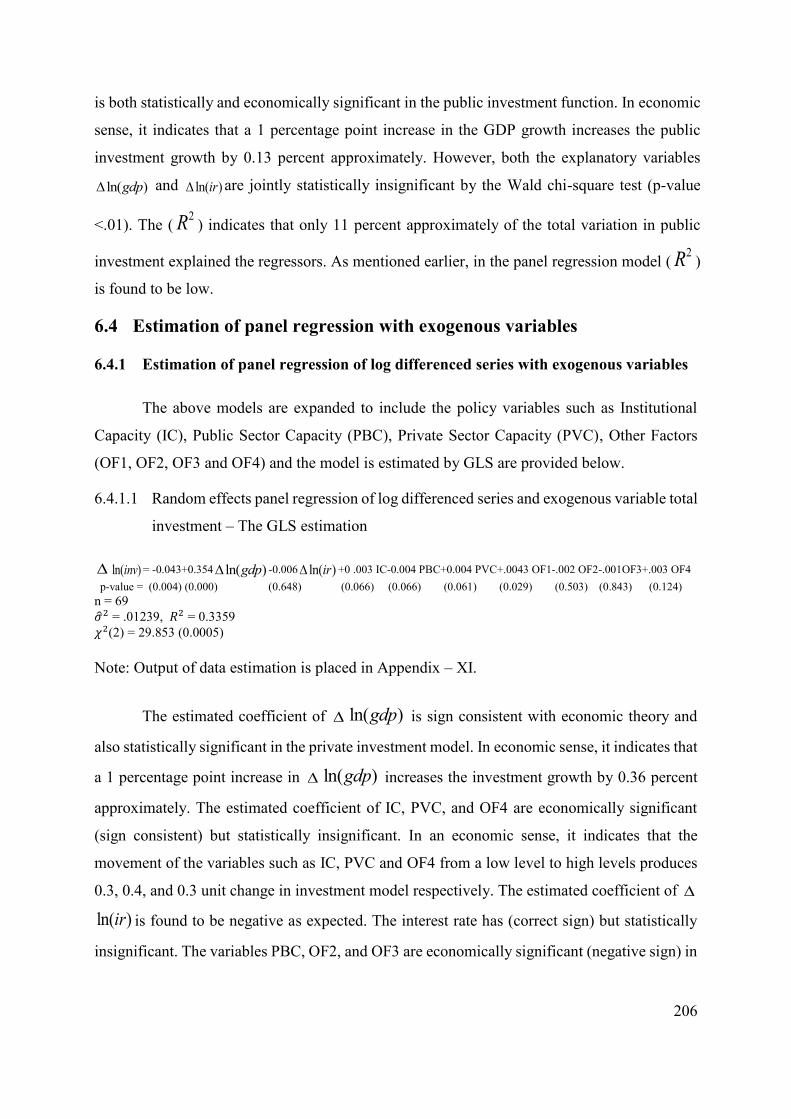
206
is both statistically and economically significant in the public investment function. In economic
sense, it indicates that a 1 percentage point increase in the GDP growth increases the public
investment growth by 0.13 percent approximately. However, both the explanatory variables
ln( )gdp and ln( )ir are jointly statistically insignificant by the Wald chi-square test (p-value
<.01). The ( 2R ) indicates that only 11 percent approximately of the total variation in public
investment explained the regressors. As mentioned earlier, in the panel regression model ( 2R )
is found to be low.
6.4 Estimation of panel regression with exogenous variables
6.4.1 Estimation of panel regression of log differenced series with exogenous variables
The above models are expanded to include the policy variables such as Institutional
Capacity (IC), Public Sector Capacity (PBC), Private Sector Capacity (PVC), Other Factors
(OF1, OF2, OF3 and OF4) and the model is estimated by GLS are provided below.
6.4.1.1 Random effects panel regression of log differenced series and exogenous variable total
investment – The GLS estimation
)ln(inv = -0.043+0.354 ln( )gdp -0.006 ln( )ir +0 .003 IC-0.004 PBC+0.004 PVC+.0043 OF1-.002 OF2-.001OF3+.003 OF4 p-value = (0.004) (0.000) (0.648) (0.066) (0.066) (0.061) (0.029) (0.503) (0.843) (0.124) n = 69 ��2 = .01239, 𝑅2 = 0.3359 𝜒2(2) = 29.853 (0.0005)
Note: Output of data estimation is placed in Appendix – XI.
The estimated coefficient of ln( )gdp is sign consistent with economic theory and
also statistically significant in the private investment model. In economic sense, it indicates that
a 1 percentage point increase in )ln(gdp increases the investment growth by 0.36 percent
approximately. The estimated coefficient of IC, PVC, and OF4 are economically significant
(sign consistent) but statistically insignificant. In an economic sense, it indicates that the
movement of the variables such as IC, PVC and OF4 from a low level to high levels produces
0.3, 0.4, and 0.3 unit change in investment model respectively. The estimated coefficient of
)ln(ir is found to be negative as expected. The interest rate has (correct sign) but statistically
insignificant. The variables PBC, OF2, and OF3 are economically significant (negative sign) in
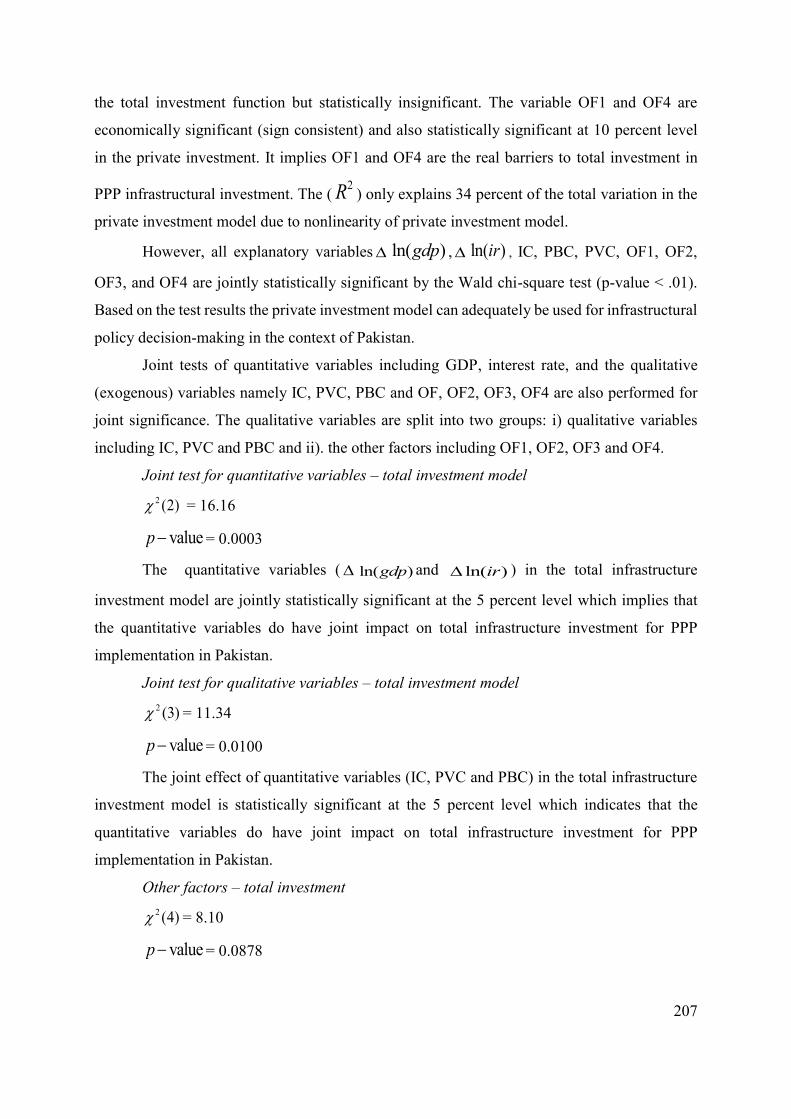
207
the total investment function but statistically insignificant. The variable OF1 and OF4 are
economically significant (sign consistent) and also statistically significant at 10 percent level
in the private investment. It implies OF1 and OF4 are the real barriers to total investment in
PPP infrastructural investment. The ( 2R ) only explains 34 percent of the total variation in the
private investment model due to nonlinearity of private investment model.
However, all explanatory variables ln( )gdp , )ln(ir , IC, PBC, PVC, OF1, OF2,
OF3, and OF4 are jointly statistically significant by the Wald chi-square test (p-value < .01).
Based on the test results the private investment model can adequately be used for infrastructural
policy decision-making in the context of Pakistan.
Joint tests of quantitative variables including GDP, interest rate, and the qualitative
(exogenous) variables namely IC, PVC, PBC and OF, OF2, OF3, OF4 are also performed for
joint significance. The qualitative variables are split into two groups: i) qualitative variables
including IC, PVC and PBC and ii). the other factors including OF1, OF2, OF3 and OF4.
Joint test for quantitative variables – total investment model 2 (2) = 16.16
valuep− = 0.0003
The quantitative variables ( ln( )gdp and ln( )ir ) in the total infrastructure
investment model are jointly statistically significant at the 5 percent level which implies that
the quantitative variables do have joint impact on total infrastructure investment for PPP
implementation in Pakistan.
Joint test for qualitative variables – total investment model 2 (3) = 11.34
valuep− = 0.0100
The joint effect of quantitative variables (IC, PVC and PBC) in the total infrastructure
investment model is statistically significant at the 5 percent level which indicates that the
quantitative variables do have joint impact on total infrastructure investment for PPP
implementation in Pakistan.
Other factors – total investment 2 (4) = 8.10
valuep− = 0.0878
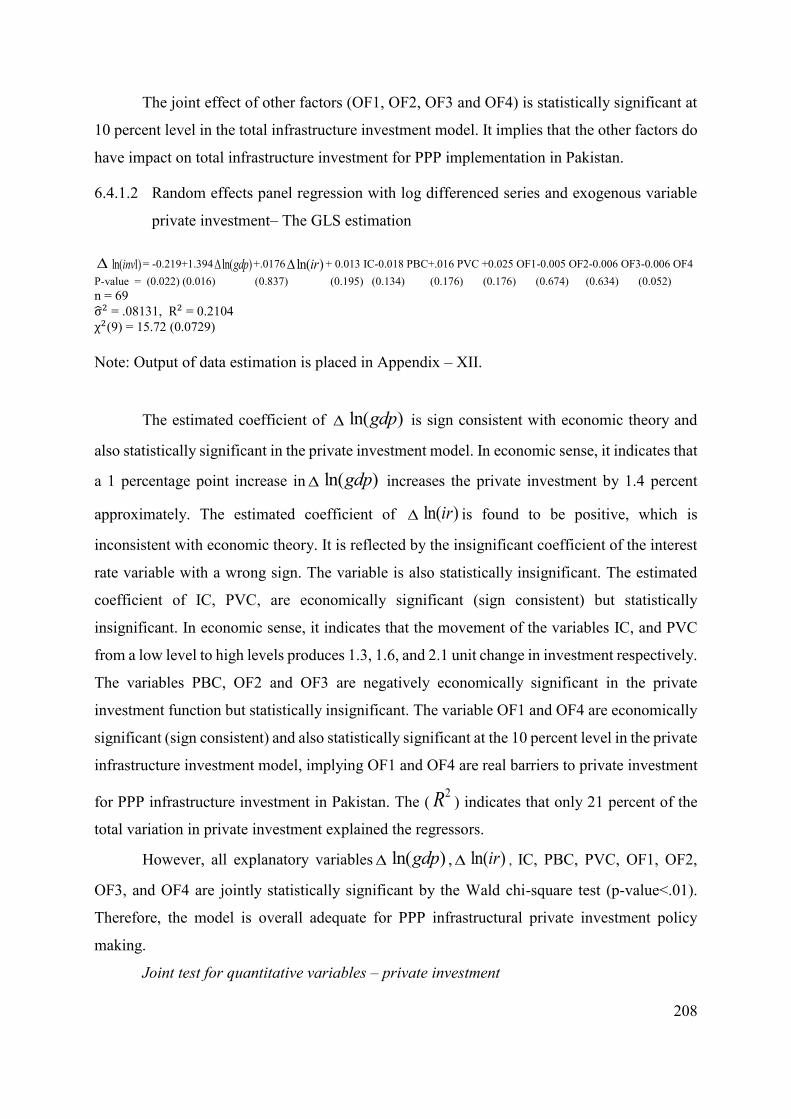
208
The joint effect of other factors (OF1, OF2, OF3 and OF4) is statistically significant at
10 percent level in the total infrastructure investment model. It implies that the other factors do
have impact on total infrastructure investment for PPP implementation in Pakistan.
6.4.1.2 Random effects panel regression with log differenced series and exogenous variable
private investment– The GLS estimation
)1ln(inv = -0.219+1.394 ln( )gdp +.0176 ln( )ir + 0.013 IC-0.018 PBC+.016 PVC +0.025 OF1-0.005 OF2-0.006 OF3-0.006 OF4 P-value = (0.022) (0.016) (0.837) (0.195) (0.134) (0.176) (0.176) (0.674) (0.634) (0.052) n = 69 σ2 = .08131, R2 = 0.2104 χ2(9) = 15.72 (0.0729)
Note: Output of data estimation is placed in Appendix – XII.
The estimated coefficient of ln( )gdp is sign consistent with economic theory and
also statistically significant in the private investment model. In economic sense, it indicates that
a 1 percentage point increase in )ln(gdp increases the private investment by 1.4 percent
approximately. The estimated coefficient of )ln(ir is found to be positive, which is
inconsistent with economic theory. It is reflected by the insignificant coefficient of the interest
rate variable with a wrong sign. The variable is also statistically insignificant. The estimated
coefficient of IC, PVC, are economically significant (sign consistent) but statistically
insignificant. In economic sense, it indicates that the movement of the variables IC, and PVC
from a low level to high levels produces 1.3, 1.6, and 2.1 unit change in investment respectively.
The variables PBC, OF2 and OF3 are negatively economically significant in the private
investment function but statistically insignificant. The variable OF1 and OF4 are economically
significant (sign consistent) and also statistically significant at the 10 percent level in the private
infrastructure investment model, implying OF1 and OF4 are real barriers to private investment
for PPP infrastructure investment in Pakistan. The ( 2R ) indicates that only 21 percent of the
total variation in private investment explained the regressors.
However, all explanatory variables ln( )gdp , )ln(ir , IC, PBC, PVC, OF1, OF2,
OF3, and OF4 are jointly statistically significant by the Wald chi-square test (p-value<.01).
Therefore, the model is overall adequate for PPP infrastructural private investment policy
making.
Joint test for quantitative variables – private investment

209
2 (2) = 6.24
valuep− = 0.0441
The joint effect of quantitative variables is statistically significant at the 5 percent level
in the private infrastructure investment model. It implies that the quantitative variables do have
an impact on private infrastructure investment for PPP implementation in Pakistan
Joint test for qualitative variables – private investment 2 (3) = 6.23
valuep− = 0.1010
The joint effect of quantitative variables is statistically significant at marginally higher
than the 10 percent level in the private infrastructure investment model. It implies that the
quantitative variables do have impact on private infrastructure investment for PPP
implementation in Pakistan.
Other factors – private investment 2 (4) = 7.89
valuep− = 0.0958
The joint effect of other factors is statistically significant at the 10 percent level in the
private infrastructure investment model. It implies that the other factors do have impact on
private infrastructure investment for PPP implementation in Pakistan.
6.4.1.3 Random effects panel regression with log differenced series and exogenous public
investment– The GLS estimation
)2ln(inv = 0.008+0.1364 ln( )gdp -0.008 ln( )ir + .001 IC-.001 PBC+.002 PVC+.001OF1-.001OF2+.001OF3-
.001OF4
P-value = (0.264) (0.009) (0.291) (0.608) (0.575) (0.21) (0.667) (0.711) (0.465) (0.535)
n = 69
��2 = .00749, 𝑅2 = 0.1671
𝜒2(9) = 11.84 (0.2226)
Note: Output of data estimation is placed in Appendix – XIII.
The estimated coefficient of ln( )gdp is sign consistent with economic theory and
also statistically significant in the public sector investment growth model. In an economic sense,
it indicates that a 1 percent increase in )ln(gdp increases the investment by 0.14 percent

210
approximately. The investment is inelastic. The estimated coefficient of IC, PVC, OF1, and
OF3 are economically significant (sign consistent) but statistically insignificant. In an economic
sense, it indicates that the movement of the variables such as IC, PVC, OF1 and OF3 from a
low level to high levels produces 0.05, 0.2, 0.05- and 0.08- unit change in investment
respectively. The estimated coefficient of )ln(ir is found to be negative as expected. The
interest rate elasticity is economically significant (correct sign) but statistically insignificant.
The variables PBC, OF2 and OF3 are negatively economically significant in the public
investment function but statistically insignificant. The ( 2R ) indicates that only 17 percent of
the total variation in public investment is explained by the regressors. This is a quite low value
of goodness-of-fit. However, the panel models usually show the small value of the coefficient
of determination. The results of this section provide information that the growth rate of GDP
only significantly contributes to investment growth.
Joint test for quantitative variables – public investment 2 (2) =7.17
valuep− = 0.0277
The joint effect of quantitative variables is statistically significant at the 5 percent level
in the public infrastructure investment model. It implies that quantitative variables do have an
impact on public infrastructure investment for PPP implementation in Pakistan
Joint test for qualitative variables – public investment 2 (3) = 2.44
valuep− = 0.4857
The joint effect of quantitative variables is statistically insignificant in the public
infrastructure investment model. It implies that quantitative variables do not have an impact on
public infrastructure investment for PPP implementation in Pakistan.
Other factors – public investment 2 (4) = 1.39
valuep− = 0.8467
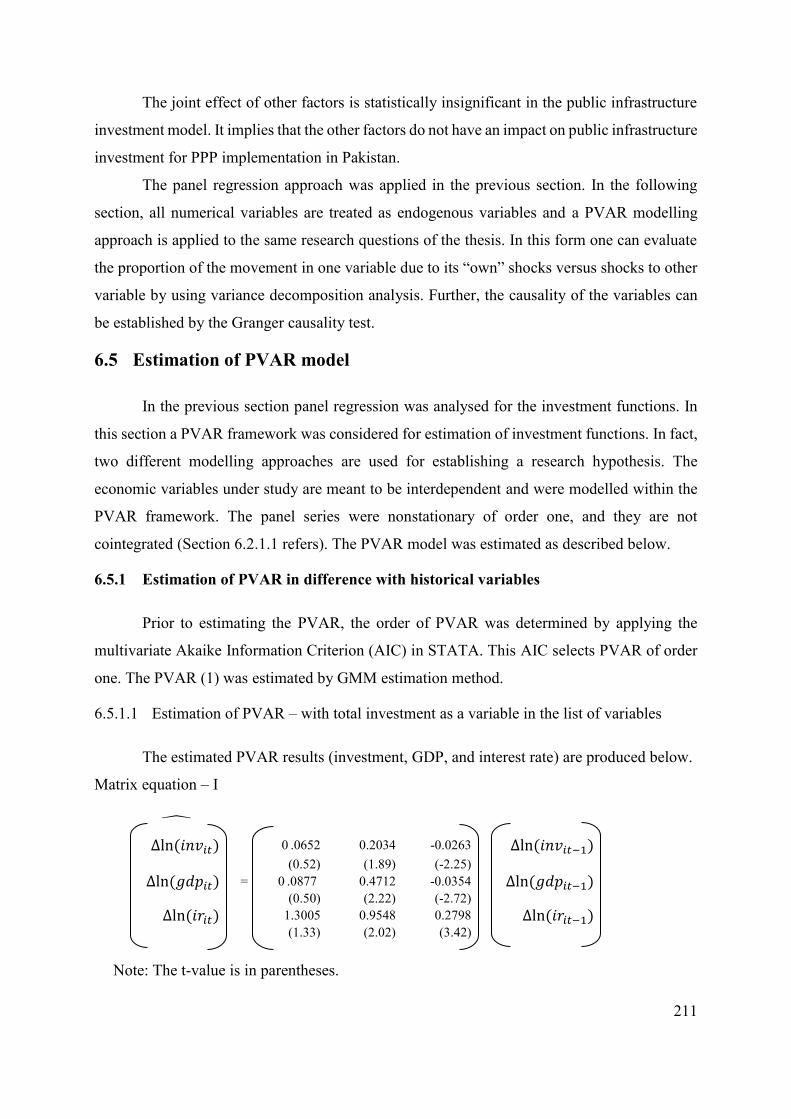
211
The joint effect of other factors is statistically insignificant in the public infrastructure
investment model. It implies that the other factors do not have an impact on public infrastructure
investment for PPP implementation in Pakistan.
The panel regression approach was applied in the previous section. In the following
section, all numerical variables are treated as endogenous variables and a PVAR modelling
approach is applied to the same research questions of the thesis. In this form one can evaluate
the proportion of the movement in one variable due to its “own” shocks versus shocks to other
variable by using variance decomposition analysis. Further, the causality of the variables can
be established by the Granger causality test.
6.5 Estimation of PVAR model
In the previous section panel regression was analysed for the investment functions. In
this section a PVAR framework was considered for estimation of investment functions. In fact,
two different modelling approaches are used for establishing a research hypothesis. The
economic variables under study are meant to be interdependent and were modelled within the
PVAR framework. The panel series were nonstationary of order one, and they are not
cointegrated (Section 6.2.1.1 refers). The PVAR model was estimated as described below.
6.5.1 Estimation of PVAR in difference with historical variables
Prior to estimating the PVAR, the order of PVAR was determined by applying the
multivariate Akaike Information Criterion (AIC) in STATA. This AIC selects PVAR of order
one. The PVAR (1) was estimated by GMM estimation method.
6.5.1.1 Estimation of PVAR – with total investment as a variable in the list of variables
The estimated PVAR results (investment, GDP, and interest rate) are produced below.
Matrix equation – I
∆ln (𝑖𝑛𝑣𝑖𝑡) 0 .0652 0.2034 -0.0263 ∆ln (𝑖𝑛𝑣𝑖𝑡−1)
(0.52) (1.89) (-2.25) ∆ln (𝑔𝑑𝑝𝑖𝑡) = 0 .0877 0.4712 -0.0354 ∆ln (𝑔𝑑𝑝𝑖𝑡−1)
(0.50) (2.22) (-2.72) ∆ln (𝑖𝑟𝑖𝑡) 1.3005 0.9548 0.2798 ∆ln (𝑖𝑟𝑖𝑡−1)
(1.33) (2.02) (3.42) Note: The t-value is in parentheses.

212
The growth rate of the total investment is influenced by both the past growth rate of
GDP (which is statistically significant at the 5 percent level by one-tail test) and past growth
rate of interest rate (which is statistically significant at the 5 percent level) individually,
implying GDP growth and interest rate growth are individually causally related to the growth
rate of total investment. Further, bi-directional causality between GDP and interest rate exists.
Given the p-value of the test, GDP and interest rate individually are causally related to total
investment.
The test results indicate that GDP and interest rate have an impact on total investment
in the context of Pakistan.
Parameter stability test of the PVAR model is provided below in Table 6.7.
Table 6.7: Eigenvalue for stability condition
Eigenvalue Real Imaginary Modulus
3807456 .3807456 .0547988
.2108542 -.2108542 0.00000
.4352318
.4352318
.0547988 Figure 6.2: Eigenvalue for stability condition
Since all the eigenvalues lie inside the unit circle, therefore the PVAR model satisfies
the stability condition.
-1-.5
0.5
1
Imag
inar
y
-1 -.5 0 .5 1Real
Roots of the companion matrix

213
6.5.1.2 Estimation of PVAR– with private investment in the variable list
The estimated PVAR results (private investment, GDP, and interest rate) are produced
below.
Matrix equation – II
∆ln (𝑖𝑛𝑣1𝑖𝑡) -0.0426 2.5055 -0.0866 ∆ln (𝑖𝑛𝑣1𝑖𝑡−1)
(-0.30) (2.90) (-1.10) ∆ln (𝑔𝑑𝑝𝑖𝑡) = -0 .0009 0.6992 -0.0363 ∆ln (𝑔𝑑𝑝𝑖𝑡−1)
(0.06) (3.80) (-2. 89) ∆ln (𝑖𝑟𝑖𝑡) -0.0577 1.5288 0.2674 ∆ln (𝑖𝑟𝑖𝑡−1)
(-0.50) (3.15) (3.48) Note: The t-value is in parentheses.
The growth rate of private investment is influenced by both past growth rate of GDP
(by one-sided t-test) implying there is causality running from GDP to private investment. There
is no effect of growth rate of interest rate on private investment. However, bi-directional
causality between GDP and interest rate exists. Given the p-value of the test GDP individually
causally related to private investment, the test results indicate that GDP has an impact on private
investment. Eigenvalue for stability condition is provided in Table 6.8 and Figure 6.3.
Table 6.8: Eigenvalue for stability condition
Eigenvalue Real Imaginary Modulus
.4820594
.4820594 -.0401468
-.0166264 .0166264 0.00000
.482346
.482346 .0401468
Figure 6.3: Eigenvalue for stability condition
All the eigenvalues lie inside the unit circle. Therefore, PVAR model satisfies the
stability condition.
-1-.5
0.5
1
Imag
inar
y
-1 -.5 0 .5 1Real
Roots of the companion matrix
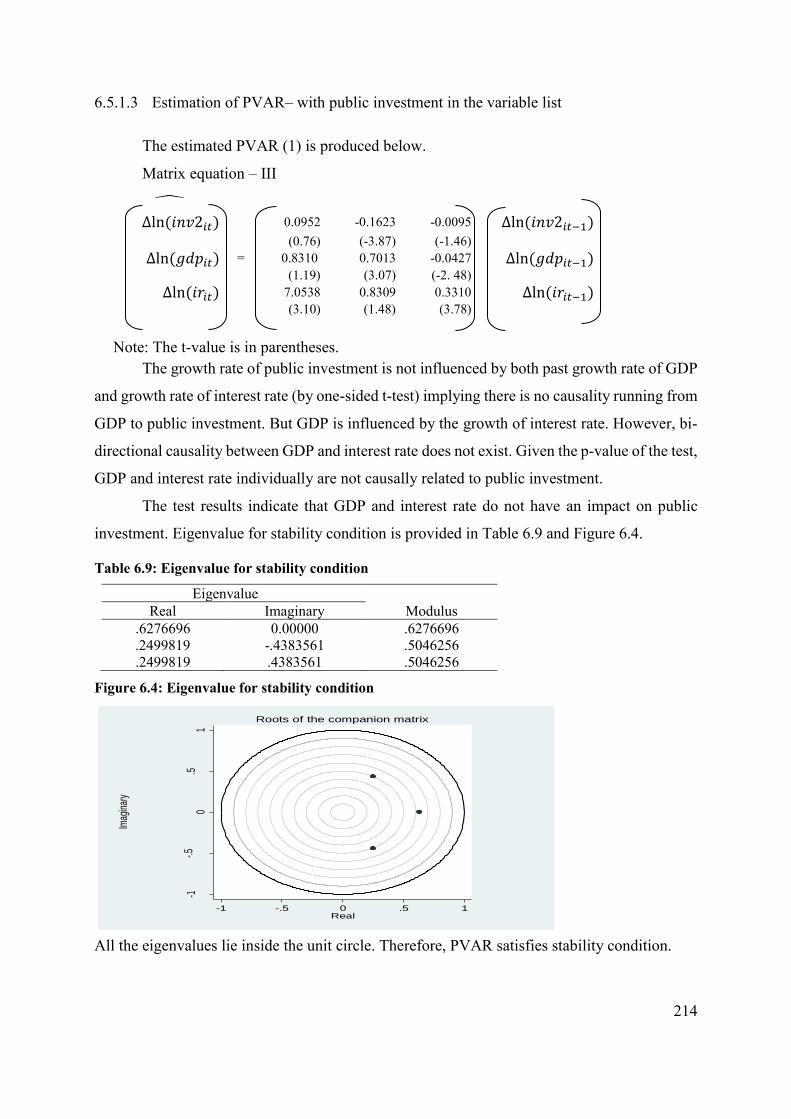
214
6.5.1.3 Estimation of PVAR– with public investment in the variable list
The estimated PVAR (1) is produced below.
Matrix equation – III
∆ln (𝑖𝑛𝑣2𝑖𝑡) 0.0952 -0.1623 -0.0095 ∆ln (𝑖𝑛𝑣2𝑖𝑡−1)
(0.76) (-3.87) (-1.46) ∆ln (𝑔𝑑𝑝𝑖𝑡) = 0.8310 0.7013 -0.0427 ∆ln (𝑔𝑑𝑝𝑖𝑡−1)
(1.19) (3.07) (-2. 48) ∆ln (𝑖𝑟𝑖𝑡) 7.0538 0.8309 0.3310 ∆ln (𝑖𝑟𝑖𝑡−1)
(3.10) (1.48) (3.78) Note: The t-value is in parentheses.
The growth rate of public investment is not influenced by both past growth rate of GDP
and growth rate of interest rate (by one-sided t-test) implying there is no causality running from
GDP to public investment. But GDP is influenced by the growth of interest rate. However, bi-
directional causality between GDP and interest rate does not exist. Given the p-value of the test,
GDP and interest rate individually are not causally related to public investment.
The test results indicate that GDP and interest rate do not have an impact on public
investment. Eigenvalue for stability condition is provided in Table 6.9 and Figure 6.4.
Table 6.9: Eigenvalue for stability condition
Eigenvalue Real Imaginary Modulus
.6276696
.2499819
.2499819
0.00000 -.4383561 .4383561
.6276696
.5046256
.5046256
Figure 6.4: Eigenvalue for stability condition
All the eigenvalues lie inside the unit circle. Therefore, PVAR satisfies stability condition.
-1-.5
0.5
1
Imag
inar
y
-1 -.5 0 .5 1Real
Roots of the companion matrix

215
6.6 Estimation of PVAR in difference with exogenous variables (PVAR-X)
Estimation of PVAR – X is reported in this section.
6.6.1 Empirical results PVAR – X total investment
Table 6.10: Empirical results of PVAR – X (investment, GDP, and IR are the dependent variables list with exogenous variables) model estimated by GMM
Coefficient Standard error z P>|z| [95% confidence interval] ∆ln (𝑖𝑛𝑣)
∆ln (𝑖𝑛𝑣𝑖𝑡−1) -.02430 .12662 -0.19 0.848 -.27247 .22387 ∆ln (𝑔𝑑𝑝𝑖𝑡−1) .01827 .07865 0.23 0.816 -.13588 .17243
∆ln (𝑖𝑟𝑖𝑡−1) -.02204 .01270 -1.73 0.083 -.04693 .00286 IC .02008 .01163 1.73 0.084 -.00272 .04288
PBC -.00147 .00148 -1.00 0.319 -.00437 .00142 PVC -.00654 .00544 -1.20 0.229 -.01719 .00412 OF1 .01973 .00742 2.66 0.008 .00518 .03427 OF2 .00015 .00197 0.08 0.939 -.00371 .00401 OF3 .00207 .00153 1.36 0.174 -.00092 .00506 OF4 -.00264 .00154 -1.71 0.087 -.00565 .00038
∆ln (𝑔𝑑𝑝) ∆ln (𝑖𝑛𝑣𝑖𝑡−1) -.01116 .12482 -0.09 0.929 -.25581 .23348
∆ln (𝑔𝑑𝑝𝑖𝑡−1) .33967 .12118 2.80 0.005 .10217 .57716 ∆ln (𝑖𝑟𝑖𝑡−1) -.04994 .01984 -2.52 0.012 -.08883 -.01106
IC .01899 .00701 2.71 0.007 .00527 .03272 PBC .00045 .00219 0.21 0.837 -.00386 .00476 PVC -.00439 .00423 -1.04 0.299 -.01268 .00389 OF1 .01921 .01027 1.87 0.061 -.00092 .03933 OF2 -.00266 .00367 -0.73 0.468 -.00985 .00453 OF3 .00015 .00194 0.08 0.937 -.00365 .00396 OF4 -.00231 .00211 -1.10 0.273 -.00645 .00183
∆ln (𝑖𝑟) ∆ln (𝑖𝑛𝑣𝑖𝑡−1) .85227 .80082 1.06 0.287 -.71732 2.42189
∆ln (𝑔𝑑𝑝𝑖𝑡−1) 1.79718 .58929 3.05 0.002 .64218 2.95218 ∆ln (𝑖𝑟𝑖𝑡−1) .13464 .08617 1.56 0.118 -.03424 .30352
IC -.04519 .04463 -1.01 0.311 -.13266 .04227 PBC -.01169 .00957 -1.22 0.222 -.03043 .00706 PVC .05463 .02386 2.29 0.022 .00787 .10139 OF1 .04782 .06266 0.76 0.445 .07499 .17063 OF2 -.00685 .01609 -0.43 0.670 -.03838 .02468 OF3 7.62e-06 .01034 0.00 0.999 -.02025 .02027 OF4 .00924 .01174 0.79 0.431 -.01377 .03225
a. Total investment as dependent variable
The estimated coefficient of ∆ln (𝑖𝑛𝑣𝑖𝑡−1), PBC and PVC are statistically and
economically insignificant (negative sign) in total investment function. In economic sense, it
indicates that a 1 percent increase in ∆ln (𝑖𝑛𝑣𝑖𝑡−1) decreases total investment by 0.66 percent
and a one level increase in PBC and PVC from low to high level decreases investment by 2.43
percent and 0.14 percent respectively. The estimated coefficients of ∆ln (𝑔𝑑𝑝𝑖𝑡−1), OF2 and OF3
216
are sign consistent with economic theory but statistically insignificant in the investment model.
In an economic sense, it indicates that a 1 percent increase in ∆ln (𝑔𝑑𝑝𝑖𝑡−1
) increases total
investment by 18.27 percent and a one level increase from low to high level in OF2 and OF3
increases total investment by 0.02 percent and 0.21 percent respectively. The results indicate
that ∆ln (𝑖𝑛𝑣𝑖𝑡−1), PVC, OF2 and OF3 are inelastic. The estimated coefficient of ∆ln (𝑖𝑟𝑖𝑡−1) is
found to be negative as expected. The variable ∆ln (𝑖𝑟𝑖𝑡−1) and IC are economically significant
(sign consistent) and also statistically significant at 10 percent in the investment function. The
variable OF1 is economically and statistically significant. OF4 is economically insignificant
but statistically significant at 10 percent.
b. Real GDP as dependent variable
The estimated coefficient of ∆ln (𝑖𝑛𝑣𝑖𝑡−1), PVC, OF2 and OF4 are economically and
statistically insignificant in total investment model. In an economic sense, it indicates that a 1
percent increase in ∆ln (𝑖𝑛𝑣𝑖𝑡−1) decreases ∆ ln(𝑔𝑑𝑝) by 1.12 percent, and a one level increase
from low to high level in PVC, OF2 and OF4 decreases ∆ ln(𝑔𝑑𝑝) by 0.44 percent, 0.27 percent
and 0.23 percent respectively. The estimated coefficients of ∆ ln(𝑔𝑑𝑝𝑖𝑡−1), IC and OF1 are
economically and statistically significant in the total investment model. In an economic sense,
it indicates that a 1 percent increase in ∆ln (𝑔𝑑𝑝𝑖𝑡−1) increases GDP by 34 percent and one level
increase in OF1 and IC from low to high increases GDP by 2 percent and 0.02 per cent
respectively. PBC and OF3 are economically significant but statistically insignificant. The
results indicate that IC, PVC, OF2 and OF4 are inelastic. The estimated coefficient of
∆ln (𝑖𝑟𝑖𝑡−1) is found to be negative as expected. The interest rate has corrected sign, which is
economically and statistically significant.
c. Interest rate as dependent variable
The estimated coefficient of ∆ln (𝑖𝑛𝑣𝑖𝑡−1), OF1, OF3 and OF4 are economically
significant but statistically insignificant in the total investment model function. In economic
sense, it indicates that a 1 percent increase in ∆ln (𝑖𝑛𝑣𝑖𝑡−1) increases
∆ln (𝑖𝑟) by 85.22 percent and one level increase from low to high level in OF1, OF3 and OF4
increases ∆ln (𝑖𝑟𝑖𝑡−1) by 4.78 percent, 762 percent and .924 percent respectively. The estimated
coefficient of ∆ ln(𝑔𝑑𝑝𝑖𝑡−1) and PVC are economically and statistically significant. In economic
sense, it indicates that a 1 percent increase in ∆ln (𝑔𝑑𝑝𝑖𝑡−1) and a one level increase from low to
high level in PVC increases the interest rate by 180 percent and 5.46 percent respectively. The

217
estimated coefficient of ∆ln (𝑖𝑟𝑖𝑡−1), IC and OF2 are found to be statistically and economically
insignificant (not sign consistent). The variable PBC is economically insignificant but
statistically significant. The results indicate that OF4 is inelastic. Based on the above test results
the investment model can be used for infrastructural development policy decisions making in
the context of Pakistan. Eigenvalue for stability condition is provided in Table 6.11 and Figure
6.5.
Table 6.11: Eigenvalue for stability condition
Eigenvalue
Real Imaginary Modulus
.4028191
.4028191
.0158212
.4089433
-.4089433
0.000000
.574019
.574019
.0158212
Figure 6.5: Eigenvalue for stability condition
All the eigenvalues lie inside the unit circle. Therefore, PVAR satisfies stability
condition.
The tools employed for PVAR-X analysis are (i) Granger causality, (ii) variance
decomposition and, (iii) impulse response analysis.
i. Granger causality test of the variables in panel VAR
Granger causality test describes whether a variable is causally related to another. This
test is used to measure the cause and effect relationship. Granger causality tests are provided in
Table 6.12. For instance, a variable yt1 is Granger-caused by yt2 if current and past information
on yt2 helps to improve the forecasts on yt1.
-1-.5
0.5
1
Imag
inar
y
-1 -.5 0 .5 1Real
Roots of the companion matrix

218
Granger causality was tested by testing the following null (H0) against the alternative (H1) hypotheses:
H0: Excluded variable does not Granger-cause the dependent variable H1: Excluded variable Granger-causes the dependent variable
Table 6.12: Granger causality test in PVAR investment
Equation \ Excluded 2 df valuep−
∆ln (𝑖𝑛𝑣) ∆ln (𝑔𝑑𝑝) 0.054 1 0.816
∆ln (𝑖𝑟) 3.010 1 0.083 All 3.105 2 0.212
∆ln (𝑔𝑑𝑝) ∆ln (𝑖𝑛𝑣) 0.008 1 0.929
∆ln (𝑖𝑟) 6.337 1 0.012 All 6.355 2 0.042
∆ln (𝑖𝑟) ∆ln (𝑖𝑛𝑣) 1.133 1 0.287
∆ln (𝑔𝑑𝑝) 9.301 1 0.002 All 12.235 2 0.002
In the total investment equation, the real interest causes the total investment at 10
percent level of significance. However, interest rate and GDP do not jointly cause the total
investment by the Granger causality test. In the GDP equation the real interest rate is statically
significant at the 5 percent level. Further, both the real interest rate and total investment jointly
causes the GDP. Similarly, the total investment and real GDP jointly Granger-cause real interest
rate thus, total investment, GDP and interest rate are interlinked by the Granger causality test.
ii. Variance decomposition in panel VAR investment model
The variance decomposition is a technique used for PVAR analysis. It tells us the
proportion of the movements in a sequence due to its “own” shocks versus stocks to others
variables. The variance decomposition results of the total investment model are presented in
Table 6.13.

219
Table 6.13: Forecast-error variance decomposition
Response variable Forecast horizon
Impulse variables
∆ln (𝑖𝑛𝑣)
∆ln (𝑔𝑑𝑝)
∆ln (𝑖𝑟) ∆ln (𝑖𝑛𝑣)
1 1 0 0 5 .98037 .00352 .01618 10 .98031 .00352 .01618
∆ln (𝑔𝑑𝑝) 1 .27797 .72204 0 5 .25793 .67299 .06908 10 .25793 .67298 .06912
∆ln (𝑖𝑟) 1 .03436 0 0 5 .10591 .12119 .77290 10 .10592 .12123 .77285
The response of investment, real GDP and interest rate due to shock to investment:
A one standard deviation shock to investment in the short run (5 years) and long run (10
years) causes approximately 98 percent fluctuation to the variance in its own shock, 0.35
percent in real GDP and 1.61 percent in short run and long run in the interest rate. This means
due to shock to investment over the periods of 5 years and 10 years causes no change to its own,
real GDP and interest rate.
The response of investment, real GDP and interest rate due to shock to real GDP:
A one standard deviation shock to real GDP in short run and long run causes 67.3
percent fluctuation in the variance in its own shock, approximately 25.8 percent in investment
and 6.9 percent in the interest rate. This means due to shock to real GDP over the periods of 5
years and 10 years causes no change to its own, investment and interest rate.
The response of investment, real GDP and interest rate due to shock to interest rate:
A one standard deviation shock to the interest rate in short run (5 years) and long run
(10 years) causes approximately 77.3 percent fluctuation to the variance in its own shock, 10.6
percent in total investment and 12.2 percent in the change in real GDP. This means due to shock
to the interest rate over the periods of 5 years and 10 years causes no change to its own,
investment and real GDP.

220
iii. Impulse response analysis
Impulse response function describes the effects of shocks on the adjustment path of the
variables, for instance, the effect of a variable on other variables.
The results from the impulse response function are presented in Table 6.14:
Table 6.14: Responses of investment, real GDP and interest rate due to shock in investment
Shock to ∆ln (𝑖𝑛𝑣) ∆ln (𝑔𝑑𝑝) ∆ln (𝑖𝑛𝑣) ∆ln (𝑖𝑟) 1 0.23604 .1802944 -.0318013 2 .0639513 .0346113 -.0253107 3 -.0282499 -.0280599 -.0099079 4 -.0438626 -.0339557 .0003577 5 -.0260296 -.0181095 .0035528 6 -.0065178 -.0034013 .0027444 7 .0033257 .0032268 .0010404 8 .0048269 .0037204 -.0000661 9 .0027929 .001934 -.0003961 10 .0006596 .0003323 -.0002973 11 -.0003888 -.0003696 -.000109 12 -.0005306 -.0004072 .0000101 13 -.0002994 -.0002063 .0000441 14 -.0000663 -.000032 .0000322 15 .0000452 .0000422 .0000114
A one standard deviation shock to the investment increases real GDP to 0.236 and in
period 3-6 the pattern of movement begins to decrease to -0.043 in period 5. Then between
periods 7-10 it begins to increase to 0.0048 in period 8. From period 11 it starts to decrease and
finally closes to 0.001. A one standard deviation shock to the investment decreases its own to
0.180 and between periods 3-6, the pattern of movement begins to decrease to -0.035 in period
5. The pattern has increased again between periods 7-10 to 0.0037 in period 8. Then the pattern
has decreased between periods 11-14 to -0.00041 in period 12. After slight variation, it
eventually closes to 0.001. A one standard deviation shock to the investment decreases interest
rate to -0.032 and in periods 4-7 the pattern of movement begins to increase to 0.035 in period
5. However, in periods 8-11 it decreases to -0.001 in period 8. However, after period 12 it begins
to increase and eventually closes to 0.001. Graphs of impulse response function are presented
in Appendix – XIV, which explains the time path of all multipliers. Responses of investment,
interest rate and real GDP due to shock in real GDP are provided in Table 6.15.
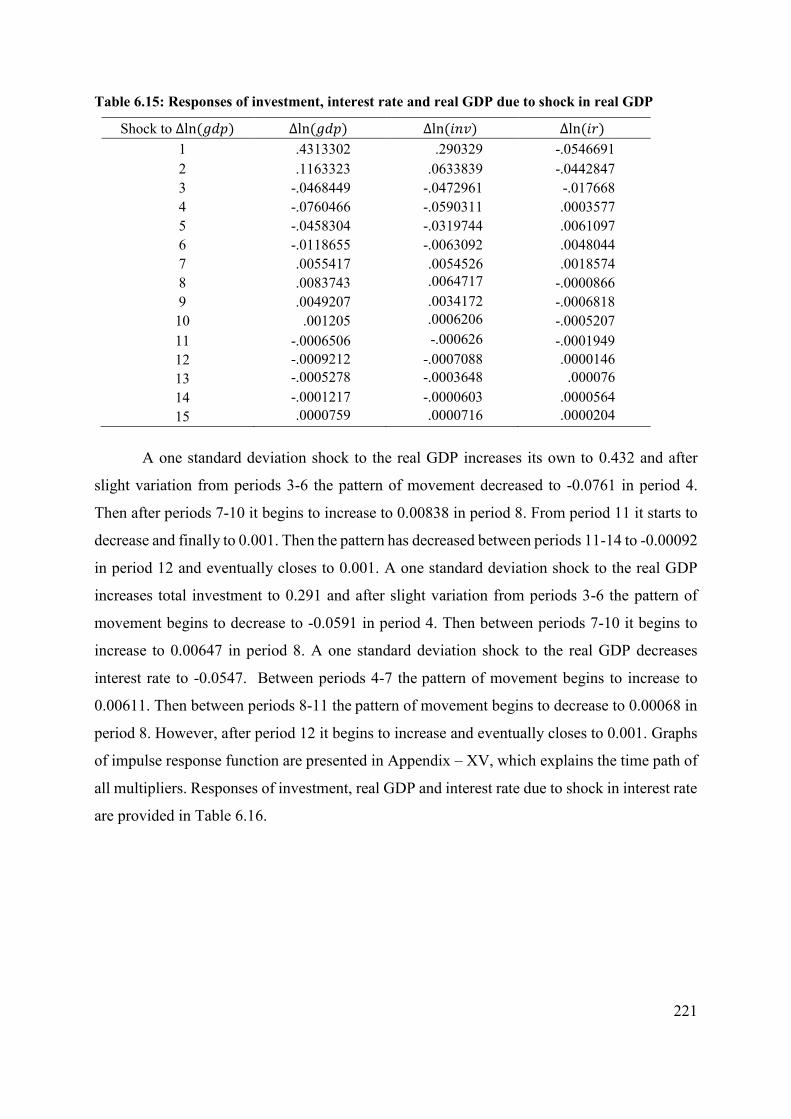
221
Table 6.15: Responses of investment, interest rate and real GDP due to shock in real GDP
Shock to ∆ln (𝑔𝑑𝑝) ∆ln (𝑔𝑑𝑝) ∆ln (𝑖𝑛𝑣) ∆ln (𝑖𝑟) 1 .4313302 .290329 -.0546691 2 .1163323 .0633839 -.0442847 3 -.0468449 -.0472961 -.017668 4 -.0760466 -.0590311 .0003577 5 -.0458304 -.0319744 .0061097 6 -.0118655 -.0063092 .0048044 7 .0055417 .0054526 .0018574 8 .0083743 .0064717 -.0000866 9 .0049207 .0034172 -.0006818 10 .001205 .0006206 -.0005207 11 -.0006506 -.000626 -.0001949 12 -.0009212 -.0007088 .0000146 13 -.0005278 -.0003648 .000076 14 -.0001217 -.0000603 .0000564 15 .0000759 .0000716 .0000204
A one standard deviation shock to the real GDP increases its own to 0.432 and after
slight variation from periods 3-6 the pattern of movement decreased to -0.0761 in period 4.
Then after periods 7-10 it begins to increase to 0.00838 in period 8. From period 11 it starts to
decrease and finally to 0.001. Then the pattern has decreased between periods 11-14 to -0.00092
in period 12 and eventually closes to 0.001. A one standard deviation shock to the real GDP
increases total investment to 0.291 and after slight variation from periods 3-6 the pattern of
movement begins to decrease to -0.0591 in period 4. Then between periods 7-10 it begins to
increase to 0.00647 in period 8. A one standard deviation shock to the real GDP decreases
interest rate to -0.0547. Between periods 4-7 the pattern of movement begins to increase to
0.00611. Then between periods 8-11 the pattern of movement begins to decrease to 0.00068 in
period 8. However, after period 12 it begins to increase and eventually closes to 0.001. Graphs
of impulse response function are presented in Appendix – XV, which explains the time path of
all multipliers. Responses of investment, real GDP and interest rate due to shock in interest rate
are provided in Table 6.16.

222
Table 6.16: Responses of investment, real GDP and interest rate due to shock in interest rate
Shock to ∆ln (𝑖𝑟) ∆ln (𝑔𝑑𝑝) ∆ln (𝑖𝑛𝑣) ∆ln (𝑖𝑟) 1 2.528718 2.088721 .209835 2 2.114347 1.549031 -.160636 3 .871412 .5576143 -.1985577 4 .0053892 -.0612006 -.1070365 5 -.2827863 -.2330388 -.0208084 6 -.2295992 -.1675795 .0185043 7 -.0917964 -.0582227 .0217641 8 .0016977 .0083107 .0114368 9 .0316145 .0258797 .0020427 10 .0249104 .0181113 -.0021227 11 .0096519 .0060639 -.0023832 12 -.000432 -.0010824 -.0012206 13 -.0035283 -.00287 -.0001981 14 -.0027002 -.0019556 .0002426 15 -.0010128 -.0006298 .0002607
A one standard deviation shock to the interest rate increases real GDP to 2.529. In the
periods 2-4 real GDP decreased to .0053. During the periods 5-7 the pattern of movement
begins to decrease to -.2828 in period 5. Then after slight variation between periods 8-11 it
increases to 0.03162 in period 9. However, after period 12 it begins to decrease and eventually
closes to -0.0011. A one standard deviation shock to the interest rate increases total investment
to 2.089. After slight variation from periods 4-7 the pattern of movement decreased to -0.2331
in period 5. Then between the periods 8-11 it increases to .0258797 in period 9. However, after
period 12 it begins to decrease and eventually closes to -0.00063. A one standard deviation
shock to the interest rate increases its own to 0.2098. Then between periods 2-5 the pattern of
movement begins to decrease to -0.1985577 in period 3. Then between periods 6-9 increased
to 0.02177 in period 7. Then the pattern decreased between periods 10-13 to -0.00238 in period
11. After slight variation, it eventually closes to 0.00026. Graphs of impulse response function
are presented in Appendix – XVI, which explains the time path of all multipliers.

223
6.6.2 Empirical results PVAR – X private investment
Table 6.17: Empirical results PVAR – X (private investment, GDP, and IR are in the dependent variable list) with exogenous variables estimated by GMM
Coefficient Standard error z P>|z| [95% confidence interval] ∆ln (𝑖𝑛𝑣1)
∆ln (𝑖𝑛𝑣1𝑖𝑡−1) .0048706 .1332849 0.04 0.971 -.256363 .2661042 ∆ln (𝑔𝑑𝑝𝑖𝑡−1) .941823 .7418183 1.27 0.204 -.5121141 2.3957
∆ln (𝑖𝑟𝑖𝑡−1) -.0789858 .1002864 -0.79 0.431 -.2755435 .117572 IC .0402946 .0587684 0.69 0.493 -.0748893 .1554784
PBC -.0103568 .0101335 -1.02 0.307 -.0302181 .0095046 PVC -.0335506 .0313025 -1.07 0.284 -.0949024 .0278012 OF1 .0620708 .0563988 1.10 0.271 -.0484689 .1726105 OF2 .0025974 .0147366 0.18 0.860 -.0262858 .0314805 OF3 .0101238 .0111463 0.91 0.364 -.0117225 .0319702 OF4 -.0083542 .0109767 -0.76 0.447 -.0298681 .0131597
∆ln (𝑔𝑑𝑝) ∆ln (𝑖𝑛𝑣1𝑖𝑡−1) .015578 .0180915 0.86 0.389 -.0198808 .0510367 ∆ln (𝑔𝑑𝑝𝑖𝑡−1) .313959 .1216667 2.58 0.010 .0754967 .5524212
∆ln (𝑖𝑟𝑖𝑡−1) -.0509222 .0195948 -2.60 0.009 -.0893272 -.0125171 IC .0184467 .0075963 2.43 0.015 .0035581 .0333352
PBC .0005834 .0022304 0.26 0.794 -.0037881 .004955 PVC -.0036775 .0040596 -0.91 0.365 -.0116341 .0042791 OF1 .0220481 .0102223 2.16 0.031 0020127 .0420835 OF2 -.002914 .0037099 -0.79 0.432 -.0101852 .0043572 OF3 -.0002058 .001881 -0.11 0.913 -.0038926 .0034809 OF4 -.0028308 .0021557 -1.31 0.189 -.0070558 .0013943
∆ln (𝑖𝑟) ∆ln (𝑖𝑛𝑣1𝑖𝑡−1) -.0881272 .1011392 -0.87 0.384 -.2863564 .110102 ∆ln (𝑔𝑑𝑝𝑖𝑡−1) 2.298148 .6073185 3.78 0.000 1.107826 3.48847
∆ln (𝑖𝑟𝑖𝑡−1) .1232269 .088082 1.40 0.162 -.0494108 .2958645 IC -.0519842 .0472683 -1.10 0.271 -.1446283 .04066
PBC -.0093198 .0093 -1.00 0.316 -.0275475 .0089079 PVC .055454 .0243159 2.28 0.023 .0077958 .1031123 OF1 .030586 .0667841 0.46 0.647 -.1003084 .1614803 OF2 -.0020408 .0165499 -0.12 0.902 -.034478 .0303965 OF3 -.0031637 .0107257 -0.29 0.768 -.0241857 .0178582 OF4 .0092031 .011808 0.78 0.436 -.0139402 .0323464
a. Private investment as dependent variable:
The estimated coefficients of ∆ln (𝑖𝑛𝑣1𝑖𝑡−1), ∆ln (𝑔𝑑𝑝𝑖𝑡−1), IC, OF1, OF2 and OF3 are
economically significant (sign consistent) but statistically insignificant in the private
investment function. In an economic sense, it indicates that a 1 percent increase in
∆ln (𝑖𝑛𝑣1𝑖𝑡−1) and ∆ln (𝑔𝑑𝑝𝑖𝑡−1) and a one level increase from low to high level in IC, OF1,
OF2 and OF3 increases ∆ln (𝑖𝑛𝑣1𝑖𝑡−1) by 0.49 percent, 94.18 percent, 9.03 percent, 6.21
percent, 0.26 percent and 1.12 percent. A one level increase from low to high level in PBC and
PVC decreases private investment by 1.04 percent and 3.36 percent. The results indicate that
∆ln (𝑖𝑛𝑣1𝑖𝑡−1) and OF2 are inelastic. The estimated coefficient of ∆ln (𝑖𝑟𝑖𝑡−1) is found to be

224
negative as expected. The interest rate has corrected sign, which is economically significant but
statistically insignificant.
b. Real GDP as dependent variable The estimated coefficient of ∆ln (𝑖𝑛𝑣1𝑖𝑡−1) and PBC are economically significant (sign
consistent) but statistically insignificant in the private investment model function. In an
economic sense, it indicates that a 1 percent increase in ∆ln (𝑖𝑛𝑣1𝑖𝑡−1) and PVC increases
∆ ln(𝑔𝑑𝑝) by 1.56 percent and 0.06 percent respectively. The estimated coefficient of
∆ ln(𝑔𝑑𝑝𝑖𝑡−1), IC and OF1 are economically and statistically significant in the investment model.
In an economic sense, it indicates that a 1 percent increase in ∆ln (𝑔𝑑𝑝𝑖𝑡−1) the IC and OF1
increases the GDP by 31.40 percent and 2.21 percent respectively. The coefficients of PVC,
OF2, OF3 and OF4 are statistically and economically insignificant (not sign consistent). The
results indicate that PBC, OF2, OF3 and OF4 are inelastic. The estimated coefficient of
∆ln (𝑖𝑟𝑖𝑡−1) is found to be negative as expected. The interest rate has correct sign, which is
economically and statistically significant.
c. Interest rate as dependent variable: The estimated coefficients of ∆ln (𝑖𝑛𝑣1𝑖𝑡−1), IC, PBC, OF2 and OF3 are statistically
and economically insignificant (not sign consistent) in the private investment model function.
The coefficients of ∆ ln(𝑔𝑑𝑝𝑖𝑡−1) and PVC are economically and statistically significant. In an
economic sense, it indicates that a 1 percent increase in ∆ ln(𝑔𝑑𝑝𝑖𝑡−1) and PVC increases
interest rate by 229.84 percent and 5.55 percent respectively. The coefficients of OF1 and OF4
are economically significant but statistically insignificant. The results indicate that PBC, OF2,
OF3 and OF4 are inelastic. The estimated coefficient of ∆ln (𝑖𝑟𝑖𝑡−1) is found to be statistically
and economically insignificant (not sign consistent).
Based on the above test results the investment model can be used for infrastructural
development policy decisions making in the context of Pakistan. Eigenvalue for stability
condition is provided in Table 6.18 and Figure 6.6.
Table 6.18: Eigenvalue for stability condition
Eigenvalue Real Imaginary Modulus
.3962779
.3962779 -.1205117
-.2569215 .2569215 0.00000
.4722762
.4722762
.1205117
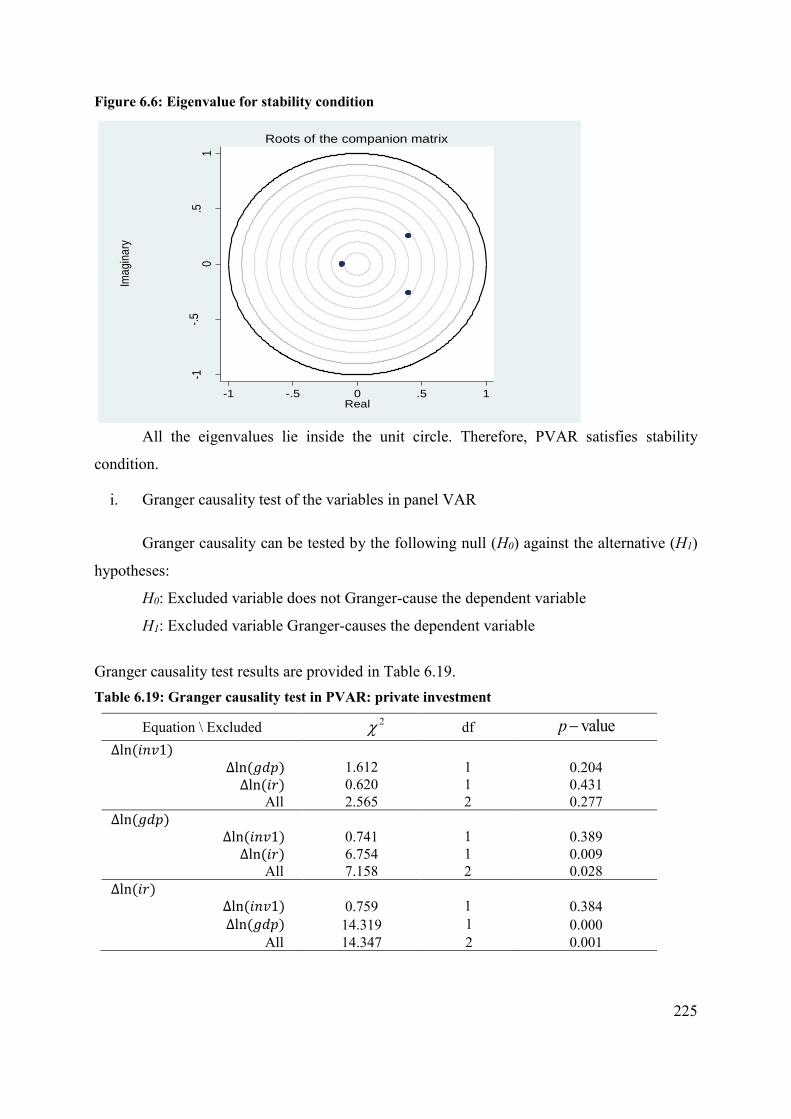
225
Figure 6.6: Eigenvalue for stability condition
All the eigenvalues lie inside the unit circle. Therefore, PVAR satisfies stability
condition.
i. Granger causality test of the variables in panel VAR
Granger causality can be tested by the following null (H0) against the alternative (H1)
hypotheses:
H0: Excluded variable does not Granger-cause the dependent variable
H1: Excluded variable Granger-causes the dependent variable
Granger causality test results are provided in Table 6.19. Table 6.19: Granger causality test in PVAR: private investment
Equation \ Excluded 2 df valuep−
∆ln (𝑖𝑛𝑣1) ∆ln (𝑔𝑑𝑝) 1.612 1 0.204
∆ln (𝑖𝑟) 0.620 1 0.431 All 2.565 2 0.277
∆ln (𝑔𝑑𝑝) ∆ln (𝑖𝑛𝑣1) 0.741 1 0.389
∆ln (𝑖𝑟) 6.754 1 0.009 All 7.158 2 0.028
∆ln (𝑖𝑟) ∆ln (𝑖𝑛𝑣1) 0.759 1 0.384 ∆ln (𝑔𝑑𝑝) 14.319 1 0.000
All 14.347 2 0.001
-1-.
50
.51
Ima
gin
ary
-1 -.5 0 .5 1Real
Roots of the companion matrix

226
In the change of private investment equation ∆ln (𝑔𝑑𝑝) and ∆ln (𝑖𝑟) variables do not
cause∆ln (𝑖𝑛𝑣1) neither individually nor jointly. In the change in real GDP equation the variable
∆ln (𝑖𝑛𝑣1) does not cause ∆ln (𝑔𝑑𝑝) . Whereas, the variables ∆ln (𝑖𝑛𝑣1) and ∆ln (𝑖𝑟) jointly
cause ∆ln (𝑔𝑑𝑝) . In the change in interest rate equation the variable ∆ln (𝑖𝑛𝑣1) does not cause
∆ln (𝑖𝑟) individually. However, the variable ∆ln (𝑔𝑑𝑝) do cause ∆ln (𝑖𝑟) individually and jointly
with the variables ∆ ln(𝑖𝑛𝑣1) .
ii. Variance decomposition in panel VAR investment model
The results from the variance decomposition in panel VAR private investment model
are presented in the following table.
Table 6.20: Forecast-error variance decomposition
Response variable Forecast horizon
Impulse variables ∆ln (𝑖𝑛𝑣1) ∆ln (𝑔𝑑𝑝) ∆ln (𝑖𝑟)
∆ln (𝑖𝑛𝑣1) 1 1 0 0 5 .9427437 .0463912 .0108651 10 .9427231 .0464022 .0108747
∆ln (𝑔𝑑𝑝) 1 .0632559 .9367441 0 5 .0764661 .8549083 .0686256 10 .0764712 .8548692 .0686597
∆ln (𝑖𝑟) 1 .006789 .108008 .885203 5 .0107622 .2276572 .7615806 10 .0107694 .2277227 .7615079
The response of private investment, real GDP and interest rate due to shock to private
investment:
A one standard deviation shock to private investment both in the short run (period 5)
and long run (period 10) causes 94.2 percent fluctuation to the variance in its own shock,
approximately 4.63 percent in the change in real GDP and 1.09 percent in the change in interest
rate. This means due to shock to private investment over the periods of 5 years and 10 years
causes no change to its own, real GDP and interest rate.
The response of private investment, real GDP and interest rate due to shock to real GDP:
A one standard deviation shock to real GDP in short run and long run causes 85.5
percent fluctuation in the variance in its own shock, approximately 7.7 percent in private

227
investment and 6.9 percent in the interest rate. This means due to shock in real GDP over the
periods of five years and 10 years causes no change to its own, private investment and interest
rate.
The response of private investment, real GDP and interest rate due to shock to interest rate:
A one standard deviation shock to the interest rate in the short and long run causes a
1.08 percent fluctuation in the variance in its own shock, approximately 1.07 percent in private
investment and 22.77 percent in real GDP. This means due to shock in interest rate over the
periods of five years and 10 years causes no change to its own, private investment and real
GDP.
iii. Impulse response analysis
The results from the impulse response function are presented in Table 6.21, Table 6.22
and Table 6.23:
Table 6.21: Responses of private investment, real GDP and interest rate due to shock in private investment
Shock to ∆ln (𝑖𝑛𝑣1) ∆ln (𝑔𝑑𝑝) ∆ln (𝑖𝑛𝑣1) ∆ln (𝑖𝑟) 1 .9418231 .0048706 -.0789858 2 .9418231 .0048706 -.0789858 3 -.0757887 .0070737 -.0149148 4 -.0514087 .0001682 .0014627 5 -.0126203 -.0009289 .0027848 6 .0015627 -.0004465 .0010592 7 .0025042 -.0000712 .0000862 8 .0009173 .0000311 -.0001113 9 .0000615 .0000242 -.0000629
10 -.0001023 6.62e-06 -.0000128 11 -.0000553 -4.34e-07 3.11e-06 12 -.0000106 -1.14e-06 3.23e-06 13 3.03e-06 -4.56e-07 1.03e-06 14 2.89e-06 -4.58e-08 8.76e-09 15 8.83e-07 4.40e-08 -1.42e-07
A one standard deviation shock to the private investment increases real GDP to .942.
Then in periods 3-5 the pattern of movement begins to decrease to -.0758 in step 3 and during
periods 6-9 it increases to 0.0025 in period 7 and during periods 10-12 it again decreased to -
0.00011. Eventually, it approaches zero. (8.83e-07). A one standard deviation shock to the
private investment increases to .00488 of its own shock. Then in periods 5-7 the pattern of
movement decreased to -0.00093 in period 5. During the periods 8-10 it again approaches zero
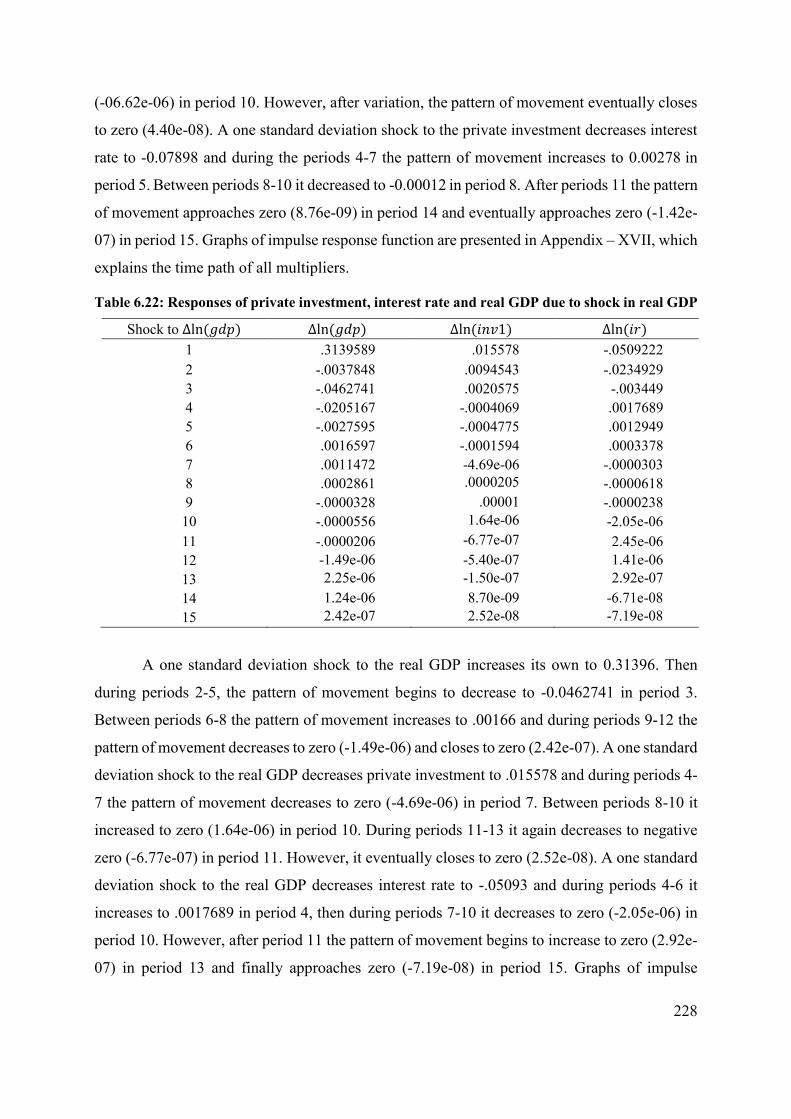
228
(-06.62e-06) in period 10. However, after variation, the pattern of movement eventually closes
to zero (4.40e-08). A one standard deviation shock to the private investment decreases interest
rate to -0.07898 and during the periods 4-7 the pattern of movement increases to 0.00278 in
period 5. Between periods 8-10 it decreased to -0.00012 in period 8. After periods 11 the pattern
of movement approaches zero (8.76e-09) in period 14 and eventually approaches zero (-1.42e-
07) in period 15. Graphs of impulse response function are presented in Appendix – XVII, which
explains the time path of all multipliers.
Table 6.22: Responses of private investment, interest rate and real GDP due to shock in real GDP
Shock to ∆ln (𝑔𝑑𝑝) ∆ln (𝑔𝑑𝑝) ∆ln (𝑖𝑛𝑣1) ∆ln (𝑖𝑟) 1 .3139589 .015578 -.0509222 2 -.0037848 .0094543 -.0234929 3 -.0462741 .0020575 -.003449 4 -.0205167 -.0004069 .0017689 5 -.0027595 -.0004775 .0012949 6 .0016597 -.0001594 .0003378 7 .0011472 -4.69e-06 -.0000303 8 .0002861 .0000205 -.0000618 9 -.0000328 .00001 -.0000238
10 -.0000556 1.64e-06 -2.05e-06 11 -.0000206 -6.77e-07 2.45e-06 12 -1.49e-06 -5.40e-07 1.41e-06 13 2.25e-06 -1.50e-07 2.92e-07 14 1.24e-06 8.70e-09 -6.71e-08 15 2.42e-07 2.52e-08 -7.19e-08
A one standard deviation shock to the real GDP increases its own to 0.31396. Then
during periods 2-5, the pattern of movement begins to decrease to -0.0462741 in period 3.
Between periods 6-8 the pattern of movement increases to .00166 and during periods 9-12 the
pattern of movement decreases to zero (-1.49e-06) and closes to zero (2.42e-07). A one standard
deviation shock to the real GDP decreases private investment to .015578 and during periods 4-
7 the pattern of movement decreases to zero (-4.69e-06) in period 7. Between periods 8-10 it
increased to zero (1.64e-06) in period 10. During periods 11-13 it again decreases to negative
zero (-6.77e-07) in period 11. However, it eventually closes to zero (2.52e-08). A one standard
deviation shock to the real GDP decreases interest rate to -.05093 and during periods 4-6 it
increases to .0017689 in period 4, then during periods 7-10 it decreases to zero (-2.05e-06) in
period 10. However, after period 11 the pattern of movement begins to increase to zero (2.92e-
07) in period 13 and finally approaches zero (-7.19e-08) in period 15. Graphs of impulse
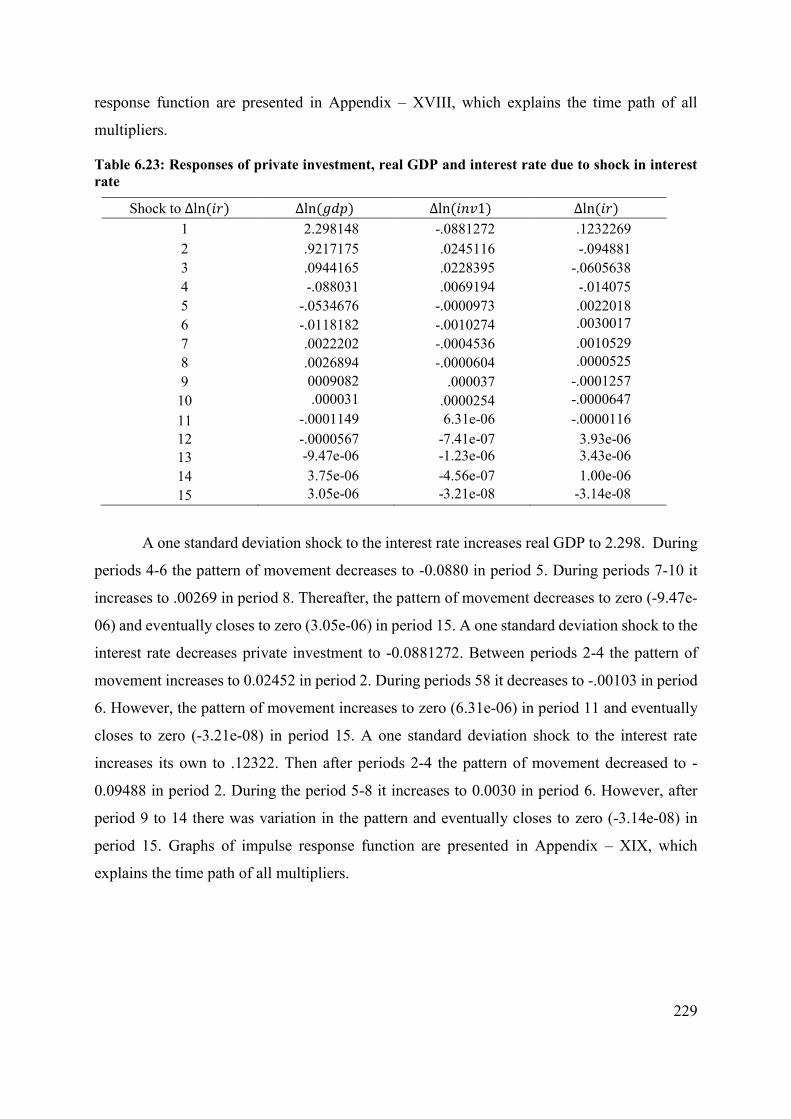
229
response function are presented in Appendix – XVIII, which explains the time path of all
multipliers.
Table 6.23: Responses of private investment, real GDP and interest rate due to shock in interest rate
Shock to ∆ln (𝑖𝑟) ∆ln (𝑔𝑑𝑝) ∆ln (𝑖𝑛𝑣1) ∆ln (𝑖𝑟) 1 2.298148 -.0881272 .1232269 2 .9217175 .0245116 -.094881 3 .0944165 .0228395 -.0605638 4 -.088031 .0069194 -.014075 5 -.0534676 -.0000973 .0022018 6 -.0118182 -.0010274 .0030017 7 .0022202 -.0004536 .0010529 8 .0026894 -.0000604 .0000525 9 0009082 .000037 -.0001257
10 .000031 .0000254 -.0000647 11 -.0001149 6.31e-06 -.0000116 12 -.0000567 -7.41e-07 3.93e-06 13 -9.47e-06 -1.23e-06 3.43e-06 14 3.75e-06 -4.56e-07 1.00e-06 15 3.05e-06 -3.21e-08 -3.14e-08
A one standard deviation shock to the interest rate increases real GDP to 2.298. During
periods 4-6 the pattern of movement decreases to -0.0880 in period 5. During periods 7-10 it
increases to .00269 in period 8. Thereafter, the pattern of movement decreases to zero (-9.47e-
06) and eventually closes to zero (3.05e-06) in period 15. A one standard deviation shock to the
interest rate decreases private investment to -0.0881272. Between periods 2-4 the pattern of
movement increases to 0.02452 in period 2. During periods 58 it decreases to -.00103 in period
6. However, the pattern of movement increases to zero (6.31e-06) in period 11 and eventually
closes to zero (-3.21e-08) in period 15. A one standard deviation shock to the interest rate
increases its own to .12322. Then after periods 2-4 the pattern of movement decreased to -
0.09488 in period 2. During the period 5-8 it increases to 0.0030 in period 6. However, after
period 9 to 14 there was variation in the pattern and eventually closes to zero (-3.14e-08) in
period 15. Graphs of impulse response function are presented in Appendix – XIX, which
explains the time path of all multipliers.

230
6.6.3 Empirical results PVAR – X public investment
Table 6.24: Empirical results of PVAR – X (public investment, GDP, and IR are the dependent variables with exogenous variables) model estimated by GMM.
Coefficient Standard error z P>|z| [95% confidence interval] ∆ln (𝑖𝑛𝑣2)
∆ln (𝑖𝑛𝑣2𝑖𝑡−1) -.0213319 .2600302 -0.08 0.935 -.5309818 .4883179 ∆ln (𝑔𝑑𝑝𝑖𝑡−1) -.1102619 .0877743 -1.26 0.209 -.2822963 .061772
∆ln (𝑖𝑟𝑖𝑡−1) -.006144 .0118231 -0.52 0.603 -.0293169 .0170288 IC .0114822 .0074919 1.53 0.125 -.0032016 .026166
PBC .0000349 .0010186 0.03 0.973 -.0019615 .0020314 PVC -.0036282 .0032914 -1.10 0.270 -.0100793 .0028228 OF1 .0065198 .0051224 1.27 0.203 -.0035199 .0165595 OF2 -.0003488 .0022348 -0.16 0.876 -.0047289 .0040313 OF3 .0006531 .0013174 0.50 0.620 -.001929 .0032353 OF4 -.0013256 .0011796 -1.12 0.261 -.0036375 .0009863
∆ln (𝑔𝑑𝑝) ∆ln (𝑖𝑛𝑣2𝑖𝑡−1) -1.11361 .4445307 -2.51 0.012 -1.984874 -.2423457 ∆ln (𝑔𝑑𝑝𝑖𝑡−1) .5513185 .1667712 3.31 0.001 .2244529 .8781841
∆ln (𝑖𝑟𝑖𝑡−1) -.0528224 .0276189 -1.91 0.056 -.1069544 .001309 IC .0237651 .0136003 1.75 0.081 -.0028909 .0504212
PBC .0009441 .0029113 0.32 0.746 -.0047619 .0066501 PVC -.0027927 .0061056 -0.46 0.647 -.0147595 .0091741 OF1 .0136735 .0148444 0.92 0.357 -.015421 .042768 OF2 -.0000856 .0049849 -0.02 0.986 -.0098558 .0096846 OF3 -.0003678 .0028279 -0.13 0.897 -.0059104 .0051747 OF4 -.0029835 .0031018 -0.96 0.336 -.0090628 .0030959
∆ln (𝑖𝑟) ∆ln (𝑖𝑛𝑣2𝑖𝑡−1) 5.862355 2.381199 2.46 0.014 1.195291 10.52942 ∆ln (𝑔𝑑𝑝𝑖𝑡−1) 1.098554 .5755739 1.91 0.056 -.0295498 2.226659
∆ln (𝑖𝑟𝑖𝑡−1) .1998075 .0794644 2.51 0.012 .0440602 .3555548 IC -.0703649 .0501291 -1.40 0.160 -.1686161 .0278862
PBC -.0203911 .0095576 -2.13 0.033 -.0391238 -.0016585 PVC .0565129 .0268713 2.10 0.035 .003846 .1091797 OF1 .0658925 .0651996 1.01 0.312 -.0618964 .1936814 OF2 -.0253661 .0166169 -1.53 0.127 -.0579346 .0072024 OF3 -.0017669 .0112039 -0.16 0.875 -.0237261 .0201924 OF4 .0042375 .0114248 0.37 0.711 -.0181546 .026629
a. Public investment as dependent variable:
The estimated coefficients of ∆ln (𝑖𝑛𝑣2𝑖𝑡−1), ∆ln (𝑔𝑑𝑝𝑖𝑡−1), PVC, OF2 and OF4 are
statistically and economically insignificant (negative sign) in the public investment function. In
an economic sense, it indicates that a 1 percent increase in ∆ln (𝑖𝑛𝑣2𝑖𝑡−1), ∆ln (𝑔𝑑𝑝𝑖𝑡−1), PVC,
OF2 and OF4 decreases public investment by 2.14 percent, 11.03 percent, 0.36 percent, 0.04
percent and .014 percent. The estimated coefficients of IC, PBC, OF1 and OF3 are sign
consistent with economic theory but statistically insignificant in the public investment model
function. In an economic sense, it indicates that a 1 percent increase in IC, PBC, OF1 and OF3
increases public investment by 1.15 percent, 0.01 percent, 0.65 percent and 0.07 percent. The

231
results indicate that PBC, PVC, OF2, OF3 and OF4 are inelastic. The estimated coefficient of
∆ln (𝑖𝑟𝑖𝑡−1) is found to be negative as expected. The variable ∆ln (𝑖𝑟𝑖𝑡−1) is economically
significant (sign consistent) but statistically insignificant.
b. Real GDP as dependent variable:
The estimated coefficient of ∆ln (𝑖𝑛𝑣2𝑖𝑡−1) is economically insignificant but
statistically significant in public investment model function. In an economic sense, it indicates
that a 1 percent increase in ∆ln (𝑖𝑛𝑣2𝑖𝑡−1) decreases ∆ ln(𝑔𝑑𝑝) by 111.36 percent. The
estimated coefficient of ∆ ln(𝑔𝑑𝑝𝑖𝑡−1) is economically and statistically significant in the public
investment model function. In an economic sense, it indicates that a 1 percent increase in
∆ln (𝑔𝑑𝑝𝑖𝑡−1) increases GDP by 55.13 percent. The estimated coefficient of IC is economically
and statistically significant at 10 percent. The estimated coefficients of PBC and OF1 are
economically significant but statistically insignificant. The estimated coefficients of PVC, OF2,
OF3 and OF4 are economically and statistically insignificant. The results indicate that
∆ ln(𝑖𝑛𝑣2𝑖𝑡−1) , ∆ln (𝑔𝑑𝑝𝑖𝑡−1) and IC are elastic. The estimated coefficient of ∆ln (𝑖𝑟𝑖𝑡−1) is found
to be negative as expected. The interest rate has corrected sign, which is economically and
statistically significant.
c. Interest rate as dependent variable:
The estimated coefficient of ∆ln (𝑖𝑛𝑣2𝑖𝑡−1), ∆ ln(𝑔𝑑𝑝𝑖𝑡−1) and PVC are economically
and statistically significant in the public investment model function. In an economic sense, it
indicates that a 1 percent increase in ∆ln (𝑖𝑛𝑣2𝑖𝑡−1), ∆ ln(𝑔𝑑𝑝𝑖𝑡−1) and PVC increases
∆ln (𝑖𝑟𝑖𝑡−1) by 586.23 percent, 109.86 percent, and 5.65 percent respectively. The estimated
coefficients of IC, OF2, OF3 and OF4 are economically and statistically insignificant. The
estimated coefficient of PBC is economically insignificant but statistically significant. The
estimated coefficient of OF1 is economically significant but statistically insignificant. The
estimated coefficients of ∆ln (𝑖𝑟𝑖𝑡−1), IC and OF2 are found to be economically insignificant
(not sign consistent) but statistically significant. The results indicate that OF3 and OF4 are
inelastic.
Based on the above test results the investment model can be used for infrastructural
development policy decisions making in the context of Pakistan. Eigenvalue for stability
condition is provided in Table 6.25 and Figure 6.7.
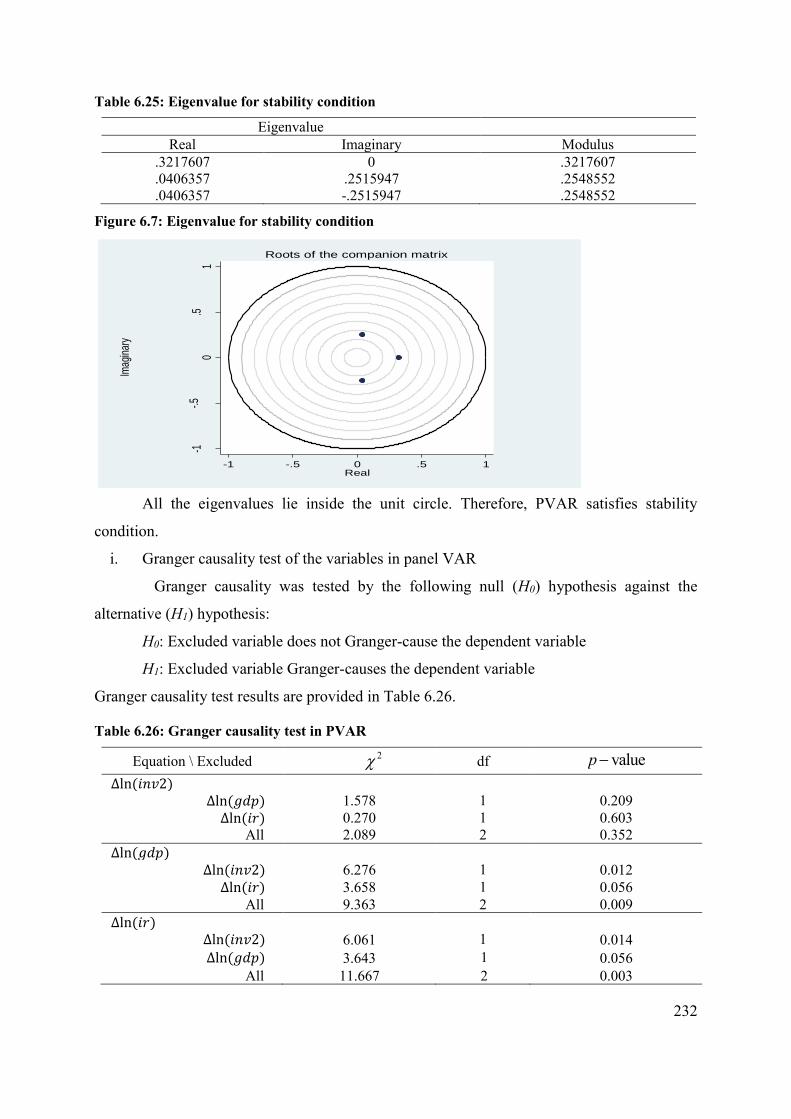
232
Table 6.25: Eigenvalue for stability condition
Eigenvalue Real Imaginary Modulus
.3217607
.0406357
.0406357
0 .2515947 -.2515947
.3217607
.2548552
.2548552
Figure 6.7: Eigenvalue for stability condition
All the eigenvalues lie inside the unit circle. Therefore, PVAR satisfies stability
condition.
i. Granger causality test of the variables in panel VAR
Granger causality was tested by the following null (H0) hypothesis against the
alternative (H1) hypothesis:
H0: Excluded variable does not Granger-cause the dependent variable
H1: Excluded variable Granger-causes the dependent variable
Granger causality test results are provided in Table 6.26.
Table 6.26: Granger causality test in PVAR
Equation \ Excluded 2 df valuep−
∆ln (𝑖𝑛𝑣2) ∆ln (𝑔𝑑𝑝) 1.578 1 0.209
∆ln (𝑖𝑟) 0.270 1 0.603 All 2.089 2 0.352
∆ln (𝑔𝑑𝑝) ∆ln (𝑖𝑛𝑣2) 6.276 1 0.012
∆ln (𝑖𝑟) 3.658 1 0.056 All 9.363 2 0.009
∆ln (𝑖𝑟) ∆ln (𝑖𝑛𝑣2) 6.061 1 0.014 ∆ln (𝑔𝑑𝑝) 3.643 1 0.056
All 11.667 2 0.003
-1-.5
0.5
1
Imag
inar
y
-1 -.5 0 .5 1Real
Roots of the companion matrix
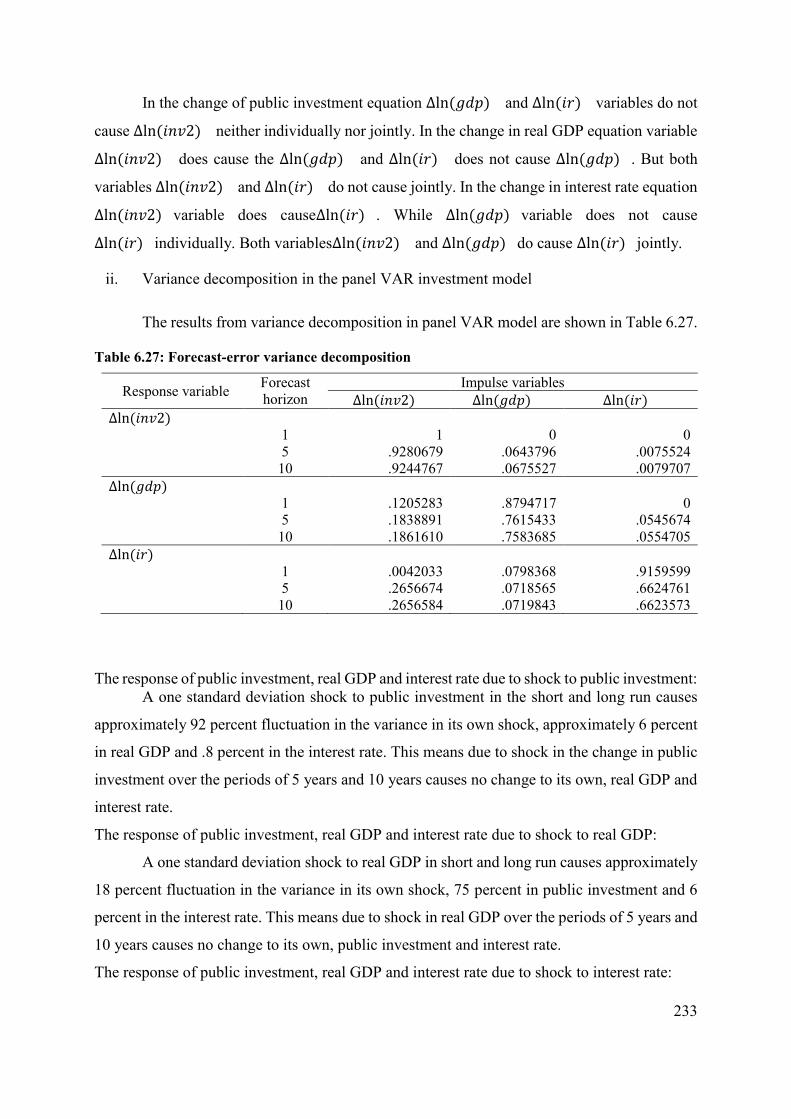
233
In the change of public investment equation ∆ln (𝑔𝑑𝑝) and ∆ln (𝑖𝑟) variables do not
cause ∆ln (𝑖𝑛𝑣2) neither individually nor jointly. In the change in real GDP equation variable
∆ln (𝑖𝑛𝑣2) does cause the ∆ln (𝑔𝑑𝑝) and ∆ln (𝑖𝑟) does not cause ∆ln (𝑔𝑑𝑝) . But both
variables ∆ln (𝑖𝑛𝑣2) and ∆ln (𝑖𝑟) do not cause jointly. In the change in interest rate equation
∆ln (𝑖𝑛𝑣2) variable does cause∆ln (𝑖𝑟) . While ∆ln (𝑔𝑑𝑝) variable does not cause
∆ln (𝑖𝑟) individually. Both variables∆ln (𝑖𝑛𝑣2) and ∆ln (𝑔𝑑𝑝) do cause ∆ln (𝑖𝑟) jointly.
ii. Variance decomposition in the panel VAR investment model
The results from variance decomposition in panel VAR model are shown in Table 6.27.
Table 6.27: Forecast-error variance decomposition
Response variable Forecast horizon
Impulse variables ∆ln (𝑖𝑛𝑣2) ∆ln (𝑔𝑑𝑝) ∆ln (𝑖𝑟)
∆ln (𝑖𝑛𝑣2) 1 1 0 0 5 .9280679 .0643796 .0075524 10 .9244767 .0675527 .0079707
∆ln (𝑔𝑑𝑝) 1 .1205283 .8794717 0 5 .1838891 .7615433 .0545674 10 .1861610 .7583685 .0554705
∆ln (𝑖𝑟) 1 .0042033 .0798368 .9159599 5 .2656674 .0718565 .6624761
10 .2656584 .0719843 .6623573 The response of public investment, real GDP and interest rate due to shock to public investment:
A one standard deviation shock to public investment in the short and long run causes
approximately 92 percent fluctuation in the variance in its own shock, approximately 6 percent
in real GDP and .8 percent in the interest rate. This means due to shock in the change in public
investment over the periods of 5 years and 10 years causes no change to its own, real GDP and
interest rate.
The response of public investment, real GDP and interest rate due to shock to real GDP:
A one standard deviation shock to real GDP in short and long run causes approximately
18 percent fluctuation in the variance in its own shock, 75 percent in public investment and 6
percent in the interest rate. This means due to shock in real GDP over the periods of 5 years and
10 years causes no change to its own, public investment and interest rate.
The response of public investment, real GDP and interest rate due to shock to interest rate:

234
A one standard deviation shock to the interest rate in short and long run causes 27
percent fluctuation in the variance in its own shock, 7.1 percent in public investment and 66
percent in real GDP. This means due to shock to the interest rate over the periods of 5 years and
10 years causes no change to its own, public investment and real GDP.
iii. Impulse response analysis The impulse response analysis results are provided in Table 6.28, Table 6.29 and Table 6.30.
Table 6.28: Responses of public investment, real GDP and interest rate due to shock in public investment
Shock to ∆ln (𝑖𝑛𝑣2) ∆ln (𝑔𝑑𝑝) ∆ln (𝑖𝑛𝑣2) ∆ln (𝑖𝑟) 1 -.1102619 -.0213319 -.006144 2 -.0651869 .0872255 .0047277 3 -.0403627 .0984478 .0038521 4 -.028876 .0654303 .0022969 5 -.0206111 .0442259 .0015822 6 -.0145016 .0312849 .0011331 7 -.0101997 .0221246 .0008002 8 -.0071837 .0155776 .0005627 9 -.0050599 .0109665 .0003962 10 -.0035636 .0077235 .0002791 11 -.0025097 .0054397 .0001965 12 -.0017675 .003831 .0001384 13 -.0012448 .0026981 .0000975 14 -.0008767 .0019002 .0000687 15 -.0006174 .0013382 .0000484
A one standard deviation shock to the public investment increases real GDP to -0.11026
and after periods 2-14 the pattern of movement begins to decrease to -0.06519 in period 2 and
eventually closes to -0.00062. A one standard deviation shock to the public investment
decreases its own to -.02134. During the periods 2-14 with a slight variation, the pattern of
movement increases to 0.0984478 in period 3 and finally closes to 0.00134. A one standard
deviation shock to the public investment decreases interest rate to -0.00615. In the periods 2-
14 the pattern of movement increases to 0.00356. In period 5 it decreases to -0.00027. During
the periods 614 with variation the pattern of movement increases to 0.00473 in period 2 and
eventually closes to 0.000048. Graphs of the impulse response function are presented in
Appendix – XX, which explains the time path of all multipliers.

235
Table 6.29: Responses of public investment, interest rate and real GDP due to shock in real GDP
Shock to ∆ln (𝑔𝑑𝑝) ∆ln (𝑔𝑑𝑝) ∆ln (𝑖𝑛𝑣2) ∆ln (𝑖𝑟) 1 .5513185 -1.11361 -.0528224 2 .3687125 -.8998622 -.0328343 3 .2664283 -.5838923 -.0205081 4 .1887387 -.4044673 -.0145836 5 .1326316 -.2870476 -.0103985 6 .0933493 -.2025363 -.00732 7 .0657558 -.1425467 -.0051491 8 .0463133 -.1003717 -.0036264 9 .0326167 -.0706931 -.0025543 10 .0229709 -.0497884 -.0017989 11 .0161779 -.0350645 -.0012669 12 .0113937 -.024695 -.0008923 13 .0080243 -.017392 -.0006284 14 .0056513 -.0122488 -.0004426 15 .00398 -.0086265 -.0003117
A one standard deviation shock to the real GDP increases its own to 0.53132. Between
the periods 2-14 the pattern of movement begins to increase to 0.36872 in period 2 and finally
closes to 0.00398. A one standard deviation shock to the real GDP increases public investment
to -1.1136. Between the periods 2-14 the pattern of movement decreases to -0.89986 in period
2 and closes to -0.00863. A one standard deviation shock to the real GDP decreases the interest
rate to -0.05283. Then between periods 2-14 the pattern of movement begins to decrease to
-0.03284 in the period 2 and eventually closes to -0.00032. Graphs of the impulse response
function are presented in Appendix – XXI, which explains the time path of all multipliers.
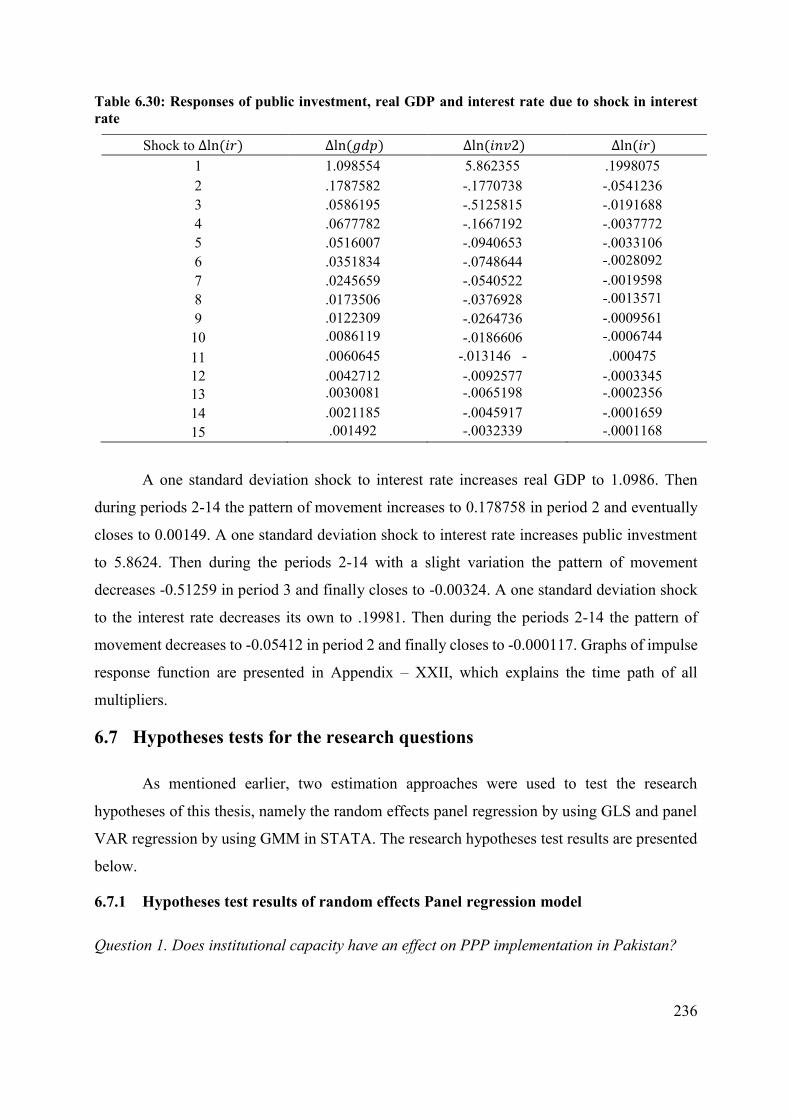
236
Table 6.30: Responses of public investment, real GDP and interest rate due to shock in interest rate
Shock to ∆ln (𝑖𝑟) ∆ln (𝑔𝑑𝑝) ∆ln (𝑖𝑛𝑣2) ∆ln (𝑖𝑟) 1 1.098554 5.862355 .1998075 2 .1787582 -.1770738 -.0541236 3 .0586195 -.5125815 -.0191688 4 .0677782 -.1667192 -.0037772 5 .0516007 -.0940653 -.0033106 6 .0351834 -.0748644 -.0028092 7 .0245659 -.0540522 -.0019598 8 .0173506 -.0376928 -.0013571 9 .0122309 -.0264736 -.0009561
10 .0086119 -.0186606 -.0006744 11 .0060645 -.013146 - .000475 12 .0042712 -.0092577 -.0003345 13 .0030081 -.0065198 -.0002356 14 .0021185 -.0045917 -.0001659 15 .001492 -.0032339 -.0001168
A one standard deviation shock to interest rate increases real GDP to 1.0986. Then
during periods 2-14 the pattern of movement increases to 0.178758 in period 2 and eventually
closes to 0.00149. A one standard deviation shock to interest rate increases public investment
to 5.8624. Then during the periods 2-14 with a slight variation the pattern of movement
decreases -0.51259 in period 3 and finally closes to -0.00324. A one standard deviation shock
to the interest rate decreases its own to .19981. Then during the periods 2-14 the pattern of
movement decreases to -0.05412 in period 2 and finally closes to -0.000117. Graphs of impulse
response function are presented in Appendix – XXII, which explains the time path of all
multipliers.
6.7 Hypotheses tests for the research questions
As mentioned earlier, two estimation approaches were used to test the research
hypotheses of this thesis, namely the random effects panel regression by using GLS and panel
VAR regression by using GMM in STATA. The research hypotheses test results are presented
below.
6.7.1 Hypotheses test results of random effects Panel regression model
Question 1. Does institutional capacity have an effect on PPP implementation in Pakistan?

237
This research question can be translated into the following econometrically testable
hypothesis.
0H : IC = 0
1H : IC 0
In the total investment function
The null hypothesis is rejected at the 10 percent level of significance, implying that
institutional capacity has an impact on total investment function (both public and private
jointly).
a. While in the Private investment function
The null hypothesis is not rejected (p-value of the test is of 0.19), which means
institutional capacity is not statistically significant at the conventional 5 percent level of
significance. Based on the test result it is concluded that the institutions do not have the
capacity/framework to influence the private sector to invest in PPP infrastructure development
in Pakistan. That is, the private sector does not have a favourable institutional framework for
investing in PPP infrastructure. This is expected for Pakistan’s PPP infrastructure investment.
b. In the public investment function
Institutional capacity is not statistically significant. The results indicate that the public
sector does not have the capacity to manage PPP programs in Pakistan effectively.
Question 2. Does the private sector have the capacity to implement PPP programs in Pakistan?
This research question can be translated into the following econometrically testable
hypothesis
0H : PVC = 0 1H : PVC 0
a. In the total investment function
The null hypothesis is rejected at the 7 percent (P-Value=0.061) level of significance,
implying that private-sector capacity has an impact on total investment function. It means
238
private-sector capacity can affect total PPP investment (public and private investment) in
Pakistan.
b. In the private investment function
The null hypothesis is not rejected (p-value of 0.176) which means private-sector
capacity is not statistically significant at the conventional level. Thus, the private sector does
not have the capacity for investing in PPP infrastructure procurement in Pakistan. This is what
was expected for Pakistan’s PPP infrastructure investment.
c. In the public investment function
The null hypothesis is not rejected (p-value of 0.22), which means private-sector
capacity is not significant statistically. Thus, the public sector does not have the capacity for
influencing private sector to invest in PPP infrastructure in Pakistan.
Question 2.1. Do other factors have an effect on PPP implementation in Pakistan?
This research question can be translated into the following econometrically testable
hypothesis.
H0: βOF1 = βOF2 = βOF3 = βOF4 = 0
H0: βOF1 ≠ βOF2 ≠ βOF3 ≠ βOF4 ≠ 0
a. In the total investment function
The null hypothesis is rejected at 10 percent level of significance. Thus, other factors
have significant effects jointly in the total investment function. For the purpose of policy, the
government should review its policy for implementation of PPP programs in Pakistan.
b. In the private investment function
The null hypothesis is rejected at 10 percent level of significance. Thus, other factors
are deterring the private sectors from investment in PPP infrastructure. Therefore, the
government should review its policy for implementation of PPP programs in Pakistan.
c. In the public investment function
The null hypothesis is not rejected at the 10 percent level of significance. Furthermore,
the joint effect of other factors is statistically insignificant at convention level in the public
239
infrastructure investment model. The test result indicates that other factors are discouraging the
public sector from investment in PPP infrastructure. These results suggest that the Government
of Pakistan should review its policies for implementation of PPP programs in Pakistan.
Other factors are not significant under private- and public-sector investment as well as
under total investment (private and public). It means other factors do have an impact on
investments and should be promoted for PPP infrastructure investment in Pakistan.
Question 3. Does the public sector have the capacity to implement PPP programs in Pakistan?
The influence of the public sector capacity (PBC) on undertaking PPP for infrastructure
development can be tested by the following hypotheses:
0H : PBC = 0
1H : PBC 0
a. In the total investment function
The null hypothesis is rejected at the 10 percent level of significance (p-value of 0.066),
implying that the public sector capacity has an impact on total investment function. It means
public sector capacity can affect total PPP investment (public and private investment) in
Pakistan. In other words, the public sector can use its capacity much better where joint
investment (public and the private investment) exists.
b. In the private investment function
The null hypothesis cannot be rejected at the conventional level of significance (p-value
of 0.134) which means the private sector does not have the capacity for investing in PPP
infrastructure procurement in Pakistan. This is what was expected for Pakistan’s PPP
infrastructure investment.
c. In the public investment function
The null hypothesis cannot be rejected at the conventional significance level, which
means the public sector does not have an independent capacity for implementing PPP
infrastructural investment in Pakistan. This may not be a surprise because of poor governance
for public investment.

240
6.7.2 Hypotheses test results in Panel vector auto regression combining with survey data
(PVAR-X) model
Question 1. Does institutional capacity have an effect on PPP implementation in Pakistan?
This research question can be translated into an econometrically testable hypothesis as
follows.
0H : IC = 0
1H : IC 0
a. In total investment function The null hypothesis is rejected at the 10 percent level of significance, implying that
institutional capacity has an impact on total investment (public and private) function.
b. In the private investment function The null hypothesis is not rejected (p-value of 0.493) as institutional capacity is not
statistically significant at a conventional level of significance. It indicates that institutions do
not have the capacity/framework for influencing the private sector for investing in PPP
infrastructure development in Pakistan. It means the private sector does not have a favourable
institutional framework for investing in infrastructure. This is what we expected for Pakistan’s
PPP infrastructure investment.
c. In the public investment function The public sector institutional capacity is not significant statistically at the conventional
level of significance. It implies that the public sector does not have the capacity for facilitating
PPP infrastructure investment in Pakistan.
Question 2. Does the private sector have the capacity to implement PPP programs in Pakistan?
This research question is translated into the following econometrically testable
hypothesis.
0H : PVC = 0
1H : PVC 0
a. In the total investment function The null hypothesis is not rejected at the conventional level of significance (p-value of
0.229). It implies that the private sector does not have the capacity for investing in PPP
241
infrastructure in Pakistan. It means that some variation in the private sector capacity can affect
total PPP investment (public and private investment) in Pakistan.
b. In the private investment function The null hypothesis is not rejected (p-value of 0.284) at the conventional level of
significance. It indicates that private sectors do not have the capacity for investing in PPP
infrastructure procurement in Pakistan.
c. The public investment function The null hypothesis is not rejected at the conventional level of significance (p-value of
0.270). It implies that the public sector does not have the capacity for investing in PPP
infrastructure in Pakistan.
Question 2.1. Do other factors have an effect on PPP implementation in Pakistan?
The research question is translated into the following econometrically testable
hypothesis.
𝐻0: 𝛽𝑂𝐹1 = 𝛽𝑂𝐹2 = 𝛽𝑂𝐹3 = 𝛽𝑂𝐹4 = 0
𝐻0: 𝛽𝑂𝐹1 ≠ 𝛽𝑂𝐹2 ≠ 𝛽𝑂𝐹3 ≠ 𝛽𝑂𝐹4 ≠ 0
Other factors are found to be significant for private- and public sector investment as
well as under total investment (private and public). It indicates that other factors do have an
impact on investments. It means other factors should be implemented for promoting PPP
infrastructre investment in Pakistan.
a. In the total investment function The null hypothesis is rejected at the conventional level of significance. It shows that
other factors have significant effects on total investment. For the purpose of policy, the
government should review its policy for implementation of PPP programs in Pakistan with
reference to other factors as stated in this thesis.
b. In the private investment function The null hypothesis is rejected at the conventional level of significance. This indicates
that other factors are useful determinants for private-sector investment in PPP infrastructure. It

242
implies that the government should review its policy for implementation of PPP programs in
Pakistan.
c. In the public investment function The null hypothesis is not rejected at a conventional level of significance. This indicates
that other factors are discouraging public-sector investment in PPP infrastructure. These results
suggest that other factors do have an impact on investments and should be addressed for
promoting PPP infrastructrual investment in Pakistan. It means that the Government of Pakistan
should review its policies for implementation of PPP programs in Pakistan.
Question 3. Does the public sector have the capacity to implement PPP programs in Pakistan?
This research question is translated into the following econometrically testable
hypothesis.
0H : PBC = 0
1H : PBC 0
a. In the total investment function The null hypothesis is not rejected at the conventional significant level (p-value of
0.319). It shows that the public sector does not have the capacity to implement PPP programs
in Pakistan. This is a surprise. One can take some variations in the public sector capacity that
can affect total PPP investment (public and private investment) in Pakistan. In other words, the
public sector can use its capacity much better where a joint investment (public and the private
investment) exists.
b. In the private investment function The null hypothesis cannot be rejected at the conventional significance level (p-value
of 0. 307). Thus, the public sector does not have the capacity for investing in PPP infrastructure
procurement in Pakistan.
c. In the public investment function
The null hypothesis cannot be rejected at the conventional significance level (p-value
of 0.973) which means public-sector capacity is not statistically significant. Thus, the public
sector does not have the capacity for investing in PPP infrastructure in Pakistan. This may not

243
be a surprise because of poor governance in public investment. The next section summarises
the empirical results of this chapter.
6.8 Summary of empirical results
This section summarises the empirical results of this chapter. As a first step factor
analysis was used to test the suitability and reliability of the survey data. The results of factor
analysis determined the dimensionality of the variables of the questionnaire. Then Cronbach
alpha ( ) was used to measure the reliability and internal intensity of a set of questions. It was
found that the reliability of all questions in the survey questionnaire satisfies internal
consistency of the items by Cronbach alpha criterion. Cronbach alpha ( ) also found no
inadequacy of the survey response.
The historical variables including , 1, 2, ,inv inv inv gdp ir were tested for stationarity by
the Levin-Lin and Chu (LLC) (2002), Im, Pesaran and Shin (1997) and Maddala and Wu (1999)
(Fisher-type test) panel unit root tests and found that these variables were first differenced
stationary i.e. the series were level nonstationary of order 1. Then the cointegration of the
nonstationarity series was tested by utilising Persyn & Westerlund (2008) and found that the
variables were not cointegrated. Consequently, differenced series used for further analysis.
For estimation of panel regression models the random effects versus fixed effects was
tested by utilising Hausman (1978) test. The test supported the use of random effects model.
From the panel random effects results it was found that GDP has significant effects on
investment, while insignificant effects found for the interest rate variable. Similar results found
for private investment and the public investment as well. Later, additional exogeneous variables
obtained from the survey data included in the panel regression random effects model and
revealed the same conclusion for GDP data in each of the model. It was also found from the
estimated results that other factors were the barriers to PPP infrastructure investment in
Pakistan.
The panel vector auto regression models were also considered for estimating the model
of interest by using GMM estimation method. The results of panel vector auto regression found
that GDP has significant effects on investment. It was also found that the institutions, public-
and private sector do not have the capacity to manage PPP infrastructure projects/investment
and are barriers against taking part for public infrastructure development on PPP modality.
Besides, the other factors were found to have an impact on PPP implementation and in some

244
cases the factors are found to be barriers for implementing a successful PPP program in
Pakistan. The same conclusion was revealed upon inclusion of the additional exogeneous
variables obtained from the survey data into the panel vector auto regression model. The
empirical results of this chapter contain valuable information on the issues of infrastructural
development in Pakistan.

245
Chapter Seven Conclusions
The final chapter is organised as follows: Section 7.1 summarises key findings of the
study and conclusions drawn from the data analyses. In Section 7.2 the significance and
contributions of the study are highlighted. This is followed by a discussion of the
implementations of the findings of the study in Section 7.3. Finally, in Section 7.4, the
limitations of the study are discussed and recommendations are made for future research in the
PPP sector.
Drastic increases in population growth and urbanisation in Pakistan demands more
infrastructure facilities. Conversely, the country is unable to develop required infrastructure
services due to financial constraints. In this context, private-sector involvement in terms of PPP
is crucial for provision of infrastructure facilities. However, the business environment is not
conducive to developing PPP projects, and organisational capacity and the country’s
institutional framework are ineffective and inefficient for monitoring and regulating PPP
projects prudently and successfully. This thesis has identified the essential ingredients for a
successful implementation of PPP programs in Pakistan. The findings and conclusions of the
econometric estimation results are provided below. The next section summaries the findings in
relation to the research questions (Section 1.5).
7.1 Findings and conclusions
7.1.1 Findings
The estimation of the panel regression model was carried out by using generalised least
squares (GLS) and the panel VAR (PVAR) model of this by the Generalised Method of Moment
(GMM) estimation. Utilising the post-estimation analyses that includes Hausman (1978) tests for
model selection (between fixed effects and random effects models) and a Lagrange multiplier (LM),
tests for serial correlation were performed to check: (i) economic theory consistency; (ii) sign
consistency; (iii) statistical significance of policy variables; (iv) model adequacy; (v) goodness-of-
fit tests; and (vi) classical testing framework (t-test and F-test) applied by Wald testing approaches
for comparing the growth parameter among panel and their interaction. The PVAR and PVAR-X
models were estimated using Abrigo and Love (2015) in STATA, while the panel regression is
estimated in STATA.

246
The study that underpins this thesis investigated whether the total investment (public
and private) was dependent on GDP, interest rate, institutional capacity, public sector capacity,
private sector capacity and other factors. The estimated results from Granger causality tests
revealed that all variables are interrelated and have feedback affects. The total investment
jointly with public and private investment are causally related to GDP and interest rates
(changes in GDP and interest rates do have their joint effects on total investment, public
investment and private investment). Further, total investment, public and private investment are
also individually causally related to GDP and interest rates (changes in GDP and interest rates
do have their individual effects on total investment, public investment and private investment).
Interest rates were found to be economically insignificant in a public investment model but they
were found to affect the total investment, private investment and GDP. Conversely, public
investment and GDP have an impact on interest rates. Private investment and interest rate were
found to be jointly causally related to GDP (changes in private investment and interest rates do
have their joint effects on GDP). The estimated results of the analyses indicate that an increase
in GDP increases the interest rate. But shocks to interest rates over short- and long-term periods
cause no change to its own and to the public investment (changes in interest rates did not have
an effect on interest rates and public investment).
The research studies also investigated whether institutions and the public and private
sectors have the capacity to implement PPP programs in Pakistan. The studies also explored
whether other factors including: factor 1 (admin/rules and regulations); factor 2 (delay in project
execution); factor 3 (public and private sectors experience and qualification); and factor 4
(unrealistic feasibility study) have an impact on Pakistan’s PPP programs by applying PVAR
models. The PVAR model was extended to a PVAR – X model by combining the survey data
within the panel data to address the objectives of this thesis. The indicators such as investment,
GDP, interest rate, institutional capacity, public sector capacity, private sector capacity and
other factors were included in the model.
Within the panel data analysis presented above, institutional capacity was found to be
an important determinant of PPP implementation. The results of public- and private-sector
capacity suggest that total investment, public sector investment and private sector investment
have a significant relationship at 10 percent level of significance in most cases. It is concluded
that institutions do not have the capacity for managing PPP programs in Pakistan. However, the
institutional capacity level has been increasing gradually since 1991 and was at its highest level
247
in 2014. The public and the private sectors not only lack the capacity for participating and
managing PPP infrastructure projects/investment but also are the barriers against taking part for
public infrastructure development on PPP modality. On the whole, the results of this thesis
revealed that the other factors have an impact on PPP implementation and are statistically
significant at the 10 percent level. Therefore, other factors in some cases are barriers for
implementing a successful PPP program in Pakistan.
7.1.2 Conclusions
The estimation of the results revealed that institutional capacity has been increasing over
the time and was at its peak in 2014. However, institutional capacity is insufficient to manage
PPP programs effectively. In other words, institutional capacity is an impediment for
implementing PPP programs in Pakistan. The private sector lacks experience and expertise for
carrying out PPP programs in Pakistan. The public sector in Pakistan also does not have the
capacity for maximising benefits from the use of PPP procurement methods for developing
infrastructure in Pakistan.
The econometric test results have also revealed that poor public administration, rigid
rules and regulations cause delays in project execution, lack of public- and private-sector PPP
experience and qualifications, and unrealistic PPP feasibility studies and projections are the
major barriers in PPP implementation in Pakistan. Overall, a lack of institutional capacity,
public- and private-sector capacity and the lack of a PPP conducive environment are the
impediments in PPP program implementation in Pakistan.
7.2 Significance and contributions
This study makes a significant contribution to the PPP literature, methodological
approaches and particularly to identifying the impediments in implementing PPP programs in
Pakistan and largely in developing countries.
There are no standard criteria or a general framework available for identifying the
determents of PPP implementation. However, the assessment criteria are developed in the light
of a number of methods and techniques used by various researchers and multilateral agencies
such as: Vieitez Martinze, 2008; Chan et al., 2009; Economists’ Intelligence Unit’s (2009); Jooste
& Raymond, 2009; Regan et al., 2009; Nisar, 2011; UNESCAP, 2010 The World Bank Institute’s
(2011); and Research findings of Klijn and Teisman, 2003; NAO, 2003; Chan et al., 2009;
248
Stephan and Raymond, 2009; Yuan et al., (2009); Jin and Zhang, 2010; UNESCAP-PPP
Network, 2010; and Tahir, 2011. Different approaches are offered typically by multilateral
agencies in the public sector perspective. However, this study provides a mechanism that can
help in exploring major barriers for implementing PPP programs in Pakistan. Based on this
mechanism, this study concentrated on attaining key elements and investigating their
contributions for implementing a successful PPP program in Pakistan. These constituents
include total investment (public and private), real GDP, interest rate, institutional capacity,
public- and private-sector capacity and other factors/possible barriers for implementing PPP
programs in Pakistan.
This thesis aimed to compare the role of state institutions, and public- and private-sector
capacity for strengthening PPP infrastructure procurement methods in Pakistan. The research
analyses provided a comprehensive survey of major obstructions in undertaking PPP in
Pakistan. The estimated test statistics found that there is a statistically significant relationship
between institutions and public- and private-sector capacity for implementing a successful PPP
program. In other words, this thesis presents a valuable insight on how the institutional
impediments, lack of both public- and private-sector capacity and other possible factors may
have deterred the adoption of a successful PPP program in Pakistan.
This thesis is one of the first studies to explore institutional and organisational
capabilities (public- and private-sector capacity) and possible barriers in adoption of PPP in the
perspective of Pakistan. In fact, this thesis is the first attempt at compiling a comprehensive
framework that examines how a successful PPP program can be implemented in Pakistan. It is
an important addition to the literature and helps in understanding how and why PPP models
may or may not work effectively in different institutional and organisational settings.
7.2.1 Contribution to research methodology
This thesis contributes to increased sophistication in research methodology by building
up and estimating panel multiple regression models within the panel vector autoregression
framework. All quantitative variables were treated as endogenous and modelled as a panel
vector autoregression (PVAR) model and extending it to PVAR – X combining the qualitative
and quantiative data.

249
7.2.2 Contribution to the policy debate
The private-sector capacity for implementing PPP programs has not been assessed in
developing countries until now. The evaluation/importance of private-sector capacity for
implementing an effective and efficient PPP program has been ignored by previous
researchers.Therefore, no previous methods and techniques have been available for evaluating
this aspect of PPP performance. This thesis contributes to the policy debate by including
private-sector capacity for determining PPP performance and implementing PPP programs.
Furthermore, it also provides a valid method and technique for evaluating private-sector
capacity for implementing PPP programs in Pakistan.
7.3 Implications
This thesis provides important information for, and inputs into, government policy
development and implementation such as: (i) removing the identified barriers for implementing
and encouraging PPP undertakings in Pakistan for infrastructure development; (ii) valuable
insights on how institutional impediments may have deterred the adoption of PPP in Pakistan;
and (iii) understanding how and why the PPP model may or may not work effectively in
different institutional settings.
Just as developed countries are reaping the benefits of PPP by improving and providing
infrastructure facilities, Pakistan can benefit from efficient and effective PPP procurement
methods for developing infrastructure facilities without placing a burden on the public budget.
7.4 Limitations and future research
The focus of this thesis is limited to the determinants of PPP implementation in Pakistan
only. Other determinants of PPP implementation i.e. openness of the economy and financial
sector etc., were not investigated or identified. Some issues that were more related to other
aspects of infrastructure development were not taken into the consideration. However, further
data is needed to understand the dynamic economic effects of infrastructure development. The
study findings provide guidelines for PPP implementation in Pakistan and can be extended to
other developing countries and/or multi-country studies for generating useful comparisons and
revealing more useful information that have application well beyond the countries studied.

250
Appendices
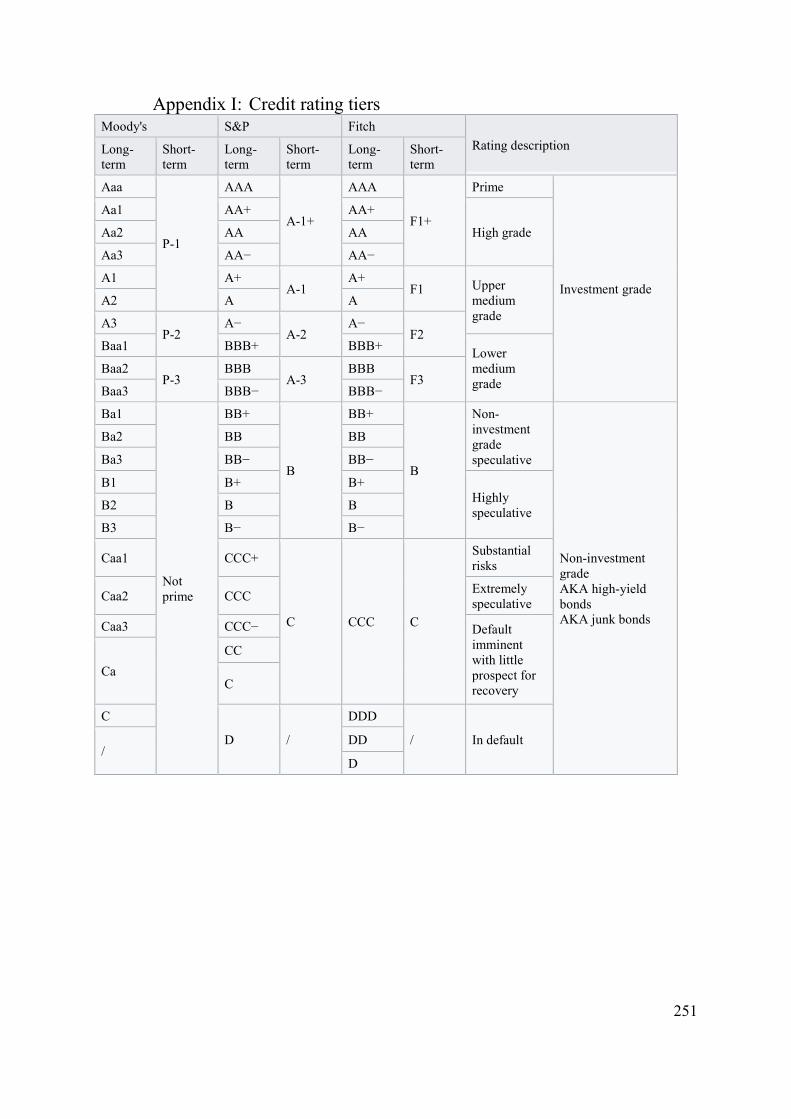
251
Moody's S&P Fitch Rating description Long-
term Short-term
Long-term
Short-term
Long-term
Short-term
Aaa
P-1
AAA
A-1+
AAA
F1+
Prime
Investment grade
Aa1 AA+ AA+
High grade Aa2 AA AA
Aa3 AA− AA−
A1 A+ A-1
A+ F1 Upper
medium grade
A2 A A
A3 P-2
A− A-2
A− F2
Baa1 BBB+ BBB+ Lower medium grade
Baa2 P-3
BBB A-3
BBB F3
Baa3 BBB− BBB−
Ba1
Not prime
BB+
B
BB+
B
Non-investment grade speculative
Non-investment grade AKA high-yield bonds AKA junk bonds
Ba2 BB BB
Ba3 BB− BB−
B1 B+ B+ Highly speculative B2 B B
B3 B− B−
Caa1 CCC+
C CCC C
Substantial risks
Caa2 CCC Extremely speculative
Caa3 CCC− Default imminent with little prospect for recovery
Ca CC
C
C
D /
DDD
/ In default /
DD
D
Appendix I: Credit rating tiers
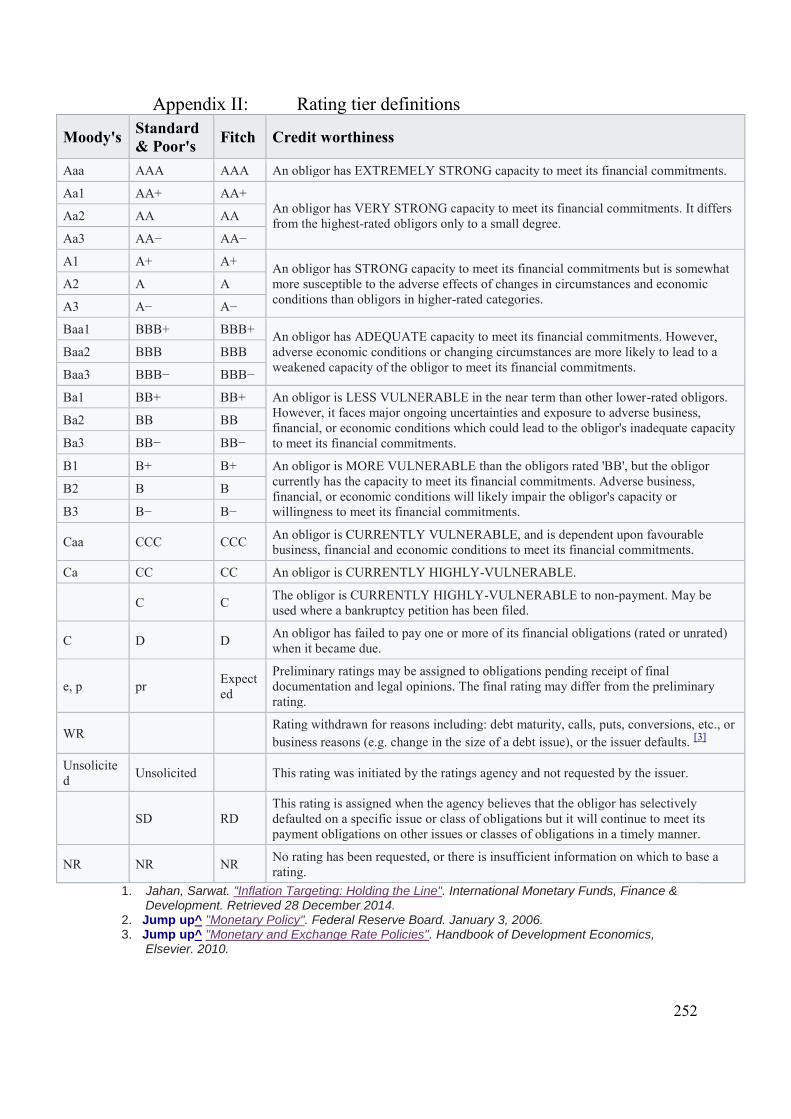
252
Moody's
Standard & Poor's
Fitch Credit worthiness
Aaa AAA AAA An obligor has EXTREMELY STRONG capacity to meet its financial commitments.
Aa1 AA+ AA+ An obligor has VERY STRONG capacity to meet its financial commitments. It differs from the highest-rated obligors only to a small degree. Aa2 AA AA
Aa3 AA− AA−
A1 A+ A+ An obligor has STRONG capacity to meet its financial commitments but is somewhat more susceptible to the adverse effects of changes in circumstances and economic conditions than obligors in higher-rated categories.
A2 A A
A3 A− A−
Baa1 BBB+ BBB+ An obligor has ADEQUATE capacity to meet its financial commitments. However, adverse economic conditions or changing circumstances are more likely to lead to a weakened capacity of the obligor to meet its financial commitments.
Baa2 BBB BBB
Baa3 BBB− BBB−
Ba1 BB+ BB+ An obligor is LESS VULNERABLE in the near term than other lower-rated obligors. However, it faces major ongoing uncertainties and exposure to adverse business, financial, or economic conditions which could lead to the obligor's inadequate capacity to meet its financial commitments.
Ba2 BB BB
Ba3 BB− BB−
B1 B+ B+ An obligor is MORE VULNERABLE than the obligors rated 'BB', but the obligor currently has the capacity to meet its financial commitments. Adverse business, financial, or economic conditions will likely impair the obligor's capacity or willingness to meet its financial commitments.
B2 B B
B3 B− B−
Caa CCC CCC An obligor is CURRENTLY VULNERABLE, and is dependent upon favourable business, financial and economic conditions to meet its financial commitments.
Ca CC CC An obligor is CURRENTLY HIGHLY-VULNERABLE.
C C The obligor is CURRENTLY HIGHLY-VULNERABLE to non-payment. May be used where a bankruptcy petition has been filed.
C D D An obligor has failed to pay one or more of its financial obligations (rated or unrated) when it became due.
e, p pr Expected
Preliminary ratings may be assigned to obligations pending receipt of final documentation and legal opinions. The final rating may differ from the preliminary rating.
WR Rating withdrawn for reasons including: debt maturity, calls, puts, conversions, etc., or business reasons (e.g. change in the size of a debt issue), or the issuer defaults. [3]
Unsolicited Unsolicited This rating was initiated by the ratings agency and not requested by the issuer.
SD RD This rating is assigned when the agency believes that the obligor has selectively defaulted on a specific issue or class of obligations but it will continue to meet its payment obligations on other issues or classes of obligations in a timely manner.
NR NR NR No rating has been requested, or there is insufficient information on which to base a rating.
1. Jahan, Sarwat. "Inflation Targeting: Holding the Line". International Monetary Funds, Finance & Development. Retrieved 28 December 2014.
2. Jump up^ "Monetary Policy". Federal Reserve Board. January 3, 2006. 3. Jump up^ "Monetary and Exchange Rate Policies". Handbook of Development Economics,
Elsevier. 2010.
Appendix II: Rating tier definitions

253
Determinants of public private partnership performance: the case of Pakistan 1. Personal information:
• Name: ________________________________________________________________ • Job title: _______________________________________________________________ • Gender: 1. Male 2. Female • Age range: 1. ≤ 30 2. 31-40 3. 41-50 4. ≥ 51 • Qualifications 1. PhD 2. Master 3. Graduate 4. Intermediate • No. of years of work: 1. 1-5 2. 6-10 3. 11-15 4. ≥ 16 • Years in the current job: 1. 1-5 2. 6-10 3. 11-15 4. ≥ 16
2. Organisation: • Name: _______________________________________________________________ • Address: _____________________________________________________________ • Date of inception: ______________________________________________________ • Business line: 1. Telecommunication 2. Power 3. Transport • Involved in PPP: 1. No 2. Yes if yes, when _____________________________
3. The importance of infrastructure.
A. Infrastructure and the performance of your organisation. (Please indicate to what extent you agree or disagree with each of the statements: 1=Strongly Disagree, 2=Disagree, 3=Neutral, 4= Agree and 5= Strongly Agree or Not Applicable)
Better infrastructure helps your organisation to:
1. Reduce operating costs 2. Bring forward investment 3. Improve capital productivity 4. Improve labour productivity 5. Increase revenue 6. Improve service delivery 7. Create business opportunities 8. Improve operational networks 9. Improve profitability
Other benefits. Please specify: _____________________________________________________________________________________________________________________________________________________________________________________________________________________________________________
Appendix III: Public sector survey questionnaire
Strongly Disagree
1
Disagree 2
Neutral 3
Agree 4
Strongly Agree
5
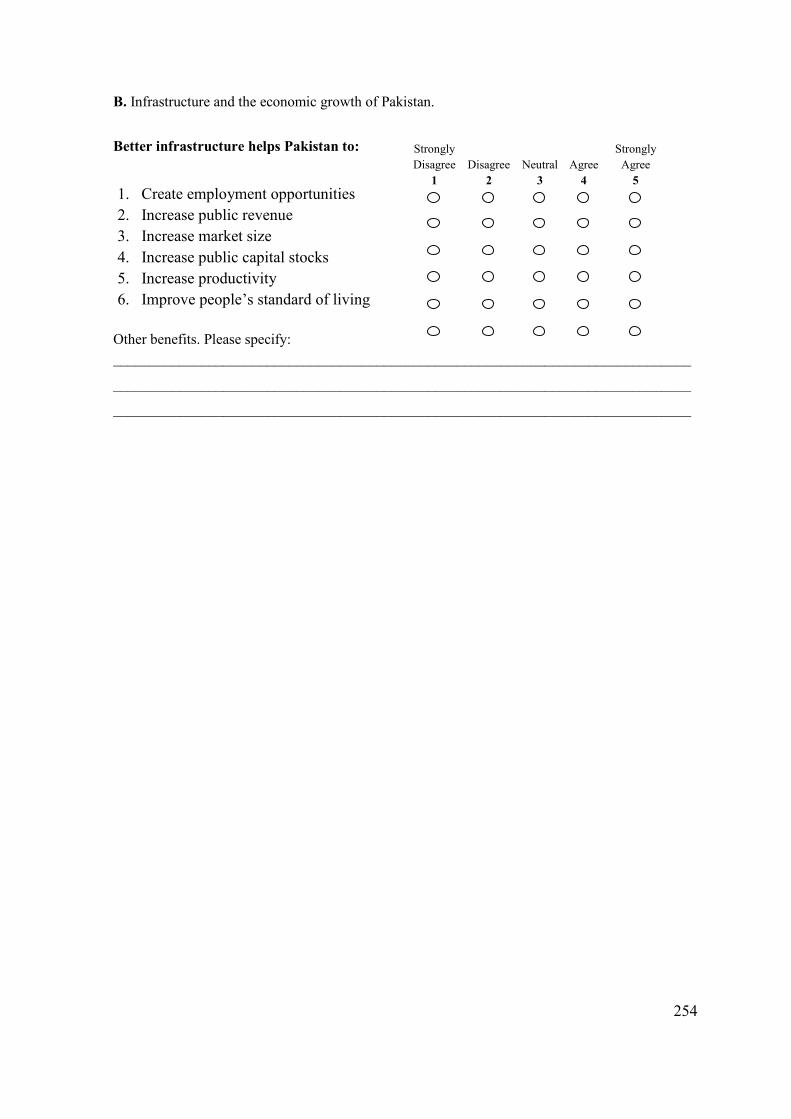
254
B. Infrastructure and the economic growth of Pakistan.
Better infrastructure helps Pakistan to:
1. Create employment opportunities 2. Increase public revenue 3. Increase market size 4. Increase public capital stocks 5. Increase productivity 6. Improve people’s standard of living
Other benefits. Please specify: _______________________________________________________________________________
_______________________________________________________________________________
_______________________________________________________________________________
Strongly Disagree
1 Disagree
2 Neutral
3 Agree
4
Strongly Agree
5

255
4. The public sector capacity and PPP programme.
(Note: Please write down the score as given in the attached Scoring Criteria – Public Sector Capacity Assessment)
Public Sector Capacity Assessment scores as per scoring criteria
Year
Does the Chief Executive of your organisation have
PPP awareness and ownership?
Does your organisation have PPP experience?
Does your organisation have financial capacity to
implement PPP?
Does your organisation have managerial skills to
implement PPP?
Does your organisation have the capacity to select
right PPP model and project?
1991
1992
1993 1994
1995 1996
1997 1998
1999 2000
2001
2002 2003
2004 2005
2006 2007
2008 2009 2010
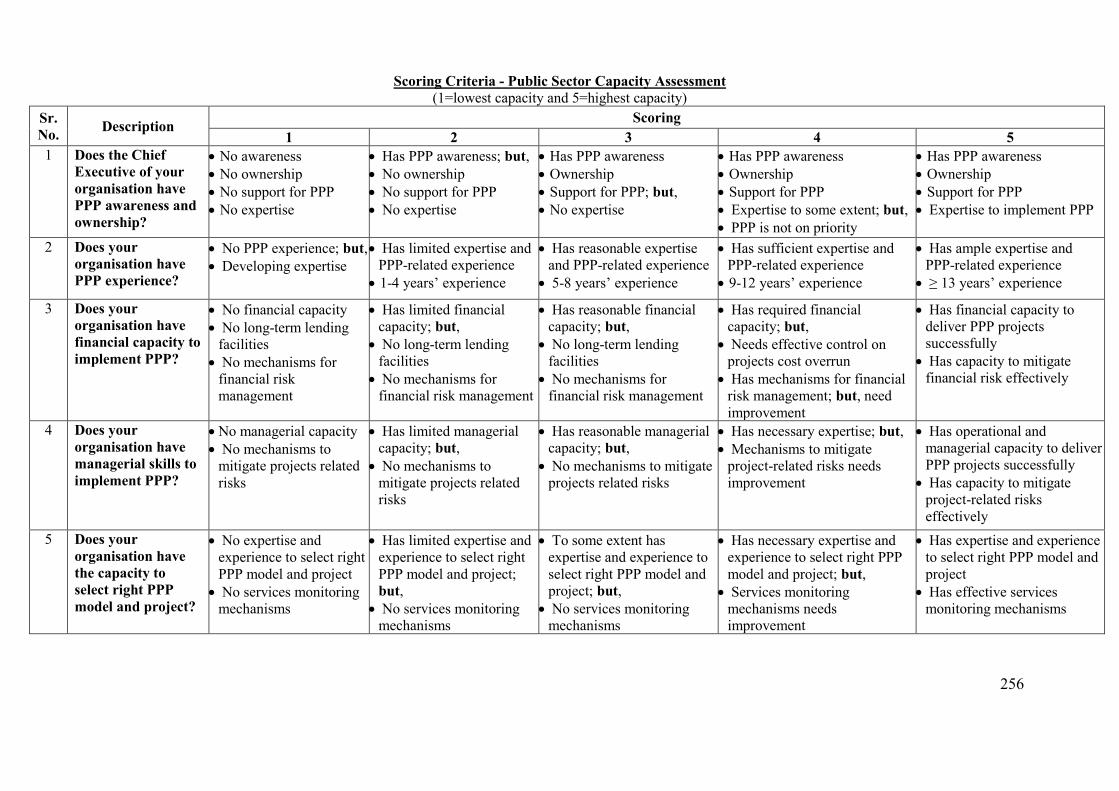
256
Scoring Criteria - Public Sector Capacity Assessment (1=lowest capacity and 5=highest capacity)
Sr. No. Description Scoring
1 2 3 4 5 1 Does the Chief
Executive of your organisation have PPP awareness and ownership?
• No awareness • No ownership • No support for PPP • No expertise
• Has PPP awareness; but, • No ownership • No support for PPP • No expertise
• Has PPP awareness • Ownership • Support for PPP; but, • No expertise
• Has PPP awareness • Ownership • Support for PPP • Expertise to some extent; but, • PPP is not on priority
• Has PPP awareness • Ownership • Support for PPP • Expertise to implement PPP
2 Does your organisation have PPP experience?
• No PPP experience; but, • Developing expertise
• Has limited expertise and PPP-related experience
• 1-4 years’ experience
• Has reasonable expertise and PPP-related experience
• 5-8 years’ experience
• Has sufficient expertise and PPP-related experience
• 9-12 years’ experience
• Has ample expertise and PPP-related experience
• ≥ 13 years’ experience
3 Does your organisation have financial capacity to implement PPP?
• No financial capacity • No long-term lending
facilities • No mechanisms for
financial risk management
• Has limited financial capacity; but,
• No long-term lending facilities
• No mechanisms for financial risk management
• Has reasonable financial capacity; but,
• No long-term lending facilities
• No mechanisms for financial risk management
• Has required financial capacity; but,
• Needs effective control on projects cost overrun
• Has mechanisms for financial risk management; but, need improvement
• Has financial capacity to deliver PPP projects successfully
• Has capacity to mitigate financial risk effectively
4 Does your organisation have managerial skills to implement PPP?
• No managerial capacity • No mechanisms to
mitigate projects related risks
• Has limited managerial capacity; but,
• No mechanisms to mitigate projects related risks
• Has reasonable managerial capacity; but,
• No mechanisms to mitigate projects related risks
• Has necessary expertise; but, • Mechanisms to mitigate
project-related risks needs improvement
• Has operational and managerial capacity to deliver PPP projects successfully
• Has capacity to mitigate project-related risks effectively
5 Does your organisation have the capacity to select right PPP model and project?
• No expertise and experience to select right PPP model and project
• No services monitoring mechanisms
• Has limited expertise and experience to select right PPP model and project; but,
• No services monitoring mechanisms
• To some extent has expertise and experience to select right PPP model and project; but,
• No services monitoring mechanisms
• Has necessary expertise and experience to select right PPP model and project; but,
• Services monitoring mechanisms needs improvement
• Has expertise and experience to select right PPP model and project
• Has effective services monitoring mechanisms
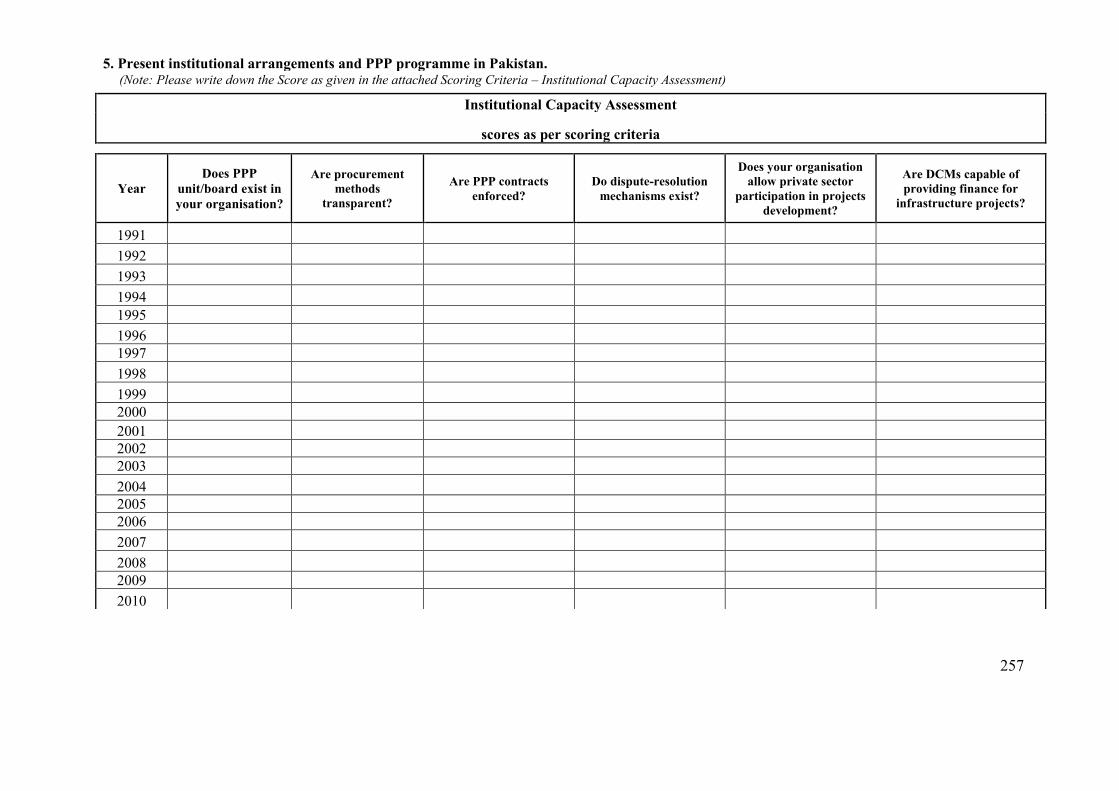
257
5. Present institutional arrangements and PPP programme in Pakistan.
(Note: Please write down the Score as given in the attached Scoring Criteria – Institutional Capacity Assessment)
Institutional Capacity Assessment
scores as per scoring criteria
Year Does PPP
unit/board exist in your organisation?
Are procurement methods
transparent? Are PPP contracts
enforced? Do dispute-resolution
mechanisms exist?
Does your organisation allow private sector
participation in projects development?
Are DCMs capable of providing finance for
infrastructure projects?
1991 1992 1993 1994 1995 1996 1997 1998 1999 2000 2001 2002 2003 2004 2005 2006 2007 2008 2009 2010

258
Scoring Criteria – Institutional Capacity
Sr. No. Description Scoring
1 2 3 4 5 1 Does PPP unit/board
exist in your organisation?
• No PPP unit/ board exists • No accountability • Not independent from rent
seekers • Ineffective monitoring system
• PPP unit/board exists; but, • No accountability • Not independent from rent
seekers • Ineffective monitoring system
• PPP unit/board exists • Accountable • Independent from rent seekers;
but, • Ineffective monitoring system
• PPP unit/board exists • Accountable • Independent from rent seekers • Monitoring system is operative; but, • Needs improvements
• PPP unit/board exists • Accountable • Independent from rent seekers • Monitoring system is effective
2 Are procurement methods transparent?
• Project selection and bidding process is not transparent
• Regulations are ambiguous • Negotiation process is poor • Financial and economic
factors are disregarded during project procurement process
• Project selection and bidding process is fair; but,
• Regulations are ambiguous • Negotiation process is poor • Financial and economic factors
are disregarded during project procurement process
• Project selection and bidding process is fair
• Regulations are clearly defined; but,
• Negotiation process is poor • Financial and economic factors
are disregarded during project procurement process
• Project selection and bidding process is fair
• Regulations are clearly defined • Negotiation process is satisfactory;
but, • Financial and economic factors
occasionally considered during project procurement process
• Project selection and bidding process is fair
• Regulations are clearly defined • Negotiation process is fair • Financial and economic factors
are taken care of during project procurement process
3 Are PPP contracts enforced?
• Weak enforcement of PPP contract
• Investors’ right are disregarded
• No effective appeal process
• Judiciary occasionally upholds PPP contracts; but,
• Investors’ right are disregarded • No effective appeal process
• Judiciary usually upholds PPP contracts
• Investors’ rights are protected; but, not in effective way
• No effective appeal process
• Judiciary consistently upholds PPP contracts; but,
• Needs improvement • Investors’ rights are protected • Appeals process is satisfactory
• PPP contracts are effectively enforced
• Investors’ rights are protected • Appeals process is acceptable
4 Do dispute-resolution
mechanisms (DMRs) exist?
• Dispute-resolution systems for PPP are undefined and insufficient
• Not transparent or ineffective • Arbitration and appeals are
lengthy and complex
• DRMs exist; but, • Not transparent and ineffective • Arbitration and appeals are
lengthy and complex
• DRMs exist • Transparent and effective; but, • Arbitration and appeals are
lengthy and complex
• Comprehensive DRMs exist • Transparent and effective; but, • Arbitration and appeals process
needs improvements
• Comprehensive transparent and effective DRMs (established independent arbitration system) exists
• Disputes are resolved according to law and contracts without lengthy appeals.
5 Does your organisation allow private sector participation (PSP) in projects development?
• PSP not allowed • Regulations and procedures
are restricted
• Limited opportunity for PSP; but,
• Regulations and procedures are restricted
• Has opportunity for PSP; but, • Regulations and procedures are
ambiguous
• Has opportunity for PSP • Selected projects have been
completed with PSP; but, • Regulations need improvement
• Organisation has enabling environment for PSP
• Few projects have been completed with PSI and several are in pipeline
6 Are domestic capital markets (DCMs) capable of providing finance for infrastructure projects?
• DCMs are underdeveloped • Risk-hedging instruments are
not robust
• DCMs are slowly developing; but,
• Risk-hedging instruments are not robust
• DCMs are limited to finance infrastructure projects; but,
• Risk-hedging instruments are not robust
• DCMs have capacity to provide sufficient financing; but,
• Needs improvement • Risk-hedging instruments are
limited/developing
• DCMs have capacity to provide reliable financing and risk-hedging instruments

259
6. Availability of guidance materials:
PPP standard documents/sector specific guidance 1. Yes 2. No
PPP standard model contracts 1. Yes 2. No
PPP project preparation guidelines 1. Yes 2. No
7. Barriers to PPP programme implementations in Pakistan.
Possible barriers:
1. Governance – bureaucratic approvals and formalities are involved in project initiative
2. Lengthy delays due to lack of PPP awareness 3. Lengthy delays due to political debates 4. Lengthy delays in negotiations between
contracting parties 5. Delay due to resistance from community groups 6. Delay due to resistance from environmentalists 7. Delay due to modifications in original project
design 8. Modifications in original project design increase
costs 9. Lack of coordination at the federal level 10. Lack of coordination at the provincial level 11. Lack of coordination at the municipal level 12. Lack of unidirectional policy framework 13. Apprehension of the government agencies to lose
public control over project management 14. Inconsistency of public polices 15. Investment policies framework has its focus only
to attract investment rather than any defined objectives
16. Excessive regulations and complex legal framework
17. Judicial system is not supportive to PPP 18. No use of public sector competitor/ benchmark
PPP model prior to request for bids 19. Lack of experience and appropriate skills to
implement PPP projects by the public sector 20. Lack of experience and appropriate skills to
implement PPP projects by the private sector 21. Lack of specialised research for PPP in Pakistan 22. Lack of on-the-job training opportunities for PPP
Strongly Disagree
1 Disagree
2 Neutral
3 Agree
4
Strongly Agree
5

260
23. Inflexible tariff adjustment (tariff is not adjusted according to change in consumer price index)
24. Unrealistic financial models (unrealistic revenue and expenditure)
25. Unrealistic assumptions in feasibility studies
Additional possible barriers:
26. ________________________________
27. ________________________________
28. ________________________________
29. ________________________________
8. In your opinion, what are the key factors that can drive successful PPP programme in
Pakistan? (Please use additional sheet if required) __________________________________________________________________________________
__________________________________________________________________________________
9. Please suggest changes in laws, regulations and administrative procedures required for successful implementation of PPP in Pakistan, if any.
__________________________________________________________________________________
__________________________________________________________________________________
10. Private sector investment and the performance of your organisation. Increased private investment helps your organisation to:
Neutral 3
Strongly Disagree
1 Disagree
2 Agree
4
Strongly Agree
5
Strongly Disagree
1
Disagree 2
Neutral 3
Agree 4
Strongly Agree
5
1. Introduce modern technology
2. Reduce operating costs
3. Increase revenue
4. Bring forward public investment
5. Create job opportunities
6. Improve capital productivity
7. Improve labour productivity
8. Improve public amenity
9. Improve service delivery
10. Improve operational networks

261
Determinants of public private partnership performance: the case of Pakistan 1. Personal information:
• Name: ________________________________________________________________ • Job title: _______________________________________________________________ • Gender: 1. Male 2. Female • Age range: 1. ≤ 30 2. 31-40 3. 41-50 4. ≥ 51 • Qualifications 1. PhD 2. Master 3. Graduate 4. Intermediate • No. of years of work: 1. 1-5 2. 6-10 3. 11-15 4. ≥ 16 • Years in the current job: 1. 1-5 2. 6-10 3. 11-15 4. ≥ 16
2. Organisation: • Name: _______________________________________________________________ • Address: _____________________________________________________________ • Date of inception: ______________________________________________________ • Business line: 1. Telecommunication 2. Power 3. Transport • Involved in PPP: 1. No 2. Yes if yes, when _____________________________
3. The importance of infrastructure.
B. Infrastructure and the performance of your organisation. (Please indicate to what extent you agree or disagree with each of the statements: 1=Strongly Disagree, 2=Disagree, 3=Neutral, 4= Agree and 5= Strongly Agree or Not Applicable)
Better infrastructure helps your organisation to:
11. Reduce operating costs 12. Bring forward investment 13. Improve capital productivity 14. Improve labour productivity 15. Increase revenue 16. Improve service delivery 17. Create business opportunities 18. Improve operational networks 19. Improve profitability
Other benefits. Please specify: _____________________________________________________________________________________________________________________________________________________________________________________________________________________________________________
Appendix IV: Private sector survey questionnaire
Strongly Disagree
1
Disagree 2
Neutral 3
Agree 4
Strongly Agree
5
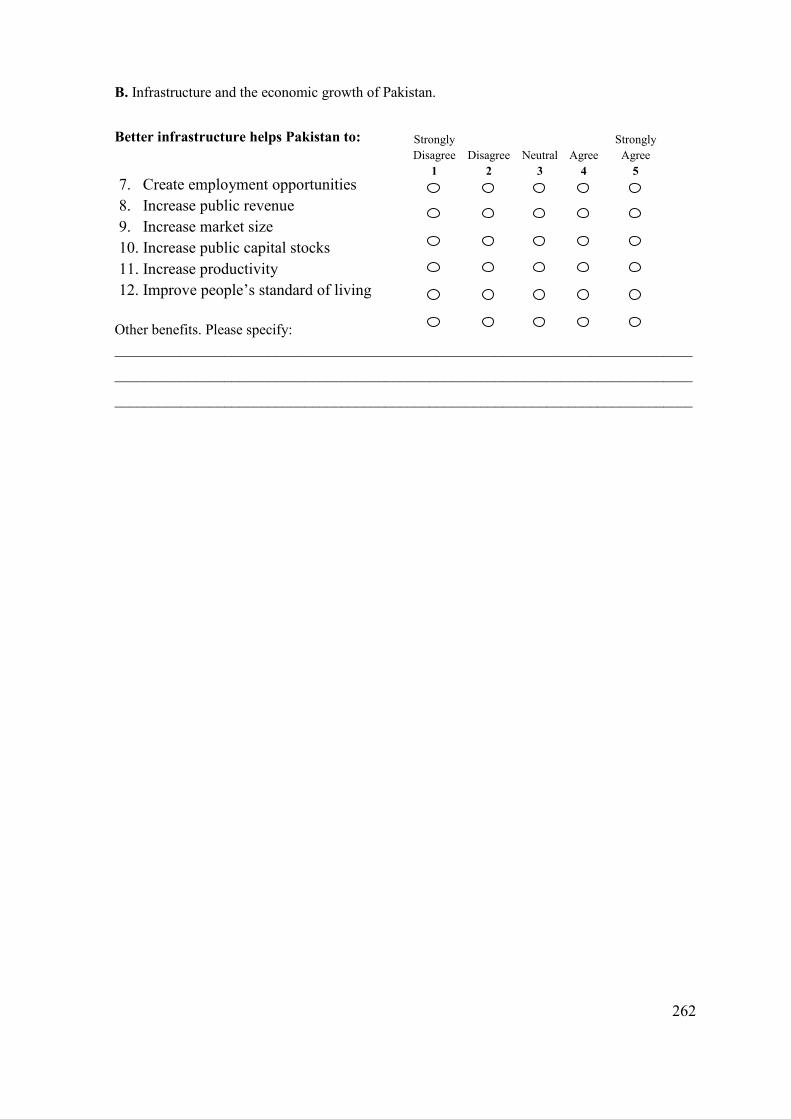
262
B. Infrastructure and the economic growth of Pakistan.
Better infrastructure helps Pakistan to:
7. Create employment opportunities 8. Increase public revenue 9. Increase market size 10. Increase public capital stocks 11. Increase productivity 12. Improve people’s standard of living
Other benefits. Please specify: _______________________________________________________________________________
_______________________________________________________________________________
_______________________________________________________________________________
Strongly Disagree
1 Disagree
2 Neutral
3 Agree
4
Strongly Agree
5

263
4. The public sector capacity and PPP programme.
(Note: Please write down the score as given in the attached Scoring Criteria – Public Sector Capacity Assessment)
Public Sector Capacity Assessment scores as per scoring criteria
Year
Does the Chief Executive of your organisation have
PPP awareness and ownership?
Does your organisation have PPP experience?
Does your organisation have financial capacity to
implement PPP?
Does your organisation have managerial skills to
implement PPP?
Does your organisation have the capacity to select
right PPP model and project?
1991
1992
1993 1994
1995 1996
1997 1998
1999 2000
2001
2002 2003
2004 2005
2006 2007
2008 2009 2010

264
Scoring Criteria - Public Sector Capacity Assessment (1=lowest capacity and 5=highest capacity)
Sr. No. Description Scoring
1 2 3 4 5 1 Does the Chief
Executive of your organisation have PPP awareness and ownership?
• No awareness • No ownership • No support for PPP • No expertise
• Has PPP awareness; but, • No ownership • No support for PPP • No expertise
• Has PPP awareness • Ownership • Support for PPP; but, • No expertise
• Has PPP awareness • Ownership • Support for PPP • Expertise to some extent; but, • PPP is not on priority
• Has PPP awareness • Ownership • Support for PPP • Expertise to implement PPP
2 Does your organisation have PPP experience?
• No PPP experience; but, • Developing expertise
• Has limited expertise and PPP-related experience
• 1-4 years’ experience
• Has reasonable expertise and PPP-related experience
• 5-8 years’ experience
• Has sufficient expertise and PPP-related experience
• 9-12 years’ experience
• Has ample expertise and PPP-related experience
• ≥ 13 years’ experience
3 Does your organisation have financial capacity to implement PPP?
• No financial capacity • No long-term lending
facilities • No mechanisms for
financial risk management
• Has limited financial capacity; but,
• No long-term lending facilities
• No mechanisms for financial risk management
• Has reasonable financial capacity; but,
• No long-term lending facilities
• No mechanisms for financial risk management
• Has required financial capacity; but,
• Needs effective control on projects cost overrun
• Has mechanisms for financial risk management; but, need improvement
• Has financial capacity to deliver PPP projects successfully
• Has capacity to mitigate financial risk effectively
4 Does your organisation have managerial skills to implement PPP?
• No managerial capacity • No mechanisms to
mitigate projects related risks
• Has limited managerial capacity; but,
• No mechanisms to mitigate projects related risks
• Has reasonable managerial capacity; but,
• No mechanisms to mitigate projects related risks
• Has necessary expertise; but, • Mechanisms to mitigate
project-related risks needs improvement
• Has operational and managerial capacity to deliver PPP projects successfully
• Has capacity to mitigate project-related risks effectively
5 Does your organisation have the capacity to select right PPP model and project?
• No expertise and experience to select right PPP model and project
• No services monitoring mechanisms
• Has limited expertise and experience to select right PPP model and project; but,
• No services monitoring mechanisms
• To some extent has expertise and experience to select right PPP model and project; but,
• No services monitoring mechanisms
• Has necessary expertise and experience to select right PPP model and project; but,
• Services monitoring mechanisms needs improvement
• Has expertise and experience to select right PPP model and project
• Has effective services monitoring mechanisms

265
5. Present institutional arrangements and PPP programme in Pakistan.
(Note: Please write down the Score as given in the attached Scoring Criteria – Institutional Capacity Assessment)
Institutional Capacity Assessment
scores as per scoring criteria
Year Does PPP
unit/board exist in your organisation?
Are procurement methods
transparent? Are PPP contracts
enforced? Do dispute-resolution
mechanisms exist?
Does your organisation allow private sector
participation in projects development?
Are DCMs capable of providing finance for
infrastructure projects?
1991 1992 1993 1994 1995 1996 1997 1998 1999 2000 2001 2002 2003 2004 2005 2006 2007 2008 2009 2010
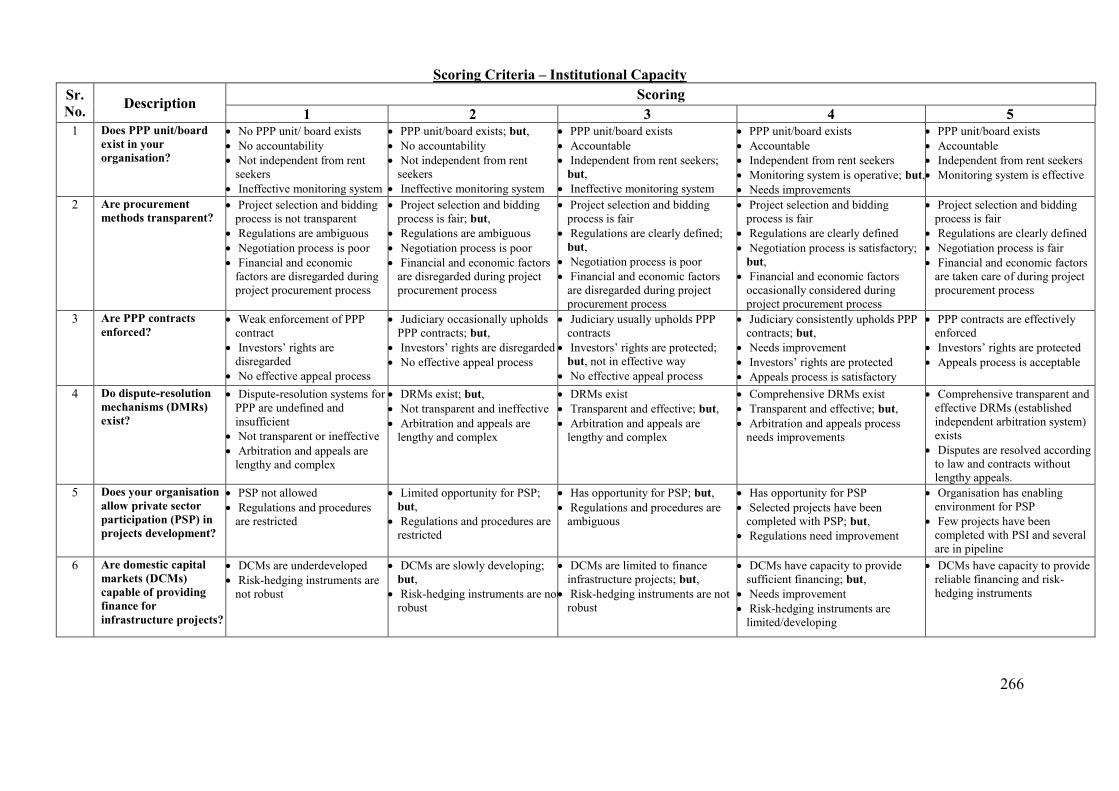
266
Scoring Criteria – Institutional Capacity
Sr. No. Description Scoring
1 2 3 4 5 1 Does PPP unit/board
exist in your organisation?
• No PPP unit/ board exists • No accountability • Not independent from rent
seekers • Ineffective monitoring system
• PPP unit/board exists; but, • No accountability • Not independent from rent
seekers • Ineffective monitoring system
• PPP unit/board exists • Accountable • Independent from rent seekers;
but, • Ineffective monitoring system
• PPP unit/board exists • Accountable • Independent from rent seekers • Monitoring system is operative; but, • Needs improvements
• PPP unit/board exists • Accountable • Independent from rent seekers • Monitoring system is effective
2 Are procurement methods transparent?
• Project selection and bidding process is not transparent
• Regulations are ambiguous • Negotiation process is poor • Financial and economic
factors are disregarded during project procurement process
• Project selection and bidding process is fair; but,
• Regulations are ambiguous • Negotiation process is poor • Financial and economic factors
are disregarded during project procurement process
• Project selection and bidding process is fair
• Regulations are clearly defined; but,
• Negotiation process is poor • Financial and economic factors
are disregarded during project procurement process
• Project selection and bidding process is fair
• Regulations are clearly defined • Negotiation process is satisfactory;
but, • Financial and economic factors
occasionally considered during project procurement process
• Project selection and bidding process is fair
• Regulations are clearly defined • Negotiation process is fair • Financial and economic factors
are taken care of during project procurement process
3 Are PPP contracts enforced?
• Weak enforcement of PPP contract
• Investors’ rights are disregarded
• No effective appeal process
• Judiciary occasionally upholds PPP contracts; but,
• Investors’ rights are disregarded • No effective appeal process
• Judiciary usually upholds PPP contracts
• Investors’ rights are protected; but, not in effective way
• No effective appeal process
• Judiciary consistently upholds PPP contracts; but,
• Needs improvement • Investors’ rights are protected • Appeals process is satisfactory
• PPP contracts are effectively enforced
• Investors’ rights are protected • Appeals process is acceptable
4 Do dispute-resolution
mechanisms (DMRs) exist?
• Dispute-resolution systems for PPP are undefined and insufficient
• Not transparent or ineffective • Arbitration and appeals are
lengthy and complex
• DRMs exist; but, • Not transparent and ineffective • Arbitration and appeals are
lengthy and complex
• DRMs exist • Transparent and effective; but, • Arbitration and appeals are
lengthy and complex
• Comprehensive DRMs exist • Transparent and effective; but, • Arbitration and appeals process
needs improvements
• Comprehensive transparent and effective DRMs (established independent arbitration system) exists
• Disputes are resolved according to law and contracts without lengthy appeals.
5 Does your organisation allow private sector participation (PSP) in projects development?
• PSP not allowed • Regulations and procedures
are restricted
• Limited opportunity for PSP; but,
• Regulations and procedures are restricted
• Has opportunity for PSP; but, • Regulations and procedures are
ambiguous
• Has opportunity for PSP • Selected projects have been
completed with PSP; but, • Regulations need improvement
• Organisation has enabling environment for PSP
• Few projects have been completed with PSI and several are in pipeline
6 Are domestic capital markets (DCMs) capable of providing finance for infrastructure projects?
• DCMs are underdeveloped • Risk-hedging instruments are
not robust
• DCMs are slowly developing; but,
• Risk-hedging instruments are not robust
• DCMs are limited to finance infrastructure projects; but,
• Risk-hedging instruments are not robust
• DCMs have capacity to provide sufficient financing; but,
• Needs improvement • Risk-hedging instruments are
limited/developing
• DCMs have capacity to provide reliable financing and risk-hedging instruments
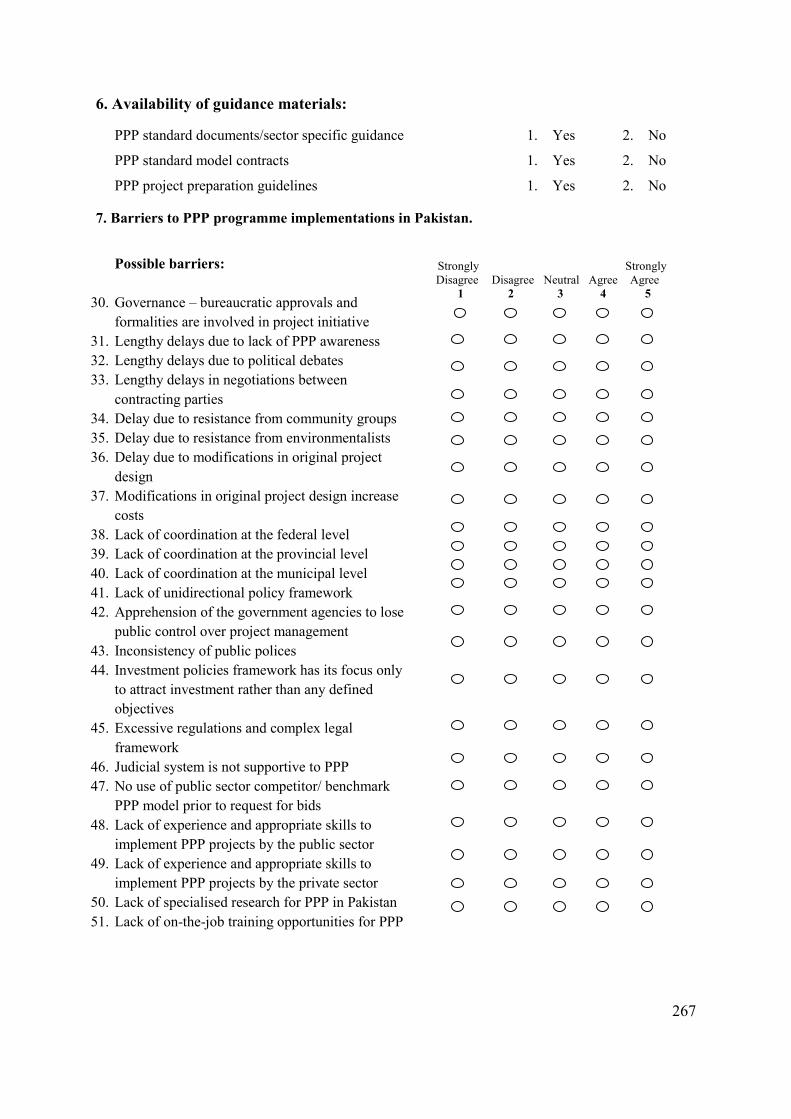
267
6. Availability of guidance materials:
PPP standard documents/sector specific guidance 1. Yes 2. No
PPP standard model contracts 1. Yes 2. No
PPP project preparation guidelines 1. Yes 2. No
7. Barriers to PPP programme implementations in Pakistan.
Possible barriers:
30. Governance – bureaucratic approvals and formalities are involved in project initiative
31. Lengthy delays due to lack of PPP awareness 32. Lengthy delays due to political debates 33. Lengthy delays in negotiations between
contracting parties 34. Delay due to resistance from community groups 35. Delay due to resistance from environmentalists 36. Delay due to modifications in original project
design 37. Modifications in original project design increase
costs 38. Lack of coordination at the federal level 39. Lack of coordination at the provincial level 40. Lack of coordination at the municipal level 41. Lack of unidirectional policy framework 42. Apprehension of the government agencies to lose
public control over project management 43. Inconsistency of public polices 44. Investment policies framework has its focus only
to attract investment rather than any defined objectives
45. Excessive regulations and complex legal framework
46. Judicial system is not supportive to PPP 47. No use of public sector competitor/ benchmark
PPP model prior to request for bids 48. Lack of experience and appropriate skills to
implement PPP projects by the public sector 49. Lack of experience and appropriate skills to
implement PPP projects by the private sector 50. Lack of specialised research for PPP in Pakistan 51. Lack of on-the-job training opportunities for PPP
Strongly Disagree
1 Disagree
2 Neutral
3 Agree
4
Strongly Agree
5
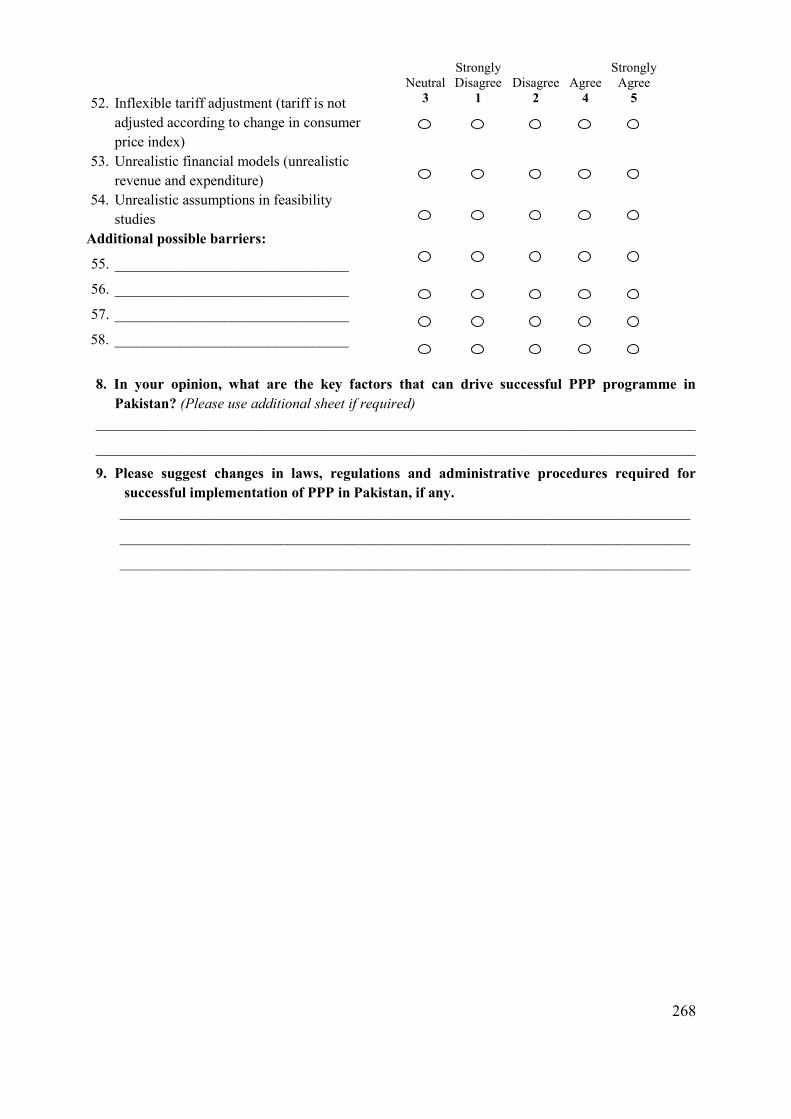
268
52. Inflexible tariff adjustment (tariff is not adjusted according to change in consumer price index)
53. Unrealistic financial models (unrealistic revenue and expenditure)
54. Unrealistic assumptions in feasibility studies
Additional possible barriers:
55. ________________________________
56. ________________________________
57. ________________________________
58. ________________________________
8. In your opinion, what are the key factors that can drive successful PPP programme in
Pakistan? (Please use additional sheet if required) __________________________________________________________________________________
__________________________________________________________________________________
9. Please suggest changes in laws, regulations and administrative procedures required for successful implementation of PPP in Pakistan, if any.
______________________________________________________________________________
______________________________________________________________________________
______________________________________________________________________________
Neutral 3
Strongly Disagree
1 Disagree
2 Agree
4
Strongly Agree
5

269
Dear Sir/Madam
Determinants of public private partnership performance: the case of Pakistan
You are requested to kindly take part in my PhD research on the subject cited above. The attached questionnaire is a part of my PhD research, which examines the impact of institutional barriers to develop physical infrastructure including: telecommunication, power and transportation (railways, roadways, airports and seaports) through PPP in Pakistan. PPP is an arrangement in which the private sector supplies infrastructure assets and services traditionally provided by the governments. Today, various countries have achieved their infrastructure development by implementing PPP modality.
The objective of the study is to identify main obstacles, focusing on institutional impediments, to the implementation of PPP in Pakistan with a view of drawing policy implications to encourage greater adoption of PPP for infrastructure development. The valuable inputs from you will be worthwhile in investigating the critical factors that hinder the occurrence of PPP and the key factors that could drive successful PPP programme in Pakistan. The study is expected to provide important information and inputs towards government policy development to encourage PPP undertaking in Pakistan for meeting infrastructure demand.
If you have any questions about the study or in providing answers to the questions, please do not hesitate to contact me. If they could not be resolved via email or telephone, then I will organise to meet you personally on my next visit back to Pakistan. The survey is carried out on a voluntary and completely confidential basis. The information provided will be used as aggregated views of the survey participants and will not be attributed to a person or organisation.
The questionnaire will take about 30 minutes to complete. At the end of the study a copy of aggregated results will be provided to you, if so desired.
Many thanks for assisting this research.
Syed Azeem Ahmed Shah PhD Candidate School of Business International +61 7 4781 3131 Facsimile +61 7 4781 4019 Email [email protected]
Appendix V: Information sheet of survey questionnaire Townsville Campus
Townsville Qld 4811 Australia
Telephone +61 7 4781 4111
International +61 7 4781 4111
www.jcu.edu.au
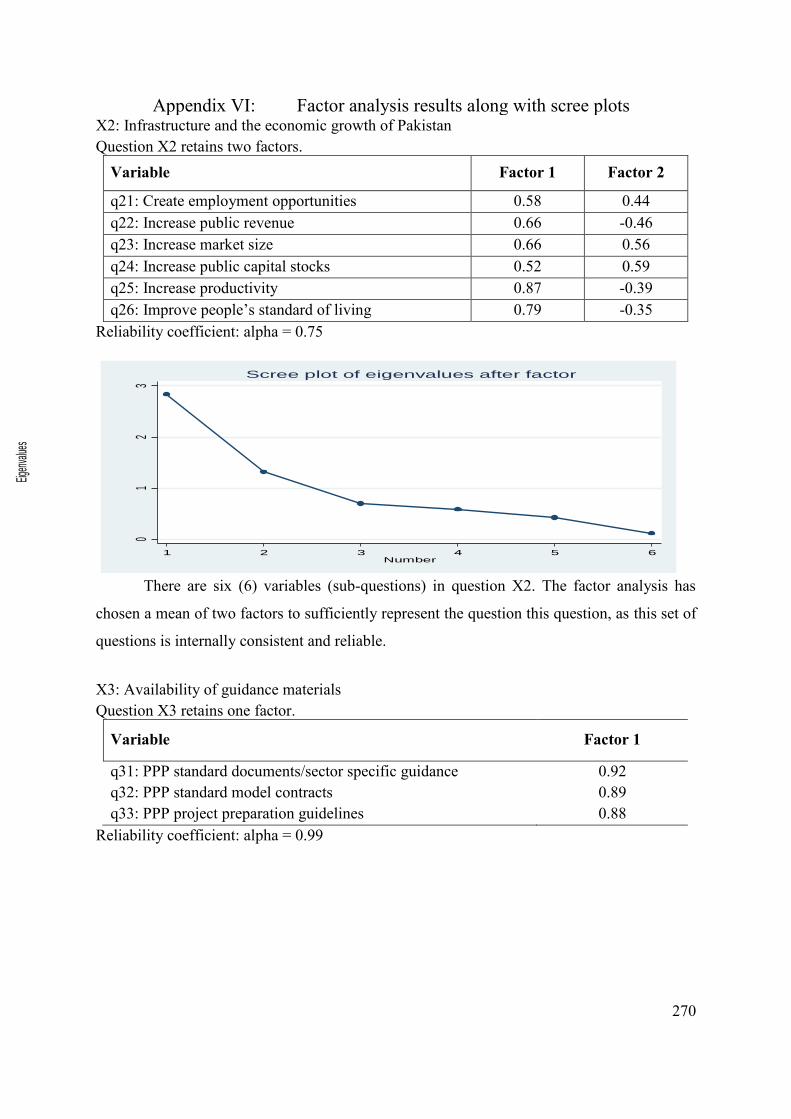
270
X2: Infrastructure and the economic growth of Pakistan Question X2 retains two factors.
Variable Factor 1 Factor 2
q21: Create employment opportunities 0.58 0.44 q22: Increase public revenue 0.66 -0.46 q23: Increase market size 0.66 0.56 q24: Increase public capital stocks 0.52 0.59 q25: Increase productivity 0.87 -0.39 q26: Improve people’s standard of living 0.79 -0.35
Reliability coefficient: alpha = 0.75
There are six (6) variables (sub-questions) in question X2. The factor analysis has
chosen a mean of two factors to sufficiently represent the question this question, as this set of
questions is internally consistent and reliable.
X3: Availability of guidance materials Question X3 retains one factor.
Variable Factor 1
q31: PPP standard documents/sector specific guidance 0.92 q32: PPP standard model contracts 0.89 q33: PPP project preparation guidelines 0.88
Reliability coefficient: alpha = 0.99
01
23
Eigen
value
s
1 2 3 4 5 6Number
Scree plot of eigenvalues after factor
Appendix VI: Factor analysis results along with scree plots

271
There are three (3) variables (sub-questions) in question X3. The factor analysis has
chosen a mean of one factor to sufficiently represent the question this question, as this set of
questions is internally consistent and reliable.
X4: Barriers to PPP program implementations in Pakistan (This question has been split into four sub-questions) X4.1: Admin/Rules & Regulations Question X4.1 retains three factors.
Variable Factor 1 Factor 2 Factor 3
q411: Governance – bureaucratic approvals and formalities are involved 0.51 0.44 0.23
q412: Modifications in original project design increase costs
0.43 0.35 0.59
q413: Lack of coordination at the federal level 0.79 -0.52 0.13
q414: Lack of coordination at the provincial level 0.79 -0.56 0.13
q415: Lack of coordination at the municipal level 0.71 -0.47 0.30
q416: Lack of unidirectional policy framework 0.80 -0.22 -0.18 q417: Apprehension of the government agencies to lose
public control over project management 0.65 0.33 -0.40
q418: Inconsistency of public polices 0.66 -0.059 -0.35 q419: Investment policies framework has its focus only
to attract 0.66 0.55 -0.11
q4110: Excessive regulations and complex legal framework 0.72 0.25 0.26
q4111: Judicial system is not supportive of PPP 0.68 -0.06 -0.42 q4112: Inflexible tariff adjustment (tariff is not adjusted
according to change in consumer price index) 0.54 0.57 0.02
Reliability coefficient: alpha = 0.87
0.5
11.5
22.5
Eigen
value
s
1 1.5 2 2.5 3Number
Scree plot of eigenvalues after factor

272
Factor Loading
There are 12 variables (sub-questions) in question X4.1. The factor analysis has chosen
a mean of three factors to sufficiently represent the question this question, as this set of
questions is internally consistent and reliable.
X4.2: Delay in Project execution Question X4.2 retains two factors.
Variable Factor 1 Factor 2
q421: Lengthy delays due to lack of PPP awareness 0.33 0.72
q422: Lengthy delays due to political debates 0.77 0.30
q423: Lengthy delays in negotiations between contracting parties 0.83 0.25
q424: Delay due to resistance from community groups 0.60 -0.59
q425: Delay due to resistance from environmentalists 0.74 -0.33
q426: Delay due to modifications in original project design 0.58 -0.15
Reliability coefficient: alpha = 0.73
02
46
Eige
nvalu
es
0 5 10 15Number
Scree plot of eigenvalues after factor0
.51
1.52
2.5
Eigen
value
s
1 2 3 4 5 6Number
Scree plot of eigenvalues after factor
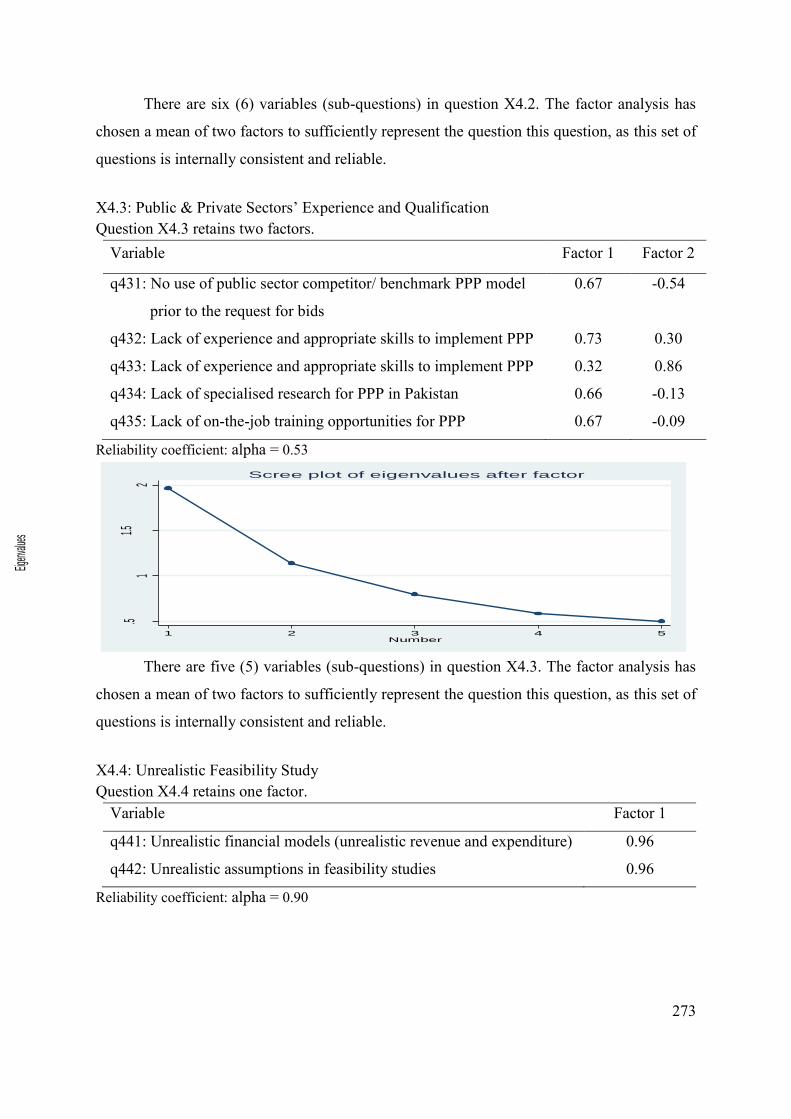
273
There are six (6) variables (sub-questions) in question X4.2. The factor analysis has
chosen a mean of two factors to sufficiently represent the question this question, as this set of
questions is internally consistent and reliable.
X4.3: Public & Private Sectors’ Experience and Qualification Question X4.3 retains two factors.
Variable Factor 1 Factor 2
q431: No use of public sector competitor/ benchmark PPP model
prior to the request for bids
0.67 -0.54
q432: Lack of experience and appropriate skills to implement PPP 0.73 0.30
q433: Lack of experience and appropriate skills to implement PPP 0.32 0.86
q434: Lack of specialised research for PPP in Pakistan 0.66 -0.13
q435: Lack of on-the-job training opportunities for PPP 0.67 -0.09
Reliability coefficient: alpha = 0.53
There are five (5) variables (sub-questions) in question X4.3. The factor analysis has
chosen a mean of two factors to sufficiently represent the question this question, as this set of
questions is internally consistent and reliable.
X4.4: Unrealistic Feasibility Study Question X4.4 retains one factor.
Variable Factor 1
q441: Unrealistic financial models (unrealistic revenue and expenditure) 0.96
q442: Unrealistic assumptions in feasibility studies 0.96
Reliability coefficient: alpha = 0.90
.51
1.52
Eigen
value
s
1 2 3 4 5Number
Scree plot of eigenvalues after factor
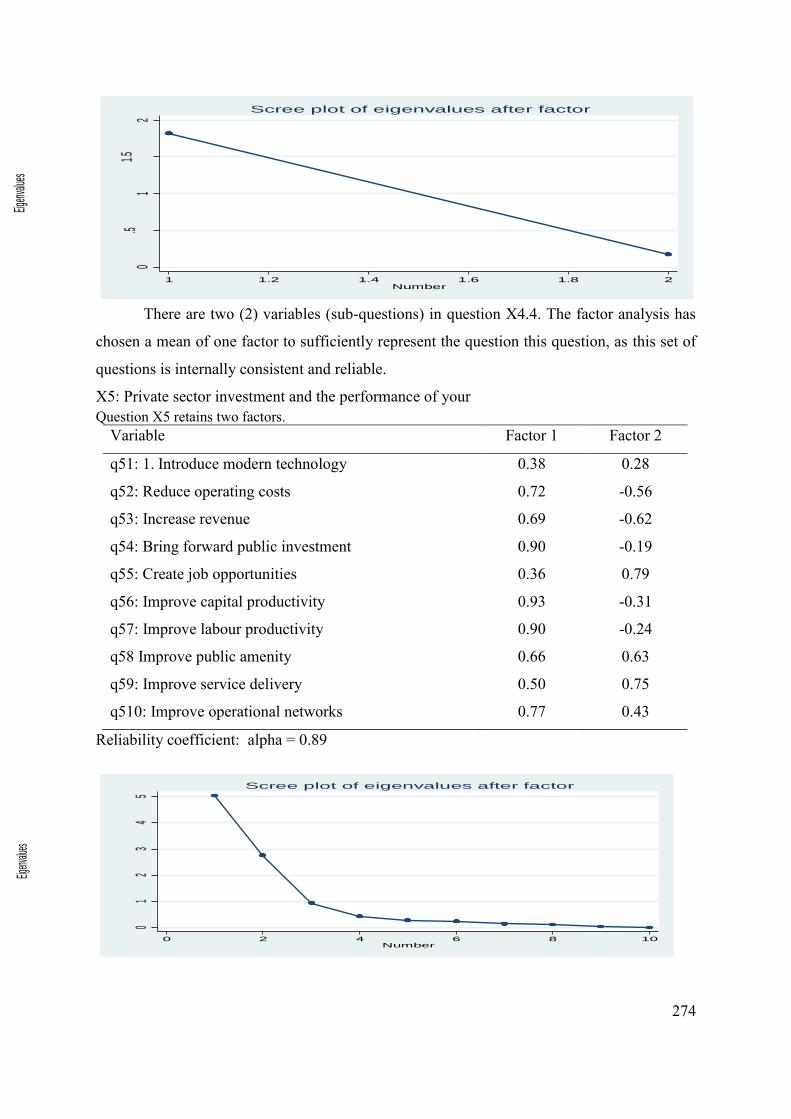
274
There are two (2) variables (sub-questions) in question X4.4. The factor analysis has
chosen a mean of one factor to sufficiently represent the question this question, as this set of
questions is internally consistent and reliable.
X5: Private sector investment and the performance of your Question X5 retains two factors.
Variable Factor 1 Factor 2
q51: 1. Introduce modern technology 0.38 0.28
q52: Reduce operating costs 0.72 -0.56
q53: Increase revenue 0.69 -0.62
q54: Bring forward public investment 0.90 -0.19
q55: Create job opportunities 0.36 0.79
q56: Improve capital productivity 0.93 -0.31
q57: Improve labour productivity 0.90 -0.24
q58 Improve public amenity 0.66 0.63
q59: Improve service delivery 0.50 0.75
q510: Improve operational networks 0.77 0.43
Reliability coefficient: alpha = 0.89
0.5
11.5
2
Eigen
value
s
1 1.2 1.4 1.6 1.8 2Number
Scree plot of eigenvalues after factor
01
23
45
Eigen
value
s
0 2 4 6 8 10Number
Scree plot of eigenvalues after factor
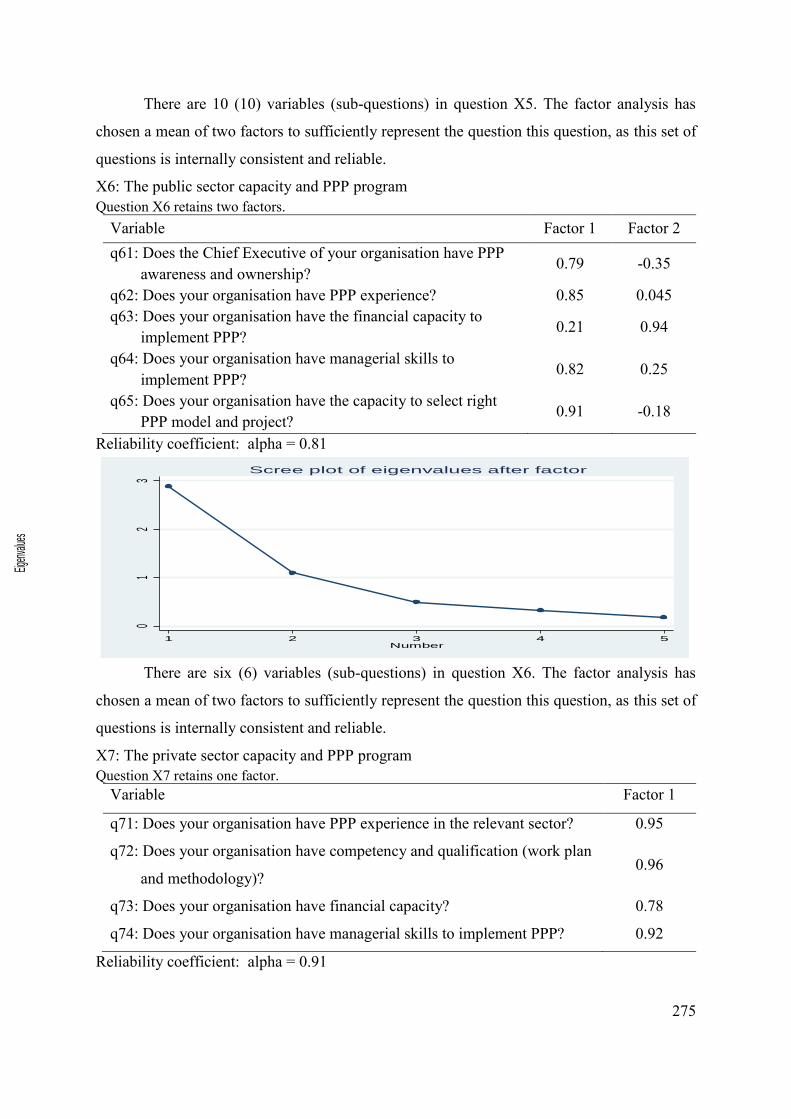
275
There are 10 (10) variables (sub-questions) in question X5. The factor analysis has
chosen a mean of two factors to sufficiently represent the question this question, as this set of
questions is internally consistent and reliable.
X6: The public sector capacity and PPP program Question X6 retains two factors.
Variable Factor 1 Factor 2 q61: Does the Chief Executive of your organisation have PPP
awareness and ownership? 0.79 -0.35
q62: Does your organisation have PPP experience? 0.85 0.045 q63: Does your organisation have the financial capacity to
implement PPP? 0.21 0.94
q64: Does your organisation have managerial skills to implement PPP? 0.82 0.25
q65: Does your organisation have the capacity to select right PPP model and project? 0.91 -0.18
Reliability coefficient: alpha = 0.81
There are six (6) variables (sub-questions) in question X6. The factor analysis has
chosen a mean of two factors to sufficiently represent the question this question, as this set of
questions is internally consistent and reliable.
X7: The private sector capacity and PPP program Question X7 retains one factor.
Variable Factor 1
q71: Does your organisation have PPP experience in the relevant sector? 0.95
q72: Does your organisation have competency and qualification (work plan
and methodology)? 0.96
q73: Does your organisation have financial capacity? 0.78
q74: Does your organisation have managerial skills to implement PPP? 0.92
Reliability coefficient: alpha = 0.91
01
23
Eigen
value
s
1 2 3 4 5Number
Scree plot of eigenvalues after factor

276
There are four (4) variables (sub-questions) in question X7. The factor analysis has
chosen a mean of one factor to sufficiently represent the question this question, as this set of
questions is internally consistent and reliable.
X8: Present institutional arrangements and PPP program in Pakistan. Question X8 retains two factors.
Variable Factor 1 Factor 2
q81: Does PPP unit/board exist in your organisation? 0.58 0.67
q82: Are procurement methods transparent? 0.84 -0.13
q83: Are PPP contracts enforced? 0.88 -0.05
q84: Do dispute-resolution mechanisms exist? 0.65 -0.50
q85: Does your organisation allow private sector participation
in projects development? 0.55 0.63
q86: Are domestic capital markets capable of providing finance
for infrastructure projects? 0.59 -0.43
Reliability coefficient: alpha = 0.89
01
23
Eigen
value
s
1 2 3 4Number
Scree plot of eigenvalues after factor

277
There are six (6) variables (sub-questions) in question X8. The factor analysis has chosen a mean of two factors to sufficiently represent the question this question, as this set of questions is internally consistent and reliable.
01
23
Eige
nvalu
es
1 2 3 4 5 6Number
Scree plot of eigenvalues after factor

278
(The p-value of the respective tests is provided in parentheses)
Variables
Ho: Panel variable is nonstationary
H1: Panel variable is stationary Ho: Panel stationary
H1: Panel non-stationary LLC Lags
IPS Lags
Fisher Lags Hadri
0 1 0 1 0 1 Log of Real GDP (lnrgd_real)
-0.3956 (0.346)
1.541 (0.938)
2.718 (0.997)
4.401 (1.000)
0.061 (0.999)
0.113 (1.000)
28.681 (0.000)
Log of Investment (lninv)
-0.777 (0.219)
-0.263 (0.397)
0.059 (0.524)
0.823 (0.795)
6.196 (0.626)
3.369 (0.909)
14.441 (0.000)
Log of Private Investment (lninv1)
-1.102 (0.136)
-0.052 (0.479)
-1.202 (0.115)
0.986 (0.838)
15,669 (0.048)
9.671 (0.289)
14.453 (0.000)
Log of Public Investment (lninv2)
-1.839 (0.033)
-1.215 (0.113)
-2.201 (0.014)
-2.405 (0.008)
29.578 (0.001)
46.817 (0.000)
3.823 (0.001)
Log of Interest Rate 10 years (lnr)
0.139 (0.555)
-1.174 (0.121)
0.526 (0.701)
-0.616 (0.269)
3.608 (0.891)
7.749 (0.458)
10.863 (0.000)
Variables Differenced Series
Δ Log of Real GDP (lnrgd_real) -4.297 (0.000)
-1.572 (0.058)
-4.235 (0.000)
-2.137 (0.016)
37.242 (0.000)
17.584 (0.025)
-0.970 (0.834)
Δ Log of Investment (lninv) -8.687 (0.000)
-2.655 (0.004)
-8.099 (0.000)
-3.600 (0.001)
95.139 (0.000)
34.049 (0.000)
-1.546 (0.939)
Δ Log of Private Investment (lninv1)
-10.601 (0.000)
-1.247 (0.106)
-10.511 (0.000)
-3.149 (0.000)
147.456 (0.000)
28.724 (0.000)
-1.638 (0.949)
Δ Log of Public Investment (Inv2)
-9.691 (0.000)
-6.733 (0.000)
-8.645 (0.000)
-6.785 (0.000)
103.286 (0.000)
89.051 (0.000)
-1.746 (0.959)
Δ Log of Interest Rate 10 years (lnr)
-4.794 (0.000)
-3.655 (0.001)
-4.259 (0.000)
-3.519 (0.000)
37.518 (0.000)
30.555 (0.000)
-0.191 (0.576)
Appendix VII: Panel unit root tests on log series

279
Number of observations = 69
Number of groups = 3
Overall 2R = 0.1621
Wald 2 (2) = 12.77 with a p-value of 0.0017
Dependent variable: ln( )inv
Coefficient
Standard
error
z P>|z| [95% confidence
interval] ln( )gdp .31403 .08809 3.56 0.000 .14138 .48668 ln( )ir -.00828 .01304 -0.64 0.525 -.03384 .01727
Constant -.00954 .00382 -2.50 0.013 -.01702 -.00205
sigma_e .01332
Appendix VIII: Random effects panel regression estimation of log differenced of total investment – The GLS estimation
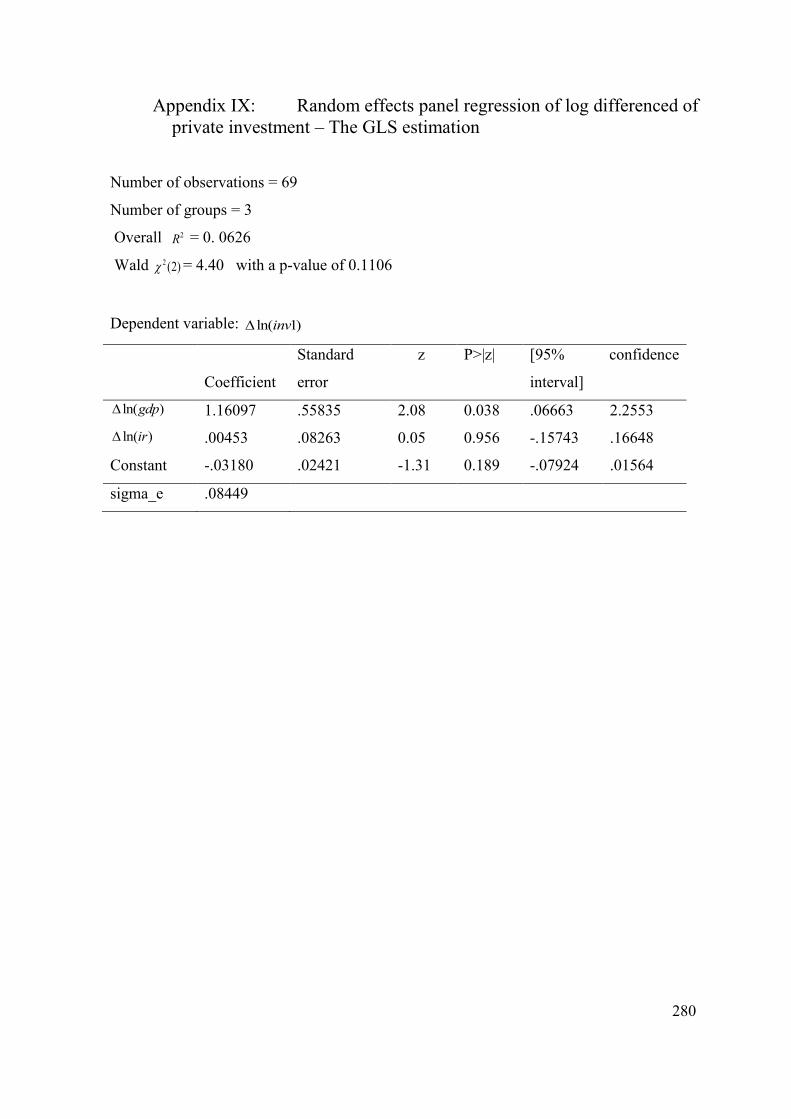
280
Number of observations = 69
Number of groups = 3
Overall 2R = 0. 0626
Wald 2 (2) = 4.40 with a p-value of 0.1106
Dependent variable: ln( 1)inv
Coefficient
Standard
error
z P>|z| [95% confidence
interval] ln( )gdp 1.16097 .55835 2.08 0.038 .06663 2.2553 ln( )ir .00453 .08263 0.05 0.956 -.15743 .16648
Constant -.03180 .02421 -1.31 0.189 -.07924 .01564
sigma_e .08449
Appendix IX: Random effects panel regression of log differenced of private investment – The GLS estimation
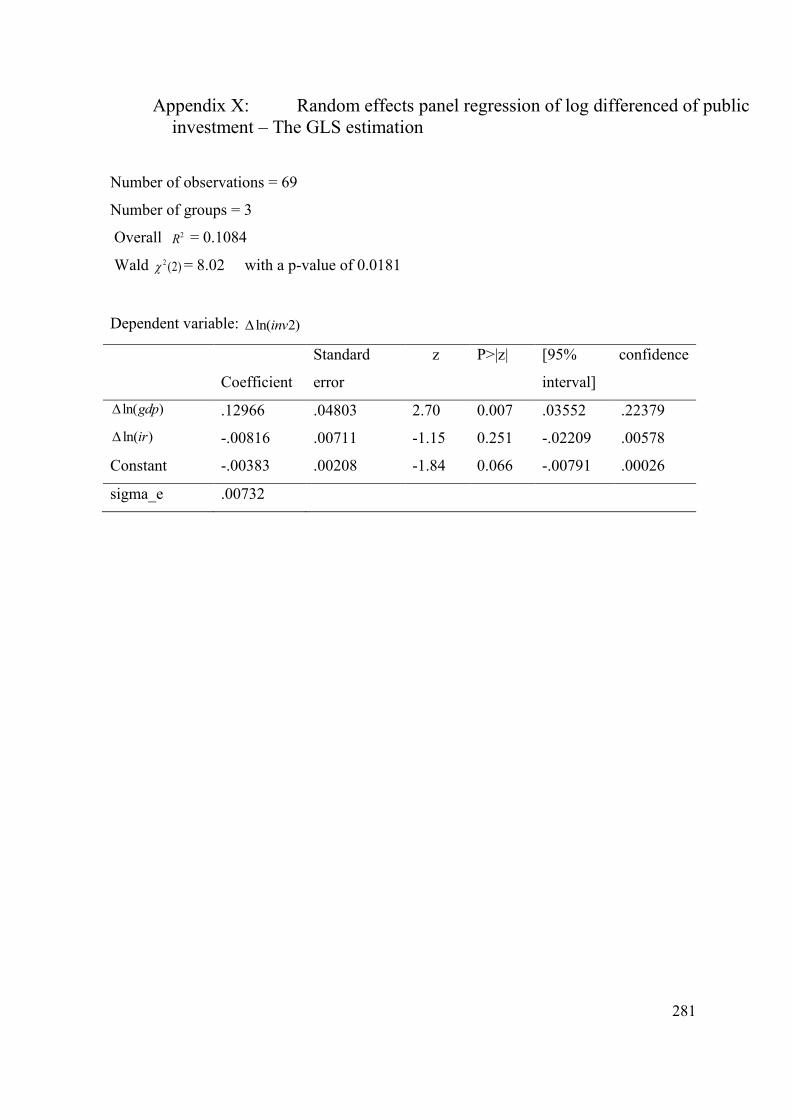
281
Number of observations = 69
Number of groups = 3
Overall 2R = 0.1084
Wald 2 (2) = 8.02 with a p-value of 0.0181
Dependent variable: ln( 2)inv
Coefficient
Standard
error
z P>|z| [95% confidence
interval] ln( )gdp .12966 .04803 2.70 0.007 .03552 .22379 ln( )ir -.00816 .00711 -1.15 0.251 -.02209 .00578
Constant -.00383 .00208 -1.84 0.066 -.00791 .00026
sigma_e .00732
Appendix X: Random effects panel regression of log differenced of public investment – The GLS estimation

282
Number of observations = 69
Number of groups = 3
Overall 2R = 0.3359
Wald 𝜒2(9) = 29.853 with p-value of 0.0005
Dependent variable: )ln(inv
Coefficient Standard
error
Z P>|z| [95% confidence
interval]
ln( )gdp .35381 .08815 4.01 0.000 .18102 .5266
ln( )ir -.00597 .01306 -0.46 0.648 -.03157 .01963
IC .00276 .0015 1.84 0.066 -.00017 .0057
PBC -.00344 .00187 -1.84 0.066 -.00712 .00022
PVC .00345 .00184 1.88 0.061 -.00015 .00707
OF1 .00427 .00196 2.18 0.029 .00043 .00812
OF2 -.00127 .00189 -0.67 0.503 -.00499 .00245
OF3 -.00034 .00173 -0.2 0.843 -.00373 .00305
OF4 .00258 .00168 1.54 0.124 -.0007 .00588
Constant -.04226 .01463 -2.89 0.004 -.07095 -.01356
sigma_e .0123872
Note: represents the log differenced series. In this form, it can be used to measure the growth rate.
Appendix XI: Random effects panel regression of log differenced series and series and exogenous variable total investment– The GLS estimation

283
Number of observations = 69
Number of groups = 3
Overall 2R = 0.2104
Wald 𝜒2(9) = 15.72 with p-value of 0.0729
Dependent variable: )1ln(inv
Coefficient Standard
error
Z P>|z| [95% confidence
interval]
ln( )gdp 1.39354 .57607 2.42 0.016 .26446 2.52263
ln( )ir .01759 .08535 0.21 0.837 -.1497 .1849
IC .01272 .00981 1.3 0.195 -.0065 .03196
PBC -.01834 .01224 -1.5 0.134 -.04235 .00565
PVC .01628 .01204 1.35 0.176 -.00731 .03989
OF1 .02455 .01282 1.92 0.055 -.00056 .04968
OF2 -.00521 .01241 -0.42 0.674 -.02954 .01911
OF3 -.00538 .01132 -0.48 0.634 -.02758 .0168
OF4 .0214 .01099 1.95 0.052 -.00014 .04294
Constant -.2191 .09566 -2.29 0.022 -.4066 -.03161
sigma_e .08130177
Appendix XII: Random effects panel regression with log differenced series and exogenous variable private investment– The GLS estimation

284
Number of observations = 69
Number of groups = 3
Overall = 0.1671
Wald 𝜒2(9) = 11.84 with p-value of 0.2226
Dependent variable:
Coefficient Standard
error
z P>|z| [95% confidence
interval]
.13594 .05218 2.6 0.009 .03365 .23822 -.00816 .00773 -1.06 0.291 -.02332 .00699
IC .00045 .00088 0.51 0.608 -.00128 .00219
PBC -.00062 .0011 -0.56 0.575 -.00279 .00155
PVC .00136 .00109 1.25 0.210 -.00077 .0035
OF1 .00049 .00116 0.43 0.667 -.00177 .00277
OF2 -.00041 .00112 -0.37 0.711 -.00262 .00178
OF3 .00074 .00102 0.73 0.465 -.00126 .00275
OF4 -.00061 .00099 -0.62 0.535 -.00256 .00133
Constant -.00967 .00866 -1.12 0.264 -.02665 .00731
sigma_e .00748655
2R
)2ln(inv
ln( )gdp
ln( )ir
Appendix XIII: Random effects panel regression with log differenced series and exogenous public investment– The GLS estimation

285
Graphs of impulse response function are presented below: -
The response of real GDP due to shock in total investment
A one standard deviation shock to the investment increases real GDP to 0.236 and in
periods 3 – 6 the pattern of movement begins to decrease to -0.043. Then after periods 7 – 10
it begins to increase, after slight variation it stables and then closes to 0.001.
The response of total investment due to shock in total investment
A one standard deviation shock to the investment increases its own to 0.180 and after
periods 3 – 6 the pattern of movement begins to decrease to -0.035. The pattern has slight
variation and eventually stable and then closes to 0.001.
Appendix XIV: Impulse Response Function of PVAR – X Investment Shock to Total Investment

286
The response of interest rate due to shock in total investment
A one standard deviation shock to the investment decreases interest rate to -0.032 and
in periods 4 – 7 the pattern of movement begins to increase to 0.035. But in periods 8 – 11 it
decreases to -0.001. However, after periods 12 it begins to increase, stable and eventually
closes to 0.001.

287
Graphs of impulse response function are presented below:-
The response of GDP due to Shock in real GDP
A one standard deviation shock to the real GDP increases its own to 0.432 and after
slight variation from periods 3 – 6 the pattern of movement decreased, stable and eventually
closes to -0.001.
The response of total investment due to shock in real GDP
A one standard deviation shock to the real GDP increases investment to 0.291 and after
slight variation from periods 3 – 6 and 7 – 10 the pattern of movement decreased, stable and
eventually closes to -0.001.
The response of interest rate due to Shock in real GDP
Appendix XV: Impulse Response Function of PVAR – X Investment Shock to Real GDP

288
A one standard deviation shock to the real GDP decreases interest rate to -0.055. Then
after periods 4 – 7 the pattern of movement begins to increase, stable. Then after periods 8 –
10 the pattern of movement begins to decrease and eventually closes to 0.001.

289
Graphs of impulse response function are presented below:-
The response of real GDP due to shock in interest rate
A one standard deviation shock to the interest rate increases real GDP to 2.529. Then
after slight variation from periods 3 – 7 the pattern of movement decreased, stable and
eventually closes to -0.001.
The response of total investment due to shock in interest rate
A one standard deviation shock to the interest rate increases investment to 2.089. After
slight variation from periods 4 – 7 the pattern of movement decreased, stable and eventually
closes to -0.001.
Appendix XVI: Impulse Response Function of PVAR – X Investment Shock to Interest Rate

290
The response of interest rate due to shock in interest rate
A one standard deviation shock to the interest rate increases its own to 0.209. Then after
slight variation from periods 2 – 4 and from periods 10 – 13 the pattern of movement decreased,
stable and eventually closes to 0.001.

291
Graphs of impulse response function are presented below:-
The response of real GDP due to shock in private investment
A one standard deviation shock to the real GDP increases real GDP to 1.590. Then in
periods 4 – 9 the pattern of movement begins to decrease to -0.045 and after periods 10 – 14
the pattern of movement stable and eventually decreased to -8.54e-06.
The response of Private investment due to shock in private investment
A one standard deviation shock to the private investment decreases its own to -0.129
and after periods 3 - 9 the pattern of movement increased to 1.44e. After periods 10 – 14 it
decreased to -66.53e. However, it eventually closes to 3.99e-08.
The response of interest rate due to shock in private investment
Appendix XVII: Impulse Response Function of PVAR – X Private Investment Shock to Private Investment
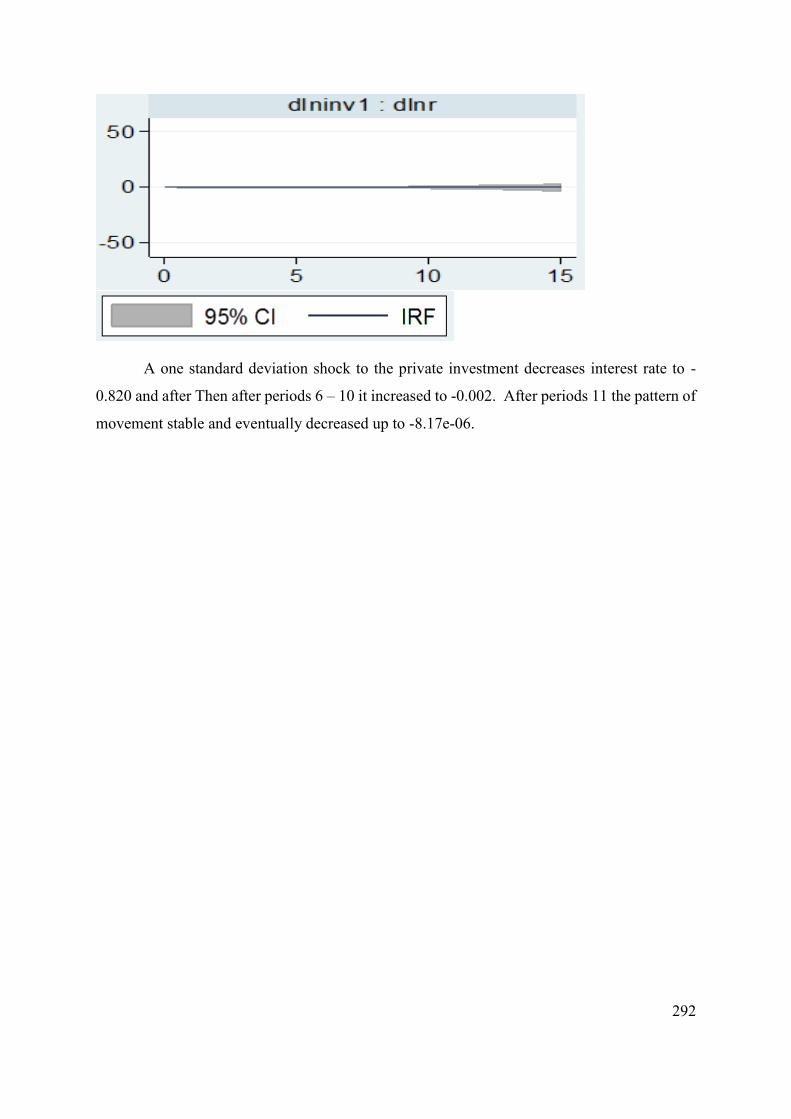
292
A one standard deviation shock to the private investment decreases interest rate to -
0.820 and after Then after periods 6 – 10 it increased to -0.002. After periods 11 the pattern of
movement stable and eventually decreased up to -8.17e-06.
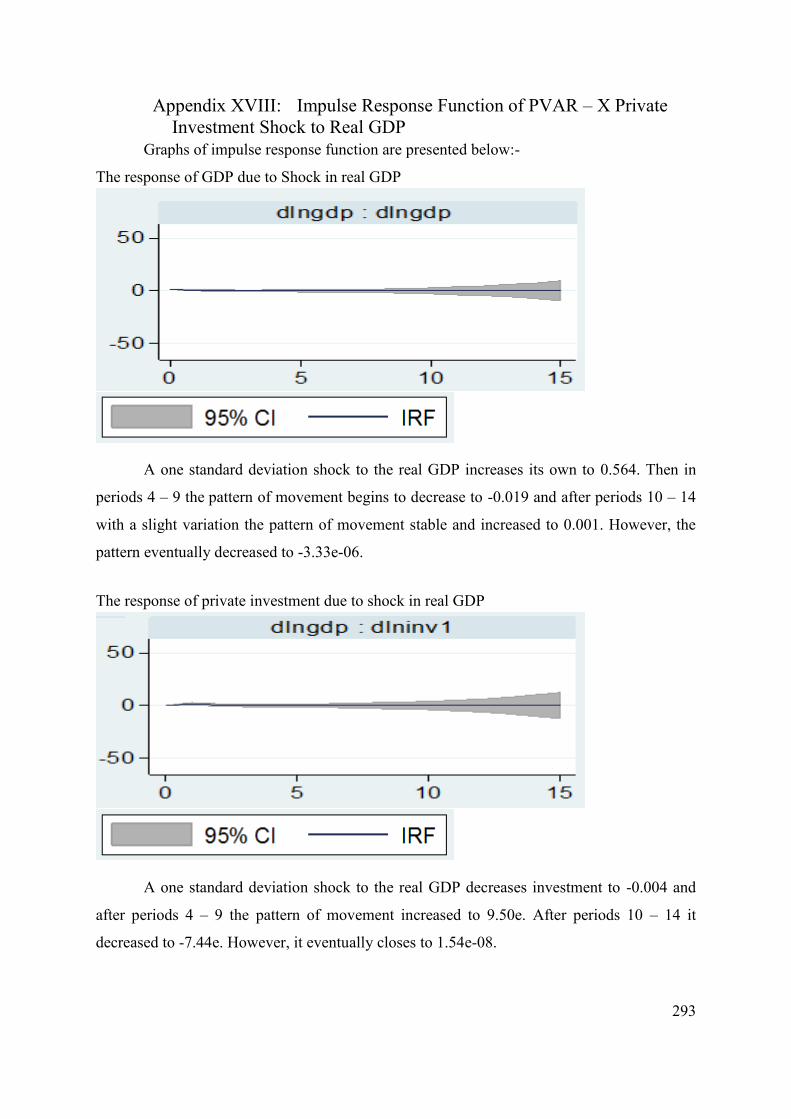
293
Graphs of impulse response function are presented below:-
The response of GDP due to Shock in real GDP
A one standard deviation shock to the real GDP increases its own to 0.564. Then in
periods 4 – 9 the pattern of movement begins to decrease to -0.019 and after periods 10 – 14
with a slight variation the pattern of movement stable and increased to 0.001. However, the
pattern eventually decreased to -3.33e-06.
The response of private investment due to shock in real GDP
A one standard deviation shock to the real GDP decreases investment to -0.004 and
after periods 4 – 9 the pattern of movement increased to 9.50e. After periods 10 – 14 it
decreased to -7.44e. However, it eventually closes to 1.54e-08.
Appendix XVIII: Impulse Response Function of PVAR – X Private Investment Shock to Real GDP
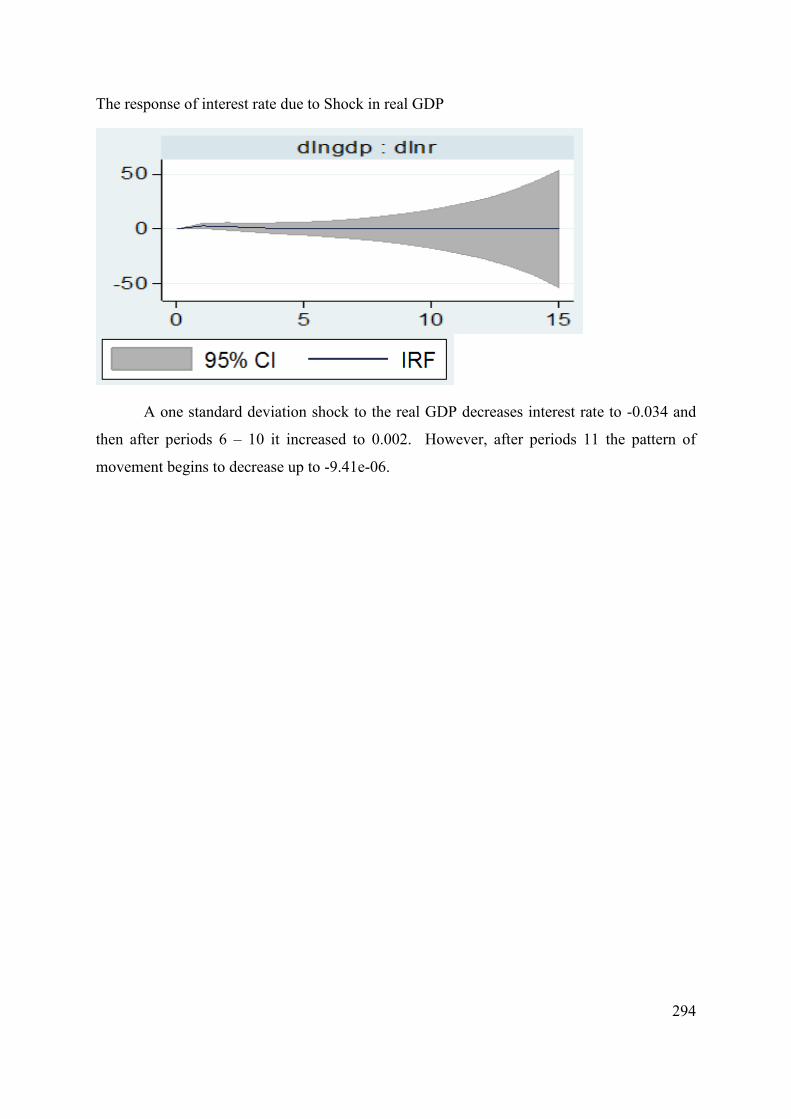
294
The response of interest rate due to Shock in real GDP
A one standard deviation shock to the real GDP decreases interest rate to -0.034 and
then after periods 6 – 10 it increased to 0.002. However, after periods 11 the pattern of
movement begins to decrease up to -9.41e-06.
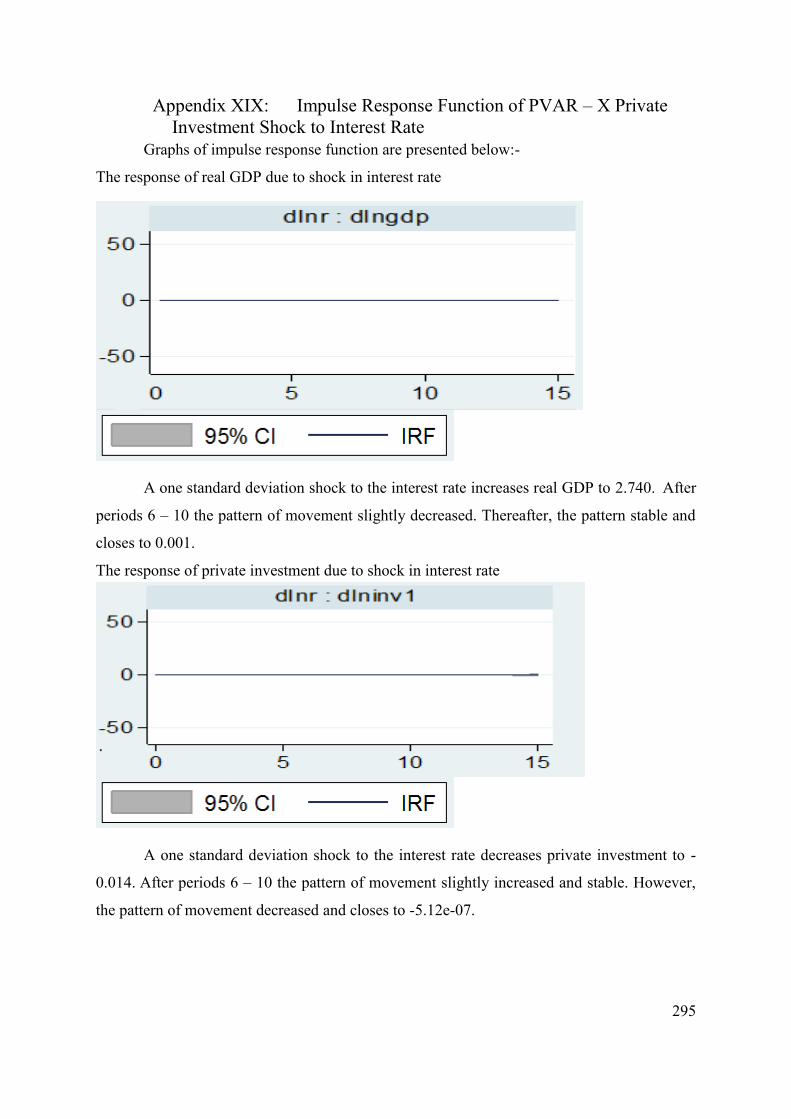
295
Graphs of impulse response function are presented below:-
The response of real GDP due to shock in interest rate
A one standard deviation shock to the interest rate increases real GDP to 2.740. After
periods 6 – 10 the pattern of movement slightly decreased. Thereafter, the pattern stable and
closes to 0.001.
The response of private investment due to shock in interest rate
A one standard deviation shock to the interest rate decreases private investment to -
0.014. After periods 6 – 10 the pattern of movement slightly increased and stable. However,
the pattern of movement decreased and closes to -5.12e-07.
Appendix XIX: Impulse Response Function of PVAR – X Private Investment Shock to Interest Rate

296
The response of interest rate due to shock in interest rate
A one standard deviation shock to the interest rate increases its own to 0.237. Then after
periods 2 – 7 the pattern of movement decreased to -0.081. Thereafter, the pattern slightly
increased to 0.002 and stable. However, after periods 13 the pattern begins to decrease and
eventually closes to -0.001.

297
Graphs of impulse response function are presented below:-
The response of real GDP due to shock in public investment
A one standard deviation shock to the public investment increases real GDP to 0.035
and after periods 2 the pattern of movement begins to decrease. After periods 3 – 14 it decreased
up to -7.25e-07 and eventually closes to -2.17e-08.
The response of public investment due to shock in public investment
A one standard deviation shock to the public investment decreases its own to -0.259.
After periods 3 – 9 with a slight variation the pattern of movement increased to 7.05e-06 and
eventually closes to 2.24e-09.
The response of interest rate due to shock in public investment
Appendix XX: Impulse Response Function of PVAR – X Public Investment Shock to Public Investment
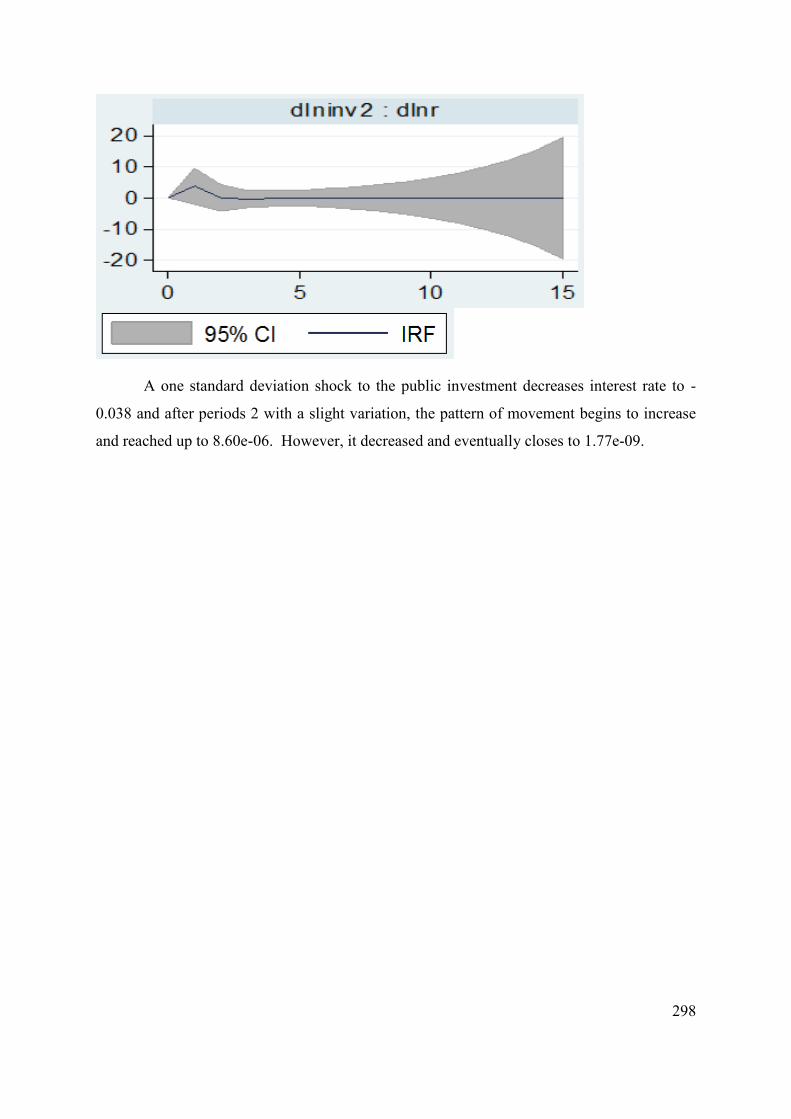
298
A one standard deviation shock to the public investment decreases interest rate to -
0.038 and after periods 2 with a slight variation, the pattern of movement begins to increase
and reached up to 8.60e-06. However, it decreased and eventually closes to 1.77e-09.

299
Graphs of impulse response function are presented below:-
The response of GDP due to Shock in real GDP
A one standard deviation shock to the real GDP increases its own to 0.518. After 2 –
10 the pattern of movement begins to decrease and reached up to 0. 001. However, after periods
10 the pattern of movement begins to increase and eventually increased up to 7.25e-08.
The response of public investment due to shock in real GDP
A one standard deviation shock to the real GDP increases public investment to 0.226
and after periods 3 the pattern of movement begins to decrease and dropped to -3.68e-08.
However, once in periods 12 it increased to 5.10e and thereafter again begins to decrease and
eventually closes to -1.28e-08.
Appendix XXI: Impulse Response Function of PVAR – X Public Investment Shock to Real GDP

300
The response of interest rate due to Shock in real GDP
A one standard deviation shock to the real GDP decreases interest rate to -.023. Then
after periods 2 – 15 the pattern of movement begins to decrease and eventually reached its
highest point and closes to -6.33e-09.

301
Graphs of impulse response function are presented below:-
The response of real GDP due to shock in interest rate
A one standard deviation shock to the interest rate increases real GDP to 2.168. Then
after periods 2 – 12 the pattern of movement begins to decrease and dropped to 0.001. However,
after periods 13 the pattern begins to increase and closes to 4.08e-07.
The response of public investment due to shock in interest rate
A one standard deviation shock to the interest rate increases public investment to 3.859.
Then after periods 3 the pattern of movement begins to decrease and dropped to -8.74e-07.
After slight variation, it closes to -6.24e-08.
Appendix XXII: Impulse Response Function of PVAR – X Public Investment Shock to Interest Rate

302
The response of interest rate due to shock in interest rate
A one standard deviation shock to the interest rate decreases its own to .0145. Then
after periods 2 the pattern of movement begins to decrease and reached to the highest point to
-9.83e-08. However, it finally closes to -3.54e-08.

303
References
. A., W. C., & J., S. A. (1995). Privatized infrastructure: The Build Operate Transfer Approach. Adeniyi, O., Aje, I. O., & Ogunsemi, D. R. (2011). Strengths, weaknesses, opportunities, and
threats for public-private partners in infrastructure delivery in Nigeria. Journal of Construction Project Management and Innovation, 1(2), 130-154.
Adrias, T. H. S. (2010). Public-Private Partnership Recipe for a Financial Disaster, Building the Better World. CIB World Congress, UK.
Ahlstrom, D. (2010). Innovation and Growth: How Business Contributes to Society. Academy of Management Perspectives, 24(3), 11-24. doi:10.5465/amp.24.3.11
Alan, V. D. (2006). Terms of Trade: Glossary of International Economics: World Scientific Publishing Co. Pte. Ltd., Singapore.
Albala-Bertrand, J. M., & Mamatzakis, E. C. (2004). The Impact of Public Infrastructure on the Productivity of the Chilean Economy. Review of Development Economics, 8(2), 266-278. doi:doi:10.1111/j.1467-9361.2004.00232.x
Albalate, D. (2014). The Privatisation and Nationalisation of European Roads: Success and Failure. Edward Elgar Publishing Limited, 1-7.
Albelda, R., Gunn, C., & Waller, W. (1987). Alternatives to Economic Orthodoxy: A Reader in Political Economy. 204- 212.
Albert, d. V., & Wouter, E. (2011). Institutions and the Relation between Corruption and Economic Growth. Review of Development Economics, 15(1), 108-123. doi:doi:10.1111/j.1467-9361.2010.00596.x
Alberto Nucciarelli, B. M. S. a. P. O. A. (2010). Emerging models of public-private interplay for European broadband access: Evidence from the Netherlands and Italy Telecommunications Policy, 513–527.
Alesina, A., & Perotti, R. (1996). Income distribution, political instability, and investment. European Economic Review, 40(6), 1203-1228. doi:https://doi.org/10.1016/0014-2921(95)00030-5
Alfen, H. W. (2010). Public Private Partnership (PPP) as part of Infrastructure Management solutions-a structural approach of delimiting PPP from other Private Sector participation Models. 18th CIB World Building Congress,.
Ali, A. (2003). Institutional differences as sources of growth differences. Atlantic Economic Journal, 31(4), 348-362.
Allen, G. (2001). The Private Finance Initiative (PFI), Research Paper 01/117. ECONOMIC POLICY AND STATISTICS SECTION, RESEARCH PAPER 01/117, 1-49.
Alsalam, N., Beider, P., Gramp, K., & Webre, P. (1998). The Economic Effects of Federal Spending on Infrastructure and other Investments. Research Paper, Congressional Budget Office, Washington.
Alves, A. J., Ferrari, F., & De Paula, L. F. R. (1999). The Post Keynesian Critique of Conventional Currency Crisis Models and Davidson’s Proposal to Reform the International Monetary System. Journal of Post Keynesian Economics, 22(2), 207-225. doi:10.1080/01603477.1999.11490237
Andrews, K., & Swanson, J. (1995). Does Public Infrastructure Affect Regional Performance? Growth and Change, 26(2), 204-216. doi:doi:10.1111/j.1468-2257.1995.tb00168.x
Aschauer, D. A. (1989). Does public capital crowd out private capital? Journal of Monetary Economics, 24(2), 171-188. doi:https://doi.org/10.1016/0304-3932(89)90002-0
304
Aschauer, D. A. (1989b). Does public capital crowd out private capital? Journal of Monetary Economics, 24(2), 171-188. doi:https://doi.org/10.1016/0304-3932(89)90002-0
Aschauer, D. A. (2000a). Do States Optimise? Public Capital and Economic Growth. Annals of Regional Science, 34(3), 343-363.
Aschauer, D. A. (2000b). Do States Optimize? Public Capital and Economic Growth. The Annals of Regional Science, 34(3), 343-363.
Atkinson, R., & Stewart, L. (2013). The economic benefits of information and communication technology. ITIF paper, Information Technology Innovation, The Information Technology & Innovation Foundation(www2.itif.org/2013-tech-economy-memo.pdf).
Barro, & Sala-i-Martin. (2001). Economic Growth, 2nd Edition. The MIT Press, Cambridge, Massachusetts.
Barro, R. J. (1990). Government Spending in a Simple Model of Endogeneous Growth. Journal of Political Economy, 98(5, Part 2), S103-S125. doi:10.1086/261726
Berndt, E. R. H. (1992). Measuring the Contribution of Public Infrastructure Capital in Sweden Scandinavian Journal of Economics, 94, 151-168.
Bjorvatn, K. (2000). Urban Infrastructure and Industrialization. Journal of Urban Economics, 48(2), 205-218. doi:https://doi.org/10.1006/juec.1999.2162
Blinder, A. S. (2002). Keynesian Economics The Concise Encyclopedia of Economics, http://www.econlib.org/library/Enc/KeynesianEconomics.html.
Bovis, C. H. (2015). Risk in Public-Private Partnerships and Critical Infrastructure. European Journal of Risk Regulation, 6(2), 200-207. doi:10.1017/S1867299X00004505
Business Monitor International. (2016). Pakistan Infrastructure Report 2016. Business Monitor International, United Kingdom.
Cavalcanti, T. N., Á. (2005). Institutions and economic development: How strong is the relation? Empirical Economics, 30, 263-276.
Chan, A. P. C., Wang, S., & Ke, Y. (2009). Public-Private Partnerships In China’s Infrastructure Development: Lessons Learnt. Department of Construction Management, Tsinghua University, Beijing, China.
Cheung, E., Chan, A. P. C., & Kajewski, S. (2009). Reasons for implementing public private partnership projects Perspectives from Hong Kong, Australian and British practitioners. Journal of Property Investment & Finance, 27(1), 81-95.
Cheung, E., Chan, A. P. C., & Kajewski, S. (2012). Factors contributing to successful public private partnership projects: Comparing Hong Kong with Australia and the United Kingdom. Journal of Facilities Management, 10(1), 45-58. doi:doi:10.1108/14725961211200397
Confederation of British Industry, London, UK. (2007). Building on Success: The way forward for PFI www.cbi.org.uk. Retrieved on 22/11/2012.
Conrad, K. (1997). Traffic, Transport, Infrastructure and Externalities, a theoretical framework for a CGE Analysis. The Annals of Regional Science, 31, 369-389.
Creane, S., Goyal, R., Mobarak, A., & Sab, R. (2003). Financial Development and Growth in the Middle East and North Africa: IMF eLibrary.
Creane, S., Goyal, R., Mobarak, A., & Sab, R. (2006). Measuring Financial Development in the Middle East and North Africa: A New Database. IMF Staff Papers, 53(3), 479-511.
Cronbach, L. J. (1951). Coefficient Alpha and the internal structure of tests. Psychometrika, 16(3).
Crotty, J. R. (1980). Post-Keynesian Economic Theory: An Overview and Evaluation. The American Economic Review, 70(2), 20-25.

305
Crotty, J. R. (1992). Neoclassical and Keynesian Approaches to the Theory of Investment. Journal of Post Keynesian Economics, 14(4), 483-496. doi:10.1080/01603477.1992.11489912
Crotty, J. R. (1996). Is New Keynesian Investment Theory Really “Keynesian”? Reflections on Fazzari and Variato. Journal of Post Keynesian Economics, 18(3), 333-357. doi:10.1080/01603477.1996.11490076
Dani Rodrik, A. S. a. F. T. (2002). Institutions Rule: The Primacy of Institutions Over Geography and Integration in Economic Development. Journal of Economic Growth, Volume, 9(2), 131-165.
Dawson, J. W. (2006). Institutions, Investment, and Growth: New Cross-Country and Panel Data Evidence. Economic Inquiry, 36(4), 603-619. doi:doi:10.1111/j.1465-7295.1998.tb01739.x
De, P. (2010). Governance, Institutions, and Regional Infrastructure in Asia . ADBI Working Paper No. 183, Available at SSRN: https://ssrn.com/abstract=1592793 or http://dx.doi.org/10.2139/ssrn.1592793.
Dilawar Hussain. (2018). Coal-based power plant abandoned — a year’s work gone to waste. Dawn Newspaper(12-03-2018).
Durham, J. B. (2004). Economic Growth and Institutions: Some Sensitivity Analyses, 1961–2000. International Organization, 58(3), 485-529. doi:10.1017/S0020818304583030
Economist Intelligence Unit. (2009). Finding and Methodology: Partnerships for Progress? Evaluating the environment for Public Private Partnerships in Latin America and the Caribbean.
Edwards, B. (1998). Survey: Financial centres: Capitals of capital. The Economist, Retrieved from https://search-proquest-com.elibrary.jcu.edu.au/docview/224096793?accountid=16285( May 2009).
EIU, E. I. U. ( 2012). Evaluating the environment for public-private partnerships in Latin Americ and the Caribbean. The 2012 Infrascope
Erenburg, S. (1994). Linking Public Capital to Economic Performance, Public Capital: The Missing Link between Investment and Economic Growth. Economic Policy Brief 14/1994,, The Jerome Levy Economics Institute of Bard College, New York.(http://www.levyinstitute.org/publications/linking-public-capital-to-economic-performance, Retrieved on 11/12/2012).
Escobal, J. A., & Ponce, C. (2011). Access to public infrastructure, institutional thickness and pro-poor growth in Rural Peru. Journal of International Development, 23(3), 358-379. doi:doi:10.1002/jid.1775
Espelt, R. (2015). Lessons Learned and Best Practices in Public-Private Partnership Projects. MULTILATERAL INVESTMENT FUND of the Inter-American Development Bank.
Estache, A. G.-L., Andres; Leipziger, Danny. (2000). Utilities Privatization and need of the Poor in Latin American: Have We Learned Enough to Get It Right The World Bank Institution, Policy Research Working Paper – 2407, 1-40.
European Commission Directorate-General Regional Policy. (2003). Guidelines for Successful Public-Private Partnerships,
. European PPP Center, http://www.epppc.hu/greece, Retrieved on 19-02-2014.
. European Commission Directorate-General Regional Policy. (2004). Resource Book on PPP
Case Studies: . www.http//;ec.europa.eu/regional_policy/sources/docgener/guides/pppresourcebook.pdf,
Retrieved on 04/07/2012.
306
European PPP Expertise Centre. (2012). PPP Units and Related Institutional Framework (France).
Farhadi, M., Ismail, R., & Fooladi, M. (2012). Information and Communication Technology Use and Economic Growth. PLoS ONE 7(11): e48903. https://doi.org/10.1371/journal.pone.0048903.
Flachaire, E., García-Peñalosa, C., & Konte, M. (2014). Political versus economic institutions in the growth process. Journal of Comparative Economics, 42(1), 212-229. doi:https://doi.org/10.1016/j.jce.2013.05.001
Fletcher, G. (1989). The Keynesian Revolution and Its Critics: Issues of Theory and Policy for the Monetary Production Economy. . Palgrave MacMillan.
Fombad, M. C. (2015). Governance in Public–Private Partnerships in South Africa: Some Lessons from the Gautrain. Journal of Southern African Studies, 41(6), 1199-1217. doi:10.1080/03057070.2015.1117240
Gail, M. S., & Anthony, R. A. (2013). Analyzing and Interpreting Data from Likert-Tyype Scales. Journal of Graduate Medical Education, 5(4), 541-542.
Ghosh, S., & Mourmouras, I. A. (2002). On Public Investment, Long-Run Growth, and the Real Exchange Rate. Oxford Economic Papers, 54(1), 72-90.
Gordon, M. J. (1992). The Neoclassical and a Post Keynesian Theory of Investment. Journal of Post Keynesian Economics, 14(4), 425-443. doi:10.1080/01603477.1992.11489909
Gourishankar, J. (2017). What is circular debt? Retrieved from https://www.quora.com/What-is-circular-debt
Government Digital Service UK. (2018). PPP/Project Finance Initiative https://www.gov.uk/government/collections/public-private-partnerships.
Graeme, H. a. G., Carsten (2018). Contemporary public–private partnership: Towards a global research agenda. John Wiley & Sons Ltd, Financial Acc & Man. (34:3-16),
1-15. Grimsey, D., & Lewis, M. (2004). Public private partnerships: The Worldwide Revolution in
Infrastructure Provision and Project Finance. Edward Elgar Publishing Limited. Grimsey, D., & Lewis, M. (2007a). Public Private Partnerships and Public Procurement. 14,
171-188. Grimsey, D., & Lewis, M. (2007b). Public Private Partnerships and Public Procurement
Agenda: A Journal of Policy Analysis and Reform, 14(2), 171-188. Grimsey, D., & Lewis, M. (2017). Global Developments in Public Infrastructure
ProcurementEvaluating Public–Private Partnerships and Other Procurement Options. In Implementing a partnership agenda.
Herpen, V. G. W. E. B. (2002). Public Private Partnerships, The Advantages and Disadvantages Examined, . Dutch Ministry of Transport, Public Works and Water Management, Directorate-General of Public Works and Water Management, AVV Transport Research Centre.
Hodge, G., & Greve, C. (2009). PPPs: The passage of time permits a sober reflection. Economic Affairs, 29(1), 33-39.
Hua, X., & Karen, M. (2012). Public-Private Partnerships for Social And Human Services: A Case Study of
Nonprofit Organizations in Alabama. Public Administration Quarterly, 36(3), 277-310. IMF, I. M. F. (2004). Financial Sector Development in the Middle East and North Africa IMF
Working Paper WP/04/201, 1-52. Infrastructure Management Unit, Planning Commission of Pakistan (2007). Constraints to
Private Investment in Infrastructure: Diagnostic Report.
307
Instate Pty. Ltd. (2001). Infrastructure for Economic Development: The Issues. Sydney, Australia.
International Monetary Fund. (2014). The World Economic Outlook Database. https://www.imf.org/external/pubs/ft/weo/2014/02/weodata/index.aspx, 10/04/2015.
Investopedia. (2018). Hedging transaction. https://www.investopedia.com/terms/h/hedging-transaction.asp. Retrieved on 27-08-2018.
IPDF, I. P. D. F. (2007). Public Private Partnerships. IPDF Bulletin, July-September, 2007(http://www.ipdf.gov.pk.).
Ismail, S. (2013). Critical success factors of public private partnership (PPP) implementation in Malaysia. Asia-Pacific Journal of Business Administration, 5(1), 6-19.
Jamali, D. (2004). Success and failure mechanisms of public private partnerships (PPPs) in developing countries Insights from the Lebanese context. The International Journal of Public Sector Management, 17, 414-430.
Jin, X.-H., & Zhang, G. (2011). Modelling optimal risk allocation in PPP projects using artificial neural networks. International Journal of Project Management, 29(5), 591-603. doi:https://doi.org/10.1016/j.ijproman.2010.07.011
Jingfeng, Y., Yajun, Z. A., J., S. M., & Qiming, L. (2009). Selection of Performance Objectives and Key Performance Indicators in Public–Private Partnership Projects to Achieve Value for Money. Construction Management and Economics, 27(3), 253-270. doi:10.1080/01446190902748705
Johnston, J., & Kouzmin, A. (2010). Addressing governance, accountability and performance monitoring issues in partnerships: can 'Infrastructure Australia' provide a strategic response?’ Public Administration Quarterly, 34(4), 513-551.
Jooste, S. F., & Raymond, L. E. (2009). The Impacts of Infrastructure PPPs on Public Sector Capacity.
Kerr, P. (2005). A history of post-Keynesian economics. Cambridge Journal of Economics, 29(3), 475-496. doi:10.1093/cje/bei029
Klaes, M. (2000). The History of the Concept of Transaction Costs: Neglected Aspects (Vol. 22).
Klijn, E.-H., & Teisman, G. R. (2003). Institutional and Strategic Barriers to Public—Private Partnership: An Analysis of Dutch Cases. Public Money & Management, 23(3), 137-146. doi:10.1111/1467-9302.00361
Klingebiel, D., Ruster, J., & World Bank. (2000). Why infrastructure financing facilities often fall short of their objectives. Washington, DC: World Bank, Private Sector Development Dept., Private Participation in Infrastructure.
Kolzow, D. R. (1994). Public/private partnership: The economic development organization of the 90s. Economic Development Review, 12(1).
Koppenjan, J. F. M., & Bert, E. (2009). Public–Private Partnerships in Urban Infrastructures: Reconciling Private Sector Participation and Sustainability. Public Administration Review, 69(2), 284-296. doi:doi:10.1111/j.1540-6210.2008.01974.x
Lakshmanan, L. (2008). Public Private Partnership in Indian Infrastructure Development: Issues and Options. Reserve Bank of India Occasional Papers, 29(1).
Li, B., Akintoye, A., Edwards, P. J., & Hardcastle, C. (2005). Perceptions of positive and negative factors influencing the attractiveness of PPP/PFI procurement for construction projects in the UK: Findings from a questionnaire survey. Engineering, Construction and Architectural Management, 12(2), 125-148. doi:doi:10.1108/09699980510584485
308
Lin, J. Y., & Doemeland, D. (2012). Beyond Keynesianism: Global Infrastructure Investment in Times of Crisis. The World Bank, Development Economics Vice Presidency, Office of the Chief Economist, Policy Research Working paper 5940.
Linda, M. E. (2006). Public Private Partnerships In Australia: An Overview of Their Nature, Purpose, Incidence and Oversight. UNSW Law Journal, 29(3), 250-261.
Looney, R. E. (1997). Infrastructure and Private Sector Investment in Pakistan Journal of Asian Economics, 8(3). Lueck, D. (2008). Property Law, Economics and. Luintel, K. B. K., Mosahid. Arestis,Philip. Theodoridis,Konstantinos. (2008). Financial
structure and economic growth. Journal of Development Economics, 86(1), 181-200. doi:https://doi.org/10.1016/j.jdeveco.2007.11.006
Mares, B., Emilio, J., Pérez, E., Javier, F., García, M., & José, M. (2002). The Effect of Public Infrastructure on the Private Productive Sector of Spanish Regions. Journal of Regional Science, 42(301-326).
Martin, S.-S. (2007). Private Financing and Infrastructure Provision in Emerging Markets. The Economics of Public Private Partnerships, . Edward Elgar Publishing Limited, UK.
Ministry of Finance. (2011). Debt Policy Statement 2011-12. Ministry of Finance, Debt Policy Coordination Office, Government of Pakistan.
Ministry of Finance. (2012). Economic Survey of Pakistan. Ministry of Finance, G. o. P. (2016). Fiscal Responsibilty and Debt Limitation Act 2005. Ministry of Planning Development and Reform. (2015). Pakistan Vision 2025. Ministry of
Planning Development and Reform, Government of Pakistan. Mo, P. H. (2011). Institutions, Entrepreneurship and Channels to Sustained Economic Growth
MPRA Paper 28911, University Library of Munich, Germany. MoF Lithuania, M. o. F. o. t. R. o. L. (2018). PPP Advantages and Disadvantages.
ttps://finmin.lrv.lt/en/competence-areas/public-and-private-partnership-ppp/ppp-advantages-and-disadvantages, 04/07/2018.
Mona, H., Jean-Francois, R., & Etienne, B. Y. (2006). Determinants of Public-Private Partnerships in Infrastructure. IMF Working Paper, IMF Institute, https://www.imf.org/external/pubs/ft/wp/2006/wp0699.pdf. Retrieved on 10/08/2009.
Moody’s. (2012). Credit Rating. www.moodys.com/credit-ratings/Pakistan-Government-of-credit-rating-600014774, retrieved on 03-08-2012.
Morewedge, C. K., Tang, S., & Larrick, R. P. (2018). Betting Your Favorite to Win: Costly Reluctance to Hedge Desired Outcomes. Management Science, 64(3), 997-1014. doi:10.1287/mnsc.2016.2656
Munnell, A. H. (1990). How Does Infrastructure Affect Regional Economic Performance? Proceedings of a Conference held at Harwich Port, Massachusetts in June, 1990. Sponsored by the Federal Reserve Bank of Boston.
, https://www.bostonfed.org/...economic.../how-does-public-infrastructure-affect-region. Retrieved on 11/09/2011.
Murtaza Mohsin. (2009). Rental power plants in Pakistan: myth vs reality. Overseas Pakistani Friends, https://www.opfblog.com/8786/rental-power-plants-in-pakistan-myth-vs-reality/(Retrieved on 04-09-2018).
Nataraj, G. (2007). Infrastructure Challenges in South Asia: The Role of Public-Private Partnerships. ADB Institute Discussion Paper No. 80. .
National Audit Office. (2003). PFI: Construction Performance. UK. http://infrastructureaustralia.gov.au/policy-
309
publications/publications/files/PFI_constn_perf_UK_NAO.pdf, Retrieved on 22/11/2013.
National Planning Board. (1957). 1st Five Year Plan 1955-1960. National Planning Board, Government of Pakistan.
National Planning Board. (1960). 2nd Five Year Plan 1960-1965. National Planning Board, Government of Pakistan.
National planning Board. (1965). 3rd Five Year Plan 1965-1970. National Planning Board, Government of Pakistan.
Niggle, C. (2006). Evolutionary Keynesianism: A Synthesis of Institutionalist and Post Keynesian Macroeconomics. Journal of Economic Issues, 40(2), 405-412.
Nikbakht, E. (2006). Finance: Barron's. Nisar, T. M. (2011). The Design and Implementation of Public Private Partnerships in the UK's
Social Sector. School of Management, Univesity of Southamton. UK. Norman, L., & Tomoko, W. (2012). Public Infrastructure Trends and Gaps in Pakistan. World
Bank Policy Paper Series on Pakistan, PK 10/12, South Asia Poverty Reduction and Economic Management Unit.
North, D., C. (1990). Institutions, Institutional Change and Economic Performance. Cambridge University Press.
North, D., C. (1994). Economic Performance Through Time, Nobel prize lecture, December 19, 1993. Also published in The American Economic Review, 84 (3), 359-368.
Norwich University Public Administration. (2014). Characteristics of Successful Public Policy. www.graduate.norwich.edu/resources-mpa/infographics-mpa/characteristics-of-successful-public-policy/, retrieved on 24 November 2014.
O'Sullivan, A., & Sheffrin, S. M. (2003). Economics : principles in action. Needham, Mass.: Prentice Hall.
OECD. (2010). Dedicated Publicprivate Partnership Units-A Survey of Institutional and Governance Structure.
OEDC. (2010). Public-Private Partnerships and Investment in Infrastructure. Economic Department Working Papers No.803, OEDC Publishing.
Ökten, Z. (2011). Reforming international financial system: Post Keynesian perspective (Vol. 65).
Oxford Dictionary. (2018). https://en.oxforddictionaries.com/definition/infrastructure. Pakistan Bureau of Statistics. (2018). Population Census 2017. Pakistan Railways. (2015). Year Book 2014-2015. Paul, H. (2007). Public and Private: Partners in the public interest. The Smith Institute.UK. Paul, S. (2003). Effects of Public Infrastructure on Cost Structure and Productivity in the
Private Sector. Economic Record, 79(247), 446-461. doi:doi:10.1111/j.1475-4932.2003.00144.x
Pereira, A., M., & Andraz, J. M. (2005). Public Investment in Transportation Infrastructure and Economic Performance in Portugal. Review of Development Economics, 9(2), 177-196. doi:doi:10.1111/j.1467-9361.2005.00271.x
Pereira, A. M., & Roca-Sagales, O. (2001). Infrastructures and private sector performance in Spain. Journal of Policy Modeling, 23(4), 371-384. doi:https://doi.org/10.1016/S0161-8938(01)00068-0
Peter, M. (2010). Infrastructure policy in Asian developing countries. Asian-Pacific Economic Literature, 24(1), 9-25. doi:doi:10.1111/j.1467-8411.2010.01247.x
Planning Commission. (2012). Creating a Place for the Future: Rethinking Connectivity as Interactivity Role of Networks. Planning Commission, Government of Pakistan.

310
Planning Commission of Pakisatan. (1970). 4th Five Year Plan 1970-1975. Planning Commission, Government of Pakistan.
Planning commission of Pakisatan. (1988). 7th Five Year Plan 1988-1993. Planning Commission, Government of Pakistan.
Planning Commission of Pakisatan. (2013). Pakistan 2025. Podriguez, J. (2018). Public Private Partnership Pros and Cons. The Balance Small Business,
https://www.thebalancesmb.com/public-private-partnership-pros-and-cons-844713(04/07/2018).
Poitras, G. (2002). The philosophy of investment: a Post Keynesian perspective. Journal of Post Keynesian Economics, 25(1), 105-121. doi:10.1080/01603477.2002.11051342
PPP Knowledge Lab. (2018). PPP Introduction. https://pppknowledgelab.org/guide/sections/1-introduction.
PPPIRC, Public-Private-Partnership in Infrastructure Resource Center (2018). Government Objectives: Benefits and Risks of PPPs. Public-Private-Partnership in Infrastructure Resource Center, PPPIRC, https://ppp.worldbank.org/public-private-partnership/overview/ppp-objectives.
Pressman, S. (2011). Microeconomics After Keynes: Post Keynesian Economics and Public Policy. American Journal of Economics and Sociology, 70(2), 511-539. doi:doi:10.1111/j.1536-7150.2011.00775.x
Regan, M. (2004). Infrastructure: a new asset class in Australia,. Research Report 03-04, Gilberton Press, Australia., 91-95.
Regan, M. (2008). What impact will the current capital market conditions have on PPPs? Mirvac School of Sustainable developmen,Bond University, Gold Coast, Australia, Research Report 121.
Regan, M. (2009). A survey of Alternative Financing Mechanisms for Public Private Partnership. Survey Report, Mirvac School of Sustainable Development, Bond University, Gold Coast, Australia.
Regan, M. (2010). Glossary of Terms-Project Finance, Sustainable Development and Project Procurement. Working Paper WP114, Revised 4 Jannuary, 2010.
Regan, M., Smith, J., & Love, P. (2009). Public private partnerships: What does the future hold? Bond Business School Publications, Bond University, Gold Coast, Australia, The Construction and Building Research Conference (COBRA 2009) of the Royal
Institution of Chartered Surveyors (RICS), 462-474. Regan, M., Smith, J., & Love, P. (2011). Infrastructure Procurement: Learning from Private–
Public Partnership Experiences ‘Down Under’. Environment and Planning C: Government and Policy, 29(2), 363-378. doi:10.1068/c10122b
Romain, B., Romain, D., & Fabrice, M. (2011). Policy and Institutional Drivers of Economic Growth Across OECD and Non- OECD Economies. . OEDC Economics Department,, Working Paper No. 843, 65-104.
Rosenau, P. V. (1999). Introduction:The Strengths and Weaknesses of Public-Private Policy Partnerships. American Behavioral Scientist, 43(1), 10-34. doi:10.1177/0002764299043001002
Samii, R., Van, W. L. N., & Bhattacharya, S. (2002). An Innovative Public–Private Partnership: New Approach to Development. World Development, 30(6), 991-1008. doi:https://doi.org/10.1016/S0305-750X(02)00015-3
Sanchez-Robles, B. (1998). Infrastructure Investment and Growth: Some Empirical Evidence. Contemporary Economic Policy, 16(1), 98-108. doi:doi:10.1111/j.1465-7287.1998.tb00504.x

311
Satish, D., & Shah, P. (2009). A Study of Public Private Partnership Models. IUP Journal of Infrastructure, 7(1), 22-37.
Sharma, B. (2016). A foucus on reliability in developmental reserach through Cronbach's Alpha among medical, dental and paramedical professionals. Asia Pacific Journal of Health Sciences, 3(4), 271-278.
Sloman, J., & Norris, K. (2008). Principles of economics (2nd ed). . Pearson Education, Frenchs Forest, N.S.W.
Spackman, M. (2002). Public–private partnerships: lessons from the British approach. Economic Systems, 26(3), 283-301. doi:https://doi.org/10.1016/S0939-3625(02)00048-1
Strategy&. (2008). Yielding new benefits from public private partnerships. Press Release. https://www.strategyand.pwc.com/me/home/press_media/...consulting.../43411143. Retrieved on 01/07/2018.
Tadimalla, S. K. (2010). Overview of PPP Experience in South Asia: Focus on India PPP Story. South Asia Sustainable Development DepartmentThe World Bank, Workshop on Public Private Partnerships, Colombo, Sri Lanka.
Tavares, J. e. (2004). Institutions and economic growth in Portugal: a quantitative exploration. Portuguese Economic Journal, 49–79.
Tebaldi, E., & Elmslie, B. (2008). Institutions, Innovation And Economic Growth. Journal of Economic Development, Chung-Ang Unviersity, Department of Economics(33), 2.
Tennant, D., Kirton, C., & Abdulkadri, A. (2011). Modelling the Effects of Financial Sector Functions on Economic Growth in a Developing Country: A Cointegration and Error Correction approach The Journal of Developing Areas, 44 (2), 183-205.
The Pak Banker. (2011). Vitalising key institutions to spur economic growth. pakbanker.newspaperdirect.com/epaper/viewer.aspx
Retrieved on 12/12/2011. The World Bank. (2018). World Bank Indicators.
https://data.worldbank.org/indicator/FS.AST.PRVT.GD.ZS?locations=PK&view=chart, Retrieved on 27-08-2018.
The World Bank Governance Indicators. (2014). The World Bank Governance Indicators, Political stability index, 2014. http://www.theglobaleconomy.com/rankings/wb_political_stability, Retrieved on 04-09-2016.
The World Bank Institution. (2011). Overview of WBI’s Capacity Development and Results Framework. www.worldbank.org.
Tridico, P. (2007). Institutions, Human Development and Economic Growth in Transition Economies, . The European Journal of Development Research, 19(4), 569–593.
U.S. Department of Transportation Federal Highway Administration. (2018). https://www.fhwa.dot.gov/rakeman/1795.htm., Retrieved on 27/06/2018.
Ugboaja, P. C. (2010). Sustainable Rural Transportation in Nigeria through Public-Private Partnerships. Interdisciplinary Journal of Contemporary Research in Business, 2(3), 199-217.
UNESCAP. (2007). Transport and Tourism Division, (2007). Public Private Partnership in Infrastructure Development. https://www.unescap.org/events/asia-pacific-forum-public-private-partnerships-transport-infrastructure-development.
UNESCAP. (2010). High-level Expert Group Meeting on Public-Private Partnerships for Infrastructure Development: Issues for Consideration. Retrieved from Jakarta, Indonesia:
312
Van Ham, H., & Koppenjan, J. (2001). Building Public-Private Partnerships: Assessing and managing risks in port development. Public Management Review, 3(4), 593-616. doi:10.1080/14616670110070622
Vieitez-Martinez, D. (2005). Challenges of Implementation of a PPP Program in Mexico. Paper presented at the PPP International Experience Workshop, Minas Gerais, Belo Horizonte, Brazil.
Vieitez-Martinez, D. (2008). Challenges of Implementation of a PPP Program in Mexico. Multilateral Investment fund of the Inter-American Development Bankk, PPP International Experience Workshop, Belo Horizonte, Brazil.
Wettenhall, R. (2003). The rhetoric and reality of public-private partnerships. Public Organization Review, 3(1), 77-107.
Wijeweera, A. V., Renato & Dollery, Brian. (2010). Economic Growth and FDI Inflows: A Stochastic Frontier Analysis. The Journal of Developing Areas, 43(2), 143-158.
World Economic Forum. (2011). The Global Competitiveness Report 2011-2012. Zhang, X., & Fan, S. (2004). How Productive Is Infrastructure? A New Approach and Evidence
from Rural India. American Journal of Agricultural Economics, 86(2), 492-501.