determinants of customer loyalty among gsm users … of customer loyalty among gsm users in the...
TRANSCRIPT
© 2017 IJRTI | Volume 2, Issue 6 | ISSN: 2456-3315
IJRTI1706039 International Journal for Research Trends and Innovation (www.ijrti.org) 188
Determinants of customer loyalty among GSM users
in the south-eastern Nigeria
1Otika Udoka Stephen,
2Ejiofor Happiness Uloma,
3Uche Dickson Ben,
4Eke Chukwuma Nnate
2 Phd Student Unizik, Awka,
4 Lecturer 11, Accounting Department
1,2Lecturer 11,Marketing Department
Evangel University, Akaeze, Ebonyi State, Nigeria
Abstract: This study focuses on the determinants of customer loyalty among GSM users in the South-Eastern Nigeria.
Most of the studies on customer loyalty in the Nigerian GSM market are alien to South-Eastern Nigeria. The main
objective of this study is to empirically inquire the factors that influence customer loyalty in the Nigerian GSM market.
The study adopted survey research design and the population of study is the mobile phone users in Ebonyi State. Quota
sampling method was employed while the sample size was determined using survey systems formula. Questionnaire was
employed as the research instrument and the reliability test was achieved using split-half method. Factor analysis was
used for data reduction and multiple regressions were employed to test the hypotheses. The findings revealed that trust,
customer satisfaction, corporate image, service quality, network coverage have significant effect on customer loyalty with
customer satisfaction as the strongest predictor of customer loyalty in the Nigerian GSM market. In addition, prompt
customer service was seen to have no significant effect on customer loyalty. It was recommended that GSM service
providers should focus more on customer satisfaction, trust, corporate image, service quality, and network coverage in
order to build sustainable relationship with their customers as to become very competitive. Also, attention should be paid
on providing quality customer care service elements.
Index Terms: Customer Loyalty, Gsm Market, South-Eastern Nigeria.
I. INTRODUCTION
Telecommunication facilities were first established in Nigeria in 1886 by the colonial administration through the introduction of
public telegraph services linking Lagos submarine cable along the west coast of Africa, Ghana, Gambia, and unto England
(UNILAG CONSULT cited in Emerah, Oyedele & David, 2013). Then, Nigeria only had 18,724 functional lines for a population
of about 45 million people at independence (Emerah, Oyedele & David, 2013) with a teledensity of about 0.04 telephones to 100
people. Only 181,276 lines were added to increase the nation‟s functional lines to 200,000 between 1960 and 1984 as against the
planned target of about 460,000 and all the exchanges were analogue (NBI cited in Emerah, Oyedele & David, 2013). This dismal
failure led to the creation of NITEL in 1985 which enjoyed all sorts of monopoly but could not solve the telecommunication
problems of Nigeria ever-increasing population (Emerah & David, 2013). According to Adeleke and Aminu (2012), GSM
revolution started in Nigeria in August 2001, with the licensing of three mobile operators namely; MTEL ,Econet (now Airtel)
mobile and MTN by Nigeria Communication Commission (NCC), and since then ICT in Nigeria has been transformed. Later,
Globacom and Etisalat were licensed to operate and compete with the existing mobile operators thereby increasing the numbers to
five then. (Adeleke and Aminu, 2012). Nigeria according to NCC cited by Adeleke and Aminu (2012) is the leading African‟s
telecom market with active subscribers of 92,006,608 by end of February, 2012. This represents a tele-density of 68.68% up from
a tele-density of 0.73% in 2001. The astronomical growth rate in the market has resulted into intense rivalry among the GSM
operators and calls for the engagement of marketing activities that would help them attract and retain large chunk of their
customer and make them loyal. This is more so as the market has become saturated and with little opportunity to attract new
customers. The emerging competition has resulted to tariff reduction, introducing new products, advertising blitz, increasing sales
promotion and innovation customer care among others (Adeleke and Aminu, 2012). All these are focused at attracting and
retaining customers. Also, the high growth of subscribers resulting in impressive financial performance of the GSM providers has
made necessary the need to examine the factors that influence customer loyalty in the market.
Aim of the project
The broad objective of this study is to empirically investigate the determinants of customer loyalty in Nigerian‟s
telecommunication industry. Specifically, this study seeks:
a. To identify the factors determining customer loyalty of the mobile phone users.
b. To find out the relationship between factors identified and customer loyalty of the mobile phone users.
Research Questions
The following research questions were formulated for the study:
a. What are the factors that determine customer loyalty among mobile phone users?
b. How has these identified factors affect customer loyalty among mobile phone users?
Research Hypotheses The following hypotheses were formulated thus:
© 2017 IJRTI | Volume 2, Issue 6 | ISSN: 2456-3315
IJRTI1706039 International Journal for Research Trends and Innovation (www.ijrti.org) 189
H1: Customer satisfaction will positively affect customer loyalty of mobile phone users.
H2: Customer trust will positively affect customer loyalty of mobile phone users.
H3: Image of the GSM provider will positively affect customer loyalty of mobile phone users.
H4: Perceived service quality of the GSM provider will positively affect customer loyalty.
H5: Prompt customer service will positively affect customer loyalty of mobile phone users.
H6: Price/Tariff of GSM service will positively affect customer loyalty of mobile phone users.
H7: Wide network coverage will positively affect customer loyalty of mobile phone users.
11 Problem Statement The rapid growth in the subscribers based of the GSM in Nigeria has led to unhealthy and cut-throat competition in the GSM
market. The stiff competition is a resultant effect of lower switching cost among the subscribers of the diverse networks. This
shows in the rate at which they (subscribers) freely enter and exit networks (Adeleke & Aminu, 2012). Despite the remarkable
and outstanding improvement in GSM accessibility, there exist an avalanche of complaints of high call tariff, poor voice signals,
poor reception among others (Emerah, Oyedele & David, 2013), there is an urgent need to examine the determinants of customer
loyalty in this pervasive industry. More so with competition among GSM providers becoming stiffer, they realized that retaining
one‟s existing customer base is important as much as acquiring the new ones (Coyles & Gokey, as cited in Adeleke & Aminu,
2012). Various studies have been conducted to know factors responsible for customer loyalty in the loyalty literature (Yang &
Peterson, 2004; Khan, 2012; Boohen & Agyapong, 2011; Siddiqi, 2011; Adjei & Denanyoh, 2014; Akroush, Al-Mohammed,
Zuriekat & Abu-Lail, 2011; Aydin & Ozer, 2005 and Khurshid, 2013). These studies were conducted in America, Europe and
Asia except the studies carried out by Adjei and Denanyoh (2014) in Ghana and that of Boohen and Agyapong (2011) on
customer loyalty in Ghanaian banks. Rai and Medha (2013) focus on customer loyalty‟s antecedents in insurance and the study
was conducted in India, also Blackwell, Szeinbach, Barnes, Garner and Bush (1999) look at antecedents of customers loyalty in
the health sector. Few studies that were conducted in Nigeria on customer loyalty either focus on switching cost and customer
loyalty (Oyeniyi and Abiodun, 2010) or on attitude to patronage of GSM services in the South-South region (Ogwo and Igwe,
2012). Though the studies carried out by Adeleke and Aminu (2012), Emerah, Oyedele and David (2013) looked at the
determinants of customer loyalty in the GSM market, these studies are alien to South-Eastern Nigeria context because they were
carried out in the South-Western Nigeria and there is need for conduct specific study on the determinants of customer loyalty in
this important sector of Nigerian economy especially in the South-Eastern Nigeria.
111 Literature Review
Conceptual Framework/Review
The concepts and constructs under this study were discussed namely; customer loyalty, customer satisfaction, customer trust,
corporate image, switching barrier (cost) and service quality among others.
Customer loyalty: According to Boohene and Agyapong (2011), loyalty as a concept has its base from the consumer behavior
theory and is something that consumers may portray to brands, services or activities. Customer loyalty has been defined early that
it is the normal willingness of customer to maintain their relations with a particular firm or service/product (Kim & Yoan cited in
Khan, 2012). According to Lovelock cited in Adeleke and Aminu (2012), loyalty is used to show the submissiveness of a
customer to continue patronizing a firm‟s product over a long period of time and on a repeated and preferably exclusive basis, and
voluntarily recommending the firm‟s products to friends and associates. Customer loyalty is the outcome of a firm‟s creating a
benefit for customers so that they will maintain increasingly repeat business with the organization (Anderson & Jacoben cited in
Adeleke & Aminu, 2012). From the foregoing, customer loyalty in the GSM market in Nigeria is a function of the length of time
and the frequency with which customers stay and remain on a network. It is therefore of a necessity for all GSM service providers
to retain large numbers of subscribers on their networks.
Customer satisfaction: Satisfaction is a consumer‟s post-purchase evaluation, effective and affective response to the overall
product or service experience (Oliver cited in Adjei & Denanyoh, 2014). It is considered a strong predictor for behavioral
variables such as repurchase intentions, word-of-mouth recommendations, or loyalty (Adjei & Denanyoh, 2014). In the word of
Khurshid (2013) customer satisfaction means that how much the present customers are happy and motivated from the company.
He further states that it is considered very important for companies that their customers are loyal to them because if they are
happy it will help the firm to build long term relationship with the customers so that they can purchase more and more from them
and also recommend it to other customers as well.
Customer Trust: Trust is the willingness of the party to be vulnerable to the actions of another party based on the expectation
that the other will perform a particular action important to the trust or, irrespective of the ability to monitor or control that other
party (Mayer et al. cited in Rai & Medha, 2013). Nguyen and Leclerc cited in Ria and Medha (2013) posit that customers in
service industry tend to hold positive behavioral attitude toward the brand they trust. In the word of Khurshid (2013), customer
trust has both impact on the purchase behavior and decision of the customers. He further asserts that trust shows customers‟
ability to be loyal with the company and give favourable positive feedback to them over the competitors.
Corporate image: This implies the perception or the personal opinion of the customers when they hear about the brand or when
they see it or more specifically when they experience it (Khurshid, 2013). It can also be seen as the general impression made on
the minds of the public about a firm (Barich & Kotler cited in Boohene & Agyapong, 2011). Keller cited in Adeleke and Aminu
(2012) defines corporate image as the perceptions of a firm as reflected in the associations held in consumer memory. Corporate
© 2017 IJRTI | Volume 2, Issue 6 | ISSN: 2456-3315
IJRTI1706039 International Journal for Research Trends and Innovation (www.ijrti.org) 190
image, according to Aaker cited in Ogwo and Igwe (2012), is an image that a firm acquires and reflects its heritage, value, culture,
people and strategy. From the fore goings, it is therefore essential that GSM operators show concern about the way it is perceived
by their variety of stakeholders such as employees, customers and the general public, as this determines loyalty.
Service Quality: Quality is the comparison of perceived performance and expected performance (Kang cited in Adeleke &
Aminu, 2012). Service quality is the customer‟s overall impression of the relative inferiority/superiority of a firm and its offerings
(Bitner et al. cited in Adeleke & Aminu, 2012). It has been empirically discovered that service quality and customer loyalty
shown positive relationship. From the foregoing, GSM operators in Nigeria should endeavour to improve the quality of their
service in terms of signal strength, clear voice, call rate and GPRS rate among others in order to attract and retain more customers
hence, customer loyalty.
Customer Service: This is a system that comprises customer support systems, complaint processing, conflict handling,
communication with customer (Kim et al. cited in Adjei & Denanyoh, 2011). Customer service has positive and favourable
impacts on increasing the loyalty of customers towards the company and its product (customer management IQ cited in Khurshid,
2013).
IV Theoretical Framework Boora and Singh (2011) customer loyalty model was adopted in this study. This model is an off-shoot of Oliver (1999) model of
customer loyalty. They grouped the determinants of customer loyalty into four:
i. Characteristics of the environment
ii. Characteristics of the dyadic relationship
iii. Characteristics of the consumer and,
iv. Consumer perception of the relationship with the marketing firm.
This model was adopted in this study because it captures the underpinnings of customer loyalty in a typical service-oriented
industry, especially the telecommunication industry.
V Empirical Review In a study conducted by Boohene and Agyapong (2011) in Ghana, they found that there exist a positive relationship between
service quality, image and customer satisfaction and customer loyalty. However, the study revealed a negative relationship
between customer satisfaction and customer loyalty. The work of Yang and Peterson (2004) contradicts that of Boohene and
Agyapong (2011), when they found out that customer loyalty is a function of customer satisfaction and perceived value. Also,
Khan (2012) discovered that customer satisfaction has significant impacts on customer retention while customer retention has
significant effect on customer loyalty in the telecommunication industry.
According to the study conducted by Adeleke and Aminu (2012) in South-Western Nigeria, they found out that service quality,
customer satisfaction, and corporate image are the important determinants of customer loyalty in the Nigeria‟s GSM market and
that GSM companies should take note of these and emphasize them in their marketing strategies formulation and implementation.
Moreover, Almossawi (2012) found in his study conducted in Bahrain that there exist a poor association between customer
satisfaction and loyalty. Adjei and Denanyoh (2014) found that network coverage has a significant positive relationship to
customer loyalty while corporate image and prompt customer service were found to have a less effect on customer loyalty.
However, Akroush,Mohammad,Zuriekat and Abu-lai(2011),revealed that their structural path analysis shows that customer
satisfaction,trust,perceived switching costs and perceived service quality affected customer loyalty in the Jordanian
telecommunication industry.Also,in the study carried out in the Turkish mobile telecommunication market by Aydin and
Ozer(2005),they found out that perceived service quality is a necessary but not sufficient condition for customer loyalty.
Contrary to the finding of Aydin and Ozer (2005), Achour, Said and Boerhannueddin (2011) in their study conducted in Malaysia
revealed that service quality and image are separate constructs that combine to determine the loyalty, with service quality
exerting a stronger influence than corporate image.
Adjei and Denanyoh (2014), introduced other determinants of customer loyalty which is synonymous to African
telecommunication environment. They added price, network coverage, sales promotion, call rates, call quality, SMS
rates/packages, GPRS rates and quality. However, in this study we adopt only price and network coverage and subsume call
quality, GPRS, quality under service quality variable. This was supported by the work of Adeleke and Aminu (2012) and Oyeniyi
and Abiodun (2010) all done in South-Western Nigeria.
Price (tariff) according to Adjei and Denanyoh (2014) plays a key role in telecommunication market especially for the mobile
telecommunication service provider. Price in this context include SMS rate, call rate, GPRS rate. However, Adeleke and Aminu
(2012) revealed that price is not a determinant of customer loyalty in Nigeria GSM market. Khurshid (2013) revealed that
network coverage has a significant impact on customer loyalty.
VI Research Methodology
Research Design: The research design adopted in this study is the survey research design-involves asking questions to
respondents and recording responses; the aim of which is to elicit answers to the questions needed to address the objectives of the
study (Okeke, Olise and Eze, 2012).
© 2017 IJRTI | Volume 2, Issue 6 | ISSN: 2456-3315
IJRTI1706039 International Journal for Research Trends and Innovation (www.ijrti.org) 191
Population of Study: The population of this study is the mobile phone users in Ebonyi State. The population is an infinite
(unknown) one because the researchers could not obtain the exact number of mobile phone users in the area from any secondary
source.
Sampling Technique: This study employed quota sampling and the aim was to ensure that respondents from the various
demographic characteristics are involved in the sample. Quota sampling involves the selection of potential respondents according
to pre-specified behaviors though disproportionately (Okeke, Olise and Eze, 2012).
Sampling Size Determination: Since the population of the study is unknown (infinite), the researchers adopted a formula that
estimates the representativeness of the sample on certain critical parameters at an acceptable level of probability. The formula for
sample size determination adopted for this study is:
𝑛 =𝑍2 𝑃 (1 − 𝑃)
𝐶2
Source: http/www.surveysystems.com
n= sample size
Z = Standard deviation associated with a given level of confidence
P = % of picking a choice, expressed as decimal
C = confidence interval, expressed as decimal
Thus, the sample size, n is;
Z = at 95% confidence level is 1.96 (from standard normal distribution table).
(1-P) = 1-0.8 = 0.20
C = 0.05 (since we chose 95% as our confidence limit)
𝑛 = 1.96 2 0.8 (0.2)
(0.05)2= 245.86 ≅ 245
The sample size is 245 mobile phone users.
Sources of Data: Data used in this study emanated from two main sources. Secondary data which were sourced from already
existing materials like journals, discussion papers, conference proceedings and textbooks. On the other hand primary data were
sourced using questionnaire.
Research Instrument: The research instrument adopted in this study is a structured questionnaire. It comprises both open-ended
and closed-ended questions. The closed-ended questions were designed using a 5-point Likert scaling ranging from strongly agree
to strongly disagree.
All the variables in this study have a number of questions on the questionnaire items.
Validity and Reliability of Research Instrument: Draft copies of the questionnaire were given to the supervisors and other
lecturers as well as some research experts who went through and made comments that were used in drafting the final
questionnaire. For reliability test, split-half method was adopted; this was carried out by dividing the questionnaire items into two
equal halves by dividing the items into odd and even numbers. The split-half reliability coefficient was determined by correlating
the scores on the odd items of the questionnaire against the even items. The reliability test for the research instrument is 0.75
which is good for a study like this (Akuezuilo and Agu, 2004).
Method of Data Analysis: Data collected were analyzed using descriptive and inferential statistics. Descriptive statistics was
employed to explain the characteristic features of the respondents while multiple regression analysis was employed to test the
significance of the research hypotheses. The data were analyzed using Statistical Package for Social Science (SPSS) 20.0.
In the light of these, the research model was proposed thus:
𝐶𝑢𝑠𝑡 𝑙𝑜𝑦𝑎𝑙𝑡𝑦 = 𝑓(𝐶𝑢𝑠𝑆𝑎𝑡 + 𝐶𝑢𝑠𝑇𝑟𝑢𝑠𝑡 + 𝐶𝑜𝑟𝐼𝑚𝑔 + 𝑆𝑒𝑟𝑞𝑢𝑎𝑙 + 𝐶𝑢𝑠𝑆𝑒𝑟𝑣 + 𝑃𝑟𝑖𝑐𝑒 + 𝑁𝑒𝑡𝑤𝑟𝑘 𝐶𝑜𝑣). This is translated thus:
𝐶𝑢𝑠𝑡 𝑙𝑜𝑦𝑎𝑙𝑡𝑦 = 𝑎 + 𝑏1𝐶𝑢𝑠𝑆𝑎𝑡𝑋1 + 𝑏2𝐶𝑢𝑠𝑡𝑟𝑢𝑠𝑡𝑋2 + 𝑏3𝐶𝑜𝑟𝑝𝑙𝑚𝑔𝑋3+𝑏4𝑆𝑒𝑟𝑞𝑢𝑎𝑙𝑋4 + 𝑏5𝐶𝑢𝑠𝑆𝑒𝑟𝑣𝑋5 + 𝑏6𝑃𝑟𝑐𝑋6 + 𝑏7𝑁𝑡𝑤𝑟𝑘𝐶𝑜𝑣𝑋7 + 𝑒𝑖
Cusloyalty Customer loyalty
Cus Sat Customer satisfaction
CusTrust Customer Trust
Corplmg Corporate image
Swtchbarr Switching barrier
Servqual Perceived service quality
Cus Serv Customer Service
Prc Price
NtwkCov Network Coverage
ei Error margin
VII RESULTS AND DISCUSSION
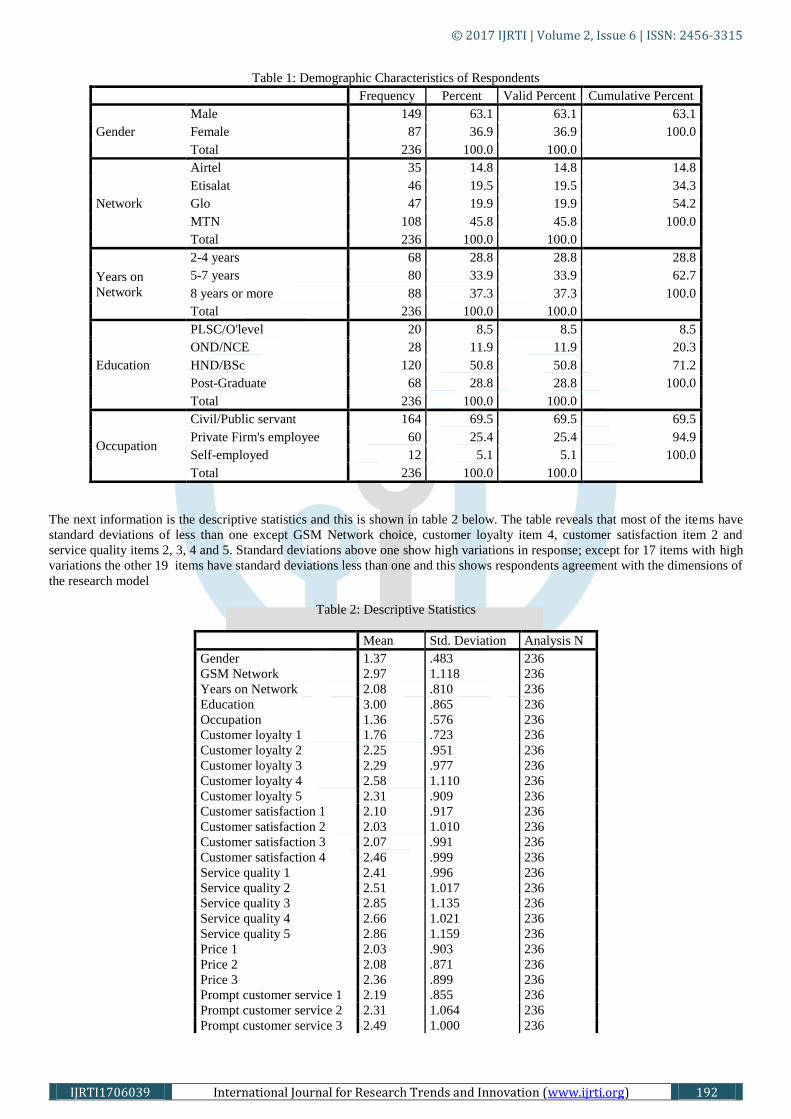
The total number of usable copies of questionnaire returned and analyzed was 236 and it amounted to 95.55% response rate. This
is considered to be acceptable for the study of this nature. The first presentation is the demographic variables as shown in table 1.
Five demographic variables were used namely gender, network choice, years on network, education and occupation. They showed
that the respondents are suitable for the study and have the educational and financial willpower to participate in the study.
© 2017 IJRTI | Volume 2, Issue 6 | ISSN: 2456-3315
IJRTI1706039 International Journal for Research Trends and Innovation (www.ijrti.org) 192
Table 1: Demographic Characteristics of Respondents
Frequency Percent Valid Percent Cumulative Percent
Gender
Male 149 63.1 63.1 63.1
Female 87 36.9 36.9 100.0
Total 236 100.0 100.0
Network
Airtel 35 14.8 14.8 14.8
Etisalat 46 19.5 19.5 34.3
Glo 47 19.9 19.9 54.2
MTN 108 45.8 45.8 100.0
Total 236 100.0 100.0
Years on
Network
2-4 years 68 28.8 28.8 28.8
5-7 years 80 33.9 33.9 62.7
8 years or more 88 37.3 37.3 100.0
Total 236 100.0 100.0
Education
PLSC/O'level 20 8.5 8.5 8.5
OND/NCE 28 11.9 11.9 20.3
HND/BSc 120 50.8 50.8 71.2
Post-Graduate 68 28.8 28.8 100.0
Total 236 100.0 100.0
Occupation
Civil/Public servant 164 69.5 69.5 69.5
Private Firm's employee 60 25.4 25.4 94.9
Self-employed 12 5.1 5.1 100.0
Total 236 100.0 100.0
The next information is the descriptive statistics and this is shown in table 2 below. The table reveals that most of the items have
standard deviations of less than one except GSM Network choice, customer loyalty item 4, customer satisfaction item 2 and
service quality items 2, 3, 4 and 5. Standard deviations above one show high variations in response; except for 17 items with high
variations the other 19 items have standard deviations less than one and this shows respondents agreement with the dimensions of
the research model
Table 2: Descriptive Statistics
Mean Std. Deviation Analysis N
Gender 1.37 .483 236
GSM Network 2.97 1.118 236
Years on Network 2.08 .810 236
Education 3.00 .865 236
Occupation 1.36 .576 236
Customer loyalty 1 1.76 .723 236
Customer loyalty 2 2.25 .951 236
Customer loyalty 3 2.29 .977 236
Customer loyalty 4 2.58 1.110 236
Customer loyalty 5 2.31 .909 236
Customer satisfaction 1 2.10 .917 236
Customer satisfaction 2 2.03 1.010 236
Customer satisfaction 3 2.07 .991 236
Customer satisfaction 4 2.46 .999 236
Service quality 1 2.41 .996 236
Service quality 2 2.51 1.017 236
Service quality 3 2.85 1.135 236
Service quality 4 2.66 1.021 236
Service quality 5 2.86 1.159 236
Price 1 2.03 .903 236
Price 2 2.08 .871 236
Price 3 2.36 .899 236
Prompt customer service 1 2.19 .855 236
Prompt customer service 2 2.31 1.064 236
Prompt customer service 3 2.49 1.000 236
© 2017 IJRTI | Volume 2, Issue 6 | ISSN: 2456-3315
IJRTI1706039 International Journal for Research Trends and Innovation (www.ijrti.org) 193
Prompt customer service 4 3.51 1.143 236
Corporate image 1 2.03 1.209 236
Corporate image 2 2.68 1.035 236
Corporate image 3 2.92 1.359 236
Trust 1 2.66 1.116 236
Trust 2 2.22 .692 236
Trust 3 2.15 .973 236
Trust 4 2.64 1.134 236
Network coverage 1 2.41 .996 236
Network coverage 2 2.07 1.120 236
Network coverage 3 2.36 1.072 236
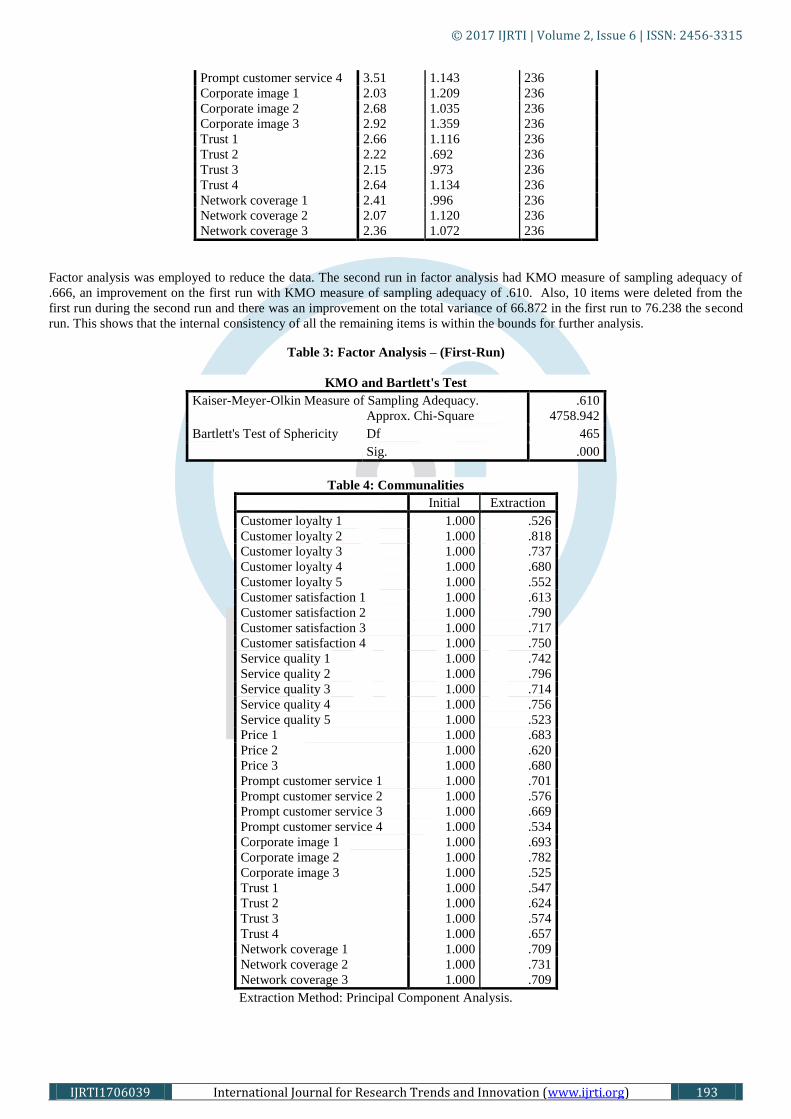
Factor analysis was employed to reduce the data. The second run in factor analysis had KMO measure of sampling adequacy of
.666, an improvement on the first run with KMO measure of sampling adequacy of .610. Also, 10 items were deleted from the
first run during the second run and there was an improvement on the total variance of 66.872 in the first run to 76.238 the second
run. This shows that the internal consistency of all the remaining items is within the bounds for further analysis.
Table 3: Factor Analysis – (First-Run)
KMO and Bartlett's Test
Kaiser-Meyer-Olkin Measure of Sampling Adequacy. .610
Bartlett's Test of Sphericity
Approx. Chi-Square 4758.942
Df 465
Sig. .000
Table 4: Communalities
Initial Extraction
Customer loyalty 1 1.000 .526
Customer loyalty 2 1.000 .818
Customer loyalty 3 1.000 .737
Customer loyalty 4 1.000 .680
Customer loyalty 5 1.000 .552
Customer satisfaction 1 1.000 .613
Customer satisfaction 2 1.000 .790
Customer satisfaction 3 1.000 .717
Customer satisfaction 4 1.000 .750
Service quality 1 1.000 .742
Service quality 2 1.000 .796
Service quality 3 1.000 .714
Service quality 4 1.000 .756
Service quality 5 1.000 .523
Price 1 1.000 .683
Price 2 1.000 .620
Price 3 1.000 .680
Prompt customer service 1 1.000 .701
Prompt customer service 2 1.000 .576
Prompt customer service 3 1.000 .669
Prompt customer service 4 1.000 .534
Corporate image 1 1.000 .693
Corporate image 2 1.000 .782
Corporate image 3 1.000 .525
Trust 1 1.000 .547
Trust 2 1.000 .624
Trust 3 1.000 .574
Trust 4 1.000 .657
Network coverage 1 1.000 .709
Network coverage 2 1.000 .731
Network coverage 3 1.000 .709
Extraction Method: Principal Component Analysis.

© 2017 IJRTI | Volume 2, Issue 6 | ISSN: 2456-3315
IJRTI1706039 International Journal for Research Trends and Innovation (www.ijrti.org) 194
Table 5:Total Variance Explained
Component Initial Eigenvalues Extraction Sums of Squared Loadings
Total % of Variance Cumulative % Total % of
Variance
Cumulative %
1 8.137 26.248 26.248 8.137 26.248 26.248
2 2.709 8.738 34.986 2.709 8.738 34.986
3 2.227 7.184 42.170 2.227 7.184 42.170
4 1.870 6.032 48.202 1.870 6.032 48.202
5 1.676 5.406 53.608 1.676 5.406 53.608
6 1.455 4.694 58.302 1.455 4.694 58.302
7 1.378 4.446 62.747 1.378 4.446 62.747
8 1.279 4.124 66.872 1.279 4.124 66.872
9 1.133 3.654 70.526
10 1.099 3.545 74.070
11 .916 2.954 77.024
12 .886 2.858 79.882
13 .805 2.595 82.477
14 .686 2.213 84.690
15 .654 2.110 86.800
16 .620 2.000 88.800
17 .540 1.742 90.542
18 .481 1.553 92.095
19 .412 1.328 93.423
20 .357 1.153 94.576
21 .339 1.092 95.668
22 .259 .836 96.503
23 .222 .718 97.221
24 .186 .599 97.820
25 .156 .503 98.323
26 .125 .405 98.727
27 .105 .338 99.066
28 .100 .324 99.389
29 .081 .260 99.649
30 .065 .208 99.857
31 .044 .143 100.000
Extraction Method: Principal Component Analysis.
Table 6: Factor Analysis – (Second Run)
KMO and Bartlett's Test
Kaiser-Meyer-Olkin Measure of Sampling Adequacy. .666
Bartlett's Test of Sphericity
Approx. Chi-Square 3023.207
Df 253
Sig. .000
Table 7:Communalities
Initial Extraction
Customer loyalty 2 1.000 .807
Customer loyalty 3 1.000 .753
Customer loyalty 4 1.000 .702
Customer satisfaction 1 1.000 .628
Customer satisfaction 2 1.000 .803
Customer satisfaction 3 1.000 .783
Customer satisfaction 4 1.000 .769
Service quality 1 1.000 .715
Service quality 2 1.000 .870
Service quality 3 1.000 .714
Service quality 4 1.000 .788
Price 1 1.000 .758
Price 2 1.000 .762
Price 3 1.000 .766

© 2017 IJRTI | Volume 2, Issue 6 | ISSN: 2456-3315
IJRTI1706039 International Journal for Research Trends and Innovation (www.ijrti.org) 195
Prompt customer service 1 1.000 .817
Prompt customer service 3 1.000 .760
Corporate image 1 1.000 .761
Corporate image 2 1.000 .794
Trust 2 1.000 .796
Trust 4 1.000 .732
Network coverage 1 1.000 .722
Network coverage 2 1.000 .745
Network coverage 3 1.000 .788
Extraction Method: Principal Component Analysis.
VIII HYPOTHESES TESTING
To test the hypotheses, multiple linear regressions was used to test the hypotheses with factors and the results are shown below:
Table 9: Model Summaryb
Model R R Square Adjusted R
Square
Std. Error of the
Estimate
Durbin-Watson
1 .767a .588 .575 .65195333 1.595
a. Predictors: (Constant), Network coverage, Prompt customer service, Service quality, Price,
Corporate image, Customer satisfaction, Trust
b. Dependent Variable: Customer loyalty
The result of the model summary of the regression analysis shows the coefficient of correlation R of .767, which is a strong
correlation. The coefficient of determination R2 is .588, which means that 58.8% of variations in customer loyalty are accounted
for by the independent variables. Durbin-Watson (D-W) statistic of 1.595 indicates that there exist no redundant variables that
need to be expunged in the study.
Table 10 reveals the analysis of variance (ANOVA) of the regression analysis, and from the results, the F-value of 46.412 that
was significant at .000 implies that the research model is a good-fit in explaining determinants of customer loyalty in the GSM
industry.
Table 11: Coefficientsa
Model Unstandardized Coefficients Standardized
Coefficients
T Sig.
B Std. Error Beta
1
(Constant) 1.412E-017 .042 .000 1.000
Customer satisfaction .619 .059 .619 10.445 .000
Service quality .108 .055 .108 1.966 .050
Price/tariff .124 .051 .124 2.407 .017
Prompt customer service -.061 .052 -.061 -1.176 .241
Corporate image .212 .058 .212 3.675 .000
Trust .206 .060 .206 3.424 .001
Network coverage -.257 .068 -.257 -3.793 .000
a. Dependent Variable: Customer loyalty
From the coefficients table of regression analysis above, customer satisfaction has a t-value of 10.445 and it is significant at 0.05
hence, hypothesis 1 is validated and accepted.
The t-value for Trust is 3.424 and it is significant at 0.05 hence, we accepted hypothesis 2.
For the GSM provider (corporate) image construct, t-value is 3.675 and significant at 0.05, based on that we accepted hypothesis
3.
Table 10: ANOVAa
Model Sum of Squares Df Mean Square F Sig.
1
Regression 138.090 7 19.727 46.412 .000b
Residual 96.910 228 .425
Total 235.000 235
a. Dependent Variable: Customer loyalty
b. Predictors: (Constant), Network coverage, Prompt customer service, Service quality, Price/tariff,
Corporate image, Customer service, Trust
© 2017 IJRTI | Volume 2, Issue 6 | ISSN: 2456-3315
IJRTI1706039 International Journal for Research Trends and Innovation (www.ijrti.org) 196
Service quality has a t-value of 1.966 which is significant at 0.05 hence, we validated and accepted hypothesis 4.
For the prompt customer service, it has a t-value of -1.176 and no significance hence, hypothesis 5 is rejected.
Price/tariff has a t-value of 2.407 and significant at 0.05 hence, hypothesis 6 is validated and accepted.
For the network coverage, it has a t-value of -3.793 but significant at 0.000 hence, we accepted hypothesis 7.
The regression model for this study is stated below:
𝐶𝑢𝑠𝑡 𝐿𝑜𝑦𝑎𝑡𝑦
= +.619 𝐶𝑢𝑠𝑆𝑎𝑡 + .206 𝑇𝑟𝑢𝑠𝑡 + .212 𝐶𝑜𝑟𝑝𝐼𝑚𝑔 + .108 𝑆𝑒𝑟𝑄𝑢𝑎𝑙 . + − .061𝑃𝐶𝑆+ .124𝑃𝑟𝑖𝑐𝑒 + 0.0363
IX FINDINGS
The study investigated the determinants of customer loyalty among GSM users in Ebonyi State. Following the outcomes of
literature review and frameworks, seven hypotheses were assessed. The results of the study show that six (6) of the seven (7)
constructs (customer satisfaction, trust, corporate image, service quality, price/tarrif and network coverage) showed significant
effect on customer loyalty, whereas prompt customer service did not reveal any significant effect on customer loyalty.
The findings of this study revealed that customer satisfaction has a significant relationship with the loyalty in the GSM market.
This findings is supported by the work of Yang and Peterson (2004), Khan (2012), Adeleke and Aminu (2012), Oyeniyi and
Abiodum (2010) but contradicts the findings of Almossawi (20120, Booheme and Agyapong (2011) when they discovered that
there exist a poor association between customer satisfaction and loyalty. Trust was found to be statistically significant in our
study. This is consistent with the findings of Akroush et al. (2011) when their structural path analysis revealed that trust positively
affected loyalty in the Jordanian telecommunication industry. Our study also revealed that corporate image is a significant factor
that affects customer loyalty in the Nigerian GSM market. The findings was supported by the study done by Boohene and
Agyapong (2011); Adeleke and Aminu (2012); Adjei and Denanyoh (2014) and Achour et al. (2011) however, the findings of
Adjei and Denanyoh (2014) showed that corporate image had a less effect on customer loyalty.
Service quality in our study was found to be statistically significant to customer loyalty. This is consistent with the findings of
Boohene and Agyapong (2012); Adeleke and Aminu (2012); Akroush et al. (2011) and Achour et al. (2011) while Aydin and
Ozer (2005) found that out that service quality is a necessary but not sufficient condition for customer loyalty. Network coverage
was also found to be significant in this study. This was supported by Khurshid (2013); Adjei and Denanyoh (2014) and Achour et
al. (2011) when they discovered that network coverage is one of the factors considered by GSM users in the course of being loyal
to any GSM service provider. Price/tariff was also found to be statistically significant in this study. This is in consonance with the
finding of Adjei and Denanyoh (2014) in a study done in Ghana however, this is in contrary with the finding of Adeleke and
Aminu (2012), done in South-Western Nigeria that price does not necessarily determine customer loyalty in the Nigerian GSM
market. However, Olatokun and Nwonne (2012) in a similar study in South-Western Nigeria stated that price has a significant
positive impact on customer perception in selecting telecom service providers. This study reveals no relationship between prompt
customer service and customer loyalty. This is in support of the finding of Adjei and Denanyoh (2014). This may be as a result of
respondents‟ report that they are disappointed with the quality of customer care they receive such as long delay in getting through
to the customer care personnel to make their complaints or enquires and inability to connect to the customer care lines most times.
X CONCLUSION, RECOMMENDATION AND IMPLICATIONS
Based on the research results, customer satisfaction, trust, corporate image, service quality, price/tariff and network coverage
significantly affect customer loyalty whereas prompt customer service has no statistical relationship with customer loyalty for the
sample. Therefore, GSM service providers should focus on trust, corporate image, price/tariff, network coverage and customer
satisfaction in order to build a long lasting relationship with their customers so as to become very competitive. Also, attention
should be paid on providing quality and prompt customer service elements ( easy-to-connect customer care lines, quick response
lines and easy-to-understand customer care numbers) to meet customer‟s needs. GSM service providers should ensure a steady
and stable network so that their customers can remain loyal since, the study revealed that customer loyalty depends on network
availability. Based on the findings of the study, it is therefore recommended that management should improve on the service
quality, trust, corporate image, price/tariff and network coverage significantly to attract confidentiality of consumer.
REFERENCES
[1] Achour, M., Said, P.N. and Boerhannueddin, A. (2011). „Customer Loyalty: The case of mobile phone users in Universiti Utara
Malaysia, MBA Thesis, Universiti Utara, Malaysia.
[2] Adeleke, A. and Aminu, S.A. (2012), “The determinants of customer Loyalty in Nigeria‟s GSM market”, International Journal
of Business and Social Sciences, Vol. 3 (14), pp.209-222.
[3] Adjei, K. and Denanyoh, R. (2014), “Determinants of customer Loyalty among telecom subscribers in the Brong Ahafo Region
of Ghana”, International Journal of Business and Social Research (IJBSR), Vol 4(1), Pp. 82-95.
[4] Akin, E. (2011), “Are All Loyal Customers Conscious? An Empirical Study on customer loyalty discussion in the context of
consciousness”¸European Scientific Journal Vol. 8(12), PP. 206-234.
[5] Akroush¸M.N; Al-Mohammad, S.M. Zuriekat, M.I. and Abu-Lail, B.N. (2011), „An Empirical Model of customer loyalty in the
Jordanian Mobile Telecommunication Market”, International Journal of Mobile Communications Vol. 9(1), Pp. 76-101.
[6] Akuezuilo, E.O. and Agu, N. (2004) “Research and Satistics in Education and Social Sciences, (Millennium edition), Awka,
Nuel-centi Publishers and Academic Press Ltd.
© 2017 IJRTI | Volume 2, Issue 6 | ISSN: 2456-3315
IJRTI1706039 International Journal for Research Trends and Innovation (www.ijrti.org) 197
[7] Almonssawi, M.M (2012), “Customer Satisfaction in the mobile Telecom Industry in Bahrain: Antecedents and
Consequences”, International Journal of Marketing Studies, Vol. 4 (6), Pp. 139-156.
[8] Aydin, S. and Ozer, G. (2005), „The Analysis of antecendents of customer loyaty in the Turkish mobile telecommunication
market”, European Journal of Marketing, Vol 39(7/8), Pp. 910-925.
[9] Blackwell, S.A., Szeinbach, S.L., Barnes, J.H. Garner, D.W. and Bush, V. (1999), “The antecedents of customer loyalty: An
empirical investigation of the role of Personal and Situational Aspects on Repurchase Decisions”, Journal of Service Research,
Vol. 1(4), PP. 362-375.
[10] Boohene, R. and Agyapong, G.K.Q. (2011), “Analysis of the Antecendents of Customer Loyalty of telecommunication Industry
in Ghana: the case of Vodafone (Ghana)”, International Business Research, Vol. 4(1), Pp: 229-240.
[11] Boora, K.K. and Singh, H. (2011) „Customer loyalty and its Antecedents: A conceptual framework”, APJRBM, Vol. 2(1), Pp.
151-164.
[12] Emerah, A.A., Oyedele, S.O. and David, J.O. (2013), Determinant of Customer Satisfaction in the Nigerian telecommunication
Industry; An empirical Evidence”, International Journal of Managements and Strategy (IJMS), Vol. 4(6).
[13] Khan, (2012), “Impact of Customer Satisfaction and Customers Retention on Customer Loyalty”, International Journal of
Scientific and Technology Research, Vol. 1(2), Pp. 106-110.
[14] Khurshid, M. (2013), „Determinants of Customer Loyalty, its causes and influence in Telecom Industry: A study of Mobile
Telecom Industry in Pakistan” International Review of Social Sciences.
[15] Nukpezah, D. and Nyumuyo, C. (2009), “What Drives Customer Loyalty and profitability? Analysis of Perspectives from
Retail Customers in Ghana‟s Banking Industry”, MBA Thesis, School of Management, Blekinge Institute of Technology.
[16] Ogwo, E.O. and Igwe, S.R. (2012), “Some key factors Influencing Attitudes to Patronage of GSM Services: The Nigerian
Experience”, International Journal of Business and Management, Vol 7(8), Pp. 82-91.
[17] Okeke, T.C.; Olise, M.C. and Eze, G.A (2012) “Research Methods in Business and Management Sciences”,( 2nd
Edition),
Enugu, Iyke Venture Production.
[18] Oliver, R.L. (1999), “Whence consumer loyalty?” Journal of Marketing, Vol. 63 (Special issue 1999), Pp. 33-44.
[19] Oyeniyi, J.O. and Abiodun, J.A. (2010), „Switching cost and Customer loyalty in the mobile phone market: the Nigerian
Experience”, Business Intelligence Journal, Vol. 3(1), pp.111-121.
[20] Rai, A.K. and Medha, S. (2013), “The Antecedents of Customer Loyalty; An Empirical Investigation in Life Insurance” Journal
of Competences, Vol. 5(2), pp 139-163.
[21] Siddiqi, K.O. (2011), “Interrelations Between Service Quality Attributes, Customer Satisfaction and Customer Loyalty in The
retail Banking sector in Bangladesh”, International Journal of Business and Management, Vol. 6(3), pp. 12-36.
[22] Yang, Z and Peterson, R.T. (2004), “Customer Perceived Value, Satisfaction, and Loyalty: The Role of Switching Costs”,
Psychology and Marketing, Vol. 21(10), Pp. 799-822.