deterioration of j-bar reinforcement in abutments …...j-bars and dowel bars deterioration of the...
TRANSCRIPT
Deterioration of J-Bar Reinforcement in Abutments and Piers
FINAL REPORT
December 2011
Kent A Harries, PhD, FACI, PEng University of Pittsburgh
COMMONWEALTH OF PENNSYLVANIA
DEPARTMENT OF TRANSPORTATION
CONTRACT # 510601 WORK ORDER # PIT 010
1
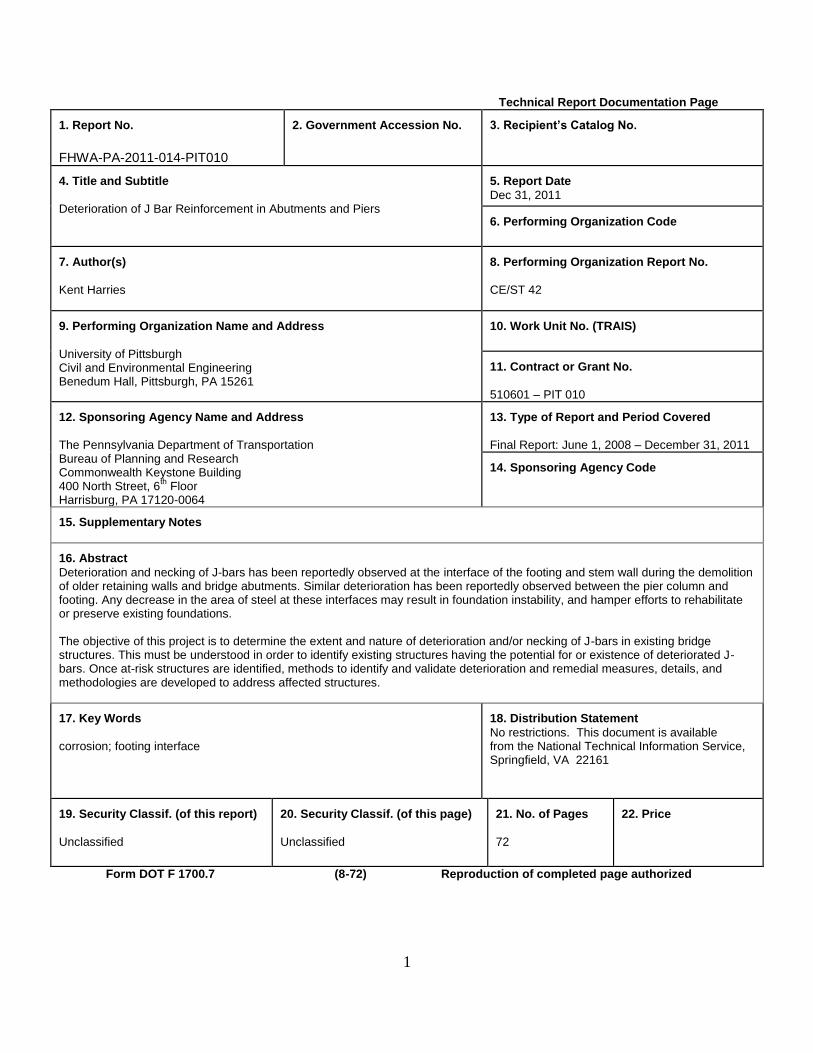
Technical Report Documentation Page 1. Report No.
FHWA-PA-2011-014-PIT010
2. Government Accession No.
3. Recipient’s Catalog No.
4. Title and Subtitle
Deterioration of J Bar Reinforcement in Abutments and Piers
5. Report Date
Dec 31, 2011
6. Performing Organization Code
7. Author(s)
Kent Harries
8. Performing Organization Report No.
CE/ST 42
9. Performing Organization Name and Address
University of Pittsburgh Civil and Environmental Engineering Benedum Hall, Pittsburgh, PA 15261
10. Work Unit No. (TRAIS)
11. Contract or Grant No.
510601 – PIT 010 12. Sponsoring Agency Name and Address
The Pennsylvania Department of Transportation Bureau of Planning and Research Commonwealth Keystone Building 400 North Street, 6
th Floor
Harrisburg, PA 17120-0064
13. Type of Report and Period Covered
Final Report: June 1, 2008 – December 31, 2011 14. Sponsoring Agency Code
15. Supplementary Notes
16. Abstract
Deterioration and necking of J-bars has been reportedly observed at the interface of the footing and stem wall during the demolition of older retaining walls and bridge abutments. Similar deterioration has been reportedly observed between the pier column and footing. Any decrease in the area of steel at these interfaces may result in foundation instability, and hamper efforts to rehabilitate or preserve existing foundations. The objective of this project is to determine the extent and nature of deterioration and/or necking of J-bars in existing bridge structures. This must be understood in order to identify existing structures having the potential for or existence of deteriorated J-bars. Once at-risk structures are identified, methods to identify and validate deterioration and remedial measures, details, and methodologies are developed to address affected structures. 17. Key Words
corrosion; footing interface
18. Distribution Statement
No restrictions. This document is available from the National Technical Information Service, Springfield, VA 22161
19. Security Classif. (of this report)
Unclassified
20. Security Classif. (of this page)
Unclassified
21. No. of Pages
72
22. Price
Form DOT F 1700.7 (8-72) Reproduction of completed page authorized
2
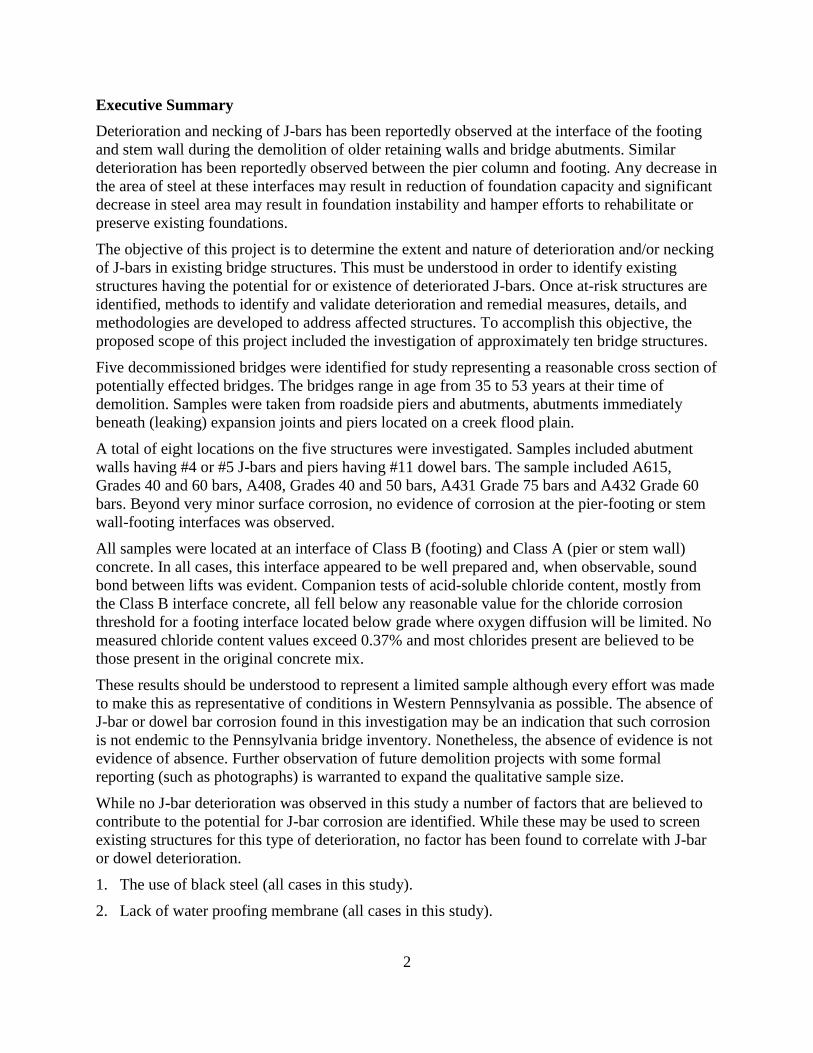
Executive Summary
Deterioration and necking of J-bars has been reportedly observed at the interface of the footing
and stem wall during the demolition of older retaining walls and bridge abutments. Similar
deterioration has been reportedly observed between the pier column and footing. Any decrease in
the area of steel at these interfaces may result in reduction of foundation capacity and significant
decrease in steel area may result in foundation instability and hamper efforts to rehabilitate or
preserve existing foundations.
The objective of this project is to determine the extent and nature of deterioration and/or necking
of J-bars in existing bridge structures. This must be understood in order to identify existing
structures having the potential for or existence of deteriorated J-bars. Once at-risk structures are
identified, methods to identify and validate deterioration and remedial measures, details, and
methodologies are developed to address affected structures. To accomplish this objective, the
proposed scope of this project included the investigation of approximately ten bridge structures.
Five decommissioned bridges were identified for study representing a reasonable cross section of
potentially effected bridges. The bridges range in age from 35 to 53 years at their time of
demolition. Samples were taken from roadside piers and abutments, abutments immediately
beneath (leaking) expansion joints and piers located on a creek flood plain.
A total of eight locations on the five structures were investigated. Samples included abutment
walls having #4 or #5 J-bars and piers having #11 dowel bars. The sample included A615,
Grades 40 and 60 bars, A408, Grades 40 and 50 bars, A431 Grade 75 bars and A432 Grade 60
bars. Beyond very minor surface corrosion, no evidence of corrosion at the pier-footing or stem
wall-footing interfaces was observed.
All samples were located at an interface of Class B (footing) and Class A (pier or stem wall)
concrete. In all cases, this interface appeared to be well prepared and, when observable, sound
bond between lifts was evident. Companion tests of acid-soluble chloride content, mostly from
the Class B interface concrete, all fell below any reasonable value for the chloride corrosion
threshold for a footing interface located below grade where oxygen diffusion will be limited. No
measured chloride content values exceed 0.37% and most chlorides present are believed to be
those present in the original concrete mix.
These results should be understood to represent a limited sample although every effort was made
to make this as representative of conditions in Western Pennsylvania as possible. The absence of
J-bar or dowel bar corrosion found in this investigation may be an indication that such corrosion
is not endemic to the Pennsylvania bridge inventory. Nonetheless, the absence of evidence is not
evidence of absence. Further observation of future demolition projects with some formal
reporting (such as photographs) is warranted to expand the qualitative sample size.
While no J-bar deterioration was observed in this study a number of factors that are believed to
contribute to the potential for J-bar corrosion are identified. While these may be used to screen
existing structures for this type of deterioration, no factor has been found to correlate with J-bar
or dowel deterioration.
1. The use of black steel (all cases in this study).
2. Lack of water proofing membrane (all cases in this study).
3
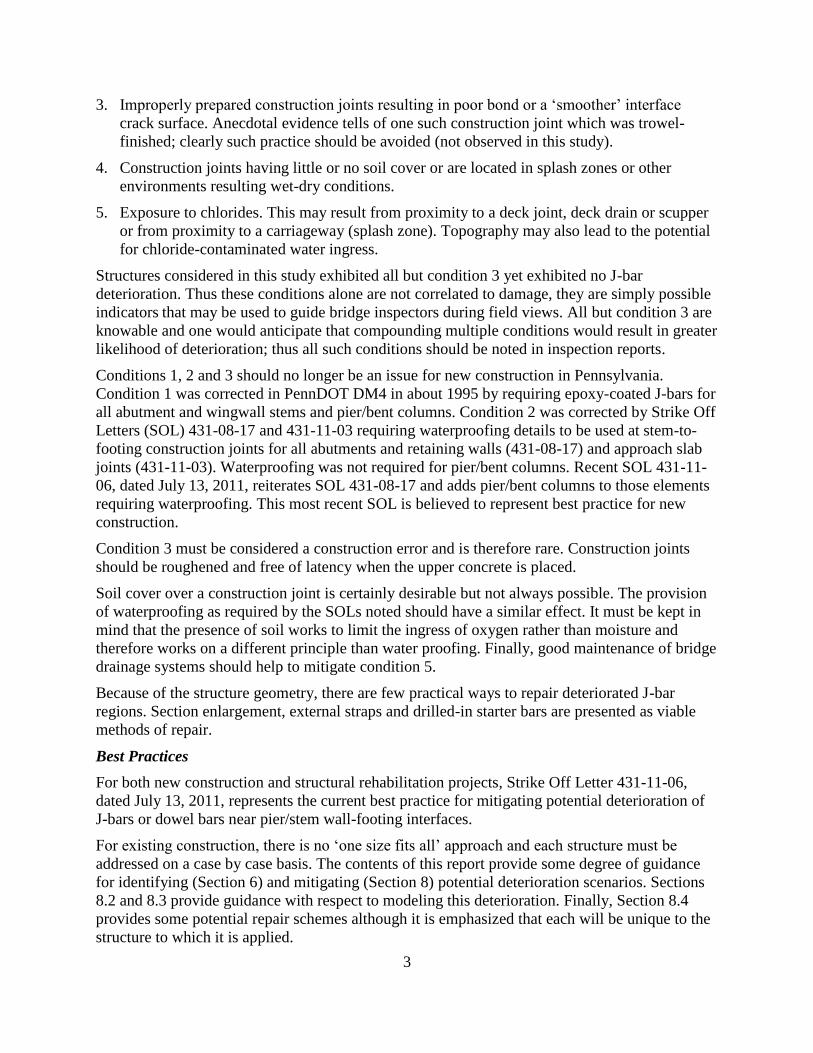
3. Improperly prepared construction joints resulting in poor bond or a ‗smoother‘ interface
crack surface. Anecdotal evidence tells of one such construction joint which was trowel-
finished; clearly such practice should be avoided (not observed in this study).
4. Construction joints having little or no soil cover or are located in splash zones or other
environments resulting wet-dry conditions.
5. Exposure to chlorides. This may result from proximity to a deck joint, deck drain or scupper
or from proximity to a carriageway (splash zone). Topography may also lead to the potential
for chloride-contaminated water ingress.
Structures considered in this study exhibited all but condition 3 yet exhibited no J-bar
deterioration. Thus these conditions alone are not correlated to damage, they are simply possible
indicators that may be used to guide bridge inspectors during field views. All but condition 3 are
knowable and one would anticipate that compounding multiple conditions would result in greater
likelihood of deterioration; thus all such conditions should be noted in inspection reports.
Conditions 1, 2 and 3 should no longer be an issue for new construction in Pennsylvania.
Condition 1 was corrected in PennDOT DM4 in about 1995 by requiring epoxy-coated J-bars for
all abutment and wingwall stems and pier/bent columns. Condition 2 was corrected by Strike Off
Letters (SOL) 431-08-17 and 431-11-03 requiring waterproofing details to be used at stem-to-
footing construction joints for all abutments and retaining walls (431-08-17) and approach slab
joints (431-11-03). Waterproofing was not required for pier/bent columns. Recent SOL 431-11-
06, dated July 13, 2011, reiterates SOL 431-08-17 and adds pier/bent columns to those elements
requiring waterproofing. This most recent SOL is believed to represent best practice for new
construction.
Condition 3 must be considered a construction error and is therefore rare. Construction joints
should be roughened and free of latency when the upper concrete is placed.
Soil cover over a construction joint is certainly desirable but not always possible. The provision
of waterproofing as required by the SOLs noted should have a similar effect. It must be kept in
mind that the presence of soil works to limit the ingress of oxygen rather than moisture and
therefore works on a different principle than water proofing. Finally, good maintenance of bridge
drainage systems should help to mitigate condition 5.
Because of the structure geometry, there are few practical ways to repair deteriorated J-bar
regions. Section enlargement, external straps and drilled-in starter bars are presented as viable
methods of repair.
Best Practices
For both new construction and structural rehabilitation projects, Strike Off Letter 431-11-06,
dated July 13, 2011, represents the current best practice for mitigating potential deterioration of
J-bars or dowel bars near pier/stem wall-footing interfaces.
For existing construction, there is no ‗one size fits all‘ approach and each structure must be
addressed on a case by case basis. The contents of this report provide some degree of guidance
for identifying (Section 6) and mitigating (Section 8) potential deterioration scenarios. Sections
8.2 and 8.3 provide guidance with respect to modeling this deterioration. Finally, Section 8.4
provides some potential repair schemes although it is emphasized that each will be unique to the
structure to which it is applied.

4
Table of Contents
1. Introduction ............................................................................................................................. 5
J-bars and Dowel Bars ................................................................................................................ 5
Review of Companion Study Results (Scope of Work Task 1).................................................. 6
Commentary on M&M Report.................................................................................................. 10
2. Field Study (Scope of Work Tasks 2 through 5) ................................................................... 11
Anecdotal Observations During Sight Visits ............................................................................ 13
Anecdotal Observations During Demolition ............................................................................ 14
3. J-Bar and Dowel Reinforcing Steel (Scope of Work Tasks 5a and b) .................................. 14
Reinforcing Steel Grade ............................................................................................................ 15
4. Corrosion of Reinforcing Steel .............................................................................................. 16
Chloride Threshold to Initiate Corrosion .................................................................................. 17
Chloride Threshold and Corrosion at Footing-Pier or Footing-Abutment Interfaces............... 19
ASTM C1152 Acid-Soluble Chloride Testing(Scope of Work Task 5c) ................................. 20
5. Summary of Findings of Field Study (Scope of Work Tasks 2 through 5) ........................... 21
6. Details Affecting J-Bar Corrosion (Scope of Work Task 6) ................................................. 22
7. Methods of Assessing J-Bar Corrosion (Scope of Work Tasks 7 and 8) .............................. 22
8. Mitigation and Repair of J-Bar Corrosion (Scope of Work Tasks 9 and 10) ........................ 24
Mitigation .................................................................................................................................. 24
Modeling corroded elements..................................................................................................... 24
Example of Effects of Modeling ............................................................................................... 25
9. Repair of Deteriorated J-bar Regions .................................................................................... 27
10. Best Practices for PennDOT .............................................................................................. 28
11. References .......................................................................................................................... 29
APPENDIX A ............................................................................................................................... 30
APPENDIX B: S-7648A – Forest Grove Rd. over I-79 ............................................................... 34
APPENDIX C: S-7141A – SR 528 over SR 422 .......................................................................... 43
APPENDIX D: S-9469 – Triborough Expressway Ramp S - Abutment S .................................. 50
APPENDIX E: S-4038 – SR 3086 over SR22 (‗Tonidale Bridge‘) ............................................. 56
APPENDIX F: S-2888 – Interstate 90 over Six Mile Creek ........................................................ 63
APPENDIX G: Summary of Bridges Sampled and Additional Bridges Considered and Rejected
for Study........................................................................................................................................ 70

5
1. Introduction
Deterioration and necking of J-bars has been reportedly observed at the interface of the footing
and stem wall during the demolition of older retaining walls and bridge abutments. Similar
deterioration has been reportedly observed between the pier column and footing. Any decrease in
the area of steel at these interfaces may result in reduction of foundation capacity and significant
decrease in steel area may result in foundation instability and hamper efforts to rehabilitate or
preserve existing foundations.
The objective of this project is to determine the extent and nature of deterioration and/or necking
of J-bars in existing bridge structures. This must be understood in order to identify existing
structures having the potential for or existence of deteriorated J-bars. Once at-risk structures are
identified, methods to identify and validate deterioration and remedial measures, details, and
methodologies can be developed to address affected structures.
J-bars and Dowel Bars
Deterioration of the steel reinforcing crossing the footing-pier or footing-stem wall interface is
the primary issue of concern. This steel may take the form of ‗J-bars‘: typically small diameter
reinforcing bars having a 180o anchorage in the footing; dowel bars: usually large diameter bars
having a straight anchorage into the footing; or ‗L-bars‘: having a 90o anchorage. Together, these
details are often referred to as ‗starter bars‘. The nature of the anchorage is not immediately
relevant to the deterioration at the footing interface. With the exception of large diameter dowel
bars, embedment into the footing is typically more than adequate to develop the bar in tension at
the footing interface. Again, with the exception of large diameter dowel bars, straight bar
embedment length above the footing interface is also typically adequate to develop the bar at the
interface. Indeed, the use of the term ‗dowel‘ implies that the bars act as a shear key but may not
be fully developed for tension. Typically, however, they will be developed for compression.
Figure 1 shows schematic representations of interface bar details. For convenience, the terms J-
bar and dowel bars only will be used in this report.
footing:Class B concrete (typ.)
pier or stem wall:Class A concrete (typ.)
J-bar dowel bar L-bar
pier bar
pier bar
pier bar
grade (typ.)
concrete cover
Figure 1. Typical J-bar, dowel bar and L-bar details.

6
Review of Companion Study Results (Scope of Work Task 1)
A companion study conducted by Modjeski and Masters Inc. (M&M) reported to PennDOT in
August 2011. The M&M report set out to answer eight questions and make recommendations.
The following is a summary of the findings contained in the report: Investigation of Causes and
Mitigation of J-Bars Deterioration in Bridge Structures in Pennsylvania. These are reported here
in the interest of completeness and to provide context for the present work.
Question #1: How much of a problem is the phenomenon of J‐bar deterioration in bridge
substructures in Pennsylvania?
The M&M study sampled six bridges in Central and Eastern Pennsylvania. Both piers and
abutment stem walls were sampled. Only one bridge showed no evidence of J-bar corrosion.
Two bridges exhibited ‗insignificant‘ deterioration, described as observed J-bar section loss of
less than 5%. One bridge exhibited ‗moderate‘ deterioration, with the maximum J-bar section
loss estimated to be 25%. The other two bridges exhibited ‗severe‘ deterioration, with a
maximum J-bar section loss estimated to be 65%. The moderate deterioration was observed in a
stub abutment backwall, while the severe deterioration was observed in one stub abutment stem
wall and one bent column.
An evaluation performed for the columns of the bridge with up to 65% loss in the bent column
reinforcement revealed that the operating level live load performance ratio for the columns
dropped from 1.18 to 0.92 when all bars on the tension side were modeled with 50% loss.
Materials testing indicated that the bridge was constructed with reinforcing steel having a higher
grade than that used for design. When the column was re-evaluated using the in situ reinforcing
steel yield strength, the operating level live load performance ratio for the columns dropped from
1.36 to 1.05 when all bars on the tension side were modeled with 50% loss.
The M&M report concludes that ―…it appears that bridges that were built in Pennsylvania during
the 1960‘s are susceptible to J‐bar deterioration. The small number of bridges that were
successfully sampled along with the limited diversity of characteristics possessed by this group
does not allow the determination of the prevalence of the problem. No conclusions can be made
about bridges that were not constructed during the 1960‘s. However, given the consistency of
construction practices and the time required for corrosion to take place, it is expected that under
the same conditions, deterioration of J‐bars will be more severe in older bridges than in newer
ones.‖ Furthermore, M&M conclude that ―…bridges that were built in Pennsylvania during the
1960‘s may experience highly variable reductions in load carrying capacity.
Question #2: Have other DOTs or transportation agencies experienced problems with J‐bar
deterioration?
M&M performed a somewhat informal survey, receiving only eight responses. Five states (DE,
MS, MO, NE, and WA) indicated that no J-bar corrosion problems had been experienced. Iowa
reported no problems but acknowledged that they do not observe demolition and therefore are
unaware of J-bar deterioration. Illinois indicated that, due to observed moisture penetration
through the construction joint at the bases of some older retaining walls, they suspected
deterioration of the J‐bars. Finally, Tennessee indicated that they observed one documented case
of J‐bar deterioration, which was a ―failed retaining wall‖.
The states which acknowledged the potential for J‐bar deterioration typically addressed the
problem by requiring the bars to be epoxy coated and/or providing a sealer on the surface of the

7
substructure concrete. From the policies enacted by the states, it appears that the proximity of the
substructure units to the roadway below the structure and to deck expansion joints are thought to
be potential factors in J‐bar deterioration. Nonetheless, M&M conclude ―The experiences of
other states do not provide significant evidence of characteristics causing J‐bar deterioration or
direction on how to address the issues causing J‐bar deterioration.‖
Question #3: Can existing bridges be screened to determine if J‐bar deterioration is likely in a
given substructure unit?
M&M conclude: ―It is believed that chlorides and moisture contacting the J‐bars cause the
observed deterioration. As would be expected, characteristics such as exposure to roadway
runoff, construction joints with poor adhesion between concrete pours, and construction joints
without waterproofing membranes were thought to be factors that contributed to J‐bar
deterioration. Factors that limited a bar‘s exposure to roadway runoff, such as intact
waterproofing membranes, construction joints with good adhesion between concrete pours, and
slope aprons (or other impervious features) that surrounded, and/or directed the water away from
the base of columns, were thought to be factors that mitigated J‐bar deterioration.‖
Many of these factors may be assessed from structure plans or inspection reports. Others may be
assessed through in situ investigation of bridge drainage systems. However critical factors such
as the condition of the water proofing membrane at the construction joint would require possibly
extensive excavation. The adhesion between the different concrete pours at the construction joint
would require excavation and some degree of destructive testing.
Importantly, M&M note that ―…that substructure units with J‐bar deterioration will not
necessarily exhibit distress. However, signs of distress such as spalling with corrosion staining
around the construction joint (if the construction joint is visible), significantly out of plumb, or
significant changes in plumb may indicate J‐bar deterioration is present in a substructure unit.
Staining and/or deterioration of the portion of a substructure unit above ground that can be
correlated to leaking superstructure expansion joints may indicate higher possibility of J‐bar
deterioration as the drainage from the deck that caused the deterioration in the above ground
portion of the substructure is likely to seep into the ground around the base of the substructure.‖
Question #4: Once an existing structure is identified as potentially susceptible to J‐bar
deterioration, are there nondestructive methods by which the presence and extent of J‐bar
deterioration can be confirmed and quantified?
In the case of the pier in which #9 J-bars were observed to have as much as 65% section loss, a
close inspection of the excavated column base prior to demolition ―exhibited no notable signs of
distress‖. This lack of visible distress was ―both unexpected and unsettling‖. Although not
identified in the M&M report, this lack of visible distress despite the significant degree of
corrosion likely reflects the large cover concrete thicknesses in such applications. M&M
proposed that the only method by which to assess corrosion at these interfaces is to expose the
bars themselves. Clearly this will typically be unacceptable. Finally, M&M concluded that ―there
are no known nondestructive methods that would allow the amount of section loss in the J‐bars
of in‐service bridges to be determined...‖ and that ―…there are no practical and reliable methods
that can be used to confirm and quantify the presence of J‐bar deterioration in existing
substructures.‖
8
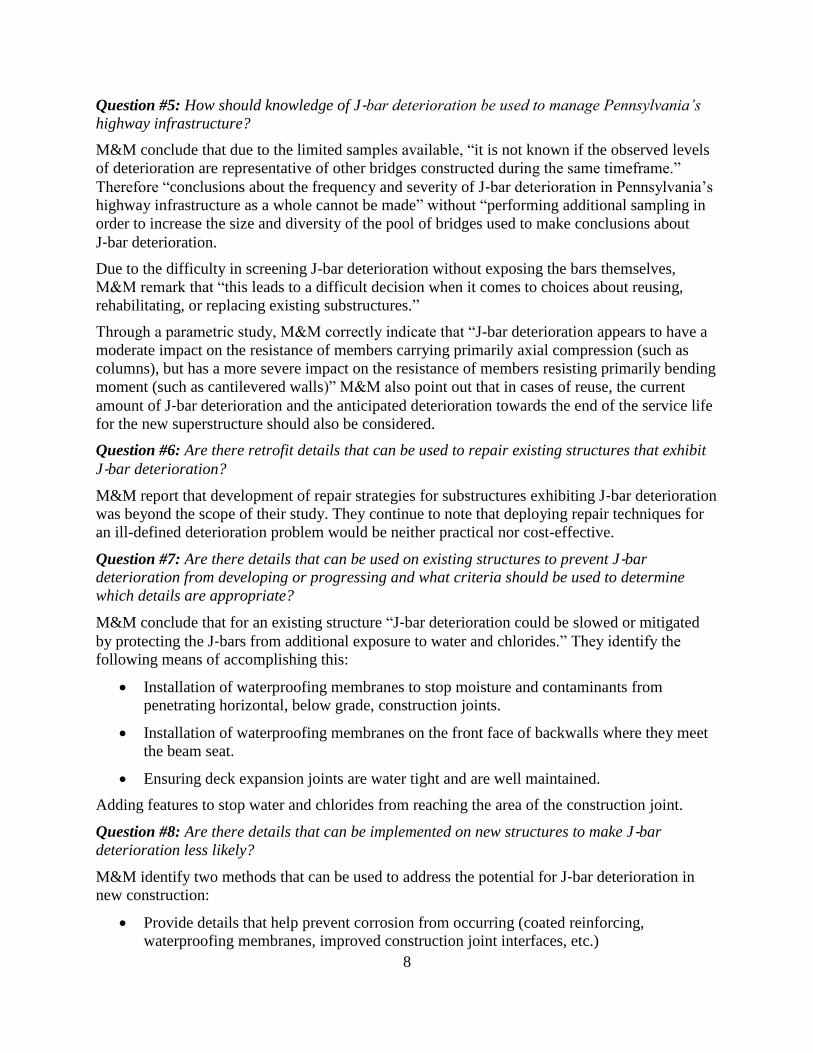
Question #5: How should knowledge of J‐bar deterioration be used to manage Pennsylvania’s
highway infrastructure?
M&M conclude that due to the limited samples available, ―it is not known if the observed levels
of deterioration are representative of other bridges constructed during the same timeframe.‖
Therefore ―conclusions about the frequency and severity of J‐bar deterioration in Pennsylvania‘s
highway infrastructure as a whole cannot be made‖ without ―performing additional sampling in
order to increase the size and diversity of the pool of bridges used to make conclusions about
J‐bar deterioration.
Due to the difficulty in screening J-bar deterioration without exposing the bars themselves,
M&M remark that ―this leads to a difficult decision when it comes to choices about reusing,
rehabilitating, or replacing existing substructures.‖
Through a parametric study, M&M correctly indicate that ―J-bar deterioration appears to have a
moderate impact on the resistance of members carrying primarily axial compression (such as
columns), but has a more severe impact on the resistance of members resisting primarily bending
moment (such as cantilevered walls)‖ M&M also point out that in cases of reuse, the current
amount of J‐bar deterioration and the anticipated deterioration towards the end of the service life
for the new superstructure should also be considered.
Question #6: Are there retrofit details that can be used to repair existing structures that exhibit
J‐bar deterioration?
M&M report that development of repair strategies for substructures exhibiting J‐bar deterioration
was beyond the scope of their study. They continue to note that deploying repair techniques for
an ill-defined deterioration problem would be neither practical nor cost-effective.
Question #7: Are there details that can be used on existing structures to prevent J‐bar
deterioration from developing or progressing and what criteria should be used to determine
which details are appropriate?
M&M conclude that for an existing structure ―J‐bar deterioration could be slowed or mitigated
by protecting the J‐bars from additional exposure to water and chlorides.‖ They identify the
following means of accomplishing this:
Installation of waterproofing membranes to stop moisture and contaminants from
penetrating horizontal, below grade, construction joints.
Installation of waterproofing membranes on the front face of backwalls where they meet
the beam seat.
Ensuring deck expansion joints are water tight and are well maintained.
Adding features to stop water and chlorides from reaching the area of the construction joint.
Question #8: Are there details that can be implemented on new structures to make J‐bar
deterioration less likely?
M&M identify two methods that can be used to address the potential for J‐bar deterioration in
new construction:
Provide details that help prevent corrosion from occurring (coated reinforcing,
waterproofing membranes, improved construction joint interfaces, etc.)

9
Overdesign the section so that a certain amount of deterioration can occur without
reducing the capacity below an acceptable level.
Recommendations
The M&M report made the following recommendations:
―For new construction, the following measures may be used to minimize future J‐bar
deterioration and, should deterioration occur, minimize the effect of the deterioration on the
resistance of the component:
1. Continue the policy of using epoxy coated reinforcement for the J‐bars.
2. Strictly enforce the requirements of roughening the interface surface of construction joints.
3. Expand the current policy of requiring waterproofing membranes at the base of stem walls on
the rear face of abutments to include all horizontal, below grade construction joints of
abutments, retaining walls, backwalls and columns as well as the construction joint on the
front face of backwalls where the backwall meets the beam seat.
4. Consider using J‐bars that are one size larger than those required by design.
5. Where possible, design drainage details that divert roadway runoff away from substructure
units.
To fully address the issue of J‐bar deterioration in existing structures, further knowledge of the
topic would be required. It is recommended that additional documentation of J‐bar condition in
existing structures be performed before a final policy is developed for addressing this issue.
Additional documentation should be performed on structures that are being demolished because
of scheduled replacement. The documentation should be performed on structures of different
ages that have varied characteristics believed to influence J‐bar deterioration. Once
documentation has been performed on a group of bridges that is large enough and sufficiently
diverse, the results of this report should be reevaluated to determine if the conclusions are still
valid. Until additional study of J‐bar deterioration in existing substructures is completed, it is
recommended that PennDOT implement the following actions:
6. Require plumb measurements to be taken on substructure units during routine safety
inspections. The measurements should be taken at specified locations so that they are
repeatable. The location and results of each plumb measurement should be listed in the
inspection report so that it can be referenced during future inspections. Changes in the
plumbness of a substructure unit may be an indication that J‐bar deterioration is occurring
and the J‐bars are yielding. Substructure units exhibiting significant changes in plumbness
should be investigated to determine the cause.
7. When the below grade construction joints of existing piers, abutments, wingwalls, retaining
walls, or columns are exposed during preservation or rehabilitation of a structure, require
waterproofing membranes to be installed at those joints.
8. When rehabilitation is being performed on a structure with backwalls, consider the
installation of waterproofing membranes on the front face of backwalls where they meet the
beam seat.
10
9. Where possible, install drainage details that divert roadway runoff away from substructure
units.
10. Maintain deck joints to prevent roadway runoff from leaking onto substructure units.
If additional documentation leads to the conclusion that J‐bar deterioration is indeed widespread
and often of an unacceptable magnitude, then a policy limiting the re‐use of substructures or
even requiring strengthening of in‐service substructures may be required. However, if additional
documentation leads to the conclusion that J‐bar deterioration is less widespread than indicated
by this study or the magnitude of section loss is not detrimental to the safety of the structures,
then the current criteria used by PennDOT may be deemed sufficient.
Commentary on M&M Report
The M&M report is remarkably thorough. As will be seen, the findings indicate that the extent of
J-bar corrosion is more significant than that found in the present study. The reasons for this are
unclear although support the conclusion that the studies are inconclusive with respect to the
extent of the problem. The M&M recommendations are generally sound although some require
clarifications as follows:
Recommendation #4 Consider using J‐bars that are one size larger than those required by
design
This recommendation is not believed to represent good practice. Bar size, especially at a splice,
affects a number of other aspects of the design including development length, anticipated
cracking (serviceability), cover and confinement requirements, concrete placement and plastic
behavior (mostly an issue for seismic design). Additionally, such a practice clearly makes little
sense when #11 dowel bars are considered.
More critically, however, such a recommendation tacitly implies that the behavior of corroded
reinforcing steel is simply a function of section loss and that no change in steel behavior
otherwise occurs. Corroded reinforcing steel exhibits a strength reduction approximately
equivalent to the section loss, however the strain capacity (ductility) is reduced to a significantly
greater degree and this reduction is not proportional to section loss (Apostolopoulos et al. 2006).
Indeed, Almusallam (2001) reports that 12% section loss is sufficient to result in a ―brittle
failure‖ of #4 reinforcing bars. Additionally, all such observations are made on ‗bare steel‘ from
which the corrosion product has been removed; this would not be the case in situ. The presence
of corrosion, will also adversely affect the fatigue properties of the steel, although this is unlikely
to be a consideration for the J-bars and dowel applications considered in this work.
Finally, and most troubling, the adoption of this recommendation implies that corrosion is
‗acceptable‘ or at least ‗anticipated‘. Corrosion is generally a process that a) is easier to
propagate than initiate; and b) propagates in an exponential manner. Thus it is far better to
mitigate corrosion altogether than to ‗gamble‘ that the degree of corrosion will limit itself to the
difference between the areas of different bar sizes.
Regardless of the foregoing, using larger bars is only possible in new structures. The use of
epoxy-coated bars and other recommended mitigation practices precludes the applicability of this
recommendation in the first place.

11
Recommendation #6 Require plumb measurements
While checking plumbness is a sound practice, it is unlikely that out-of-plumb elements are
associated with J-bar deterioration per se. Certainly, an out-of-plumb element is an indication of
distress. However out-of-plumbness implies some degree of flexure (which may be induced by
applied loads or, more likely, differential settlement). Particularly where larger dowel bars are
used, the dowels are only developed in compression. Out-of-plumbness is more likely to result
from slip of the ‗lap splice‘ at this location than from dowel deterioration. Deterioration due to
corrosion is unlikely to result in a ‗permanent set‘ of the bar. Dowels having a compression
embedment (i.e.: not developed for tension) are not likely to yield but rather slip. This slip may
or may not be reversible. If it is not, a permanent deformation may become evident.
Section 8 of M&M Report
Considering the foregoing discussion of Recommendation #4, the author of the present study
questions the validity of the assumptions made in the ―Parametric Study‖ presented in Section 8
of the M&M report. It would appear that this study was carried out simply adjusting the steel
area based on corrosion loss. That is the analytical model of the corroded element was identical
to the non-corroded ‗control‘ except the reinforcing bar area provided was: Ab x (Aremaining/Ab);
where Ab is the nominal bar area and Aremaining is the uncorroded area, calculated simply as 1 -
section loss. This approach neglects at least the following:
Change in bar ductility. In the way the elements were modeled, a column having corroded bars
will have a lower reinforcing ratio (ρ) and thus a higher steel strain demand at any performance
point (service, ultimate, etc.). At the same time, the steel deformation capacity is reduced due to
corrosion (Apostolopoulos et al. 2006 and Almusallam 2001). Thus it is not assured that the
remaining steel is able to achieve its yield stress, let alone the elongation capacity assumed in
design and rating methodologies for mild reinforcing steel.
Change in bond characteristics (Fang et al. 2006). The relationship between bond (required for
bar development length) and section loss is not established. In a worst case, uniform surface
corrosion may deteriorate bond almost completely. Thus the in situ behavior of corroded
reinforcing steel may change based on the inability to develop stresses in the bars.
Potential for splitting. Also affecting bond is the potential for the expansive corrosion product to
affect splitting and spalling of the concrete. Longitudinal splitting will effectively reduce the bar
capacity to near zero due to lack of confinement and therefore bond.
Uncertainty and reliability. Finally, the approach proposed in Section 8 of the M&M report does
not address uncertainty in establishing the section loss of the bar. This variability is compounded
in the rating process and is unlikely to result in the reliability that is both desired and assumed in
such processes. That is, the confidence with which the rating factors are determined is less than
that for which rating procedures are calibrated due to the introduction of the additional variable:
section loss.
In concurrence with the M&M report, no published studies or data were found on the subject of
J-bar deterioration in the context discussed here.
2. Field Study (Scope of Work Tasks 2 through 5)
Five decommissioned bridges were identified for study. These are reported in Table 1 and
subsequently in Appendices B through F (as indicated in Table 1). Appendix G contains a list of

12
all bridges considered and the reasons why some where rejected. The primary criteria for
selection were a) the presence of J-bars or dowel bars; and b) the appropriateness of the
demolition plan; i.e.: was demotion to include the footing interface? A number of proffered
bridges were rejected based on both criteria. The bridges selected are believed to represent a
reasonable cross section of potentially effected bridges. The bridges range in age from 35 to 53
years at their time of demolition. Samples were taken from roadside piers and abutments,
abutments immediately beneath (leaking) expansion joints and piers located on a creek flood
plain. Table 1 provides a brief summary of both the visual corrosion assessment of recovered J-
bars and dowels (see Section 3.1) and of the acid-soluble chloride content determined from
concrete core samples (see Section 4.3). For convenience, in the remainder of this report, bridges
will be referred to as B through F based on their appendix designation in Table 1.
Table 1. Bridges included in field study.
Appendix Bridge Feature County Year
built
Site Visit
Date
Sampling
Date
Sample
Location
Corrosion
Assessment
Chloride
Assessment
(acid soluble Cl-
by weight)
B S7648 Forest Grove
over I-79 Allegheny 1969
1/28/09
02/09 – 03/09
Pier 2
Pier 7
Abutment 2
no evidence
of corrosion 0.17 – 0.35%
C S7141 SR528 over
SR422 Butler 1967
4/12/09
05/09 Abutment 2
no evidence
of corrosion 0.16 – 0.33%
D S9469 Triboro
Ramp Allegheny 1974
no visit1
04/09 Abutment S
no evidence
of corrosion 0.22 – 0.32%
E S4038 SR3086 over
SR22 Allegheny 1960
5/6/10
11/10 Abutment N
corrosion
associated
with damage
to abutment
0.18 – 0.23%
F S2888 I-90 over Six
Mile Creek Erie
1957 8/3/10
12/10 EB3
no evidence
of corrosion 0.15 – 0.25%
1957 8/3/10
10/27/11 WB3
minor surface
corrosion 0.36%
1 bridge was already out-of-service when added to this project
For all bridges considered in this study an extensive review of details and conditions was carried
out. These are presented in the appendices. The details considered in each review included the
following:
1. location of bridge
2. review of original bridge drawings
3. review of available inspection reports (focusing on most recent)
4. general description of bridge including design basis and ADT
5. extant condition (from both inspection reports and site visit) including ratings and
sufficiency rating
6. J-bar/dowel details
a. pier stem/stem wall dimensions
b. footing dimensions
c. interface steel
d. concrete class at interface
13
7. J-bar/dowel environment:
a. elevation of top of footing
b. depth below existing grade
c. horizontal clearance to roadway or stream channel
8. report of site visit conducted
9. J-bar/dowel and concrete core sampling protocol
10. Measured reinforcing bar tension properties (ASTM E8) and observed corrosion
11. Measured acid-soluble chloride content of cores (ASTM C1152)
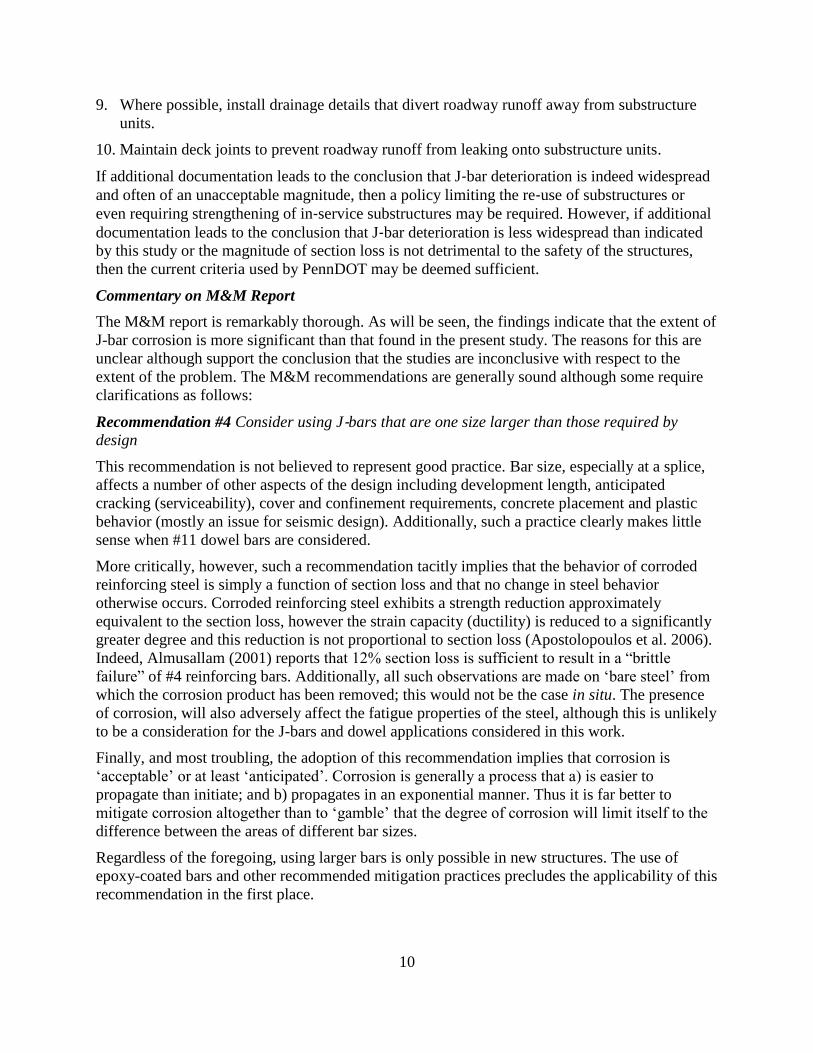
Anecdotal Observations During Sight Visits
The site visits identified a number of conditions that have the potential to affect corrosion at the
footing-pier or footing-stem wall interfaces. Examples of these are shown in Figure 2.
Piers located in intermittent streams or on flood plains (Figure 2a) are subject to alternating wet-
dry conditions which may accelerate the corrosion process once it begins. Piers in particular,
may be located sufficiently close to the roadway to receive regular exposure to de-icing salt,
either directly or indirectly from salt spray and deposition during plowing operations (Figures 2b
and c). Poor drainage in the vicinity of pier bases and/or broken or inoperable deck drainage may
also channel chloride laden water toward the pier base interface (Figures 2d and e). Poor
drainage may also ‗wash out‘ some of the soil cover. Similarly, damaged or deteriorated deck
joints may lead to a concentration of chloride-laden water at an abutment wall (Figure 2f and g).
a) piers located in intermittent
streams or flood plains.
(Bridge G, Pier EB2)
b) Proximity of pier to I-79 SB. Evidence of salt
spray and water dripping onto barrier wall from
pier cap (right). (Bridge B, Pier 2)
c) Proximity of Pier to SR 22
(Bridge E, Pier 2)
d) Disconnected downpipe at
base of pier
(Bridge E, Pier 2)
e) Drainage eroding
soil at pier base (no
splash pad)
(Bridge B, Pier 5)
f) Abutment and slope
showing evidence of leaking
from above.
(Bridge E, N Abutment)
g) drainage along slope
at stem wall.
(Bridge E)
Figure 2. Examples of issues that may affect corrosion at footing interfaces.
(See Appendices for larger versions of photographs.)

14
Anecdotal Observations During Demolition
During the demolition process little reinforcing bar corrosion was noted at any bridge. Concrete,
both above and below the footing interface was sound in all observed cases. Steel, when exposed
during demolition was uncorroded and ‗black‘. Most bars retained a thin layer of adhered cement
paste. This is an anecdotal indication of continued passivity of the bar. Additionally, corroded
bar will not show adhesion to the surrounding concrete paste. Figure 3 shows some examples of
interfaces observed in situ during demolition.
a) lap splice of #5 J-bar and stem
wall bar (footing to left and stem
wall to right)
(Bridge C, Abutment 2)
b) exposed #8 J-bars of demolished
pier.
(Bridge C, Pier 2)
c) Pier-footing interface showing
#11 dowels and pier reinforcement.
(Bridge B, Pier 2)
Figure 3. Examples of sound concrete and uncorroded reinforcing steel observed during
demolition. (See Appendices for larger versions of photographs.)
3. J-Bar and Dowel Reinforcing Steel (Scope of Work Tasks 5a and b)
Reinforcing bar samples were recovered from all bridges as indicated in each appendix. As the
bars were removed, the location of the footing interface was clearly marked. Each recovered bar
was visually inspected for corrosion in this region. Photographs of all recovered bars are
provided in the appendices.
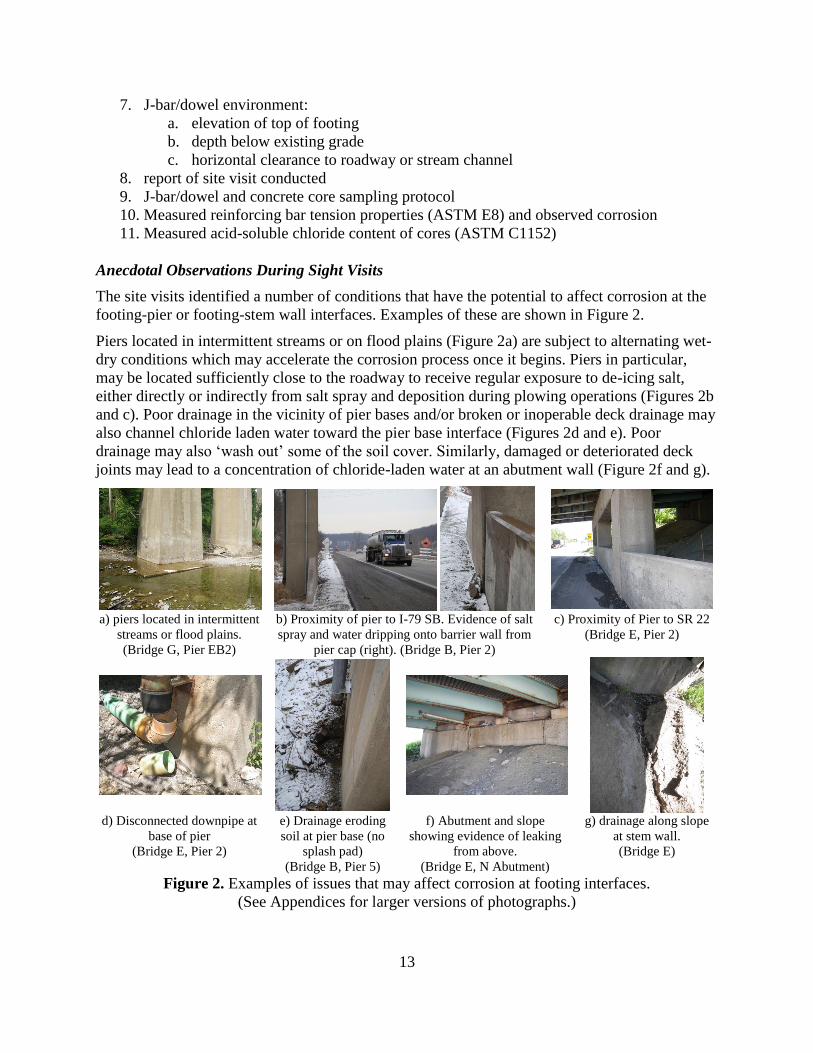
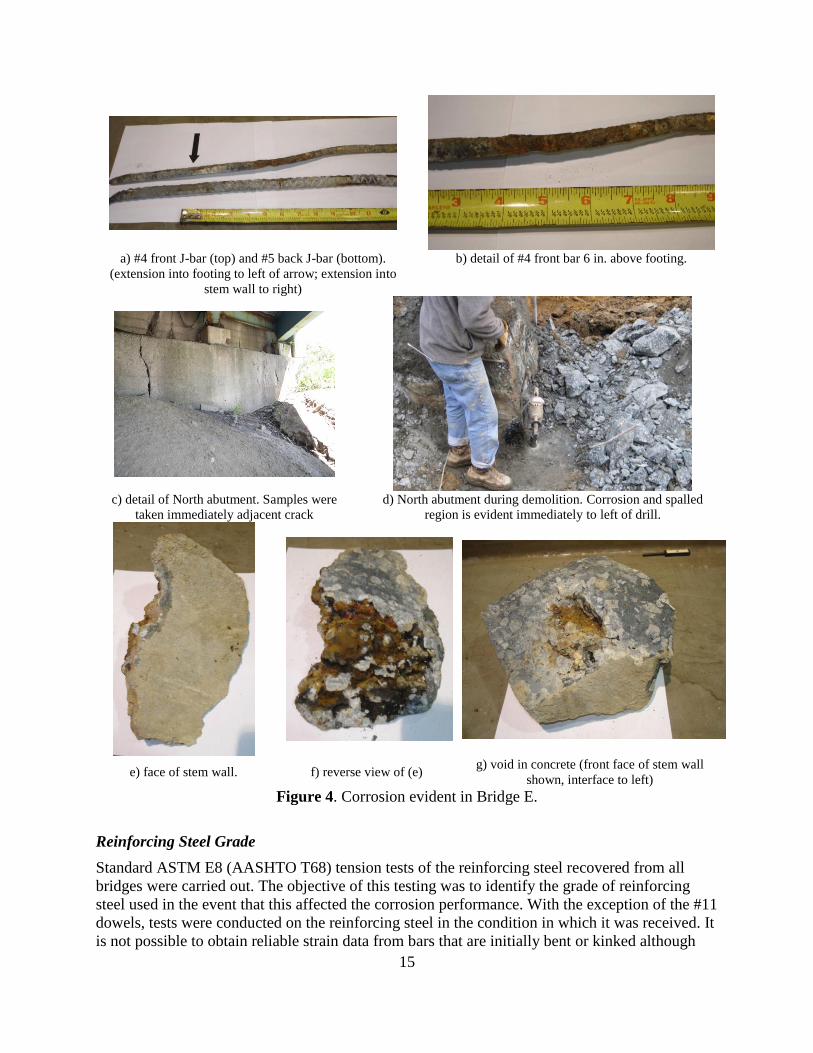
Of the five bridges surveyed, there was only one instance of reinforcing bar corrosion observed
(Figure 4). A #4 bar removed from the front of the stem wall of Bridge E was significantly
corroded at a location approximately 6 in. above the interface (Figures 4a and b). The bar was
not corroded at the interface itself. The corrosion was found directly below the location of a
significant crack in the stem wall (Figures 4c and d) and at location of an apparent honeycomb in
the stem wall. A spalled region of stem wall showing considerable corrosion product from the
stem wall bars (not the J-bar) is shown in Figures 4e to g. It is believed that the corrosion evident
in Figure 4 results entirely from the damage evident to the stem wall and was exacerbated by
water leaking through the expansion joint above this abutment.
15
a) #4 front J-bar (top) and #5 back J-bar (bottom).
(extension into footing to left of arrow; extension into
stem wall to right)
b) detail of #4 front bar 6 in. above footing.
c) detail of North abutment. Samples were
taken immediately adjacent crack
d) North abutment during demolition. Corrosion and spalled
region is evident immediately to left of drill.
e) face of stem wall. f) reverse view of (e) g) void in concrete (front face of stem wall
shown, interface to left)
Figure 4. Corrosion evident in Bridge E.
Reinforcing Steel Grade
Standard ASTM E8 (AASHTO T68) tension tests of the reinforcing steel recovered from all
bridges were carried out. The objective of this testing was to identify the grade of reinforcing
steel used in the event that this affected the corrosion performance. With the exception of the #11
dowels, tests were conducted on the reinforcing steel in the condition in which it was received. It
is not possible to obtain reliable strain data from bars that are initially bent or kinked although
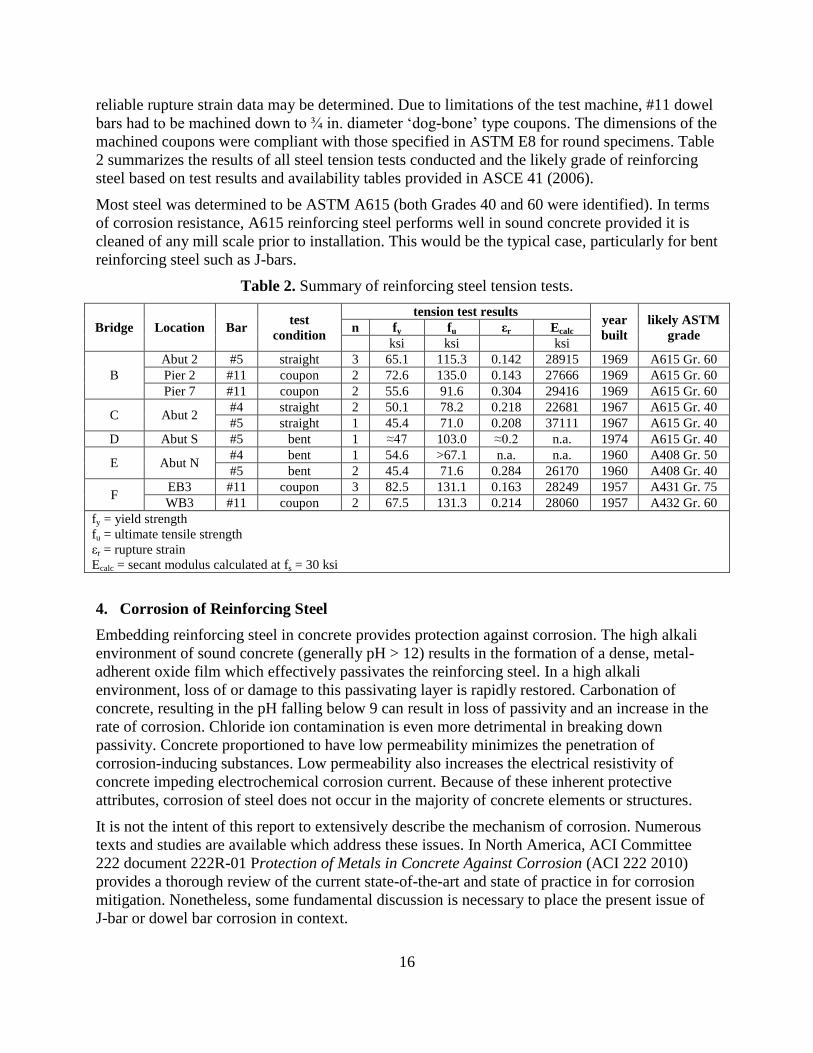
16
reliable rupture strain data may be determined. Due to limitations of the test machine, #11 dowel
bars had to be machined down to ¾ in. diameter ‗dog-bone‘ type coupons. The dimensions of the
machined coupons were compliant with those specified in ASTM E8 for round specimens. Table
2 summarizes the results of all steel tension tests conducted and the likely grade of reinforcing
steel based on test results and availability tables provided in ASCE 41 (2006).
Most steel was determined to be ASTM A615 (both Grades 40 and 60 were identified). In terms
of corrosion resistance, A615 reinforcing steel performs well in sound concrete provided it is
cleaned of any mill scale prior to installation. This would be the typical case, particularly for bent
reinforcing steel such as J-bars.
Table 2. Summary of reinforcing steel tension tests.
Bridge Location Bar test
condition
tension test results year
built
likely ASTM
grade n fy fu εr Ecalc
ksi ksi ksi
B
Abut 2 #5 straight 3 65.1 115.3 0.142 28915 1969 A615 Gr. 60
Pier 2 #11 coupon 2 72.6 135.0 0.143 27666 1969 A615 Gr. 60
Pier 7 #11 coupon 2 55.6 91.6 0.304 29416 1969 A615 Gr. 60
C Abut 2 #4 straight 2 50.1 78.2 0.218 22681 1967 A615 Gr. 40
#5 straight 1 45.4 71.0 0.208 37111 1967 A615 Gr. 40
D Abut S #5 bent 1 ≈47 103.0 ≈0.2 n.a. 1974 A615 Gr. 40
E Abut N #4 bent 1 54.6 >67.1 n.a. n.a. 1960 A408 Gr. 50
#5 bent 2 45.4 71.6 0.284 26170 1960 A408 Gr. 40
F EB3 #11 coupon 3 82.5 131.1 0.163 28249 1957 A431 Gr. 75
WB3 #11 coupon 2 67.5 131.3 0.214 28060 1957 A432 Gr. 60
fy = yield strength
fu = ultimate tensile strength
εr = rupture strain
Ecalc = secant modulus calculated at fs = 30 ksi
4. Corrosion of Reinforcing Steel
Embedding reinforcing steel in concrete provides protection against corrosion. The high alkali
environment of sound concrete (generally pH > 12) results in the formation of a dense, metal-
adherent oxide film which effectively passivates the reinforcing steel. In a high alkali
environment, loss of or damage to this passivating layer is rapidly restored. Carbonation of
concrete, resulting in the pH falling below 9 can result in loss of passivity and an increase in the
rate of corrosion. Chloride ion contamination is even more detrimental in breaking down
passivity. Concrete proportioned to have low permeability minimizes the penetration of
corrosion-inducing substances. Low permeability also increases the electrical resistivity of
concrete impeding electrochemical corrosion current. Because of these inherent protective
attributes, corrosion of steel does not occur in the majority of concrete elements or structures.
It is not the intent of this report to extensively describe the mechanism of corrosion. Numerous
texts and studies are available which address these issues. In North America, ACI Committee
222 document 222R-01 Protection of Metals in Concrete Against Corrosion (ACI 222 2010)
provides a thorough review of the current state-of-the-art and state of practice in for corrosion
mitigation. Nonetheless, some fundamental discussion is necessary to place the present issue of
J-bar or dowel bar corrosion in context.
17
Tuutti (1982) describes the corrosion process as essentially occurring in two stages: initiation
and propagation. In the initiation stage, the steel is primarily passive. In this stage, chloride ions
(Cl-) and carbonation (CO2) penetrate toward the reinforcing steel. Thus the initiation stage is
affected by the Cl- and CO2 concentrations present, the permeability of the concrete and the
depth of concrete cover. Estimates of the increase in corrosion protection offered by the depth of
concrete cover range from linear (e.g.: Clear 1976) to the square of the cover depth (Atimay and
Ferguson 1974). In the propagation phase, corrosion of the steel proceeds at a significant rate
until the stress resulting from the corrosion products results in cracking and spalling of the
concrete cover.
Chloride-induced corrosion is often localized. The process involves two separate but coupled
electrochemical reactions which take place at different sites on the steel surface. The anodic
reaction occurs at the corrosion site (pit):
Fe Fe2+
+ 2e-
The released electrons (e-) are transported (via the resulting drop in electrical potential between
anode and cathode) to the passive region of the steel surface where they are consumed by the
oxygen reduction reaction:
½O2 + H2O + 2e- 2OH
-
For the corrosion process to be sustained, ionic transport inside the concrete is required to
complete the current flow. Concrete pore water is a strong electrolyte and is even more efficient
when Cl- is present; thus there is little difficulty in providing the ionic current through the
transport of soluble species.
The corrosion product is formed by the reaction of the Fe2+
with OH- and additional oxygen (O2).
The corrosion product is porous and therefore easily permits ionic species such as Cl- to
penetrate and sustain the corrosion cell.
Oxygen (O2) and water (H2O) are essential to the corrosion process. Concrete is sufficiently
porous that there is usually sufficient oxygen present for the oxygen reduction reaction to
proceed. In concrete that is submerged (or buried in humid soil or silt; Li and Sagues 2001), the
rate of corrosion is limited by the rate of oxygen diffusion. For instance, corrosion of embedded
steel in concrete that is continuously submerged is rare (ACI 222 2010).
Chloride Threshold to Initiate Corrosion
The previous paragraphs describe steady-state active corrosion during the propagation stage. Of
primary interest, however is the transition from the initiation to propagation stages; when the
passive film on the steel breaks down. Although reported values vary considerably, the concept
of a critical chloride concentration – termed a chloride corrosion threshold – above which
passivity is lost and corrosion initiated, is broadly recognized to capture this transition behavior.
Although optimal, it is not possible to eliminate chlorides from concrete production. Cold
weather concreting practice and precast concrete, where reduced cure times are desired, result in
chlorides being introduced directly into the concrete mix. Additionally, some admixtures and
chloride-bearing aggregate are also in regular use. In-service concrete may also be exposed to
high chloride concentrations in the form of de-icing salts/chemicals or the presence of sea water.
When the chloride content of concrete exceeds the chloride corrosion threshold unacceptable
18
corrosion may occur provided the other necessary conditions for corrosion exist: namely the
presence of oxygen and moisture.
There are three analytic values that may be used to designate chloride content in fresh concrete,
hardened concrete or in any of the concrete mix components (ACI 222 2010): Total Chloride
Content is a measure of total amount of chlorine and requires special methods to determine.
Acid-soluble Chloride Content (ASTM C1152 or AASHTO T260) measures the chloride that is
soluble in nitric acid (HNO3) and is the most common measure of chloride content used and the
one adopted in this study. Water-soluble Chloride Content (ASTM C1218; no AASHTO
equivalent) measures the chloride extractable in water under defined conditions. The water-
soluble result is highly dependent on the test procedure, particle size, extraction time and
temperature and the age and environmental exposure of the concrete sampled.
Although not technically true, acid-soluble chloride content is often referred to as total chloride
content. The acid-soluble test standard (ASTM C1152) specifically states: ―In most cases, acid-
soluble chloride is equivalent to total chloride.‖ It is also important to note that acid- and water-
soluble chloride values differ and are not directly comparable. For consistency, only acid-soluble
chloride content will be discussed in this report. In all cases, content is given as a percentage of
the total sample weight.
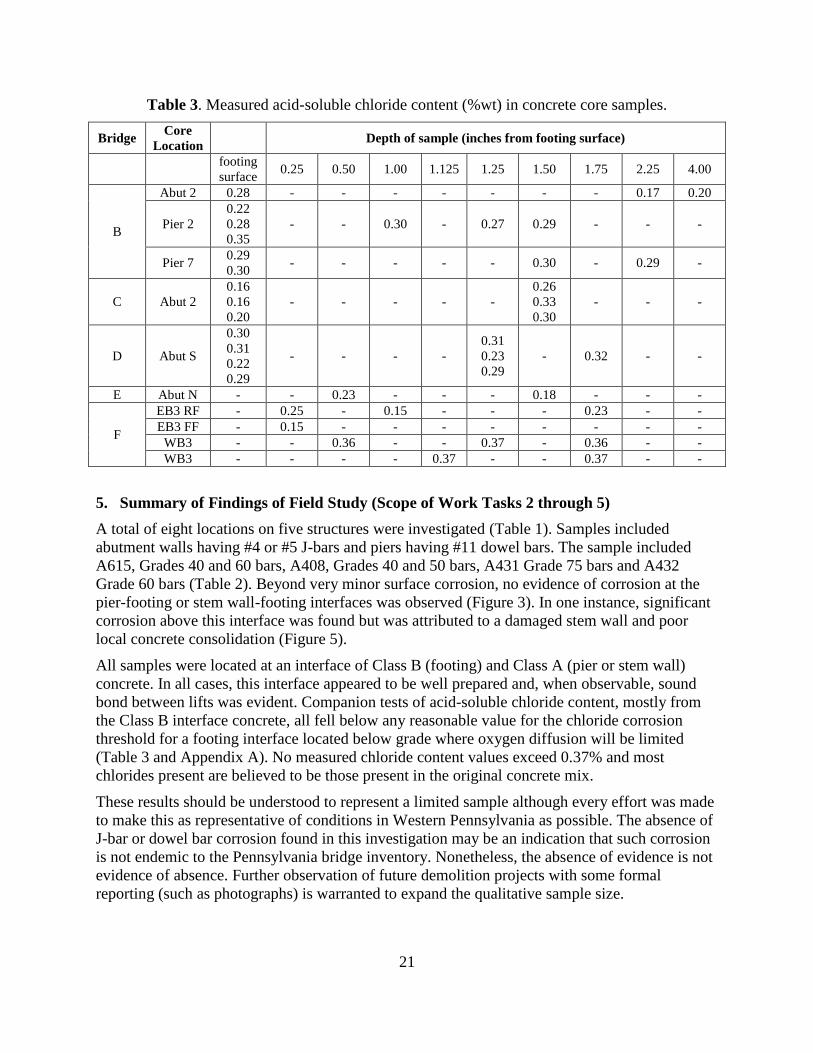
A review of 24 studies reporting a total of 36 ranges for the chloride corrosion threshold is
provided in Appendix A. (These studies are largely, although not entirely, summarized in Li and
Sagues 2001, Alonso et al. 2000 and ACI 222 2010.) Figure 5 summarizes the reported threshold
values (single data points) and ranges (for clarity, the data has been arranged in order of
ascending threshold values). The reported threshold values vary over an order of magnitude from
approximately 0.20% to about 2.50% Cl- by weight of concrete (%wt). The threshold value has
been shown to be affected by many parameters including: a) steel chemistry, surface condition
(particularly the presence of mill scale) and configuration (size, deformations); b) concrete
chemistry, particularly the C3A content in the cement; c) the type (NaCl, CaCl2 or sea water) and
source (introduced in mix or from environment) of chloride; d) the service environment
(humidity, temperature, other chemical attack (sulfates)); and e) concrete porosity as affected by
both the mix design and cracking.
Several Federal Highway Administration tests on bridge decks (Stratful et al. 1975, Clear 1976
and Chamberlin et al. 1977) report an acid-soluble chloride corrosion threshold of 0.20% It is
noted that bridge decks represent the most severe corrosion environment having both a heavy
external chloride loading (de-icing salts) and ready presence of oxygen and moisture.
National standards also vary in their treatment of a chloride threshold in new concrete structures.
ACI 318 allows an acid-soluble chloride threshold of 0.20% for conventionally reinforced
concrete exposed to chlorides in service (usually assumed to occur in a wet environment). The
threshold is increased to 1.00% for dry service environments. ACI 222, on the other hand,
prescribes values of 0.10% for wet in-service conditions and 0.20% for dry conditions. The
British Concrete Building Standard permits a chloride threshold of 0.35% for 95% of test results
with no results exceeding 0.50%. The Norwegian Concrete Building Standard permits a chloride
threshold of 0.60%. As a point of comparison, these values are significantly reduced for
prestressed concrete due to the high susceptibility of prestressing steel to corrosion. For
prestressed concrete, ACI 318 permits only 0.08% acid-soluble chlorides while the Norwegian
Standard permits only 0.002%.

19
0.0
0.5
1.0
1.5
2.0
2.5
3.0
3.5
To
tal ch
lori
de
lev
el (
%w
t) r
equ
ired
to
init
iate
co
rro
sio
n o
f re
info
rcin
g s
teel
Study (n = 36)
studies arranged in order of ascending lower limit
range of values shown where reported
Figure 5. Total chloride levels (%wt) required to initiate corrosion of reinforcing steel (bars
indicate the upper and lower values reported in a study when applicable).
Chloride Threshold and Corrosion at Footing-Pier or Footing-Abutment Interfaces
The focus of the present study is to address a perceived corrosion issue associated with footing-
pier and footing-abutment interfaces: the so-called ‗J-bar corrosion‘. Based on the preceding
discussion this interface region has both deleterious and mitigating details affecting corrosion
potential.
The interface crossed by the J-bars or dowels is a cold joint (construction joint) in older
structures typically having a Class B concrete below (footing) and a Class A concrete above (pier
or stem wall). (It is noted that the use of separate classes of concrete no longer exists.) Generally
one would assume that the permeability along this joint his quite high in comparison to the
surrounding concrete. Additionally, under lateral loads, this joint may open as a crack. Thus
there is a path for water and soluble salts to reach the reinforcing steel. On the other hand, this
interface is often located below grade and sometimes below the water table (when pier is located
in a river) thereby limiting the rate of oxygen diffusion. The former condition may promote
corrosion while the latter mitigates corrosion.
Piers located in intermittent streams or on flood plains (Figure 2a) will not generally benefit from
being ‗submerged‘ since they are also occasionally dry. Generally, however, these locations will
not be subject to high chloride loading unless the structure is in a coastal environment.
Piers in particular, may be located sufficiently close to the roadway to receive regular exposure
to de-icing salt, either directly or indirectly from salt spray and deposition during plowing
operations (Figures 2b and c). In this case, the fact that the interface is buried should help to
mitigate corrosion by limiting oxygen diffusion and providing ‗cover‘ to the interface.

20
Poor drainage in the vicinity of pier bases and/or broken or inoperable deck drainage may also
channel chloride laden water toward the pier base interface (Figures 2d and e). This may also
‗wash out‘ some of the soil cover. Similarly damaged or deteriorated deck joints may lead to a
concentration of chloride-laden water at an abutment wall (Figure 2f and g).
ASTM C1152 Acid-Soluble Chloride Testing(Scope of Work Task 5c)
As indicated in the Bridge Inspection Reports contained in the appendices, core samples were
obtained from locations adjacent to where the reinforcing steel was recovered (see Section 3.1).
In most cases, these samples were taken from the footing side of the interface. There are a
number of compelling reasons for this: a) the footing is generally the lower quality concrete
(Class B, rather than Class A); b) gravity will tend to result in the lower face of the horizontal
interface having a greater chloride concentration; and c) due to demolition practice, it is difficult
to obtain samples above the interface.
In all cases, 2 inch diameter cores were dry drilled to the greatest depth possible. These were
labeled and immediately placed in individual ‗zip lock‘ freezer bags and were stored in freezer
until testing.
Acid-soluble chloride content of samples taken from each core was determined using the method
prescribed by ASTM C1152. This method is essentially the same as that promulgated by
AASHTO T260, however it is noted that the ASTM document was used as a reference for this
test program.
Powdered samples were recovered from each core at various depths - measured from the top of
the footing - by drilling transversely through the core at the desired depth. The drilling process
resulted in powder samples of sufficient fineness that further grinding was unnecessary.
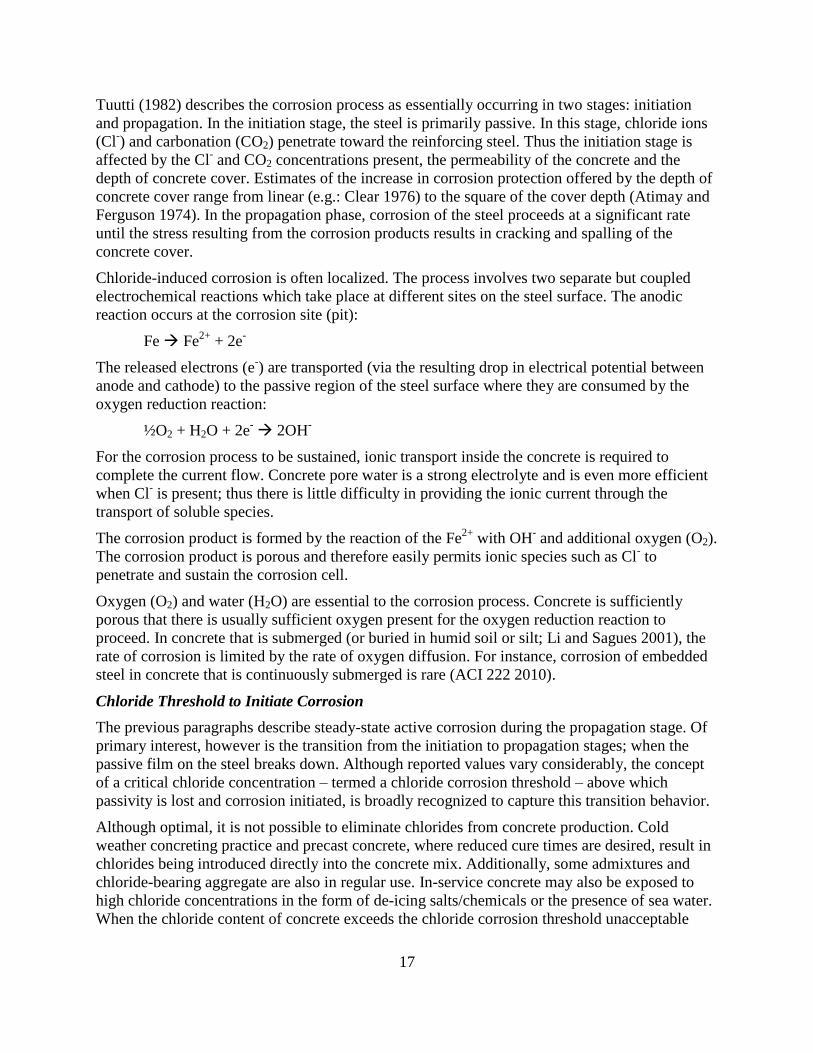
Table 3 summarizes all acid-soluble chloride results for all samples. Due to the nature of the
procedure, sample depths varied from core to core. In general, there was approximately 2 - 2.5
in. cover to the J-bars or dowels.
The acid-soluble chloride values given in Table 3 indicate a relatively low susceptibility to
chloride-induced corrosion. At the footing surface, values are consistent for all bridges
considered: averaging about 0.26%. No measured chloride content values exceed 0.37%. The
few measurements taken at deeper concrete depths (2.25 and 4.00 inches) are likely indicative of
chloride content of the original concrete mix: in the vicinity of 0.20-0.30%. This would be a
typical value for concrete of this vintage.
In cases where chloride content does not vary with depth (notably: B-Piers 2 and 7 and D) it is
unlikely that there are chlorides being introduced within the environment. For those samples with
a clear chloride gradient (B-Abut 2 and E), it is likely that some chloride has been introduced by
the environment, although the values are low in all cases.
All values are believed to fall below any reasonable value for the chloride corrosion threshold for
a footing interface located below grade where oxygen diffusion will be limited.
21
Table 3. Measured acid-soluble chloride content (%wt) in concrete core samples.
Bridge Core
Location
Depth of sample (inches from footing surface)
footing
surface 0.25 0.50 1.00 1.125 1.25 1.50 1.75 2.25 4.00
B
Abut 2 0.28 - - - - - - - 0.17 0.20
Pier 2
0.22
0.28
0.35
- - 0.30 - 0.27 0.29 - - -
Pier 7 0.29
0.30 - - - - - 0.30 - 0.29 -
C Abut 2
0.16
0.16
0.20
- - - - -
0.26
0.33
0.30
- - -
D Abut S
0.30
0.31
0.22
0.29
- - - -
0.31
0.23
0.29
- 0.32 - -
E Abut N - - 0.23 - - - 0.18 - - -
F
EB3 RF - 0.25 - 0.15 - - - 0.23 - -
EB3 FF - 0.15 - - - - - - - -
WB3 - - 0.36 - - 0.37 - 0.36 - -
WB3 - - - - 0.37 - - 0.37 - -
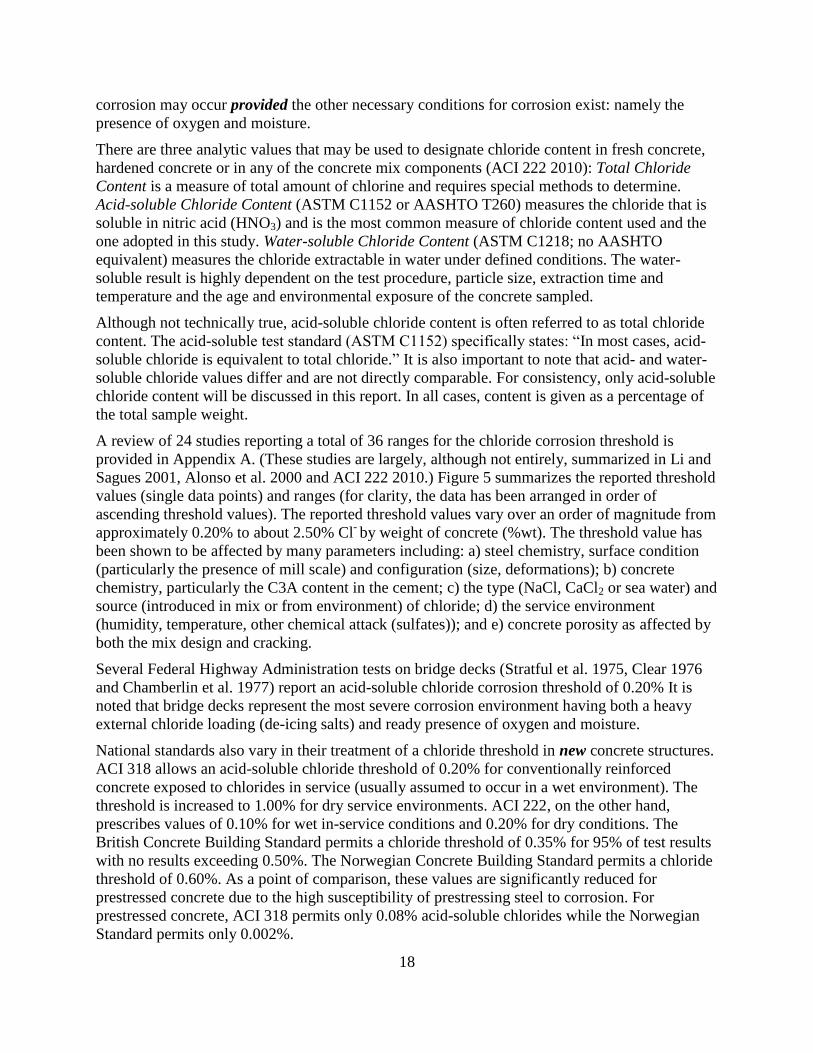
5. Summary of Findings of Field Study (Scope of Work Tasks 2 through 5)
A total of eight locations on five structures were investigated (Table 1). Samples included
abutment walls having #4 or #5 J-bars and piers having #11 dowel bars. The sample included
A615, Grades 40 and 60 bars, A408, Grades 40 and 50 bars, A431 Grade 75 bars and A432
Grade 60 bars (Table 2). Beyond very minor surface corrosion, no evidence of corrosion at the
pier-footing or stem wall-footing interfaces was observed (Figure 3). In one instance, significant
corrosion above this interface was found but was attributed to a damaged stem wall and poor
local concrete consolidation (Figure 5).
All samples were located at an interface of Class B (footing) and Class A (pier or stem wall)
concrete. In all cases, this interface appeared to be well prepared and, when observable, sound
bond between lifts was evident. Companion tests of acid-soluble chloride content, mostly from
the Class B interface concrete, all fell below any reasonable value for the chloride corrosion
threshold for a footing interface located below grade where oxygen diffusion will be limited
(Table 3 and Appendix A). No measured chloride content values exceed 0.37% and most
chlorides present are believed to be those present in the original concrete mix.
These results should be understood to represent a limited sample although every effort was made
to make this as representative of conditions in Western Pennsylvania as possible. The absence of
J-bar or dowel bar corrosion found in this investigation may be an indication that such corrosion
is not endemic to the Pennsylvania bridge inventory. Nonetheless, the absence of evidence is not
evidence of absence. Further observation of future demolition projects with some formal
reporting (such as photographs) is warranted to expand the qualitative sample size.

22
6. Details Affecting J-Bar Corrosion (Scope of Work Task 6)
While no J-bar deterioration was observed in this study a number of factors that are believed to
contribute to the potential for J-bar corrosion are identified. While these may be used to screen
existing structures for this type of deterioration, no factor has been found to correlate with J-bar
or dowel deterioration.
1. The use of black steel (all cases in this study).
2. Lack of water proofing membrane (all cases in this study).
3. Improperly prepared construction joints resulting in poor bond or a ‗smoother‘ interface
crack surface. Anecdotal evidence tells of one such construction joint which was trowel-
finished; clearly such practice should be avoided (not observed in this study).
4. Construction joints having little or no soil cover or are located in splash zones or other
environments resulting wet-dry conditions (an example is shown in Figure 2a).
5. Exposure to chlorides. This may result from proximity to a deck joint, deck drain or
scupper or from proximity to a carriageway (splash zone). Topography may also lead to
the potential for chloride-contaminated water ingress (examples are shown in Figure 2).
Structures considered in this study exhibited all but condition 3 yet exhibited no J-bar
deterioration. Thus these conditions alone are not correlated to damage, they are simply possible
indicators that may be used to guide bridge inspectors during field views. All but condition 3 are
knowable and one would anticipate that compounding multiple conditions would result in greater
likelihood of deterioration; thus all such conditions should be noted in inspection reports.
7. Methods of Assessing J-Bar Corrosion (Scope of Work Tasks 7 and 8)
Due to the nature and location of J-bars, there are few practical methods by which to universally
assess their condition in situ. Practically, all require direct access to the pier/stem wall-footing
interface. The author has previously compiled a report of corrosion assessment techniques for
reinforced concrete bridge structures (Task 2 reported in Harries et al. 2009). This list of
assessment techniques has been updated as part of NCHRP 20-07/307 (reporting in May 2012),
for which the author is the contractor. Table 4 summarizes available assessment techniques and
comments on their suitability for application to J-bars. Table 4 is presented in approximately the
order of utility of each method. A description of each method is provided in Harries et al. 2009
or the NCHRP 20-07/307 report available 2012).

23
Table 4.Assessment techniques applicability for J-bar deterioration.
method
access to
pier/wall-
footing
interface
required
destructive
evaluation
suitable for
long-term
monitoring
deployable
in 2012
utility for assessment of J-bar
deterioration
visual
inspection yes
occasionally
(req‘d for
rear face of
abutments)
no yes
Realistically the best approach although
limited to damage that has already been
expressed at the concrete surface. Focus is
placed on issues described in Section 6.
chloride
penetration
sampling
yes yes no yes A good method for assessing the potential
for corrosion as described in this report.
surface
potential
survey/half
cell potential
survey
yes contact with
steel req‘d no yes
This method is a well-established
standardized technique for assessing
corrosion potential. While cumbersome, it is
presently most viable and widely used in situ
alongside visual and other manual forms of
inspection. ASTM C 876 provides guidance
for its use.
remnant
magnetism yes no no yes
Poor to none. Commercially available
systems are primarily aimed at detection of
flaws/damage in prestressed slabs.
acoustic
emission (AE) no no yes yes
Poor. Calibration of AE systems to isolate J-
bar deterioration would be difficult. It is not
believed that this is a viable application for
AE.
linear
polarization
not directly
but nearby
contact with
steel req‘d yes yes Yields limited data on reinforcing steel.
electrical
resistance
not directly
but nearby
contact with
steel req‘d yes yes Yields limited data on reinforcing steel.
fiber optic
sensors yes no yes yes
Poor, although could be arranged to detect
interface crack-opening or pier plumbness.
impact echo yes no no yes Yields limited data regarding deteriorated
concrete; nothing about reinforcing steel
AC
impedance
not directly
but nearby
contact with
steel req‘d yes no Yields limited data on reinforcing steel.
radar yes no no limited Poor considering geometry of region
magnetic field yes no no no Poor
electrical time
domain
reflectometry
(ETDR)
yes no no yes
Yields limited data regarding deteriorated
concrete; nothing about reinforcing steel or
corrosion.
magneto-
elastic yes no no no none
CT yes no no no none
radiography yes no no no none Notes:
1. Destructive evaluation methods (e.g.: pulling concrete cores) require subsequent patching. 2. Suitability for long term monitoring indicates whether the method may deployed in a continuous monitoring scenario
3. Deployable in 2012 implies that there are commercially available systems appropriate for bridge applications on the market.
4. Utility refers to the question ―can the method be practically used in the assessment of J-bar deterioration today?‖
24
8. Mitigation and Repair of J-Bar Corrosion (Scope of Work Tasks 9 and 10)
Mitigation
Mitigation of the potential for J-bar corrosion amounts to essentially addressing the five details
described in Section 6.
Conditions 1, 2 and 3 should no longer be an issue for new construction in Pennsylvania.
Condition 1 was corrected in PennDOT DM4 in about 1995 by requiring epoxy-coated J-bars for
all abutment and wingwall stems and pier/bent columns. Condition 2 was corrected by Strike Off
Letters (SOL) 431-08-17 and 431-11-03 requiring waterproofing details to be used at stem-to-
footing construction joints for all abutments and retaining walls (431-08-17) and approach slab
joints (431-11-03). Waterproofing was not required for pier/bent columns. Recent SOL 431-11-
06, dated July 13, 2011, reiterates SOL 431-08-17 and adds pier/bent columns to those elements
requiring waterproofing. This most recent SOL is believed to represent best practice for new
construction.
Condition 3 must be considered a construction error and is therefore rare. Construction joints
should be roughened and free of latency when the upper concrete is placed.
Soil cover over a construction joint is certainly desirable but not always possible. The provision
of waterproofing as required by the SOLs noted should have a similar effect. It must be kept in
mind that the presence of soil works to limit the ingress of oxygen rather than moisture and
therefore works on a different principle than water proofing. Finally, good maintenance of bridge
drainage systems should help to mitigate condition 5.
Modeling corroded elements
The companion M&M report attempted to model deteriorated J-bar elements using a simple
plane-sections approach (equilibrium and strain compatibility in a section). This is believed to be
too simplistic to capture the full range of possible behavior of deteriorated connections although
may be used to establish reasonable upper and lower bounds of behavior. In modeling corroded
steel the following must be considered:
Bar Area. Modeling corroded steel bars may be effectively accomplished using the residual area
of uncorroded steel. Thus the area of a corroded bar is: Aremaining = Ab x (1 - section loss), where
section loss is a ratio.
Strength and Modulus. Corrosion does not affect the strength (Fy or Fu) or modulus (E) of the
remaining uncorroded steel area. The strength of the corrosion product is negligible.
Strain Capacity. If corroded steel is modeled as having a reduced area, the elongation capacity
of the steel is reduced (Apostolopoulos et al. 2006 and Almusallam 2001). There is no consensus
on this reduction, however with only 12% section loss, Almusallam describes bar behavior as
―brittle‖, implying rupture strains barely exceeding yield. This is potentially a very significant
effect, limiting the capacity of what is typically an under reinforced (in the context of concrete
design) section.
Bond. This is potentially the most significant effect of in situ corrosion, the most difficult to
model and the least understood. Additionally, the effect that corrosion has on bond may vary
significantly between bars and have the following effects:

25
Splitting and Spalling. Corrosion product (rust) is expansive and has a compressive strength on
the order of 1200 psi. When confined in concrete, the product generates radial forces and,
depending on bar spacing, cover depth and concrete quality, will eventually result in longitudinal
splitting. Once splitting occurs the bond capacity is essentially zero and the bar is ineffective.
Even prior to the splitting being fully developed, radial cracking reduces the bond capacity and
therefore the stress that may be carried by the bar.
Uniform versus non-uniform reduction in bond. As noted in the M&M report, corrosion will tend
to initiate and propagate on the ‗outside‘ face of a bar (that directed toward the concrete surface),
leaving the inner region intact. This results in a reduction in bond that is non-uniform around the
bar circumference. Uniform corrosion around the bar circumference may affect the bond stress
that can be developed since the corrosion layer is softer than the underlying steel. This latter
effect is analogous to the reduced bond capacity (reflected in increased development length
prescribed by AASHTO LRFD §5.11.2.1.2) of epoxy-coated reinforcing steel. The epoxy
coating is essentially a soft layer affecting bond - similar to corrosion product.
Poor bond results in bar slip and a lower stress being transmitted to the bar. The effects of bond
deterioration may be modeled in a three-dimensional model by applying a bond-slip relationship,
although there is no consensus on an appropriate relationship for corroded steel. In a two-
dimensional sectional analysis, the effects of slip may be approximated by reducing the steel
modulus although this only approximates a linear slip relationship.
Example of Effects of Modeling
There is no consensus for modeling in situ corroded reinforcing bars, nor is it possible at this
time to make recommendations for such modeling. Nonetheless, the following example identifies
the trends that such modeling may reveal and clearly shows that the approach promulgated in
Section 8 of the M&M report - simply reducing the area of steel reinforcement is inadequate.
The prototype section selected is based on the piers of S-4038 described in Appendix E. These
are three feet square having 12 #11 J-bars crossing the pier-footing interface. Concrete strength
is assumed to be 5 ksi. The length of the J-bar development into the pier is 78 inches whereas the
AASHTO-specified tension development length is 53 inches. Thus, in this case, the average
bond capacity could degrade approximately 32% before the bar will no longer be able to be fully
developed in tension. This additional embedment length was not necessarily typical of what has
been seen in bridge plan reviews. Table 5 shows the cases considered in the subsequent analyses.
All analyses were carried out using Program RESPONSE 2000 - a well-established plane-
sections analysis program.
Representative nominal (i.e.: all material resistance factors are unity) axial load – moment (P-M)
interaction surfaces are shown in Figure 6 for the cases reported in Table 5. In all cases,
reductions in axial load capacity are relatively small since the reinforcing steel (having a
reinforcing ratio of only 1.4%) has a relatively small contribution to axial strength in the column.
Greater effects are seen in the flexure dominated region (below the balance point) due to the bars
beginning to carry tension. Table 6 summarizes representative moment capacities predicted for
various levels of axial load.

26
Table 5. Cases considered in plane sections analysis.
Case section
loss ΣAb εr
bond
degradation fs max Es notes
% in2
% ksi ksi
A 0 18.72
0.10 0 fy = 60 29000 as built control
specimen
B 10 16.85
0.10 0 fy = 60 29000
bar area
reduction only;
per M&M report
Section 8
C 20 14.98
D 30 13.10
E 40 11.23
F 50 9.36
G 20 14.98
0.003 0 fy = 60 29000
bar area
reduction and
brittle rupture H 30 13.10
J 40 11.23
K 30 13.10
0.10
20 fy = 60 27000 minor slip
L 30 13.10 40 0.88fy = 53.0 25000 slip and fy cannot
be developed M 30 13.10 60 0.59fy = 35.3 23000
N 30 13.10 80 0.29fy = 17.7 21000
)ksi60(53
)ndegradatio bond1(78f
)ndegradatio bond1(f y
d
dprovided
maxs
Table 6. Selected P-M interaction results.
Axial Load, kips 0 1000 2000 3000 4000
0 0.15Agfc‘ 0.31Agfc‘ 0.46Agfc‘ 0.62Agfc‘
Fig
ure
6a
Case A: as built 1449 2475 3013 3004 2684
Case D: 30% bar loss 1042 2107 2711 2762 2467
Case H: 30% bar loss
and brittle 716 1690 2451 2769 2464
D/A 0.72 0.85 0.90 0.92 0.92
H/A 0.49 0.68 0.81 0.92 0.92
H/D 0.69 0.80 0.90 1.00 1.00
Fig
ure
6b
Case K: 30% bar loss;
20% bond loss 1047 2112 2721 2763 2474
Case L: 30% bar loss;
40% bond loss 928 2014 2636 2704 2415
Case M: 30% bar loss;
60% bond loss 637 1773 2414 2610 2268
Case N: 30% bar loss;
80% bond loss 347 1526 2226 2601 2119
K/D 1.00 1.00 1.00 1.00 1.00
L/D 0.89 0.96 0.97 0.98 0.98
M/D 0.61 0.84 0.89 0.94 0.92
N/D 0.33 0.72 0.82 0.94 0.86

27
0
1000
2000
3000
4000
5000
6000
7000
8000
0 500 1000 1500 2000 2500 3000 3500
Axi
al L
oad
, kip
s
Moment, kipft
A
E-D-C
J-H-G
0
1000
2000
3000
4000
5000
6000
7000
8000
0 500 1000 1500 2000 2500 3000 3500
Axi
al lo
ad, k
ips
Moment, kipft
A N-M-L-K
D (dotted)
a) effects of bar area reduction and brittleness. (b) effects of bond degradation.
Figure 6. Representative P-M interaction envelopes (curves are labeled left-to-right).
Bar Area Reduction. A reduction in bar area results in a comparable reduction in capacity when
no axial load is present (Figure 6a and D/A in Table 6). This reduction becomes less significant
as the axial load increases.
Accompanying Bar Brittleness. Accounting for the additional effect of bar brittleness, the
moment capacity falls further: approximately an additional 70% when no axial load is present.
As the behavior approaches the balance point, the effect of brittleness is mitigated since bar
strains remain very low in the compression-dominated region (Figure 6a and H/D in Table 6). As
can be seen in Table 6 (H/A), with 30% bar area reduction and accounting for brittleness, the
moment capacity when no axial load is present is 50% of the nominal as-built capacity.
Bond Degradation. In this simple analysis, provided that the effective embedment length
accounting for bond degradation continues to permit the bar to be developed, the resulting slip
has little effect on the P-M envelopes developed for the ultimate capacity of the section (Figure
6b and Table 6 Case K). When no axial load is present, the reduction in moment is proportional
to the portion of the yield strength that may be developed. This reduction becomes less
significant as the axial load increases. The interaction between bond degradation and brittleness
is likely negligible since, if slip occurs, the bar strain is reduced.
Clearly bar area reduction alone (dotted lines in Figure 6) does not capture some of the
anticipated effects of J-bar deterioration. Both bar brittleness and the potential for bond
degradation are significant additional effects.
9. Repair of Deteriorated J-bar Regions
Because of the structure geometry, there are few practical ways to repair deteriorated J-bar
regions. Section enlargement – essentially encasing a pier having deteriorated J-bars in a new
reinforced concrete pier is an option in cases where the pier must be maintained. Due to
geometry, section enlargement is not likely practical for stem walls.
For local deterioration of a few bars, the installation of exterior straps, duplicating the
deteriorated bars and anchored into the core concrete can be used to control interface gap
opening and transmit forces between footing and pier/stem wall. Such straps could be installed
on the pier face or in a ‗near-surface mounted‘ application; embedding the strap in the cover

28
concrete (which should not be anchored to in any event). Transmitting forces across the interface
without excessive distortion may be a challenge for large bars, requiring a stiffened angle at this
location. A conceptual design of a strap anchor is shown in Figure 7a.
A final option when the J-bar region is accessible requires removal of cover concrete, drilling a
new starter bar into the footing, reforming the cover concrete and providing external confinement
to the region. This approach is likely only practical for piers, since confinement will likely be
provided by an exterior jacket (fiber reinforced polymer (FRP) materials provide a reasonable
option in this regard). For stem walls, drilled and epoxied hairpin confining bars may be an
option, although these must be developed through the small thickness of the wall. A conceptual
design of a drilled dowel bar having external jacket confinement is shown in Figure 7b.
In either case, the cause and extant damage from existing corrosion should be mitigated as part
of any repair. To the author‘s knowledge, there are no known applications of J-bar region repair.
anchored
strap
stiff angle
exterior jacket
wrapped around
entire pier
drilled or
epoxieddowel bar
excavated
and replacedcover concrete
a) exterior strap anchor. b) drilled-in replacement dowel.
Figure 7. Schematic representation of J-bar repair methods.
10. Best Practices for PennDOT
For both new construction and structural rehabilitation, Strike Off Letter 431-11-06, dated July
13, 2011, represents the current best practice for mitigating potential deterioration of J-bars or
dowel bars near pier/stem wall-footing interfaces.
For existing construction, there is no ‗one size fits all‘ approach and each structure must be
addressed on a case by case basis. The contents of this report provide some degree of guidance
for identifying (Section 6) and mitigating (Section 8) potential deterioration scenarios. Sections
8.2 and 8.3 provide guidance with respect to modeling this deterioration. Finally, Section 8.4
provides some potential repair schemes although it is emphasized that each will be unique to the
structure to which it is applied.
The absence of J-bar or dowel bar corrosion found in this investigation may be an indication that
such corrosion is not endemic to the Pennsylvania bridge inventory. Nonetheless, the absence of
evidence is not evidence of absence. Further observation of future demolition projects with some
formal reporting (such as photographs) is warranted to expand the qualitative sample size.
29
11. References
AASHTO, 2009. AASHTO T260-97(2009) Standard Method of Test for Sampling and Testing
for Chloride Ion in Concrete and Concrete Raw Materials
ACI Committee 222, 2010. ACI 222R-01 Protection of Metals in Concrete Against Corrosion
(reapproved 2010), American Concrete Institute. 41 pp.
ASTM International, 2009. ASTM C876 - 09 Standard Test Method for Corrosion Potentials of
Uncoated Reinforcing Steel in Concrete, ASTM, West Conshohocken PA, 7 p.
Almusallam, (2001) Effect of degree of corrosion on the properties of reinforcing steel bars,
Construction and Building Materials, 15(8) 361-368.
Alonso, Andrade, Castellote and Castro, 2000. Chloride threshold values to depassivate
reinforcing bars embedded in a standardized OPC mortar, Cement and Concrete
Research 30(6) 1047-1065.
Apostolopoulos, Papadopoulos, and Pantelakis, (2006) Tensile behavior of corroded reinforcing
steel bars BSt 500s, Construction and Building Materials, 21(9) 782-789.
ASCE, 2006. ASCE 41-06 Seismic Rehabilitation of Existing Buildings.
ASTM International, 2009, ASTM E8-09 Standard Test Methods for Tension Testing of Metallic
Materials.
ASTM International, 2008, ASTM C1218-99(2008) Standard Test Method for Water-Soluble
Chloride in Mortar and Concrete.
ASTM International, 2004, ASTM C1152-04e1 Standard Test Method for Acid-Soluble Chloride
in Mortar and Concrete.
Atimay and Ferguson, 1974. Early Chloride Corrosion of Reinforced Concrete—A Test Report,
Materials Performance, 13(12) pp18-21.
Chamberlin, Irwin and Amsler, 1977. Waterproofing Membranes for Bridge Deck
Rehabilitation, Report No. FHWA-NY-77-59-1, 43 pp
Clear, 1976. Time-to-Corrosion of Reinforcing Steel in Concrete Slabs, V3: Performance after
830 Daily Salt Applications, Report No. FHWA-RD-76-70, 64 pp.
Fang, Lundgren, Plos and Gylltoft, 2006. Bond behaviour of corroded reinforcing steel bars in
concrete, Cement and Concrete Research, 36(10) 1931-1938.
Harries, Kassan, and Aktas, 2009. Repair Methods for Prestressed Concrete Bridges PennDOT
Report FHWA-PA-2009-008-PIT 006, 169 pp.
Li and Sagues, 2001. Metallurgical Effects on Chloride Ion Corrosion Threshold of Steel in
Concrete. Florida Department of Transportation Report WPI 0510806, 120 pp.
Modjeski and Masters Inc. (M&M), 2011, Investigation of Causes and Mitigation of J-Bars
Deterioration in Bridge Structures in Pennsylvania, Final Draft, August 2011.
Stratful, Jurkovich and Spellman, 1975. Corrosion Testing of Bridge Decks, Transportation
Research Record No.539, pp363-372.
Tuutti, 1982. Corrosion of Steel in Concrete, Swedish Cement and Concrete Research Institute,
Stockholm, 17pp.

30
APPENDIX A
TOTAL CHLORIDE LEVELS REQUIRED TO INITIATE CORROSION
A review of 24 studies reporting a total of 36 ranges for the chloride corrosion threshold is
presented. These studies are largely, although not entirely, summarized in Li and Sagues (2001),
Alonso et al. (2000) and ACI 222 (2010).

31
Table A1. Total chloride levels (%wt) required to initiate corrosion of reinforcing steel.
Specimen Admixture Environment
Total acid soluble Cl-
interval (%wt) Reference
Low High
steel in solution
laboratory
0.33
nir
Lewis 1962 Some Aspects of the Corrosion of Steel in Concrete, Proceedings of
First International Congress on Metallic Corrosion, London, 547-552.
mortar 2.42
Gouda and Halaka 1970 Corrosion and corrosion inhibition of reinforced steel,
British Corrosion Journal, 5 204-208.
mortar BFS 1.12
concrete added Cl 3.04
concrete BFS & Cl 1.01
concrete;
bars not cleaned of mill scale 0.60
bridge deck outdoor in CA 0.17 1.40 Stratful, Jurkovich and Spellman 1975 Corrosion Testing of Bridge Decks, Transportation Research Record No. 539, 363-372.
bridge deck outdoor 0.20 nir Clear 1976 Time-to-Corrosion of Reinforcing Steel in Concrete Slabs, V3:
Performance after 830 Daily Salt Applications, Report No. FHWA-RD-76-70, 64 pp.
bridge deck outdoor in NY 0.20 nir Chamberlin, Irwin and Amsler 1977 Waterproofing Membranes for Bridge Deck Rehabilitation, Research Report No. 52 (FHWA-NY-77-59-1), 43 pp.
concrete marine 0.40 nir Browne 1980Mechanisms of Corrosion of Steel in Concrete in Relation to Design,
Inspection, and Repair of Offshore and Coastal Structures, Performance of Concrete
in Marine Environment, ACI SP-65,169-204.
concrete laboratory 0.40 0.80 Locke and Siman 1980 Electrochemistry of Reinforcing Steel in Salt Contaminated
Concrete, Corrosion of Reinforcing Steel in Concrete ASTM STP 713, 3-16.
structure outdoor 0.20 1.50 Vassie 1984 Reinforcement Corrosion and the Durability of Concrete Bridges, Proceedings of ICE Part I, 76 713-723.
structure outdoor 1.80 2.20 Lukas 1985 Relationship Between Chloride Content in Concrete and Corrosion in
Untensioned Reinforcement in Austrian bridges and Concrete Road Surfacings,
Betonwerk und Fertigteil-Technik 51 (11) 730-734.
mortar laboratory 0.25 0.50 Elsener and Bohni 1986 Corrosion of Steel in Mortar Studied by Impedance
Measurements, Electrochemical Methods in Corrosion Research (Duprat, editor), 8
(55) 363-372.
mortar laboratory 0.40 nir Page, Short and Holden 1986 The Influence of Different Cements on Chloride-Induced Corrosion of Reinforcing Steel, Cement and Concrete Research 16 (1) 79-
86.
concrete added Cl various 0.10 0.19 Hope and Ip 1987 Chloride corrosion threshold in concrete, ACI Materials Journal 84 (4) 306-314.
concrete outdoor 0.32 1.90 Treadaway, Cox and Brown 1989 Durability of Corrosion Resisting Steels in
Concrete, Proceedings of ICE, Part 1, 86 305-331.
mortar laboratory
50 & 100%RH 0.60 1.40
Hansson and Sorensen 1990 The threshold concentration of chloride in concrete for initiation of reinforcement corrosion, Corrosion Rates of Steel in Concrete, ASTM
STP 1065, 3-16.
concrete laboratory 0.50
2.00
Schiessl and Raupach 1990 The Influence of Concrete Composition and
Microclimate on the Critical Chloride Content in Concrete, Corrosion of
Reinforcement in Concrete, Elsevier 49-58.
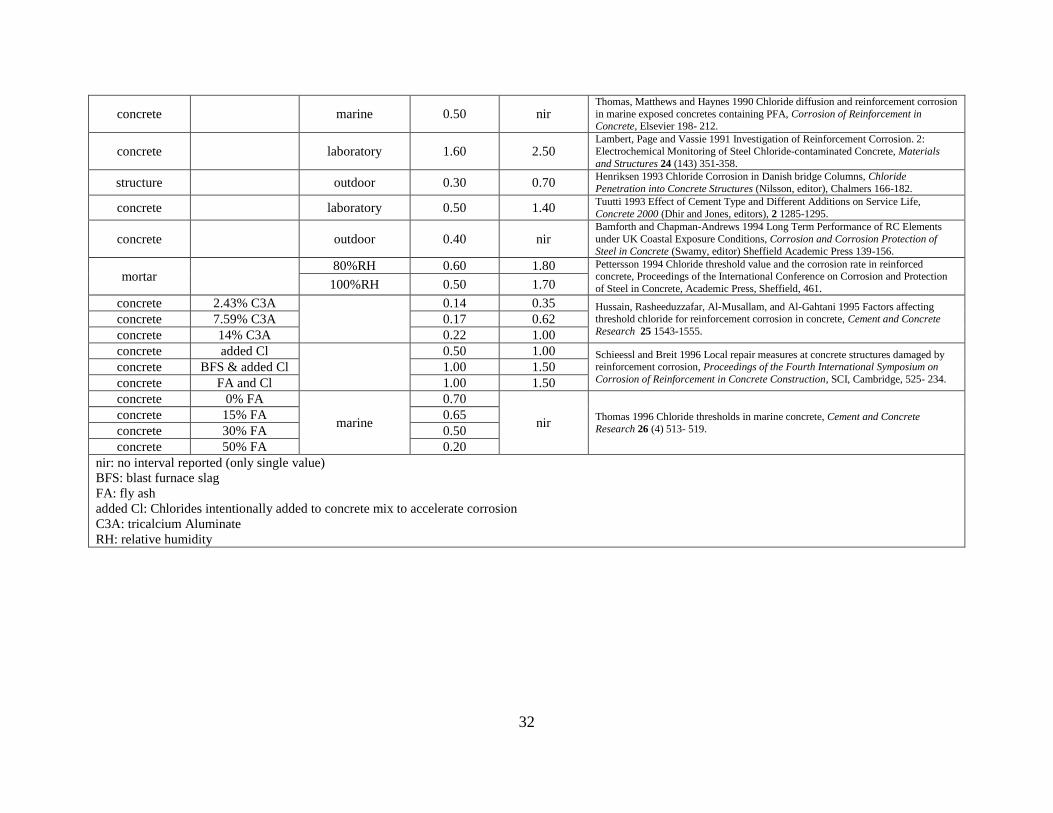
32
concrete marine 0.50 nir Thomas, Matthews and Haynes 1990 Chloride diffusion and reinforcement corrosion
in marine exposed concretes containing PFA, Corrosion of Reinforcement in Concrete, Elsevier 198- 212.
concrete laboratory 1.60 2.50 Lambert, Page and Vassie 1991 Investigation of Reinforcement Corrosion. 2:
Electrochemical Monitoring of Steel Chloride-contaminated Concrete, Materials
and Structures 24 (143) 351-358.
structure outdoor 0.30 0.70 Henriksen 1993 Chloride Corrosion in Danish bridge Columns, Chloride
Penetration into Concrete Structures (Nilsson, editor), Chalmers 166-182.
concrete laboratory 0.50 1.40 Tuutti 1993 Effect of Cement Type and Different Additions on Service Life,
Concrete 2000 (Dhir and Jones, editors), 2 1285-1295.
concrete outdoor 0.40 nir Bamforth and Chapman-Andrews 1994 Long Term Performance of RC Elements
under UK Coastal Exposure Conditions, Corrosion and Corrosion Protection of
Steel in Concrete (Swamy, editor) Sheffield Academic Press 139-156.
mortar 80%RH 0.60 1.80 Pettersson 1994 Chloride threshold value and the corrosion rate in reinforced
concrete, Proceedings of the International Conference on Corrosion and Protection
of Steel in Concrete, Academic Press, Sheffield, 461. 100%RH 0.50 1.70
concrete 2.43% C3A
0.14 0.35 Hussain, Rasheeduzzafar, Al-Musallam, and Al-Gahtani 1995 Factors affecting threshold chloride for reinforcement corrosion in concrete, Cement and Concrete
Research 25 1543-1555. concrete 7.59% C3A 0.17 0.62
concrete 14% C3A 0.22 1.00
concrete added Cl
0.50 1.00 Schieessl and Breit 1996 Local repair measures at concrete structures damaged by reinforcement corrosion, Proceedings of the Fourth International Symposium on
Corrosion of Reinforcement in Concrete Construction, SCI, Cambridge, 525- 234. concrete BFS & added Cl 1.00 1.50
concrete FA and Cl 1.00 1.50
concrete 0% FA
marine
0.70
nir Thomas 1996 Chloride thresholds in marine concrete, Cement and Concrete
Research 26 (4) 513- 519.
concrete 15% FA 0.65
concrete 30% FA 0.50
concrete 50% FA 0.20
nir: no interval reported (only single value)
BFS: blast furnace slag
FA: fly ash
added Cl: Chlorides intentionally added to concrete mix to accelerate corrosion
C3A: tricalcium Aluminate
RH: relative humidity

33
Bridge Inspection Reports
Appendix Bridge Feature
B S7648 Forest Grove over I-79
C S7141 SR528 over SR422
D S9469 Triboro Ramp
E S4038 SR3086 over SR22
F S2888 I-90 over Six Mile Creek
G Summary of Bridges Sampled and Additional
Bridges Considered and Rejected for Study

34
APPENDIX B: S-7648A – Forest Grove Rd. over I-79
(BMS: 02 3074 0120 0000) DOCUMENT REVIEW The following documents provided by PennDOT D11-0 were reviewed.
1. Drawings of bridge dated 02/20/1969 (19 sheets) 2. Inspection Report dated 08/28/2006 prepared by HDR (101 pages)
Location of Structure Forest Grove Road over I-79 and Moon Run, Kennedy Township, Allegheny County (40o 28’ 48.3” N and 80o 8’ 19.1” W) General Description of Structure The bridge, built in 1969 is an eight span prestressed concrete structure having a total length of 541’. The spans are (from West to East (stationing direction)) 62’-8”, 60’-10”, 65’-6”, 80’-0”, 80’-0”, 80’-0”, 65’-6” and 46’-6”. The bridge is 40’-4” out-to-out and 30’-9” curb-to-curb with a 6’-4” sidewalk on the South side. A reinforced concrete deck with a 3” bituminous wearing surface carries 2 lanes of bi-directional traffic. The superstructure consists of five 48” x 48” prestressed concrete spread box girders in spans 1-7 and four 48” x 39” spread box girders in span 8. The substructure consists of seven reinforced concrete hammerhead piers and two reinforcement concrete stub-type abutments. The bridge has undergone a number of repairs, although none affecting the pier stem-footing region. All pier caps have transverse post-tensioning rods installed. Overall views of bridge are shown in Figure 1. Pier geometry is shown in Figure 2. Original Design The design basis is reported as the 1961 AASHTO Standard Specifications and the 1961 through 1964 Interim Specifications. Design live load is H20-44. Extant Condition Ratings reported in 2006 inspection report are summarized in Table 1.
Table B1 Ratings from 2006 inspection.
safety
features wearing surface
deck superstructure substructure sufficiency
rating
2006 3 7 5 5 4 41.20
2004 4 4 4 5 4 n.a.
No ‘critical’ or ‘immediate attention’ issues identified associated with pier stem, abutments or footings. Minor cracking, spalls and scaling noted on stem walls and cheek walls of both abutments (see Figure 3). The base of the pier stem and footing are not visible except at Pier 5 where: Lateral bank scour has exposed a 2’ x 20’ portion the footing. The visible portion of the footing is in good condition with no significant defects. No undermine is present. ADT on bridge = 6257 (based on replacement project) ADT on I-79 under bridge = 47038 (based on project about 1 mile to north of bridge)

35
Demolition The bridge is scheduled to close for demolition February 16, 2009. Piers 3, 4 and 5 will not be completely demolished and therefore cannot be considered in this study. J-Bar environment and details Table 2 provides a description of each pier stem-footing interface location. Table 3 provides the vertical and horizontal clearances to the I-79 carriageways and Moon Run. Table 4 summarizes the pier stem-footing interface details. Clear cover is 2” resulting in the cover to the #11 dowel bars being approximately 4”. Reinforcing steel grade is reported to be intermediate or hard grade rail steel, designed for fs = 20,000 psi and detailed according to ACI code1. Based on this designation and the 1969 year of construction, it is likely that the reinforcing steel was A616 or A16 rail steel. In either case, the minimum yield strength is fy = 50 ksi and the minimum tensile strength is fu = 80 ksi. Based on the 1969 construction date it is possible that A615 billet steel may have been substituted (fy = 60 ksi, fu = 90 ksi).
Table B2 Pier stem-footing interface locations.
top of footing elevation (ft)
horizontal clearance to I-79
approximate depth of top of footing below finished grade
Forest Drive at start of bridge
968.08 - -
Forest Drive at end of bridge
965.06 - -
Abutment 1 963.50 - 4’-7”
Pier 1 929.25 - 4’-6”
Pier 2 909.25 4’0” 4’-6”
Pier 31 900.00 23’-6” 6’-8”
Pier 41 885.00 - 15’-2”
Pier 51 894.00 - 2’-11”
Pier 6 938.00 23’6” 2’-0”
Pier 7 938.00 14’-3” 2’-0”
Abutment 2 957.00 - 8’-1” 1 Piers 3, 4 and 5 will not be demolished and therefore are not available for study.
1 It is noted that there is no such designation as ‘intermediate rail’ steel only ‘hard’.

36
Table B3 Clearances of I-79 and Moon Run.
horizontal clearance vertical
clearance
right lane left lane
I-79 SB 4’-0” (Pier 2)
(see Figure 5a) 23’-6” (Pier 3) 46’-10”
I-79 NB 14’3” (Pier 7) 23’-6” (Pier 6) 17’-10”
Moon Run1 ≈51’ (Pier 4) ≈25’ (Pier 5)2 ≈65’ 1 horizontal clearance for Moon Run measured from channel centerline 2 lateral bank scour exposing Pier 5 footing is reported.
Table B4 Pier stem-footing interface details.
pier stem dimension
footing dimension
interface steel concrete type at
interface
Abutment 1 stem wall 1’-9” wide 5’-9” wide 27 - #5 dowels @ 18” FF 40 - #5 dowels @ 12” RF
Class B Abutment 1 wing wall 1’-3” wide 6’-0” wide
8 - #6 J-bars @ 12” FF 8 - #6 J-bars @ 12” RF
Pier 1 9’-0” x 4’-0” 19’-0” x 14’-0” 42 - #11 dowels
Class A (Piers) Class B (Footings)
Pier 2 9’-0” x 4’-0” 19’-0” x 14’-0” 42 - #11 dowels
Pier 31 10’-0” x 4’-0” 18’-0” x 21’-0” 44 - #11 dowels
Pier 41 10’-0” x 4’-0” 18’-0” x 21’-0” 56 - #11 dowels
Pier 51 10’-0” x 4’-0” 18’-0” x 21’-0” 44 - #11 dowels
Pier 6 9’-0” x 4’-0” 18’-0” x 21’-0” 34 - #11 dowels
Pier 7 9’-0” x 3’-6” 18’-0” x 12’-0” 26 - #11 J-bars
Abutment 2 stem wall 1’-6” wide 5’-9” wide 28 - #5 J-bars @ 18” EF Class B
Abutment 2 wing wall 1’-3” wide 6’-0” wide 4 - #5 J-bars @ 12” FF 6 - #6 J-bars @ 12” RF
1 Piers 3, 4 and 5 will not be demolished and therefore are not available for study.
Deck drainage is provided by scuppers connecting to 8” pipes directed down the center of the long side of each pier (see Figures 2 and 4). The drain pipes terminate approximately 1’ above a splash pad at Piers 3, 4, 5 and 6 (Figures 4b and 4c). The pipes at Piers 1, 2 and 7 are reported to be connected to roadway drainage (Figure 4a). Scuppers at Piers 2, 4 and 7 are reported as being clogged (2006). SITE VISIT The PITT team visited the bridge on January 28, 2009 (see Figures 1 through 5). The bridge was open to traffic. There had been snow overnight and the temperature was approximately 28o in which case water was coming off the bridge. This facilitated a thorough inspection of drainage issues. The primary conclusion of the visit was that the 8/28/06 inspection report was representative of the current state of the bridge, particularly with respect to the footings and pier bases. The exposed region of the footing at pier 5 was not noted from the bank of Moon Run. The extent of Pier stem spalling has increased significantly since 8/28/06. This can be seen in a comparison of Figure 2c and 2b (below) and Photos 19 and 35, respectively, in the 8/28/06 inspection report.

37
J-BAR SAMPLING Based on the inspection, review and site availability, the following J-bar sampling was proposed:
Pier 2 – closest to roadway; most subject to roadway and embankment drainage and salt spray
Pier 7 – shallowest footing and subject to roadway and embankment drainage; only pier with actual J-bars (others are straight).
Abutment 2 – ‘downhill’ abutment; more evidence of seepage and damage to stub wall. Figure 6 shows the sampling carried out on Pier 2 which was conducted the week of April 20, 2009. Figure 6b shows one of the core locations and surrounding #11 starter bars and sliced pier reinforcement. There is no evidence of deterioration at this interface. Figure 7a shows the sampling carried out on Pier 7 which was conducted May 29, 2009. There is no evidence of deterioration at this location. Figure 7b shows the sampling carried out on Abutment 2 which was conducted May 29, 2009. There is no evidence of deterioration at this location. The following reinforcing bar material properties were obtained. Visual inspection of all recovered J-bars indicates no deterioration (Figure 8).
Table B5 Reinforcing steel properties.
location Abutment 2 Pier 2 Pier 7
Bar size #5 #11 #11
test condition straight coupon1 coupon1
observed corrosion minor surface none none
samples tested, n 3 2 2
fy (average) ksi 65.1 72.6 55.6
fu(average) ksi 115.3 135.0 91.6
εu (average) 0.142 0.143 0.304
Ecalc2 (average) ksi 28915 27666 29416
year built 1969 1969 1969
likely grade3 A615 Grade 60 A615 Grade 60 A615 Grade 60
Note 4 5
1 standard ¾” diameter coupon machined from bar 2 Ecalc based on secant modulus at 30 ksi 3 FEMA 356 Table 6-2 4 based on fu/fy, it is possible that this steel is Grade 75 5 despite the low yield, it is unlikely that this is Grade 40 – large bars (#11), occasionally test lower than their grade.
CHLORIDE TESTING Chloride content obtained from samples located in the footings (Figures 6 and 7) are given in Table 6
Table B6 Chloride content (%).
depth into footing interface
Abutment 2 Pier 2 Pier 7
0.28 0.28 0.30
1.00 in. - 0.30 -
1.25 in - 0.27 0.30
1.50 in. - 0.29 -
2.25 in. 0.17 - 0.29
4.00 in. 0.20 - -
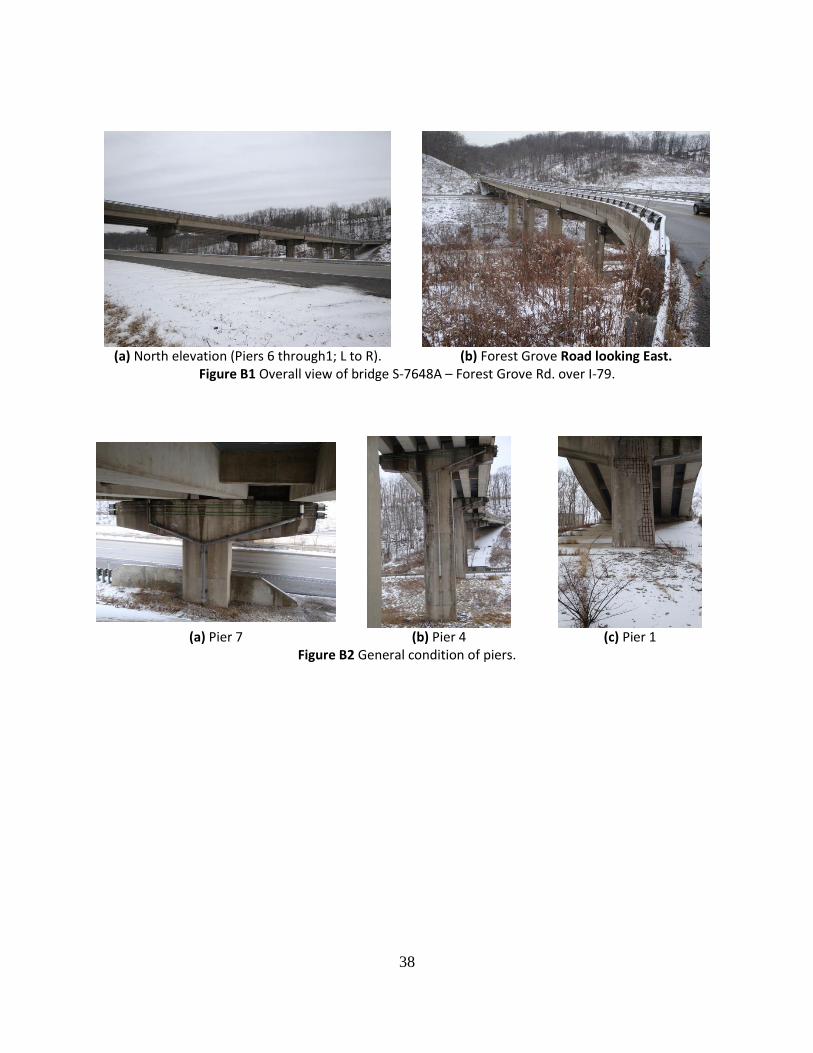
38
(a) North elevation (Piers 6 through1; L to R). (b) Forest Grove Road looking East.
Figure B1 Overall view of bridge S-7648A – Forest Grove Rd. over I-79.
(a) Pier 7 (b) Pier 4 (c) Pier 1
Figure B2 General condition of piers.
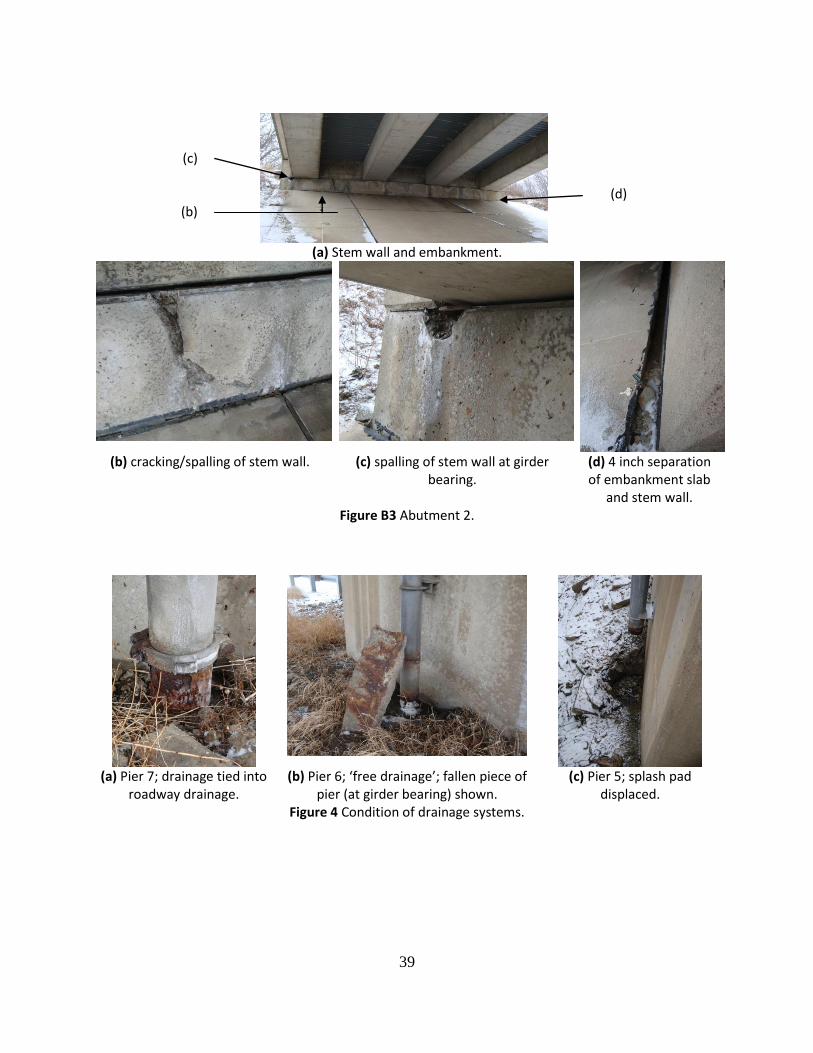
39
(c)
(b)
(d)
(a) Stem wall and embankment.
(b) cracking/spalling of stem wall. (c) spalling of stem wall at girder bearing.
(d) 4 inch separation of embankment slab
and stem wall. Figure B3 Abutment 2.
(a) Pier 7; drainage tied into
roadway drainage. (b) Pier 6; ‘free drainage’; fallen piece of
pier (at girder bearing) shown. (c) Pier 5; splash pad
displaced. Figure 4 Condition of drainage systems.
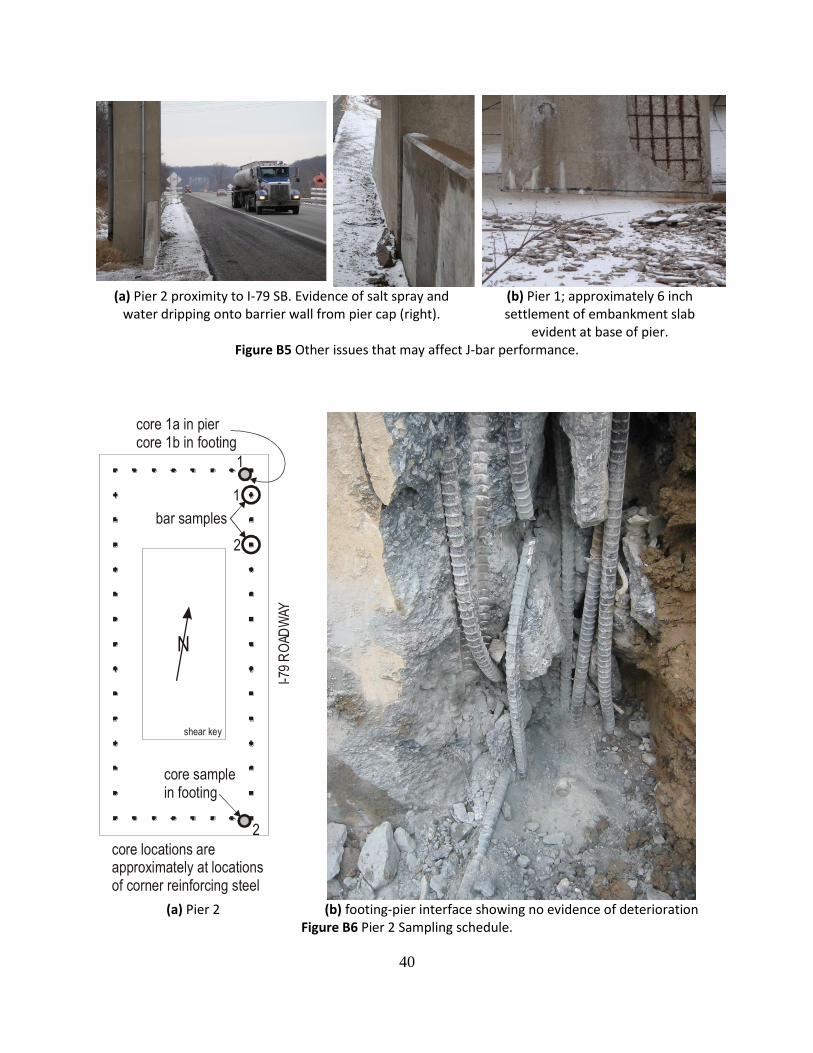
40
(a) Pier 2 proximity to I-79 SB. Evidence of salt spray and
water dripping onto barrier wall from pier cap (right). (b) Pier 1; approximately 6 inch settlement of embankment slab
evident at base of pier. Figure B5 Other issues that may affect J-bar performance.
shear key
I-79
RO
ADW
AY
N
bar samples
core samplein footing
1
2
1
2
core 1a in piercore 1b in footing
core locations areapproximately at locationsof corner reinforcing steel
(a) Pier 2 (b) footing-pier interface showing no evidence of deterioration Figure B6 Pier 2 Sampling schedule.
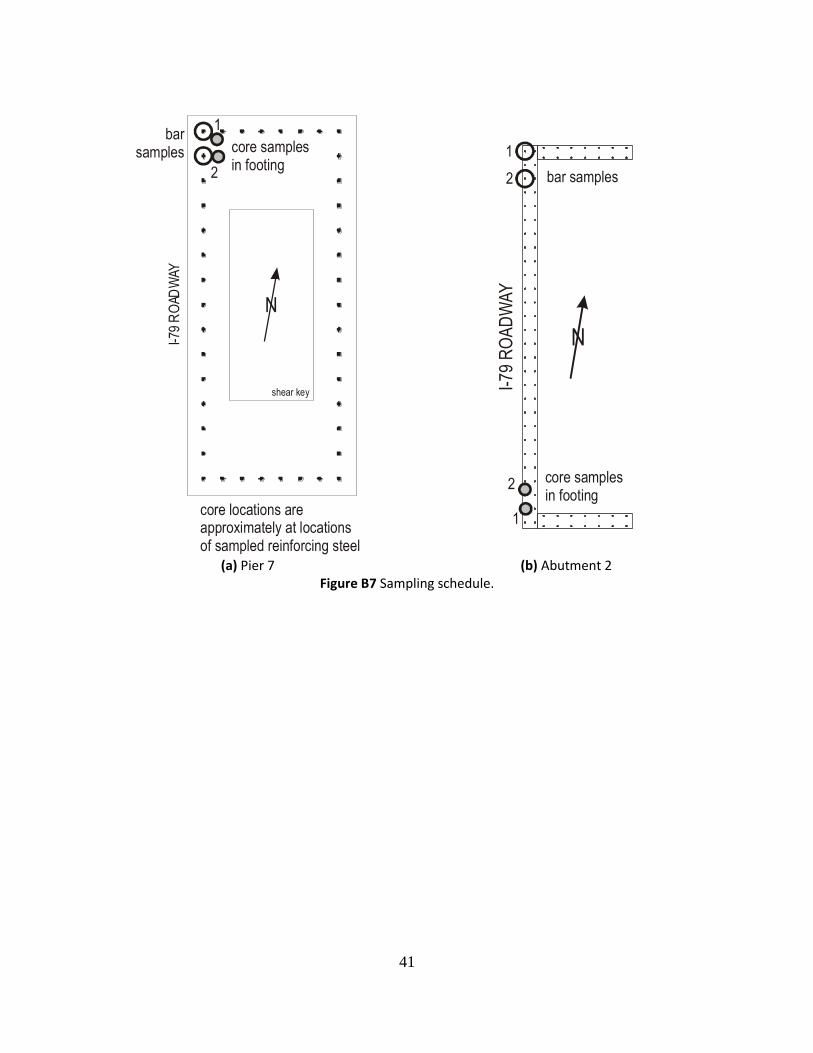
41
shear key
I-79
RO
ADW
AY
N
barsamples
1
2
core locations areapproximately at locationsof sampled reinforcing steel
core samplesin footing
I-79
RO
AD
WA
Y
N
bar samples
core samplesin footing
1
2
1
2
(a) Pier 7 (b) Abutment 2 Figure B7 Sampling schedule.

42
(a) Pier 2b #11 dowel bars
(b) Pier 7 #11 J-bars
(c) Abutment 2 #5 dowel bars
minor surface corrosion evident although this may have been affected during demolition process Figure B8 Recovered dowel bars.
(extension into footing to right of arrow; extension into pier/stem wall to left)
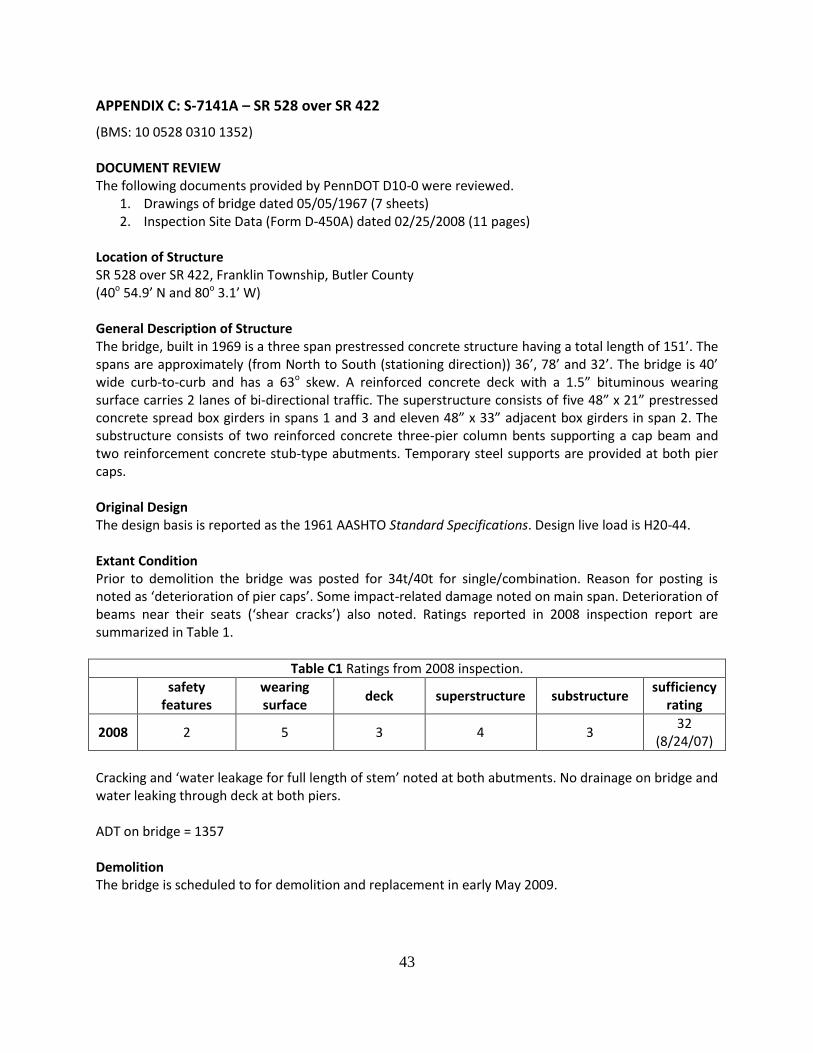
43
APPENDIX C: S-7141A – SR 528 over SR 422
(BMS: 10 0528 0310 1352) DOCUMENT REVIEW The following documents provided by PennDOT D10-0 were reviewed.
1. Drawings of bridge dated 05/05/1967 (7 sheets) 2. Inspection Site Data (Form D-450A) dated 02/25/2008 (11 pages)
Location of Structure SR 528 over SR 422, Franklin Township, Butler County (40o 54.9’ N and 80o 3.1’ W) General Description of Structure The bridge, built in 1969 is a three span prestressed concrete structure having a total length of 151’. The spans are approximately (from North to South (stationing direction)) 36’, 78’ and 32’. The bridge is 40’ wide curb-to-curb and has a 63o skew. A reinforced concrete deck with a 1.5” bituminous wearing surface carries 2 lanes of bi-directional traffic. The superstructure consists of five 48” x 21” prestressed concrete spread box girders in spans 1 and 3 and eleven 48” x 33” adjacent box girders in span 2. The substructure consists of two reinforced concrete three-pier column bents supporting a cap beam and two reinforcement concrete stub-type abutments. Temporary steel supports are provided at both pier caps. Original Design The design basis is reported as the 1961 AASHTO Standard Specifications. Design live load is H20-44. Extant Condition Prior to demolition the bridge was posted for 34t/40t for single/combination. Reason for posting is noted as ‘deterioration of pier caps’. Some impact-related damage noted on main span. Deterioration of beams near their seats (‘shear cracks’) also noted. Ratings reported in 2008 inspection report are summarized in Table 1.
Table C1 Ratings from 2008 inspection.
safety
features wearing surface
deck superstructure substructure sufficiency
rating
2008 2 5 3 4 3 32
(8/24/07)
Cracking and ‘water leakage for full length of stem’ noted at both abutments. No drainage on bridge and water leaking through deck at both piers. ADT on bridge = 1357 Demolition The bridge is scheduled to for demolition and replacement in early May 2009.
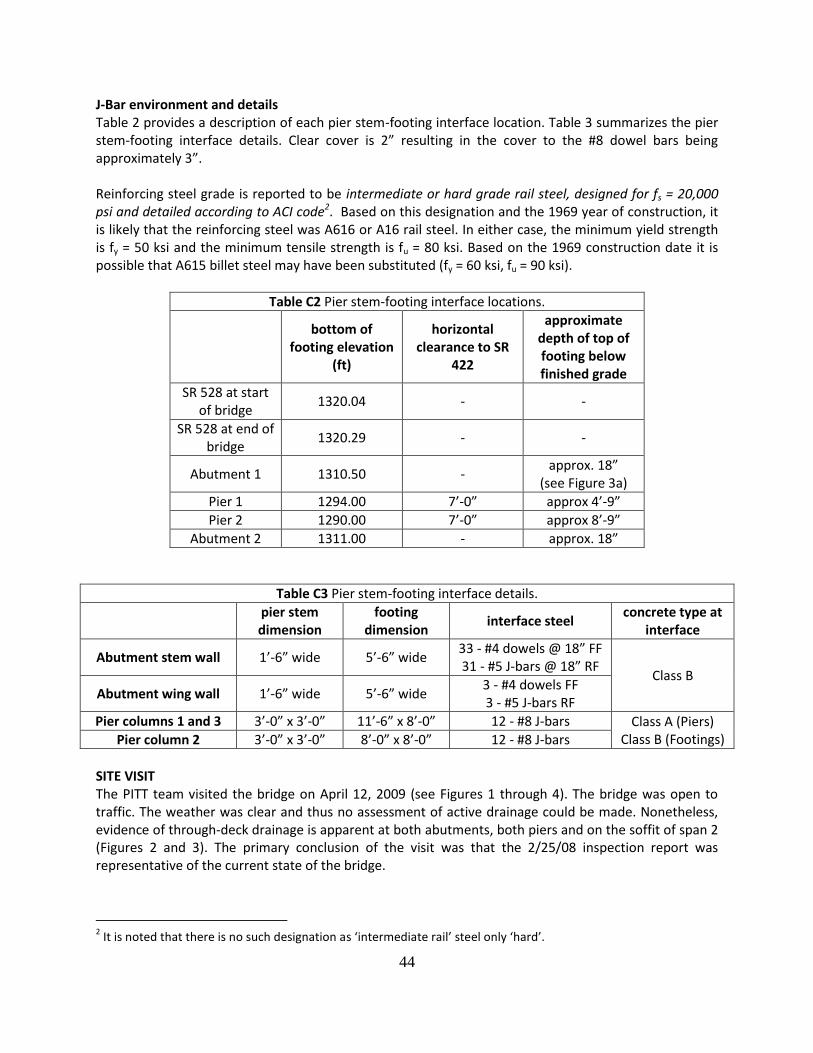
44
J-Bar environment and details Table 2 provides a description of each pier stem-footing interface location. Table 3 summarizes the pier stem-footing interface details. Clear cover is 2” resulting in the cover to the #8 dowel bars being approximately 3”. Reinforcing steel grade is reported to be intermediate or hard grade rail steel, designed for fs = 20,000 psi and detailed according to ACI code2. Based on this designation and the 1969 year of construction, it is likely that the reinforcing steel was A616 or A16 rail steel. In either case, the minimum yield strength is fy = 50 ksi and the minimum tensile strength is fu = 80 ksi. Based on the 1969 construction date it is possible that A615 billet steel may have been substituted (fy = 60 ksi, fu = 90 ksi).
Table C2 Pier stem-footing interface locations.
bottom of
footing elevation (ft)
horizontal clearance to SR
422
approximate depth of top of footing below finished grade
SR 528 at start of bridge
1320.04 - -
SR 528 at end of bridge
1320.29 - -
Abutment 1 1310.50 - approx. 18”
(see Figure 3a)
Pier 1 1294.00 7’-0” approx 4’-9”
Pier 2 1290.00 7’-0” approx 8’-9”
Abutment 2 1311.00 - approx. 18”
Table C3 Pier stem-footing interface details.
pier stem dimension
footing dimension
interface steel concrete type at
interface
Abutment stem wall 1’-6” wide 5’-6” wide 33 - #4 dowels @ 18” FF 31 - #5 J-bars @ 18” RF
Class B Abutment wing wall 1’-6” wide 5’-6” wide
3 - #4 dowels FF 3 - #5 J-bars RF
Pier columns 1 and 3 3’-0” x 3’-0” 11’-6” x 8’-0” 12 - #8 J-bars Class A (Piers) Class B (Footings) Pier column 2 3’-0” x 3’-0” 8’-0” x 8’-0” 12 - #8 J-bars
SITE VISIT The PITT team visited the bridge on April 12, 2009 (see Figures 1 through 4). The bridge was open to traffic. The weather was clear and thus no assessment of active drainage could be made. Nonetheless, evidence of through-deck drainage is apparent at both abutments, both piers and on the soffit of span 2 (Figures 2 and 3). The primary conclusion of the visit was that the 2/25/08 inspection report was representative of the current state of the bridge.
2 It is noted that there is no such designation as ‘intermediate rail’ steel only ‘hard’.

45
Extensive damage to both pier cap beams (Figure 2) appears to result from a combination of inferior concrete materials and through-deck drainage. The condition of both faces of the piers is similar suggesting that salt spray from passing trucks is not a significant stressor. Considering the extent of damage to the beam, the condition of the pier columns near their base (where they pass through the embankment slab) is generally good. Like the inspection report, little was revealed as to the condition of the footings although excavation had begun at the East end of the North abutment (Figure 3a). There was no obvious deterioration at this location and concrete in both the stem wall and exposed footing appeared sound and had no evidence of distress or staining. J-BAR SAMPLING Based on the inspection, review and site availability, J-bar sampling was carried out on Abutment 2 as indicated in Figure 5. In the end, abutments and footings of the original bridge were not demolished; D10-0 arranged for the corners of Abutment 2 to be made available for this study. Specimens were removed from the East end of Abutment 2 as shown in Figure 5 (also shown in Figure 3b). Visual inspection of all recovered J-bars indicates no deterioration as shown in Figure 7. Although pier footings were not removed, the #8 J-bars were exposed during demolition (Figure 6). These bars were showed no evidence of corrosion despite the condition of the piers themselves. The following material properties were obtained from the #4 and #5 bars recovered from the abutment.
Table C4 Reinforcing steel properties.
location Abutment 2 Abutment 2
Bar size #4 #5
test condition straight straight
observed corrosion none none
samples tested, n 2 1
fy (average) ksi 50.1 45.4
fu(average) ksi 78.2 71.0
εu (average) 0.218 0.208
Ecalc1 (average) ksi 22681 37111
year built 1967 1967
likely grade2 A615 Grade 40 A615 Grade 40 1 Ecalc based on secant modulus at 30 ksi 2 FEMA 356 Table 6-2
CHLORIDE TESTING Chloride content obtained from samples located in the footing at the stem wall interface indicated a chloride content of 0.17%. At a location 1.5 inches into the footing this value was 0.30%.

46
Figure C1 Overall view of bridge S-7141A – SR 528 over SR 422. East elevation looking South.
(a) Pier 1 (South face) (b) Pier 2 (North face)
Figure C2 General condition of piers showing steel supports.
(a) North stem wall and embankment showing excavated
footing. (b) 3 inch separation of
embankment slab and South stem wall.
Figure C3 General condition of abutments.
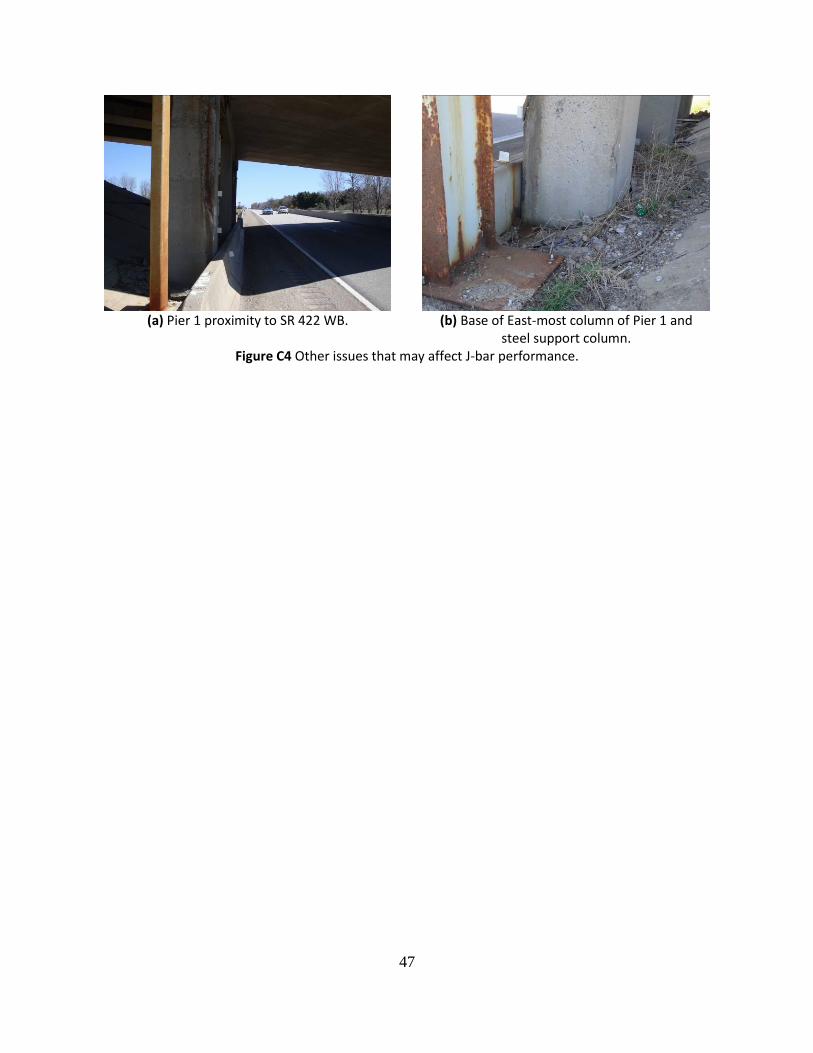
47
(a) Pier 1 proximity to SR 422 WB. (b) Base of East-most column of Pier 1 and
steel support column. Figure C4 Other issues that may affect J-bar performance.

48
region removed
47”
52”
58”
3”
9”
5”
spliced bar (photo)
PLANSECTION
(a) plan of specimen extraction from East corner of [South] Abutment 2.
(b) lap splice of J-bar and stem wall bar in situ (c) footing-stem wall interface showing specimen
locations. Figure C5 Location of specimens.
footing
rear face of stem wall

49
(a) exposed J-bars from [South] Pier 2. (b) exposed J-bars of East-most pier column
Figure C6 Pier 2 (demolished) J-bars showing no evidence of corrosion.
Figure C7 #5 J-bar (top) #4 dowel bar (bottom).
(extension into footing to right of arrow; extension into stem wall to left)
50
APPENDIX D: S-9469 – Triborough Expressway Ramp S - Abutment S
(BMS: 02 2083 0010 0075) DOCUMENT REVIEW The following documents provided by PennDOT D11-0 were reviewed.
1. Drawings of Abutment S and General Notes (sheet 10) dated 05/06/1970 (3 sheets) 2. Inspection Report dated 04/18/2008 prepared by SAI Consultants (251 pages); pages 9 and 10
(and references) relate to Abutment S Location of Structure SR 2083 Ramp ‘S’ Braddock Avenue Spur over Main Street and Norfolk Southern and Union Railroads, East Pittsburgh Borough, Allegheny County (40o 23’ 48” N and 75o 50’ 18” W) General Description of Structure The bridge, built in 1974 is a ten span steel superstructure. Only Abutment S is considered in this study. This abutment is a 67’-8” wide reinforced concrete stub abutment supporting 8 steel girders. Original Design The design basis is reported as the 1965 AASHTO Standard Specifications and the 1966-67 Interim Specifications. Design live load is H20-44. Extant Condition Ratings reported in 2008 inspection report are summarized in Table 1. A substructure rating of 4 is given to Abutment S. The other piers range from ‘poor’ to ‘good’ condition.
Table D1 Ratings from 2008 inspection.
safety
features wearing surface
deck superstructure substructure sufficiency
rating
2008 3-6 6 5 3 4 49.20
(08/24/07)
Description of Abutment S Condition (from 2008 inspection report) Backwall: [Abutment S] is apparently moving northward causing the backwall corbel to jam against the bridge deck and superstructure pushing Spans 1 through 4 northward.
The backwall has a number of vertical, diagonal and horizontal cracks ranging from hairline to 3/8” in width [see Figure 1]. A full depth horizontal crack is present along the backwall-to-stem joint between girder G7 and the west end of the stem separating the backwall from the stem. Large concrete spalls are present at the joints between the backwall and wingwalls with the movement of the abutment separating and opening the joints.
Numerous patched and unpatched concrete spalls are present on the top surface of the backwall in the roadway. …
Stem: The abutment has large spalls with exposed and corroded reinforcing and wide separated joints at the west and east ends of the stem. The joints appear to have separated the full depth of the stem with the stem and wingwalls moving independently of each other.
The bridge barriers atop the wingwalls are rotating outward from the bridge. …
51
Footing: Not visible. …
Embankment-Slope Wall: Roadway runoff draining through the spalled and separated joint at the west end of the abutment has caused and erosion ditch on the earthen embankment slope. Figure 2 provides the inspection notes for Abutment S. ADT on bridge = 8076 Demolition The demolition of Abutment S is scheduled for the middle of April 2009. J-Bar environment and details Table 2 provides a description of the stub wall-footing interface location of Abutment S. Table 3 summarizes the stub wall-footing interface details. Clear cover is 2”. Reinforcing steel grade is reported to be intermediate or hard grade rail3 or axle steel or billet steel, detailed according to the 1965 ACI code. Based on this designation and the 1974 year of construction, it is likely that the reinforcing steel was A615 billet steel. In this case, and again based on the 1974 construction date, it is equally likely that the steel is Grade 40 (fy = 40 ksi, fu = 70 ksi) or Grade 60 (fy = 60 ksi, fu = 90 ksi).
Table D2 Pier stem-footing interface locations.
top of footing elevation (ft)
approximate depth of top of footing below finished grade
South North South North
SR2083 at Abutment S 776.65 773.50 - -
Abutment S 764.63 762.13 3’-1” 2’-6”
Table D3 Abutment stem-footing interface details.
pier stem dimension
footing dimension
interface steel concrete type at
interface
Abutment S stem wall 3’-7” wide 7’-6” wide 65 - #5 dowels @ 18” FF 41 - #5 J-bars @ 18” RF
38 - #5 45o J-bars @ 18” RF
Class B stub wall Class B footing
Abutment S has a significant South-to-North cross slope of about 5%. Additionally, Abutment S is the ‘downhill’ abutment. Whatever deck drainage intended at the abutment is no longer active. Based on observations (2008 inspection report), most drainage at this location is affected through the open gap between the wingwall and backwall (Figure 3a). This is evidenced by a significant erosion ditch (Figure 3b).
3 It is noted that there is no such designation as ‘intermediate rail’ steel only ‘hard’.
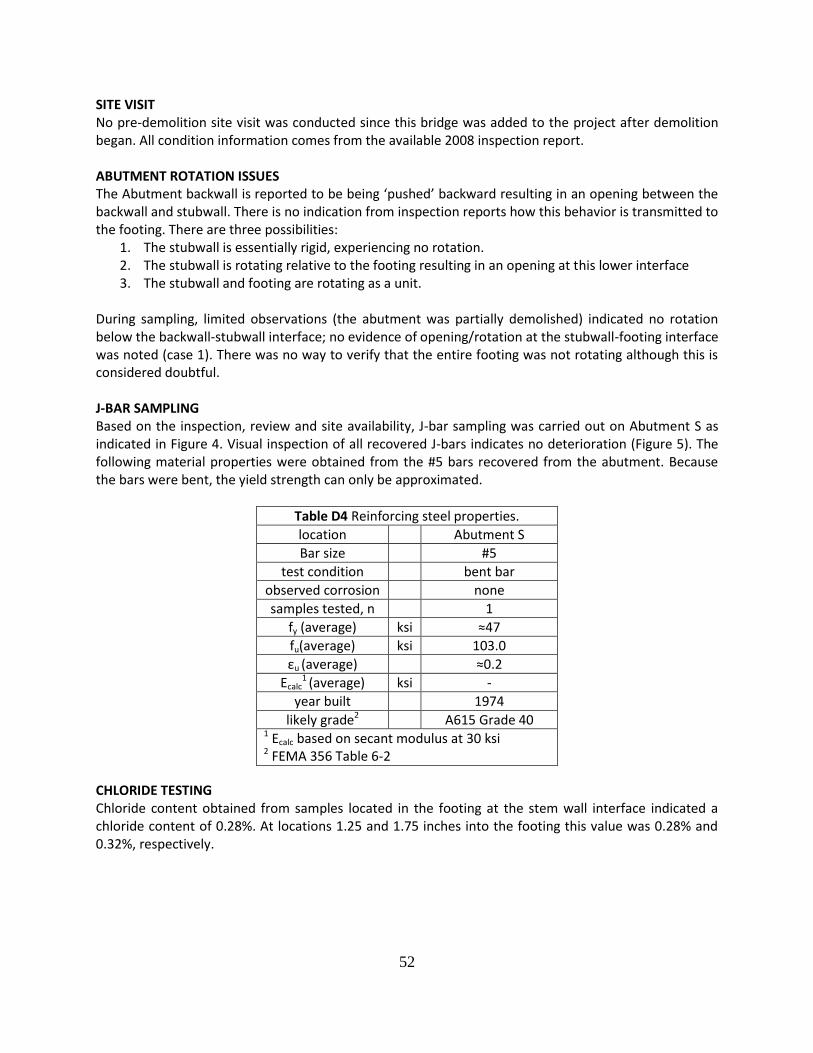
52
SITE VISIT No pre-demolition site visit was conducted since this bridge was added to the project after demolition began. All condition information comes from the available 2008 inspection report. ABUTMENT ROTATION ISSUES The Abutment backwall is reported to be being ‘pushed’ backward resulting in an opening between the backwall and stubwall. There is no indication from inspection reports how this behavior is transmitted to the footing. There are three possibilities:
1. The stubwall is essentially rigid, experiencing no rotation. 2. The stubwall is rotating relative to the footing resulting in an opening at this lower interface 3. The stubwall and footing are rotating as a unit.
During sampling, limited observations (the abutment was partially demolished) indicated no rotation below the backwall-stubwall interface; no evidence of opening/rotation at the stubwall-footing interface was noted (case 1). There was no way to verify that the entire footing was not rotating although this is considered doubtful. J-BAR SAMPLING Based on the inspection, review and site availability, J-bar sampling was carried out on Abutment S as indicated in Figure 4. Visual inspection of all recovered J-bars indicates no deterioration (Figure 5). The following material properties were obtained from the #5 bars recovered from the abutment. Because the bars were bent, the yield strength can only be approximated.
Table D4 Reinforcing steel properties.
location Abutment S
Bar size #5
test condition bent bar
observed corrosion none
samples tested, n 1
fy (average) ksi ≈47
fu(average) ksi 103.0
εu (average) ≈0.2
Ecalc1 (average) ksi -
year built 1974
likely grade2 A615 Grade 40 1 Ecalc based on secant modulus at 30 ksi 2 FEMA 356 Table 6-2
CHLORIDE TESTING Chloride content obtained from samples located in the footing at the stem wall interface indicated a chloride content of 0.28%. At locations 1.25 and 1.75 inches into the footing this value was 0.28% and 0.32%, respectively.
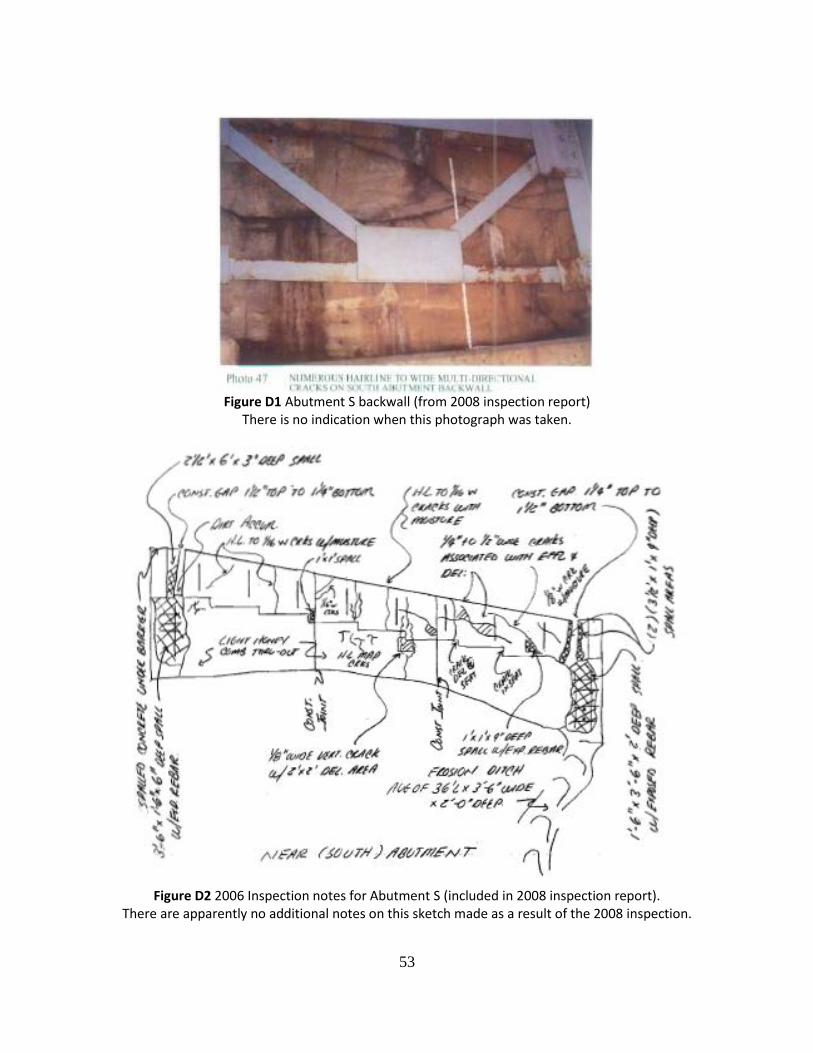
53
Figure D1 Abutment S backwall (from 2008 inspection report)
There is no indication when this photograph was taken.
Figure D2 2006 Inspection notes for Abutment S (included in 2008 inspection report).
There are apparently no additional notes on this sketch made as a result of the 2008 inspection.

54
Figure D3a Separation of wingwall (from 2008 inspection report)
Figure D3b Erosion ditch. (from 2008 inspection report)
N
CL
60”36”12”
core locations
J-bar location
12 34
2” (typ.) 90” 43”
Figure D4 Location of specimens. Due to demolition process locations of all but one reinforcing bar are unknown.
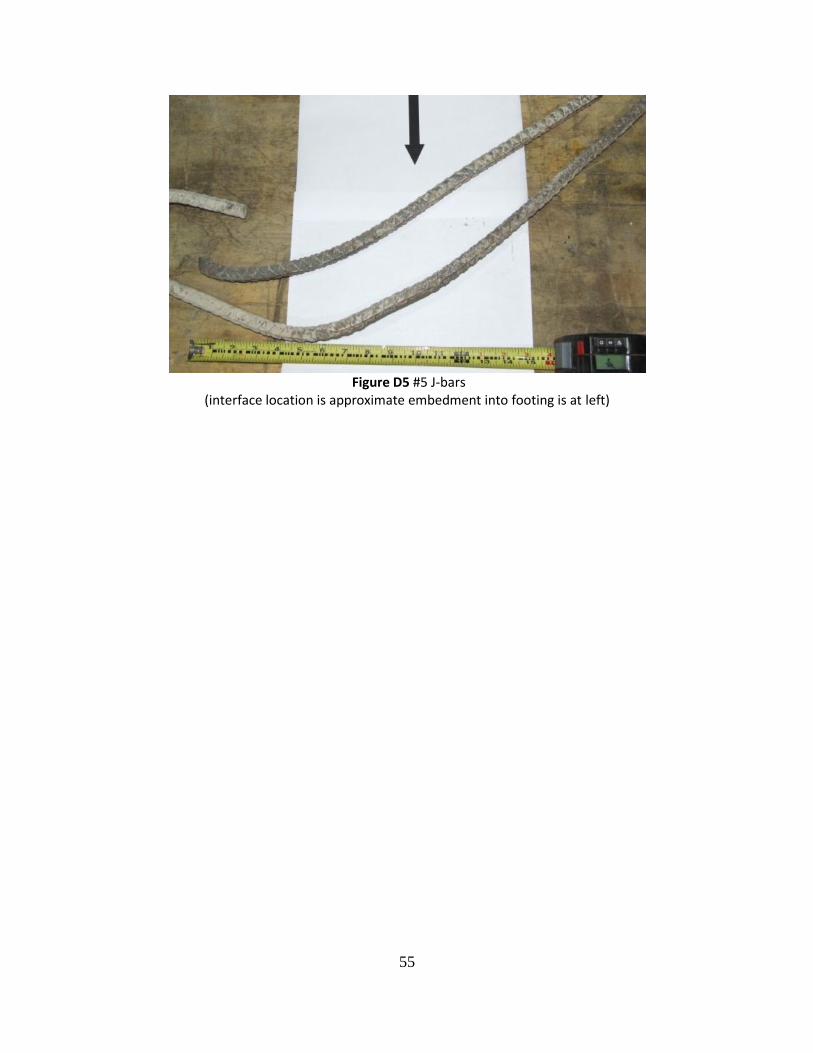
55
Figure D5 #5 J-bars
(interface location is approximate embedment into footing is at left)
56
APPENDIX E: S-4038 – SR 3086 over SR22 (‘Tonidale Bridge’)
(BMS: cannot identify in database) DOCUMENT REVIEW The following documents provided by PennDOT D11-0 were reviewed.
1. Drawings of bridge dated 09/02/1960 (10 sheets) Location of Structure SR 3086 (Montour Church Road) over SR 22, Allegheny County (40o 26.7’ N and 80o 10.5’ W) General Description of Structure The bridge, built in 1960 is a three span steel structure having a total length of 150’-10”. The spans are (from South to North (stationing direction)) 33’-5”, 104’-3” and 37’. The bridge is 44’ wide curb-to-curb and has a 58o skew. A reinforced concrete deck with a 1.5” bituminous wearing surface carries 2 lanes of bi-directional traffic. The superstructure consists of seven 60” deep plate girders in span 2 and 30WF108 rolled sections in spans 1 and 3. The substructure consists of two reinforced concrete three-pier column bents supporting a cap beam and two reinforcement concrete stem wall abutments. A single steel support has been provided to support the midspan of one exterior girder, this can be seen in Figure 1. Original Design The design basis is reported as the 1956 AASHTO Standard Specifications. Design live load is H20-44. Extant Condition Despite repeated requests, neither an inspection report nor BMS number were provided to the investigator. Demolition The bridge was demolished in November 2010. J-Bar environment and details Table 1 provides a description of each pier stem-footing interface location. Table 2 summarizes the pier stem-footing interface details. Reinforcing steel grade is reported to be, designed for fs = 18,000 psi and detailed according to ACI code. Based on this designation and the 1960 year of construction, it is likely that the reinforcing steel was A15 (or similar) or A16 rail steel. In either case, the minimum yield strength is fy = 50 ksi and the minimum tensile strength is fu = 80 ksi. SITE VISIT The PITT team visited the bridge on May 6, 2010 (see Figures 1 through 5). The bridge was open to traffic. The weather was clear and thus no assessment of active drainage could be made. Nonetheless, evidence of blocked drains and broken downpipes was noted (Figure 2). Damage to both abutments was noted. The South abutment (Figure 3) exhibited a significant crack between the second and third girders. The North abutment had a region of spalled concrete near the middle of the stem wall. Some drainage issues were noted along both slopes (Figure 4b, for example).

57
Extensive spalling and subsequent corrosion of both pier cap beams (Figure 5) was evident. Nonetheless the condition at the pier bases (near the road) was quite good (Figure 4a). Due to their depth, the footings could not be inspected.
Table E1 Pier stem-footing interface locations.
bottom of
footing elevation (ft)
horizontal clearance to SR
422
approximate depth of top of footing below finished grade
SR 3086 at start of bridge
1160.74 - -
SR 3086 at end of bridge
1165.39 - -
Abutment 1 1144.00 - approx 9’
Pier 1 (center column)
1133.08 8’-0” approx 3’
Pier 2 (center column)
1136.70 8’-0” approx 3’
Abutment 2 1148.29 - approx 12’
Table E2 Pier stem-footing interface details.
pier stem dimension
footing dimension
interface steel concrete type at
interface
Abutment stem wall 5’-0” wide 8’-0” wide 36 - #4 J-bars @ 18” FF 30 - #5 J-bars @ 18” RF
Class B Abutment wing wall 2’-9” wide 4’-0” wide
11 - #4 J-bars @ 18” FF 10 - #5 J-bars @ 18” RF
Pier columns 3’-0” x 3’-0” 9’-0” x 9’-0” 12 - #11 J-bars Class A (Piers)
Class B (Footings)
J-BAR SAMPLING Based on the inspection, review and site availability, J-bar sampling was carried out on the North Abutment as indicated in Figure 5. A request for pier dowel bars was made but these samples were not recovered since demolition of the pier footings was not carried out. Specimens were removed from the immediate vicinity of the large stem wall crack on the premise that this area would exhibit the greatest degree of deterioration. Figure 5c shows the sampling carried out on at the North abutment conducted November 5, 2010. The cores were recovered immediately adjacent the recovered J-bars. Figure 6 shows the recovered J-bars. There is little evidence of corrosion at the stem wall-footing interface (arrow). Nonetheless, significant localized corrosion is evident about 6 inches above this location on the #4 front face bar. Based on the fact this bar was located immediately adjacent the large stem wall crack (Figures 3b and 5b) and some spalled concrete indicated large existing voids (now partially filled with corrosion product as shown in Figure 7) in this area, it is not believed that the observed corrosion is related to issues associated with the wall-footing interface. The following reinforcing bar material properties were obtained for the extracted bars.

58
Table E3 Reinforcing steel properties.
location N Abutment N Abutment
Bar size #4 FF bars #5 RF bars
test condition bent bent
observed corrosion minor surface minor surface
samples tested, n 1 2
fy (average) ksi 54.6 45.4
fu(average) ksi >67.1 71.6
εu (average) n.a. 0.284
Ecalc1 (average) ksi n.a. 26170
year built 1960 1960
likely grade2 A408 Grade 40 A408 Grade 40 1 Ecalc based on secant modulus at 30 ksi 2 FEMA 356 Table 6-2
CHLORIDE TESTING Chloride content was obtained from samples taken from the front face of the North Abutment (Figure 7). At a location 0.5 in. above the wall-footing interface, the chloride content was found to be 0.23%. At a location 1.5 in. behind the stem wall face, the chloride content was found to be 0.18%. The core recovered from the footing block (Figure 5a) was not available for testing.
Figure E1 Overall view of bridge S-4038 – SR 3086 over SR 22. East elevation.

59
(a) Deck drain (b) Downpipe at North Pier (Pier 2)
Figure E2 Condition of drainage system.
(a) North abutment. (b) Detail of North abutment.
(c) South abutment.
Figure E3 Condition of abutments.
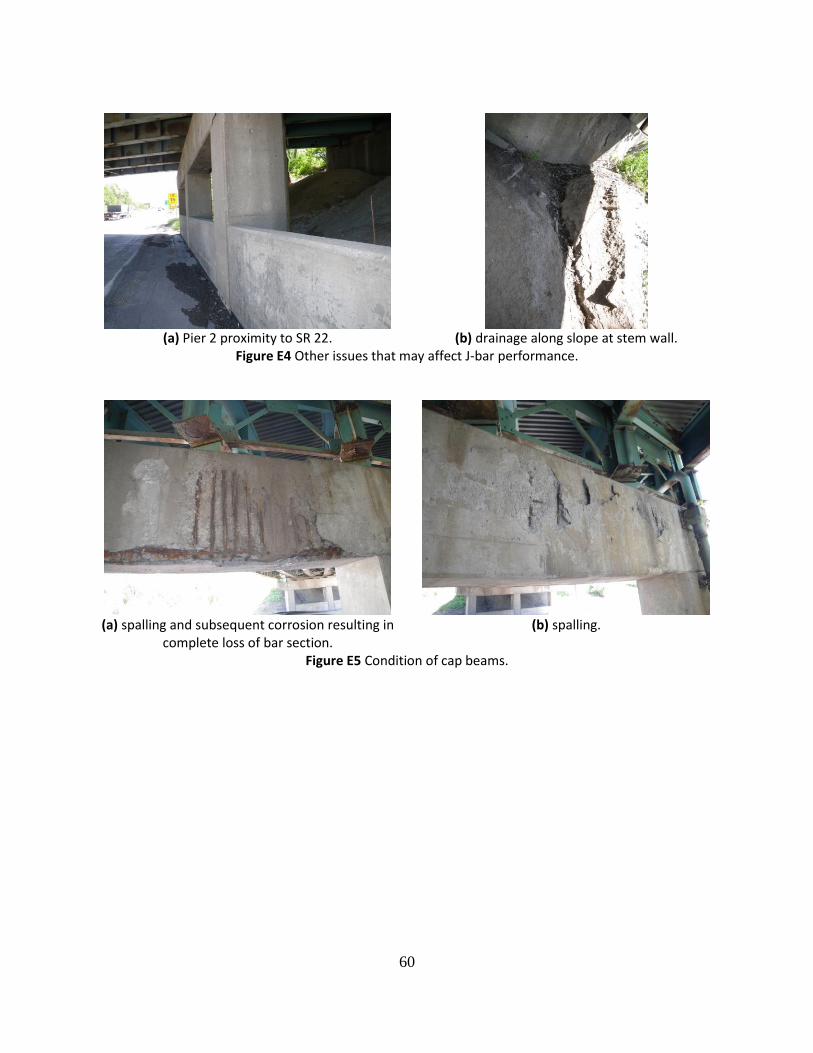
60
(a) Pier 2 proximity to SR 22. (b) drainage along slope at stem wall.
Figure E4 Other issues that may affect J-bar performance.
(a) spalling and subsequent corrosion resulting in
complete loss of bar section. (b) spalling.
Figure E5 Condition of cap beams.

61
(a) plan of specimen extraction from North Abutment.
(b) North Abutment during demolition.
large crack can be seen between 2nd and 3rd beam seats from right
(c) Coring near front face bars
Figure E5 Extraction of specimens.

62
detail of #4 front bar 6 in. above footing.
Figure E6 #4 front J-bar (top) and #5 back J-bar (bottom). (extension into footing to left of arrow; extension into stem wall to right)
(a) face of stem wall. (b) reverse view of (a) (c) void in concrete (front face of stem wall
shown, interface to left)
interface: sample taken 1.5 in. behind face of stem wall
front face of stem wall: sample taken 0.5 in. above interface
d) locations of chloride sampling Figure E7 Spalled stem wall concrete recovered from vicinity of crack showing significant evidence of
corrosion product and concrete voids.

63
APPENDIX F: S-2888 – Interstate 90 over Six Mile Creek
(BMS: 25009003300000(EB) and 25003003310000(WB)) DOCUMENT REVIEW The following documents provided by PennDOT D1-0 were reviewed.
1. Drawings of bridge dated 09/18/1957 (year unclear on drawings) (20 sheets) Location of Structure Interstate 90 over Six Mile Creek, Erie County (42o 7.6’ N and 79o 57.0’ W) General Description of Structure The crossing consists of two, essentially identical bridges carrying Eastbound and Westbound carriageways of I-90, respectively. Each bridge, built in 1959 is a three span steel truss structure having a total length of 629’ - 10.5”. The spans are (from West to East (stationing direction)) 202’-0.5”, 224’-11.5” and 202’-10.5”. There is a single 56’-0” approach span at the West end. The westbound bridge has a two span (46’-6” each) approach to the East while the eastbound bridge has only a single 46’-6” approach span. The bridge is 50’ wide curb-to-curb, carrying two lanes of interstate traffic and has no skew. The deck is approximately 171’ above the ravine floor. The superstructure consists of two steel Warren trusses that vary from 40’ deep at the piers to 22’ deep at midspan. The substructure consists of reinforced concrete tied two-column bents and two reinforcement concrete stem wall abutments. Original Design The design basis is reported as the 1953 AASHTO Standard Specifications. Design live load is H20-44. Extant Condition Ratings reported in 2007 inventory report are summarized in Table 1. Both bridges are rated both structurally deficient and functionally obsolete. An example of the condition of the superstructure is shown in Figure 1.
Table F1 Ratings from 2007 Inventory Report.
deck superstructure substructure sufficiency rating
Eastbound 5 3 5 21.7
Westbound 4 3 5 31.6
ADT on bridge = not available Demolition The EB bridge is scheduled for demolition in the fall of 2010; The WB bridge in late 2011. J-Bar environment and details The bridge spans the six mile creek ravine. Piers EB2 and WB2 are located in/at the edge of Six Mile Creek as shown in Figure 2. Piers EB3 and WB3 are founded on the ravine floor in the flood plain as shown in Figure 3. Piers EB1/WB1, EB4/WB4 and WB5 are shorter and are located up the side of the ravine as shown in Figure 4. Table 2 summarizes the pier stem-footing interface details. The quality of available drawings is poor. Details given in Table 2 are therefore limited; missing data is denoted m.

64
Table F2 Pier stem-footing interface details.
pier stem dimension
footing dimension
interface steel concrete type at
interface
Abutment to Footing 4’-0” wide 6’-0” wide #5 EF @ m
Class B Abutment to Stem Wall
1’-3” wide 4’-0” wide #6 FF@ m
Piers EB1 and WB1 6’-6” square 18’ square 48 - #11 J-bars
Class A (Piers) Class B (Footings)
Piers EB4 and WB4 6’-6” square 15’ square 48 - #6 J-bars
Piers EB2 and WB2 15’-8” square tapers to 6’
square
26’ square 52 - #11 dowels
Piers EB3 and WB3 25’ x 35’ m - #11 dowels
(three layers all around)
Pier WB5 4’-0” square 12’ square 32 # 11 J-bars m data illegible on available drawings Reinforcing steel grade is reported to be, designed for fs = 18,000 psi and detailed according to ACI code. Based on this designation and the 1959 year of construction, it is likely that the reinforcing steel was A15 (or similar) or A16 rail steel. In either case, the minimum yield strength is fy = 50 ksi and the minimum tensile strength is fu = 80 ksi. SITE VISIT The PITT team visited the bridge on August 3, 2010 (see Figures 1 through 6). The bridge was open to traffic and thus no inspection of the drainage system from the deck was conducted. Additionally, the weather was clear and therefore no assessment of active drainage or could be made. The level of six mile creek appeared to be low (high water and bank scour can be seen in Figure 2b). A significant amount of sediment was observed to be present on the Westbound abutment 1 (Figure 5b) Eastbound abutment 1 had some sediment on it and displayed a moderate degree of settlement and erosion issues (Figure 5a). Damage due to erosion and settlement was noticed on Westbound abutment (Figure 6b). Due to their depth, the footings of Westbound piers 1,3,4 and 5 and Eastbound pier 3 could not be inspected. Although dry summer conditions were present during the site visit, it was observed that Eastbound pier 3 was located in an area which is similar to a wetland. Grass, sediment and driftwood were all present near and around Eastbound pier 3 and Westbound pier 3 (Figure 3). Pier 2, for both the East and Westbound structures, is located within the high water region of Six Mile Creek. Although the creek was flowing near its lowest summer flows, it was obvious that the footings of these piers are often underwater (Figure 2). Eastbound abutment 2 and Pier 4 and Westbound Pier 4 were not visited due to access difficulties. J-BAR SAMPLING Based on the inspection, review and site availability, J-bar sampling was carried out on the North column of Pier EB3 (in 2010) and the North column of Pier WB3 (in 2011) as indicated in Figures 7 and 8. These bars showed no evidence of corrosion as shown in Figures 7 and 8. The following material properties were obtained from the recovered bars.

65
Table F3 Reinforcing steel properties.
location Pier EB3, North
column Pier WB3, North
column
Bar size #11 #11
test condition coupon1 coupon1
observed corrosion none none
samples tested, n 3 2
fy (average) ksi 82.5 67.5
fu(average) ksi 131.1 131.3
εu (average) 0.163 0.214
Ecalc2 (average) ksi 28249 28060
year built 1960 1960
likely grade3
A431 Gr.75 (high strength billet steel replaced with
A615 Gr. 75 in 1968)
A432 Gr.60 (high strength billet steel replaced with
A615 Gr. 60 in 1968) 1 standard ¾” diameter coupon machined from bar 1 Ecalc based on secant modulus at 30 ksi 2 FEMA 356 Table 6-2
CHLORIDE TESTING Pier EB3 (2010 demolition) Chloride content obtained from samples in the footing at the pier interface (Figure 7a) indicated a chloride content of 0.25%, 0.15% and 0.23% at depths of 0.25, 1.0 and 1.75 in. respectively on the ‘rear face’ and 0.15% at a depth of 0.25 in. in the ‘front face’. Pier WB3 (2011 demolition) Chloride content obtained from two samples in the footing at the pier interface (Figure 8a) indicated an essentially uniform chloride content of 0.36% at depths to 1.75 in. In this case, both samples were taken from the face of the pier nearest the creek.

66
(a) gusset plate (b) lateral bracing member
Figure F1 Example of condition of super structure.
(a) Pier EB2 (b) Pier WB2
Figure F2 Piers in Six Mile Creek.
(a) Pier EB3 (b) Pier WB3 Figure F3 Piers on ravine floor.
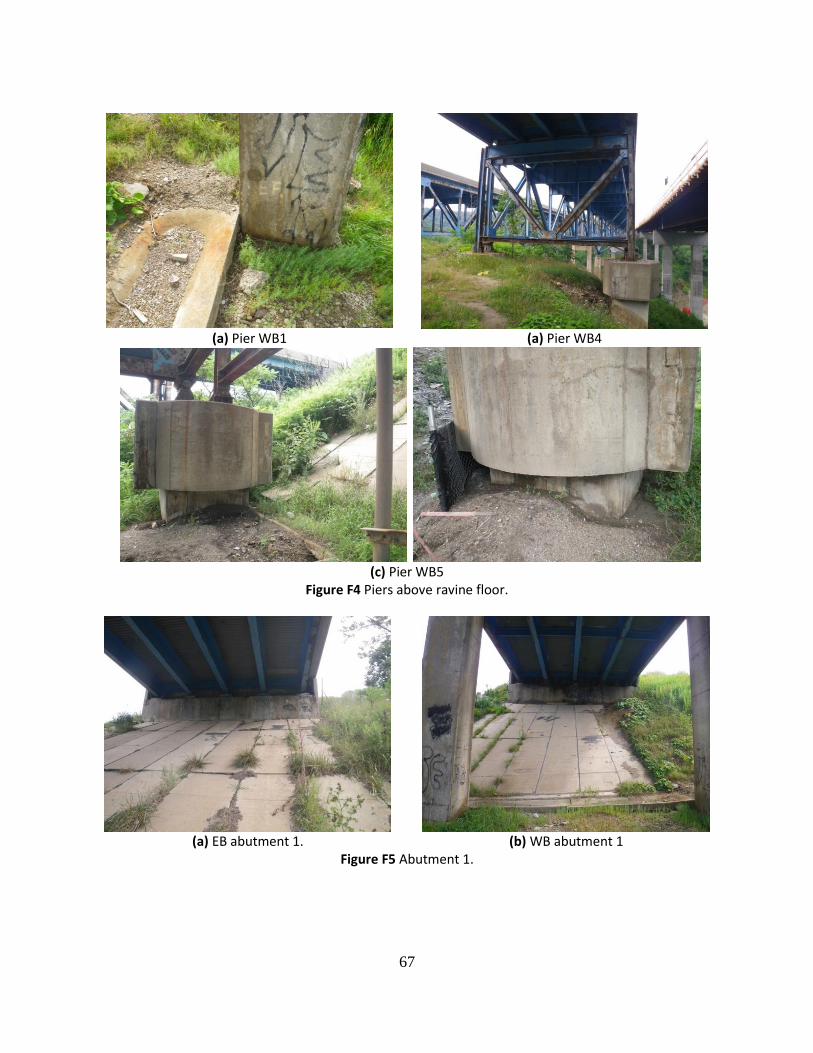
67
(a) Pier WB1 (a) Pier WB4
(c) Pier WB5
Figure F4 Piers above ravine floor.
(a) EB abutment 1. (b) WB abutment 1
Figure F5 Abutment 1.

68
(a) WB abutment 2
showing temporary shoring of approach span.. (b) WB abutment 2 detail
Figure F6 Abutment 2.
bar samples
core samples taken fromfooting at sampled bar locations
North face
pier
footing
(a) plan of specimen extraction from Pier EB3, North column
(b) Pier EB3 North column top: #11 dowel bar from West face
bottom: #11 dowel bar from East face no corrosion evident
Figure F7 Location of specimens and condition of reinforcement in Pier EB3.

69
bar samples
core samples
approximately 9 feetto creek bank
pier
footing
exposed dowel cores
(a) plan of specimen extraction from Pier WB3, North column
(b) Pier WB3 North column
top: #11 dowel bars; no corrosion evident Figure F8 Location of specimens and condition of reinforcement in Pier EB3.

70
APPENDIX G: Summary of Bridges Sampled and Additional Bridges Considered and
Rejected for Study
Table G1. Summary of bridge characteristics for structures sampled in this study.
Appendix B C D E F
Bridge S7648 S7141 S9469 S4038 S2888
Feature Forest Grove over I-79 SR528 over
SR422 Triboro Ramp
SR3086 over
SR22 I-90 over Six Mile Creek
Date on plans 02/20/1969 05/05/1967 05/06/1974 09/02/1960 09/18/1957
County Allegheny Butler Allegheny Allegheny Erie
Abutment type partial with apron stub stub wall with
apron wall with apron
Intermediate support type single column multi-column - multi-column single column
CHARACTERISTICS OF SAMPLED ELEMENT
Sample locations Pier 2 Pier 7 Abutment 2 Abutment 2 Abutment S Abutment N EB3 WB3
Corrosion assessment no evidence
of corrosion
no evidence
of corrosion
no evidence
of corrosion
no evidence
of corrosion
no evidence
of corrosion
corrosion associated
with damage
to abutment
no evidence
of corrosion
minor surface
corrosion
Maximum acid-soluble Cl-
by weight measured 0.35% 0.30% 20% 0.33% 0.32% 0.23% 0.25% 0.36%
Height of unit 46‘-10‖ 17‘-10‖ 2‘-0‖ above
apron
2‘-0‖ above
apron
3‘-0‖ above
apron 4‘-0‖ - 6‘-0‖ 171‘ 171‘
Depth to top of footing 4‘-6‖ 2‘-0‖ 8‘-1‖ 1‘-6‖ 3‘-1‖ 12‘-0‖ 0‘ 0‘
Abutment/Pier topology on slope toward Moon Run apron sloped
away
apron sloped
away
apron sloped
away and cross slope
apron sloped
away flat flat
Features protecting J-bar
from moisture none none none none none none none none
Distance from edge of road 4‘-0‖ 14‘-3‖ - - - - - -
Ground water unlikely unlikely unlikely unlikely unlikely unlikely intermittent steam
Salt exposure
adjacent
roadway
scuppers
above joint above
joint above joint above joint above unlikely
bridge drainage tied into roadway drainage
J-bar type plain bar plain bar plain bar plain bar plain bar plain bar plain bar plain bar
J-bar size #11 #11 #5 FF #6 RF
#4 FF #5 RF
#4 BF #4 FF #5 RF
#11 #11
J-bar cover 4‖ 4‖ 2‖ 2‖ 2‖ 2‖ 4‖ 4‖
J-bar protection none none none none none none none none
J-bar design grade 50 50 50 50 40 50 50 50
J-bar grade (tested) 60 60 60 40 40 40 75 60
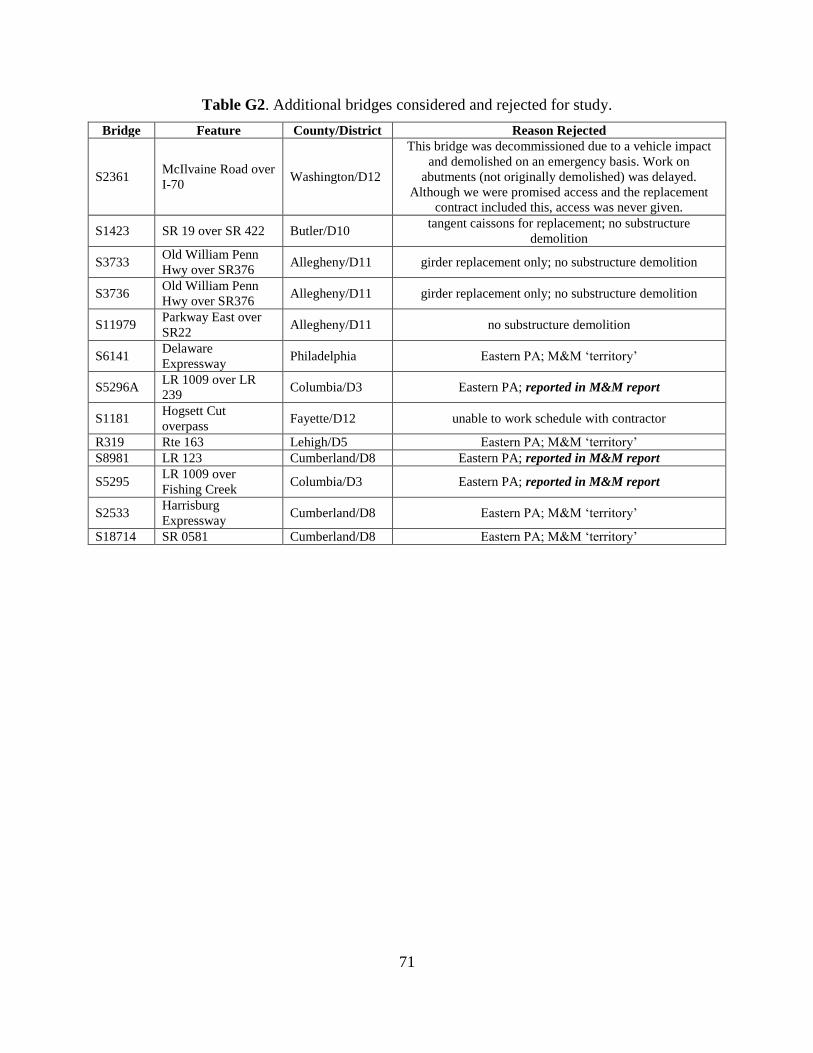
71
Table G2. Additional bridges considered and rejected for study.
Bridge Feature County/District Reason Rejected
S2361 McIlvaine Road over
I-70 Washington/D12
This bridge was decommissioned due to a vehicle impact
and demolished on an emergency basis. Work on
abutments (not originally demolished) was delayed.
Although we were promised access and the replacement
contract included this, access was never given.
S1423 SR 19 over SR 422 Butler/D10 tangent caissons for replacement; no substructure
demolition
S3733 Old William Penn
Hwy over SR376 Allegheny/D11 girder replacement only; no substructure demolition
S3736 Old William Penn
Hwy over SR376 Allegheny/D11 girder replacement only; no substructure demolition
S11979 Parkway East over
SR22 Allegheny/D11 no substructure demolition
S6141 Delaware
Expressway Philadelphia Eastern PA; M&M ‗territory‘
S5296A LR 1009 over LR
239 Columbia/D3 Eastern PA; reported in M&M report
S1181 Hogsett Cut
overpass Fayette/D12 unable to work schedule with contractor
R319 Rte 163 Lehigh/D5 Eastern PA; M&M ‗territory‘
S8981 LR 123 Cumberland/D8 Eastern PA; reported in M&M report
S5295 LR 1009 over
Fishing Creek Columbia/D3 Eastern PA; reported in M&M report
S2533 Harrisburg
Expressway Cumberland/D8 Eastern PA; M&M ‗territory‘
S18714 SR 0581 Cumberland/D8 Eastern PA; M&M ‗territory‘

72