detention and community statistics summary 30 … detention and community statistics summary ..... 4...
TRANSCRIPT

Immigration Detention and Community Statistics Summary at 30 September 2017 | 1
Immigration Detention and Community Statistics Summary 30 September 2017

Immigration Detention and Community Statistics Summary at 30 September 2017 | 2
Table of Contents
Immigration Detention and Community Statistics Summary .................................................................. 1
About this report ..................................................................................................................................... 3
Enquiries ................................................................................................................................................ 3
Acronyms ............................................................................................................................................... 3
Immigration Detention And Community Statistics Summary ................................................................. 4
In Community under Residence Determination Population By State/Territory ...................................... 5
Immigration Detention Population .......................................................................................................... 6
From 1990 to 30 September 2017...................................................................................................... 6
People In Immigration Detention Facilities ............................................................................................. 7
Arrival Type ......................................................................................................................................... 7
People In Immigration Detention ............................................................................................................ 8
Nationality ........................................................................................................................................... 8
Children In Immigration Detention .......................................................................................................... 9
Time In Immigration Detention Facilities .............................................................................................. 11
Time In Community Under Residence Determination.......................................................................... 12
Immigration Detention and Community Statistics Summary at 30 September 2017 | 3
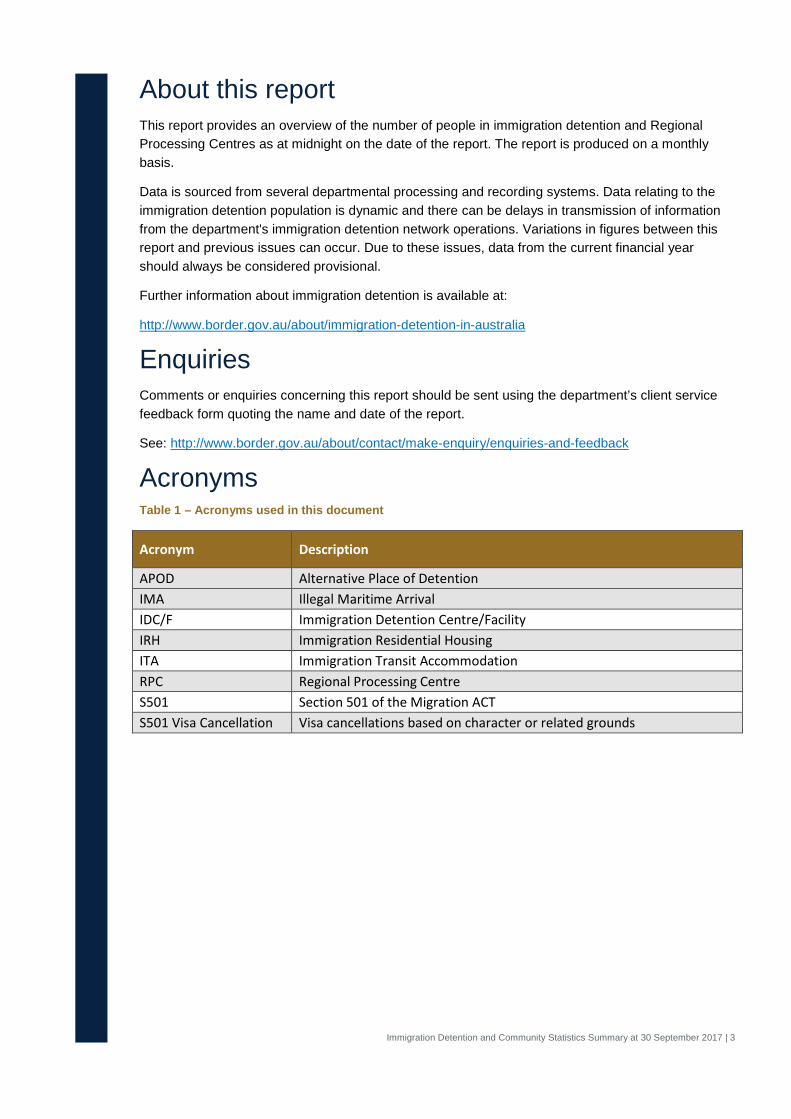
About this report This report provides an overview of the number of people in immigration detention and Regional Processing Centres as at midnight on the date of the report. The report is produced on a monthly basis.
Data is sourced from several departmental processing and recording systems. Data relating to the immigration detention population is dynamic and there can be delays in transmission of information from the department's immigration detention network operations. Variations in figures between this report and previous issues can occur. Due to these issues, data from the current financial year should always be considered provisional.
Further information about immigration detention is available at:
http://www.border.gov.au/about/immigration-detention-in-australia
Enquiries Comments or enquiries concerning this report should be sent using the department’s client service feedback form quoting the name and date of the report.
See: http://www.border.gov.au/about/contact/make-enquiry/enquiries-and-feedback
Acronyms Table 1 – Acronyms used in this document
Acronym Description
APOD Alternative Place of Detention IMA Illegal Maritime Arrival IDC/F Immigration Detention Centre/Facility IRH Immigration Residential Housing ITA Immigration Transit Accommodation RPC Regional Processing Centre S501 Section 501 of the Migration ACT S501 Visa Cancellation Visa cancellations based on character or related grounds
Immigration Detention and Community Statistics Summary at 30 September 2017 | 4
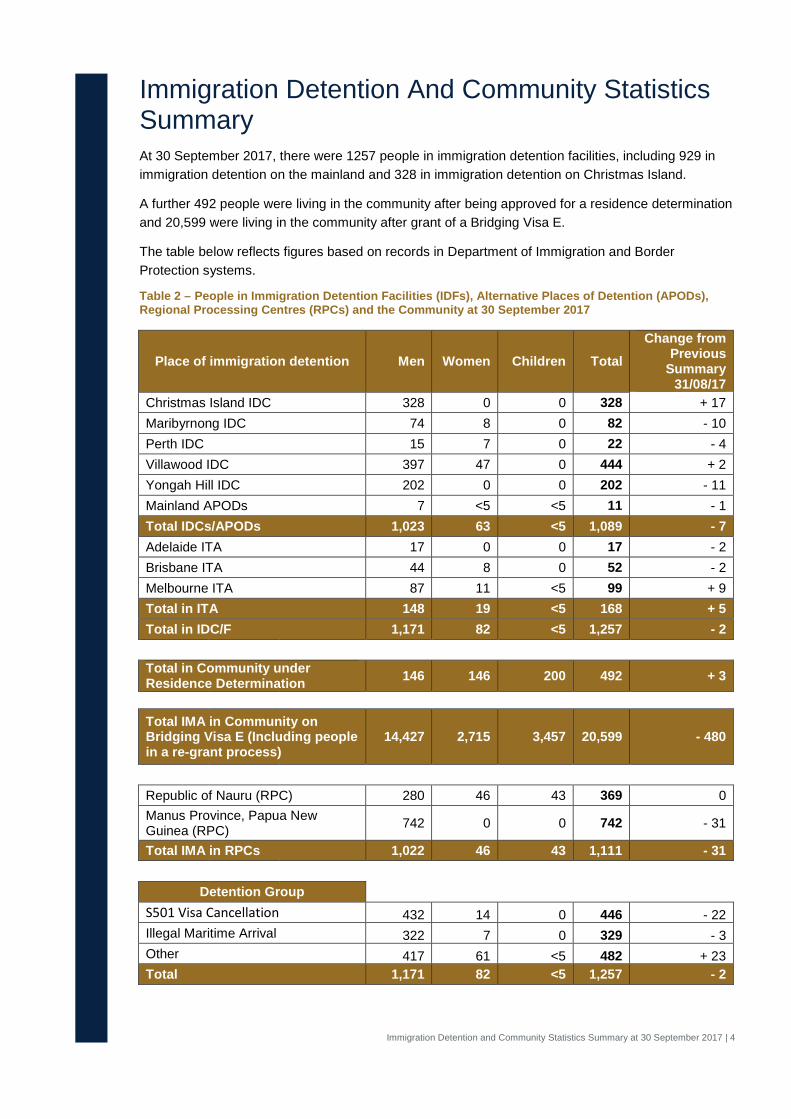
Immigration Detention And Community Statistics Summary At 30 September 2017, there were 1257 people in immigration detention facilities, including 929 in immigration detention on the mainland and 328 in immigration detention on Christmas Island.
A further 492 people were living in the community after being approved for a residence determination and 20,599 were living in the community after grant of a Bridging Visa E.
The table below reflects figures based on records in Department of Immigration and Border Protection systems.
Table 2 – People in Immigration Detention Facilities (IDFs), Alternative Places of Detention (APODs), Regional Processing Centres (RPCs) and the Community at 30 September 2017
Place of immigration detention Men Women Children Total Change from
Previous Summary
31/08/17 Christmas Island IDC 328 0 0 328 + 17 Maribyrnong IDC 74 8 0 82 - 10 Perth IDC 15 7 0 22 - 4 Villawood IDC 397 47 0 444 + 2 Yongah Hill IDC 202 0 0 202 - 11 Mainland APODs 7 <5 <5 11 - 1 Total IDCs/APODs 1,023 63 <5 1,089 - 7 Adelaide ITA 17 0 0 17 - 2 Brisbane ITA 44 8 0 52 - 2 Melbourne ITA 87 11 <5 99 + 9 Total in ITA 148 19 <5 168 + 5 Total in IDC/F 1,171 82 <5 1,257 - 2
Total in Community under Residence Determination 146 146 200 492 + 3
Total IMA in Community on Bridging Visa E (Including people in a re-grant process)
14,427 2,715 3,457 20,599 - 480
Republic of Nauru (RPC) 280 46 43 369 0 Manus Province, Papua New Guinea (RPC) 742 0 0 742 - 31
Total IMA in RPCs 1,022 46 43 1,111 - 31
Detention Group S501 Visa Cancellation 432 14 0 446 - 22 Illegal Maritime Arrival 322 7 0 329 - 3 Other 417 61 <5 482 + 23 Total 1,171 82 <5 1,257 - 2

Immigration Detention and Community Statistics Summary at 30 September 2017 | 5
In Community under Residence Determination Population By State/Territory Of the 492 people approved for a residence determination to live in the community, 35 per cent were in Victoria, 26.6 per cent in New South Wales, 25.6 per cent in Queensland, 6.5 per cent in Western Australia and 6.3 per cent in South Australia.
Table 3 – People in the Community under Residence Determination by State/Territory at 30 September 2017
State/Territory Adult Male Adult Female Child Male (<18 years)
Child Female (<18 years) Total
Victoria 56 50 38 28 172
New South Wales 30 44 32 25 131
Queensland 36 34 36 20 126
Western Australia 15 9 5 <5 32
South Australia 9 9 <5 9 31 Total 146 146 115 85 492

Immigration Detention and Community Statistics Summary at 30 September 2017 | 6
Immigration Detention Population
From 1990 to 30 September 2017 The overall number of people in immigration detention including in the community under residence determination has decreased by 313 to 1749 compared with 2062 at the end of September 2016. This decrease takes into account releases of detainees into the community under residence determination and detainees granted Bridging E visas (BVEs) as well as decreases through return and removal activities.
Figure 1 – Population in Immigration Detention
Figure 1 above, shows the number of people in immigration detention from 1990 to the date of this report. The trend had a consistent rise of people in immigration detention from January 2009 to January 2013, but has since had consistent decline.

Immigration Detention and Community Statistics Summary at 30 September 2017 | 7
People In Immigration Detention Facilities
Arrival Type There were 389 people who arrived unlawfully by air or boat, in held immigration detention facilities at 30 September 2017 representing 30.9 per cent of the total immigration detention population.
There were also 868 people (69.1 per cent of the total immigration population) who arrived in Australia lawfully and were subsequently taken into immigration detention and had visa cancellations for either over staying or breaching their visa conditions.
Figure 2 – People in Held Immigration Detention Facilities by Detention Group
Figure 2 above, shows the number of people in held immigration detention facilities by detention group, including Overstayers, S501 and Other Visa Cancellations, Foreign Fishers, Irregular Maritime Arrivals, Unauthorised Air Arrivals, and if required – Inadequately Documented Crew Members and Others such as stowaways and ship deserters.
Table 4 – People in Held Immigration Detention Facilities by Detention Group at 30 September 2017
Place of immigration detention
S501 Visa Cancellation IMA
Other Detention
Group Total
Change from Previous
Summary 31/08/17 Christmas Island IDC 183 86 59 328 + 17 Maribyrnong IDC 22 12 48 82 - 10 Perth IDC 7 <5 11 22 - 4 Villawood IDC 170 89 185 444 + 2 Yongah Hill IDC 57 71 74 202 - 11 Mainland APODs 0 <5 8 11 - 1 Total IDCs/APODs 439 265 385 1,089 - 7 Adelaide ITA <5 <5 11 17 - 2 Brisbane ITA 5 20 27 52 - 2 Melbourne ITA 0 40 59 99 + 9 Total in ITA 7 64 97 168 + 5 Total in IDC/F 446 329 482 1,257 - 2

Immigration Detention and Community Statistics Summary at 30 September 2017 | 8
People In Immigration Detention
Nationality At 30 September 2017, there were 1257 people in held immigration detention facilities. Of these 1257 people, 14.2 per cent were from New Zealand, 7.6 per cent were from Iran, 7.5 per cent were from Vietnam, 6.8 per cent were from Sri Lanka and 5.5 per cent were from China.
Table 5 – People in Held Immigration Detention Facilities by Nationality at 30 September 2017
Nationalities Adult Male Adult Female Child Male (<18 years)
Child Female (<18 years) Total
New Zealand 168 10 0 0 178 Iran 94 <5 0 0 96 Vietnam 86 8 0 0 94 Sri Lanka 84 <5 0 0 85 China 56 12 <5 0 69 Malaysia 53 9 <5 0 64 India 46 <5 0 0 50 United Kingdom 43 <5 0 0 44 Iraq 38 <5 0 0 39 Pakistan 39 0 0 0 39 Other 464 34 <5 0 499 Total 1,171 82 <5 0 1,257
At 30 September 2017, 492 were people living in the community after being approved for a residence determination. Of these 492 people, 52.6 per cent were from Iran, 12.2 per cent were from Sri Lanka, 10 per cent were Stateless, 5.1 per cent were from Iraq and 3.5 per cent were from Vietnam.
Table 6 – People in the Community under Residence Determination by Nationality at 30 September 2017
Nationalities Adult Male Adult Female Child Male (<18 years)
Child Female (<18 years) Total
Iran 83 85 51 40 259 Sri Lanka 16 14 20 10 60 Stateless 13 12 12 12 49 Iraq 9 5 <5 7 25 Vietnam <5 5 5 <5 17 Other 21 25 23 13 82 Total 146 146 115 85 492

Immigration Detention and Community Statistics Summary at 30 September 2017 | 9
Children In Immigration Detention At 30 September 2017 there were less than five children (aged less than 18 years) in Immigration Residential Housing, Immigration Transit Accommodation and Alternative Places of Detention.
Figure 3 – Children in Immigration Residential Housing, Immigration Transit Accommodation and Alternative Places of Detention
Figure 3 above, shows the number of children in immigration detention facilities and alternative places of detention from January 2013 to the date of this report. The continuous increase in the number of children in detention facilities from April 2013 to Aug 2013 was due to a rapid increase in irregular maritime arrivals during this period. The number of children in immigration detention facilities reduced in September 2013, as children completed mandatory processing and were transferred into the community. The number of children in detention facilities continued to decline during the late 2013 and 2014, with further reduction in January 2015.

Immigration Detention and Community Statistics Summary at 30 September 2017 | 10
At 30 September 2017, the number of children living in the community after being approved for a residence determination increased by two to 200 from 198 in the previous report.
Figure 4 – Children in the Community under Residence Determination
Figure 4 above, shows the number of children in the community under residence determination from January 2012 to the date of this report. The number of children in the community under residence determination, has levelled off at its lowest number since the peak in November 2013, as a result of releases into the community on Bridging E visas.
Table 7 – Children in Immigration Detention and IMA Children in the Community on a Bridging E Visa at 30 September 2017
Placement Type Children Immigration Residential Housing 0 Immigration Transit Accommodation <5 Alternative Places of Detention <5 Total Children in Immigration Detention Facilities <5 Total Children in the Community under a Residence Determination 200 Total IMA Children in the Community on a Bridging E visa (including in re-grant process) 3,457

Immigration Detention and Community Statistics Summary at 30 September 2017 | 11
Time In Immigration Detention Facilities At 30 September 2017, there were 1257 people in immigration detention facilities. Of these 1257 people, 37.4 per cent had been detained for 91 days or less and 65 per cent had been detained for 365 days or less.
Table 8 – Length of Time of People in Held Immigration Detention Facilities at 30 September 2017
Period Detained Total % of Total 7 days or less 80 6.4%
8 days - 31 days 164 13.0% 32 days - 91 days 226 18.0% 92 days - 182 days 170 13.5%
183 days - 365 days 177 14.1% 366 days - 547 days 95 7.6% 548 days - 730 days 69 5.5%
Greater than 730 days 276 22.0% Total 1,257 100%
At 30 September 2017, the average period of time for people held in detention facilities was 440 days.
Figure 5 – Average Number of Days of People in Held Immigration Detention Facilities only
Figure 5 above, shows the average days in held immigration detention only by month from January 2013 to the date of this report. The average period of time for people held in detention facilities steadily increased from July 2013 to January 2015.

Immigration Detention and Community Statistics Summary at 30 September 2017 | 12
Time In Community Under Residence Determination Of the 492 people in the community under residence determination, as at 30 September 2017, 2.6 per cent had been in the community for 91 days or less and 17.5 per cent had been in the community for 365 days or less.
Table 9 – Length of Time of People in Community under Residence Determination at 30 September 2017
Period Detained Total % of Total 7 days or less <5 0.4%
8 days - 31 days <5 0.6% 32 days - 91 days 8 1.6% 92 days - 182 days 27 5.5% 183 days - 365 days 46 9.3% 366 days - 547 days 38 7.7% 548 days - 730 days 224 45.5%
Greater than 730 days 144 29.3% Total 492 100%