detection of internal defects in as-built pipelines for ... · internal defects can develop in an...
TRANSCRIPT

Detection of Internal Defects in As-Built Pipelines for Structural Health Monitoring: A Sensor Fusion Approach
Using Infrared Thermography and 3D Laser-Scanned Data
H. Son, C. Kim, and C. Kim
Department of Architectural Engineering, Chung-Ang University, Seoul, Korea
E-mail: [email protected], [email protected], and [email protected] (corresponding author) Abstract -
Internal defects of pipelines are among the main factors causing accidents in the production phase of industrial plants. Periodic monitoring of a pipeline’s inner surface condition is of great importance for minimizing the risk of failure of industrial plants. This study proposes a sensor fusion approach to detect internal defects automatically in as-built pipelines during their service lives to ensure structural safety. The proposed approach uses infrared thermography combined with three-dimensional (3D) laser-scanned data. For this purpose, a multi-sensor system equipped with a thermal infrared camera and a 3D laser scanner was internally and externally calibrated. From the combined data set, 3D points corresponding to the as-built pipelines are extracted from laser-scanned data. Then, thermographic analysis of the corresponding thermal data of those pipelines is performed. In this step, the local thermal gradients on the pipeline’s surface are calculated to detect areas having different thermal values. In addition, the global thermal gradients along the longitudinal or radial axes of the pipeline are calculated to determine the consistency of its internal thickness. The field experiment was performed at an operating petrochemical plant to validate the proposed approach. The experimental results revealed that the proposed approach has potential for detecting internal defects in as-built pipelines from infrared thermography combined with 3D laser-scanned data. Keywords -
As-built pipeline; Infrared thermography; Internal defects detection; Sensor fusion; Structural health monitoring; 3D laser scanning technique
1 Introduction Internal defects of pipelines are among the main
factors causing accidents in the production phase of industrial plants. After a time period of operation,
internal defects can develop in an as-built pipeline for a number of reasons during the pipeline’s service life [1–3]. Especially for high temperature and pressure pipelines, internal defects can be the main reasons for thinning of the pipeline’s wall, which may result in heat loss that degrades energy efficiency in the production line. In the end, such internal defects may lead to the whole pipeline’s breakdown [4]. Unplanned downtime is costly and can spell disaster for an industrial plant, and pipeline failures may lead to injuries to personnel. Therefore, periodic monitoring of the pipeline’s inner surface condition is of great importance for minimizing the risk of failure of an industrial plant and creating a safer working environment.
Monitoring a pipeline’s inner surface condition requires inspection at regular intervals to prevent breakdown. For many years, infrared thermography has been deployed to survey and inspect the integrity and performance of pipelines, including their protective coatings and insulation in industrial plants. Although thermal energy is invisible to the naked eye, it can be measured by using thermal infrared cameras [5]. Infrared thermography has been proven as a cost-effective way to survey and monitor large areas of as-built pipelines because of its non-contact and non-destructive temperature measurement properties, so that it requires no shutdown or preparation [4]. By detecting hidden defects in process pipelines, such as internal corrosion damage, infrared thermography allows for planning to repair or replace critically damaged areas before they disrupt the production process.
However, manual interpretation of infrared thermography, to locate internal defects in large areas of process pipelines and decide which pipeline is causing the problem, is not a trivial task. One needs to analyze the temperatures at various points along each pipeline. There are many factors to take into consideration, such as identifying the areas of pipelines in two-dimensional (2D) infrared thermography and the determination of internal defects in pipelines: the thermal contrasts of most internal defects in faulty pipelines are undetectable to the human eye. For these reasons, specialized
The 31st International Symposium on Automation and Robotics in Construction and Mining (ISARC 2014)
engineers conduct such interpretation to detect internal faults in pipelines from infrared thermography. Nevertheless, since analysts must interpret a large number of images (typically, several hundreds to thousands of infrared thermography images for an industrial plant, depending on its size), manual interpretation becomes extremely inefficient, sometimes inconsistent, and impractical.
The aim of this study is to propose a sensor fusion approach to detect internal defects automatically in as-built pipelines to ensure structural safety. The proposed approach uses infrared thermography combined with 3D laser-scanned data. The rest of the paper is organized as follows: Section 2 provides an overview and details of the proposed approach for detecting internal defects in as-built pipelines. Section 3 provides experimental results. Finally, Section 4 provides conclusions and recommendations for future research.
2 Detection of Internal Defects in Pipeline This study proposes a sensor fusion approach to
detect internal defects automatically in as-built pipelines during their service lives to ensure structural safety. For this purpose, a multi-sensor system equipped with a P640 thermal infrared camera developed by FLIR Systems (Notting Hill Victoria, Australia) and a FARO Focus3D laser scanner by FARO Technologies UK Ltd. (Coventry, United Kingdom) was internally and externally calibrated. Using the results of intrinsic and extrinsic calibration, each pixel of the infrared thermography is mapped to the corresponding 3D point. Once registered, the as-built 3D pipeline extraction method proposed in our previous work [6] is applied to the combined data set to identify 3D points corresponding to the as-built pipelines. Then thermographic analysis is performed on the corresponding thermal data of those pipelines to determine the existence of internal defects in the pipelines by identifying the differences in the pipeline thickness caused by corrosion. The next subsections describe each of the steps in more detail.
2.1 Data Acquisition Especially with large facilities, single infrared
thermography can cover only a limited area. For this reason, it is insufficient to infer and obtain the 3D structure of the scene given 2D infrared thermography. Therefore, identifying and locating internal defects in as-built pipelines requires infrared thermography of 3D surfaces [7, 8]. In this study, a P640 thermal infrared camera with the FARO Focus3D laser scanner is used to acquire 3D information of as-built pipelines with
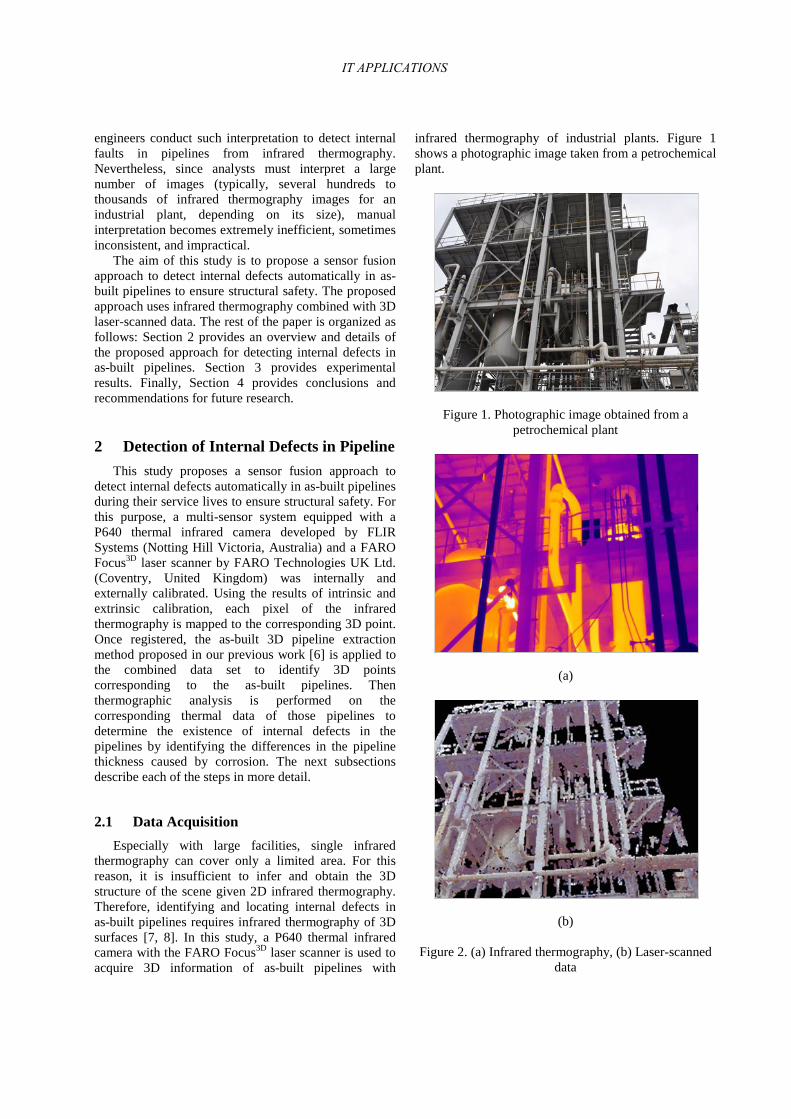
infrared thermography of industrial plants. Figure 1 shows a photographic image taken from a petrochemical plant.
Figure 1. Photographic image obtained from a petrochemical plant
(a)
(b) Figure 2. (a) Infrared thermography, (b) Laser-scanned
data
IT APPLICATIONS
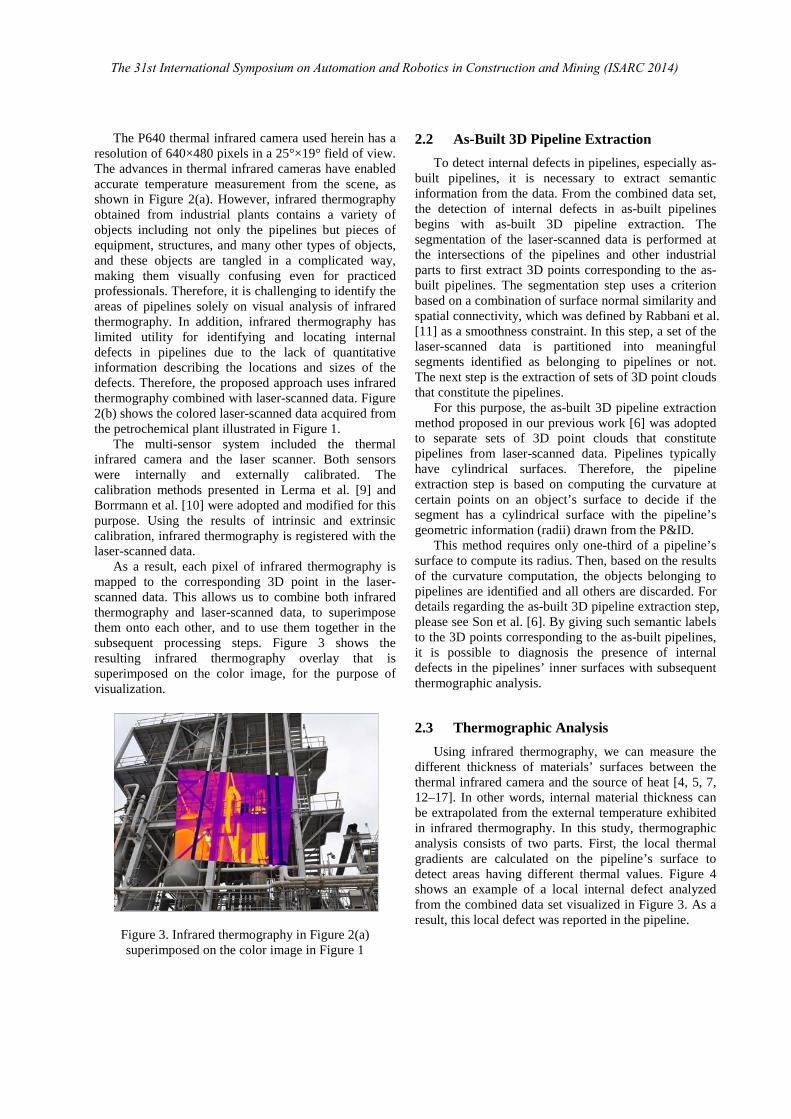
The P640 thermal infrared camera used herein has a resolution of 640×480 pixels in a 25°×19° field of view. The advances in thermal infrared cameras have enabled accurate temperature measurement from the scene, as shown in Figure 2(a). However, infrared thermography obtained from industrial plants contains a variety of objects including not only the pipelines but pieces of equipment, structures, and many other types of objects, and these objects are tangled in a complicated way, making them visually confusing even for practiced professionals. Therefore, it is challenging to identify the areas of pipelines solely on visual analysis of infrared thermography. In addition, infrared thermography has limited utility for identifying and locating internal defects in pipelines due to the lack of quantitative information describing the locations and sizes of the defects. Therefore, the proposed approach uses infrared thermography combined with laser-scanned data. Figure 2(b) shows the colored laser-scanned data acquired from the petrochemical plant illustrated in Figure 1.
The multi-sensor system included the thermal infrared camera and the laser scanner. Both sensors were internally and externally calibrated. The calibration methods presented in Lerma et al. [9] and Borrmann et al. [10] were adopted and modified for this purpose. Using the results of intrinsic and extrinsic calibration, infrared thermography is registered with the laser-scanned data.
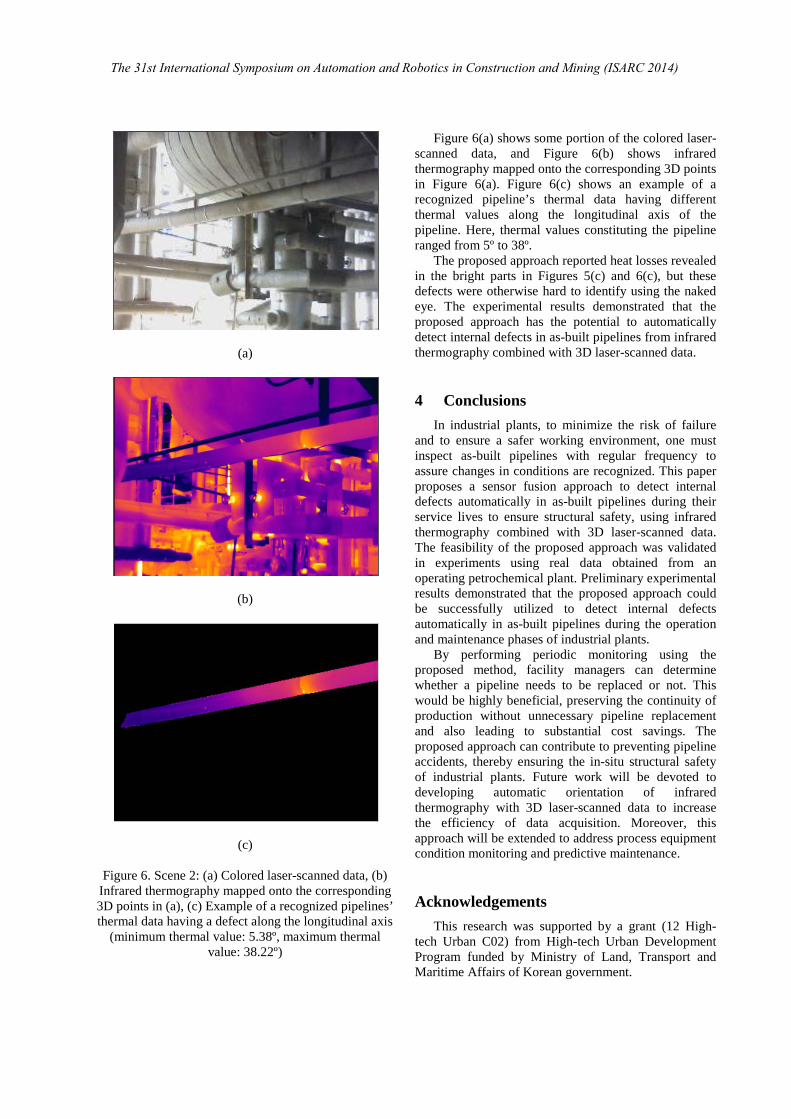
As a result, each pixel of infrared thermography is mapped to the corresponding 3D point in the laser-scanned data. This allows us to combine both infrared thermography and laser-scanned data, to superimpose them onto each other, and to use them together in the subsequent processing steps. Figure 3 shows the resulting infrared thermography overlay that is superimposed on the color image, for the purpose of visualization.
Figure 3. Infrared thermography in Figure 2(a) superimposed on the color image in Figure 1
2.2 As-Built 3D Pipeline Extraction To detect internal defects in pipelines, especially as-
built pipelines, it is necessary to extract semantic information from the data. From the combined data set, the detection of internal defects in as-built pipelines begins with as-built 3D pipeline extraction. The segmentation of the laser-scanned data is performed at the intersections of the pipelines and other industrial parts to first extract 3D points corresponding to the as-built pipelines. The segmentation step uses a criterion based on a combination of surface normal similarity and spatial connectivity, which was defined by Rabbani et al. [11] as a smoothness constraint. In this step, a set of the laser-scanned data is partitioned into meaningful segments identified as belonging to pipelines or not. The next step is the extraction of sets of 3D point clouds that constitute the pipelines.
For this purpose, the as-built 3D pipeline extraction method proposed in our previous work [6] was adopted to separate sets of 3D point clouds that constitute pipelines from laser-scanned data. Pipelines typically have cylindrical surfaces. Therefore, the pipeline extraction step is based on computing the curvature at certain points on an object’s surface to decide if the segment has a cylindrical surface with the pipeline’s geometric information (radii) drawn from the P&ID.
This method requires only one-third of a pipeline’s surface to compute its radius. Then, based on the results of the curvature computation, the objects belonging to pipelines are identified and all others are discarded. For details regarding the as-built 3D pipeline extraction step, please see Son et al. [6]. By giving such semantic labels to the 3D points corresponding to the as-built pipelines, it is possible to diagnosis the presence of internal defects in the pipelines’ inner surfaces with subsequent thermographic analysis.
2.3 Thermographic Analysis Using infrared thermography, we can measure the
different thickness of materials’ surfaces between the thermal infrared camera and the source of heat [4, 5, 7, 12–17]. In other words, internal material thickness can be extrapolated from the external temperature exhibited in infrared thermography. In this study, thermographic analysis consists of two parts. First, the local thermal gradients are calculated on the pipeline’s surface to detect areas having different thermal values. Figure 4 shows an example of a local internal defect analyzed from the combined data set visualized in Figure 3. As a result, this local defect was reported in the pipeline.
The 31st International Symposium on Automation and Robotics in Construction and Mining (ISARC 2014)

Figure 4. Example of pipeline’s thermal data having local defect recognized by thermographic analysis
The area shown in blue has temperature values more
than 10° lower than the surrounding areas in the pipeline, where the pipeline has become thin walled. Such areas can be seen in welded joints or other locations where minor defects exist, and which may result in local fracture of pipelines. Second, the global thermal gradients along the longitudinal or radial axes of the pipeline are calculated to determine the consistency of the internal pipeline’s thickness. Such areas can be seen in pipelines comprised of parts having different operating lives. Some parts of the pipelines may be replaced after being taken out of operation for various reasons. In this way, thermographic analysis allows inspection for hidden defects that are hard to find by the naked eye, such as thickness assessments of materials’ surfaces.
3 Experimental Results and Discussion Field experiments were performed to validate the
proposed approach at an operating petrochemical plant located in Yeosu, South Korea. Internal defects of pipelines in such petrochemical plants are of the greatest concern, because highly dangerous liquids and gases are processed throughout the pipelines. For this reason, in many cases, petrochemical plant pipelines are replaced long before they should be, to be on the safe side.
Figures 5 and 6 show the experimental results of two scenes, respectively. Figure 5(a) shows some portion of the colored laser-scanned data, and Figure 5(b) shows infrared thermography mapped onto the corresponding 3D points in Figure 5(a). Figure 5(c) shows an example of a recognized pipeline’s thermal data having a local defect. Here, thermal values constituting the pipeline ranged from 15º to 39º.
(a)
(b)
(c)
Figure 5. Scene 1: (a) Colored laser-scanned data, (b) Infrared thermography mapped onto the corresponding 3D points in (a), (c) Example of a recognized pipeline’s
thermal data having a local defect (minimum thermal value: 14.95º, maximum thermal value: 38.51º)
IT APPLICATIONS
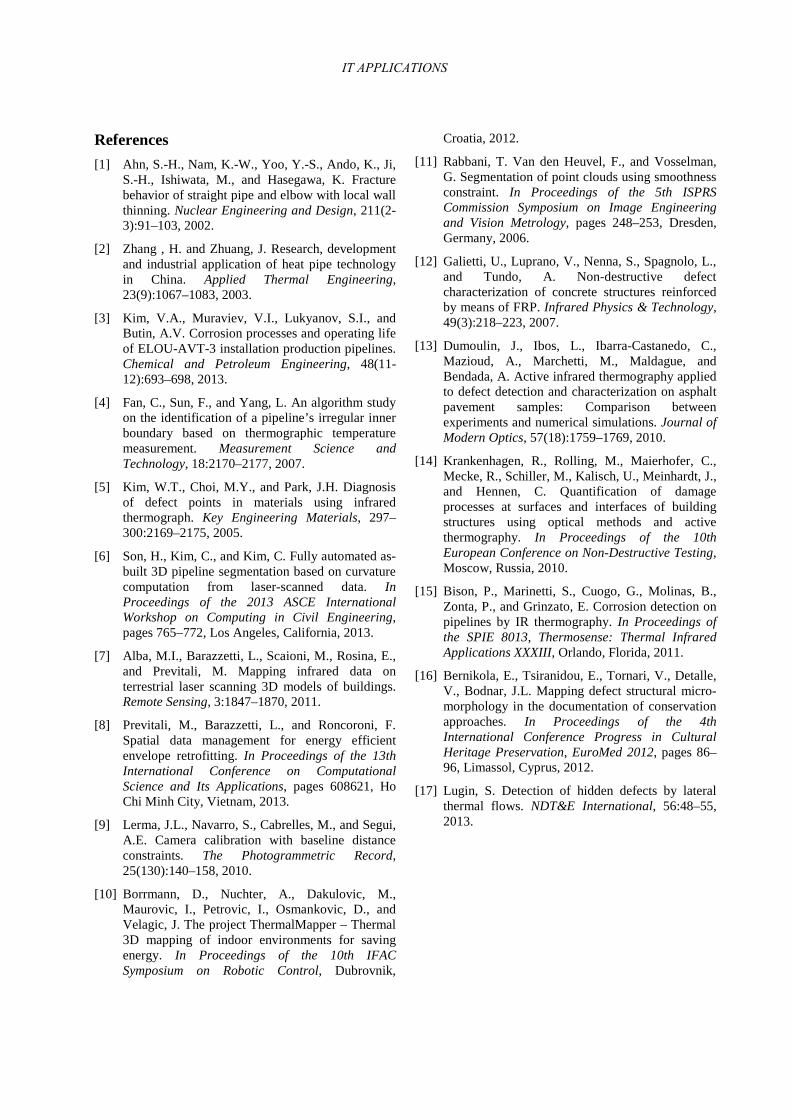
(a)
(b)
(c)
Figure 6. Scene 2: (a) Colored laser-scanned data, (b) Infrared thermography mapped onto the corresponding 3D points in (a), (c) Example of a recognized pipelines’ thermal data having a defect along the longitudinal axis
(minimum thermal value: 5.38º, maximum thermal value: 38.22º)
Figure 6(a) shows some portion of the colored laser-scanned data, and Figure 6(b) shows infrared thermography mapped onto the corresponding 3D points in Figure 6(a). Figure 6(c) shows an example of a recognized pipeline’s thermal data having different thermal values along the longitudinal axis of the pipeline. Here, thermal values constituting the pipeline ranged from 5º to 38º.
The proposed approach reported heat losses revealed in the bright parts in Figures 5(c) and 6(c), but these defects were otherwise hard to identify using the naked eye. The experimental results demonstrated that the proposed approach has the potential to automatically detect internal defects in as-built pipelines from infrared thermography combined with 3D laser-scanned data.
4 Conclusions In industrial plants, to minimize the risk of failure
and to ensure a safer working environment, one must inspect as-built pipelines with regular frequency to assure changes in conditions are recognized. This paper proposes a sensor fusion approach to detect internal defects automatically in as-built pipelines during their service lives to ensure structural safety, using infrared thermography combined with 3D laser-scanned data. The feasibility of the proposed approach was validated in experiments using real data obtained from an operating petrochemical plant. Preliminary experimental results demonstrated that the proposed approach could be successfully utilized to detect internal defects automatically in as-built pipelines during the operation and maintenance phases of industrial plants.
By performing periodic monitoring using the proposed method, facility managers can determine whether a pipeline needs to be replaced or not. This would be highly beneficial, preserving the continuity of production without unnecessary pipeline replacement and also leading to substantial cost savings. The proposed approach can contribute to preventing pipeline accidents, thereby ensuring the in-situ structural safety of industrial plants. Future work will be devoted to developing automatic orientation of infrared thermography with 3D laser-scanned data to increase the efficiency of data acquisition. Moreover, this approach will be extended to address process equipment condition monitoring and predictive maintenance.
Acknowledgements This research was supported by a grant (12 High-
tech Urban C02) from High-tech Urban Development Program funded by Ministry of Land, Transport and Maritime Affairs of Korean government.
The 31st International Symposium on Automation and Robotics in Construction and Mining (ISARC 2014)
References [1] Ahn, S.-H., Nam, K.-W., Yoo, Y.-S., Ando, K., Ji,
S.-H., Ishiwata, M., and Hasegawa, K. Fracture behavior of straight pipe and elbow with local wall thinning. Nuclear Engineering and Design, 211(2-3):91–103, 2002.
[2] Zhang , H. and Zhuang, J. Research, development and industrial application of heat pipe technology in China. Applied Thermal Engineering, 23(9):1067–1083, 2003.
[3] Kim, V.A., Muraviev, V.I., Lukyanov, S.I., and Butin, A.V. Corrosion processes and operating life of ELOU-AVT-3 installation production pipelines. Chemical and Petroleum Engineering, 48(11-12):693–698, 2013.
[4] Fan, C., Sun, F., and Yang, L. An algorithm study on the identification of a pipeline’s irregular inner boundary based on thermographic temperature measurement. Measurement Science and Technology, 18:2170–2177, 2007.
[5] Kim, W.T., Choi, M.Y., and Park, J.H. Diagnosis of defect points in materials using infrared thermograph. Key Engineering Materials, 297–300:2169–2175, 2005.
[6] Son, H., Kim, C., and Kim, C. Fully automated as-built 3D pipeline segmentation based on curvature computation from laser-scanned data. In Proceedings of the 2013 ASCE International Workshop on Computing in Civil Engineering, pages 765–772, Los Angeles, California, 2013.
[7] Alba, M.I., Barazzetti, L., Scaioni, M., Rosina, E., and Previtali, M. Mapping infrared data on terrestrial laser scanning 3D models of buildings. Remote Sensing, 3:1847–1870, 2011.
[8] Previtali, M., Barazzetti, L., and Roncoroni, F. Spatial data management for energy efficient envelope retrofitting. In Proceedings of the 13th International Conference on Computational Science and Its Applications, pages 608621, Ho Chi Minh City, Vietnam, 2013.
[9] Lerma, J.L., Navarro, S., Cabrelles, M., and Segui, A.E. Camera calibration with baseline distance constraints. The Photogrammetric Record, 25(130):140–158, 2010.
[10] Borrmann, D., Nuchter, A., Dakulovic, M., Maurovic, I., Petrovic, I., Osmankovic, D., and Velagic, J. The project ThermalMapper – Thermal 3D mapping of indoor environments for saving energy. In Proceedings of the 10th IFAC Symposium on Robotic Control, Dubrovnik,
Croatia, 2012.
[11] Rabbani, T. Van den Heuvel, F., and Vosselman, G. Segmentation of point clouds using smoothness constraint. In Proceedings of the 5th ISPRS Commission Symposium on Image Engineering and Vision Metrology, pages 248–253, Dresden, Germany, 2006.
[12] Galietti, U., Luprano, V., Nenna, S., Spagnolo, L., and Tundo, A. Non-destructive defect characterization of concrete structures reinforced by means of FRP. Infrared Physics & Technology, 49(3):218–223, 2007.
[13] Dumoulin, J., Ibos, L., Ibarra-Castanedo, C., Mazioud, A., Marchetti, M., Maldague, and Bendada, A. Active infrared thermography applied to defect detection and characterization on asphalt pavement samples: Comparison between experiments and numerical simulations. Journal of Modern Optics, 57(18):1759–1769, 2010.
[14] Krankenhagen, R., Rolling, M., Maierhofer, C., Mecke, R., Schiller, M., Kalisch, U., Meinhardt, J., and Hennen, C. Quantification of damage processes at surfaces and interfaces of building structures using optical methods and active thermography. In Proceedings of the 10th European Conference on Non-Destructive Testing, Moscow, Russia, 2010.
[15] Bison, P., Marinetti, S., Cuogo, G., Molinas, B., Zonta, P., and Grinzato, E. Corrosion detection on pipelines by IR thermography. In Proceedings of the SPIE 8013, Thermosense: Thermal Infrared Applications XXXIII, Orlando, Florida, 2011.
[16] Bernikola, E., Tsiranidou, E., Tornari, V., Detalle, V., Bodnar, J.L. Mapping defect structural micro-morphology in the documentation of conservation approaches. In Proceedings of the 4th International Conference Progress in Cultural Heritage Preservation, EuroMed 2012, pages 86–96, Limassol, Cyprus, 2012.
[17] Lugin, S. Detection of hidden defects by lateral thermal flows. NDT&E International, 56:48–55, 2013.
IT APPLICATIONS