detection of implied harmony changes in triadic melodies · avoided by making the melodies triadic,...
TRANSCRIPT

Music Perception © 1994 by the regents of the
Spring 1994, Vol. 11, No. 3, 243-264 university of California
Detection of Implied Harmony Changes in Triadic Melodies
JOHN R. PLATT & RONALD J. RACINE McMaster University
Three experiments investigated the cues used by musicians and nonmusi- cians asked to rate their confidence that an implied harmony change had or had not occurred at a specified point in pseudo-randomly generated, isochronous, triadic melodies that conformed to the rules of elementary classical harmony. In the first experiment, a single melody note followed the putative point of harmony change, and subjects' responses were predictable on the basis of whether this note was contained in the previ- ous triad and the size of the melodic interval between this note and the one preceding it. Musicians were relatively more influenced by the former factor, and nonmusicians, by the latter one. In the second experi- ment, five to seven melody notes followed the putative point of har- mony change, which greatly reduced control by the harmonic relation- ship of the first of these to the previous triad, but the effect of melodic interval size persisted. The third experiment verified the findings of the first two by using the cues that had been identified in them as design variables and evaluating their effect with conventional analytic statis- tics. This experiment also parametrically manipulated the number of notes after the putative point of harmony change and showed that maximum confidence concerning the occurrence of an implied harmony change was reached with the first note that did not belong to the previ- ous triad. Possible mechanisms for use of these cues to implied harmony changes are discussed, and directions for future research are indicated.
fairly common skill among even amateur musicians without for- mal musical training is the ability to rapidly detect and identify
implied harmony changes in an ongoing melody line so as to be able to provide a rhythmic, chordal accompaniment. Beyond a bit of theory in- struction concerning what chords are likely to go with what keys, a practi- tioner usually acquires this skill by trial and error and is unable to provide much information about how it is performed. If pressed, the skilled individ- ual will usually say something not much more informative than that he/she can just hear the implied chord changes.
Requests for reprints may be sent to John R. Platt, Department of Psychology, McMaster University, 1200 Main Street West, Hamilton, Ontario, Canada, L8S 4K1.
243

244 John R. Platt & Ronald J. Racine
Several investigators (Ebcioglu, 1988; Widmer, 1992) have recently de- veloped artificial intelligence models for limited instances of this skill. As useful as these models are, their authors correctly indicate that the models make no claim to mirror the exact structure of human perceptual pro- cesses. Even if such models provided an accurate description of the cues and processes people use to perform this skill, that could only be verified by experimental investigation. So far as we know, no one has reported experimental analyses of this skill. A complete experimental analysis of this harmony-inference skill would first identify the cues that skilled indi- viduals use to detect and identify implied harmony changes and then elucidate the perceptual and cognitive processes that use these cues to achieve a harmonic accompaniment that fits and keeps pace with a novel melody line. Such an analysis would not only add an example to the relative short list of "real- wo rid" skills that have been successfully ana- lyzed, but should also facilitate more direct instruction in this skill by, for example, making it possible to inform would-be practitioners of relevant cues.
Experimental analysis of such a skill is a potentially daunting task that can be aided both by analyzing the skill and breaking it down into compo- nent skills that can be treated separately and by rationally limiting the range of potential variables for initial investigation. A similar problem and solution has been discussed by Widmer (1992) in the context of his artifi- cial intelligence approach. The harmony-inference skill would appear to be analyzable into at least two components: (1) detection that a harmony change is implied and (2) identification of the new harmony. The separabil- ity of these two components is not only intuitively appealing, but also appears to be realistic, especially during acquisition of the skill when the would-be practitioner often correctly detects, but incorrectly identifies, implied harmony changes. Widmer makes a similar separation of skills in his artificial intelligence model by segregating rules that state the condi- tions under which the current note in a melody calls for a change of harmony from rules that suggest chords that might go well with the cur- rent note in the melody. The present studies examined the detection compo- nent of the harmony-inference skill.
Probably the most familiar form of harmony to Western listeners is elementary classical harmony in which a melody is harmonized by triads built on the tonic, dominant, and subdominant notes of the diatonic scale for the current key of the melody. The resulting triads are usually referred to as the I, V, and IV chords, respectively. This type of harmony character- izes Western arts music of the baroque and classical periods, as well as much of Western folk and popular music. The present studies used this familiar form of harmony.
Even when interest is confined to mere detection of implied harmony

Implied Harmony Changes in Triadic Melodies 245
changes within the context of elementary classical harmony, the number of potential cues that a listener might use is quite large. The most obvious potential cues involve the succession of pitch classes in the melody, particu- larly with respect to their membership in the I, V, and IV chords. However, this is complicated by the fact that most melodies contain pitch classes in addition to those contained in the triad that harmonizes the current seg- ment of the melody. There may also be additional cues to harmony changes in the metrical structure of a melody (e.g., implied harmony changes may be more likely to occur between measures or on strong beats), in the duration of particular notes of the melody (e.g., implied harmony changes may be more likely to occur after long-held notes), or even in the phrasing of sung or remembered lyrics for the melody.
In order to keep the variable space for initial investigation manageable, all melodies were isochronous to avoid possible metrical and temporal cues for implied harmony changes. In an effort to avoid possible lyrical phrasing cues, melodies were pseudo-randomly generated and no lyrics were suggested. Complications arising from nonharmonic notes were also avoided by making the melodies triadic, that is, all melody notes belonged to pitch classes contained in the triad that would harmonize the current
segment of the melody. Such triadic melodies are infrequent in the musical literature, but do occur. Other melodies conforming to elementary classi- cal harmony are often viewed as triadic melodies that have been orna- mented with nonharmonic notes (Hepner, 1979).
Experiment 1
The first experiment in this series examined detection of implied har-
mony changes in pseudo-randomly generated nine-note melodies in which the last note sometimes did and sometimes did not imply a harmony change. All melodies were triadic in the key of C major. In addition to the musical training of the subjects, the experimental variables were the begin- ning and ending triads of the melody, the last melody note from the
beginning triad, the melody note from the ending triad, and the direction of the melodic interval between these two melody notes (ascending or
descending).
METHOD
Subjects
The subjects for this experiment were 24 students from an introductory psychology class. The ages of these subjects were from 18 to 38 years, with a median of 20 years. Half the subjects, three men and nine women, had at least 4 years of formal musical training,

246 John R. Platt & Ronald J. Racine
with a range of 4-14 years and a median of 8.5 years. This group of subjects is referred to as the musicians. The other half of the subjects, uve men and seven women, had no formal musical training and are referred to as nonmusicians.
Apparatus
Subjects were run singly in a small AEC sound-attenuating chamber while they were wearing AKG Model K340 earphones, through which all musical stimuli were presented. A Yamaha CX5M Music Computer controlled the experiment, generated the stimuli, and recorded subjects' responses. Musical stimuli were voiced by an FM-synthesized piano voice in the CX5M and set to a level of approximately 70 dB S PL by an NAD Model 3020e stereo amplifier. Visual stimuli appeared on a Hitachi Model CM- 14 18 video monitor that was visible through a window in the chamber. Subjects indicated response choices by using a Yamaha mouse on the small table in front of them to move a cursor on the monitor screen to the desired choice and clicking the mouse button.
Stimuli
Each 9-note melody was isochronous with a tempo of 100 notes/min. The first 8 notes of the melody came from one triad (Cl) in the key of C major (i.e., C, F, or G major); and the last note, along with a change in the color of the monitor screen from green to red, came from the same or a different triad (C2) in the same key. The beginning triad sounded as a chord for 1.0 s and terminated 0.5 s before the melody began.
Melodies were constructed by using all possible combinations of C-, F-, and G-major triads for the beginning and ending triads, as well as all possible combinations of the last note (Nl) from the beginning triad (root, third, or fifth), the single note (N2) from the ending triad, and the direction of the melodic interval between them (ascending or descend- ing) for a total of 162 melody types. The chord preceding the melody and the last two notes of the melody were voiced in the octave above middle C unless the last two notes of the melody were of the same pitch class, in which case Nl was in the octave above middle C and N2 was an octave higher and lower.
Although the last two notes of the melody were set by design, the preceding seven notes were generated by a random walk that proceeded backward from the 8th note with melodic intervals of one triadic scale step. Each interval ascended or descended with equal probability. The resulting "compositions" sounded suitably melodic to our ears.
Procedure
Subjects initially filled out a questionnaire detailing their age, sex, and musical experi- ence. It was then explained to the subject that melodies are usually accompanied by chords that provide a harmony, and an example melody from the experiment, accompanied by the appropriate chords, was presented. Two further examples were then presented without chordal accompaniment. The first of these contained an implied harmony change between the last two notes, and the second did not. Interrogation of the subjects indicated that even the nonmusicians had no difficulty understanding the idea of implied harmony changes.
The subject was next told that a number of melodies like the ones in the examples would be presented and that in each case we wished him/her to determine whether a chord change would be needed between the last two notes of the melody. The subjects were instructed to indicate their judgments on a five-point rating scale where 1 = certain there was no change, 2 = think there was no change, 3 = no idea, 4 = think there was a change, and 5 = certain there was a change.
Each subject was then presented with three instances of each of the 162 melody types,

Implied Harmony Changes in Triadic Melodies 247
for a total of 486 trials divided equally between two sessions run at least a day apart. Each subject received a unique random ordering of the melodies. Trials were self-paced in that each trial was initiated by the subject clicking the mouse in a "start box" on the video monitor, and subjects were encouraged to "take a break" if they became fatigued. A session typically consumed a little more than an hour.
RESULTS AND DISCUSSION
Use of Rating Scale
We had some concerns about whether the subjects would use the full range of the rating scale and whether musicians and nonmusicians would use it in a similar manner. Figure 1 plots separately for musicians and nonmusicians the percentage of trials on which they used each value on the
rating scale. As can be seen, both groups did indeed use the full range of the scale, although a value of 3, reflecting total uncertainty, was hardly ever used by any subject. The latter simply indicates that the task was not too difficult for our subjects. The principal difference apparent in this
figure between musicians and nonmusicians is that the former were some- what more confident in their judgments, as indicated by a relatively greater frequency of values of 1 and 5, at the expense of values of 2 and 4. This difference would certainly be expected on the basis of differences in musical training. One might also expect the ratings of nonmusicians to be somewhat more variable than those of musicians, which was the case.
Fig. 1. Percentage of trials on which musicians and nonmusicians used each rating scale value in Experiment 1.

248 John R. Platt & Ronald J. Racine
Analysis of Variance of Mean Ratings
For each subject and trial type, a mean and standard deviation of the three available ratings was computed. The initial attempt to analyze these data consisted of a mixed-design analysis of variance on these mean ratings that used the design variables of the experiment. The analysis of variance yielded a large number of significant main effects and interac- tions. Some of the main effects and lower-order interactions were inter- prétable, but relatively uninteresting with respect to the current goal of identifying the cues that subjects used to decide whether or not a har- mony change was implied. Most of the higher-order interactions resisted extensive attempts to interpret them. The problem is that the stimulus dimensions on which the subjects based their judgments bore no simple relationship to the design variables of the experiment. This analysis is brought up only to make the methodological point that even though analysis of variance tends to be the experimental psychologist's favorite data analysis technique, it is useful only for showing what stimulus di- mensions are controlling a subjects behavior if the experimenter already knows, or correctly guesses, what those dimensions are and makes them the design variables of the experiment.
Exploratory Data Analysis
In light of the problems just discussed, various exploratory and categori- cal data analysis techniques were used in an attempt to find what dimen- sions of the stimuli were controlling the subjects' judgments. These analy- ses concentrated on the data of the musicians because psychomusicological studies invariably find their judgments to be more consistent than those of nonmusicians, and hence it is easier to identify patterns in their data.
The key was finally provided by a hierarchical cluster analysis of the trial types in the experiment. Each of the 162 trial types was characterized by two variables: the mean rating musicians assigned to it and the mean of standard deviations of ratings for each musician for that trial type. The trial types were then clustered by using the average linkage method in SPSS/PC + and a Euclidian distance measure. The resulting dendrogram showed four distinct clusters of trial types.
Extensive examination of the membership of these clusters showed that the most highly rated cluster (mean ratings from 4.17 to 5.00) consisted of instances in which N2 was not a member of chord 1 (Cl), that is, the last note was not a member of the initial triad. All members of the remaining three clusters were trial types in which either (1) the triad did not change from Cl to chord 2 (C2), or (2) C2 did change from Cl but N2 was also a member of Cl. In either case, a harmony change was of course possible

Implied Harmony Changes in Triadic Melodies 249
but was not required. The most highly rated of these three clusters (mean ratings from 2.00 to 2.94) consisted mostly of trial types in which Nl and N2 were of the same pitch class, so that there was an octave interval between them, and N2 was never the root of Cl. The next most highly rated cluster (mean ratings from 1.33 to 1.94) consisted of trial types in which the melodic interval between Nl and N2 was a perfect fifth or greater. The lowest rated cluster (mean ratings from 1.00 to 1.42) con- sisted of trial types in which either the melodic interval between Nl and N2 was less than a perfect fifth, or N2 was the root of Cl.
These characterizations of the clusters of trial types suggest strongly that the two principal determinants of the musicians' ratings were the harmonic
relationship of N2 to Cl and the size of the melodic interval between Nl and N2. The cluster analysis does not provide a very suitable way to show this result for several reasons. First, the relevant dendrogram is extremely large and complex, and it can be interpreted only by looking at each trial
type one by one and abstracting a characterization of its similarity to other trial types in the same cluster and its differences from trial types in other clusters. In addition, the resulting conclusions give only an indication of the likely identity of the controlling stimulus dimensions and in no way measure their relative degree of influence, the functional relationships of the ratings to the dimensions, or the statistical significance of the effects.
Quadratic Surface Fits
In order to obtain a more suitable representation of the dependence of the
ratings on the harmonic relationship of N2 to Cl and the size of the melodic interval between Nl and N2, the mean ratings of musicians and non- musicians for each trial type were separated and scatter plotted against these two variables in three dimensions. We then fitted quadratic surfaces of the form z = b0 + bxx + b2y + b3x2 + b4xy + b5y2 by using the nonlinear estimation module in the Statistica software package. In this expression z
represents the mean rating, x the melodic interval size between Nl and N2 in semitones, and y the harmonic relationship between N2 and Cl using a reversed ordinal scale in which 1 = N2 is the root of Cl, 2 = N2 is the fifth of Cl, 3 = N2 is the third of Cl, and 4 = N2 is not a member of Cl. The values b0 through b5 are best-fitting quadratic coefficients. The value of b0 is the zero intercept of the quadratic surface, bx is linear effect of x, b2 is the linear effect of y, b3 is the amount of curvature of the surface across values of x, b4 is the interaction of x and y, and b5 is the curvature across values of y.
Such quadratic surfaces will fit any function of x and y so long as there is no more than a single inflection on either dimension. Graphically they provide a clear picture of the relationships between the variables in the scatter plots, and their coefficients provide a quantitative description of
250 John R. Platt & Ronald J. Racine
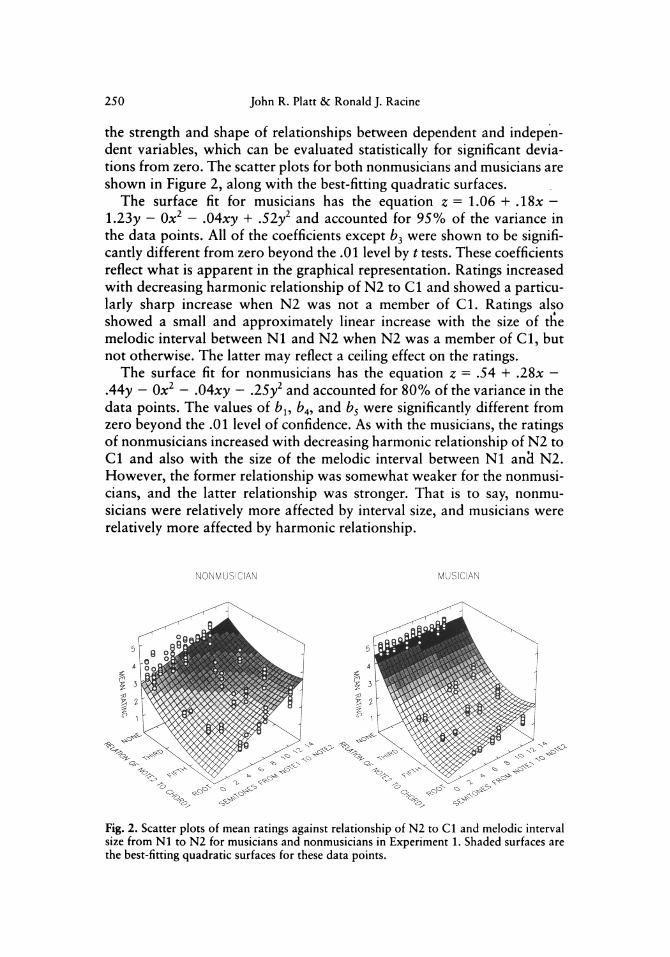
the strength and shape of relationships between dependent and indepen- dent variables, which can be evaluated statistically for significant devia- tions from zero. The scatter plots for both nonmusicians and musicians are shown in Figure 2, along with the best-fitting quadratic surfaces.
The surface fit for musicians has the equation z = 1.06 + .18* -
1.23y - Ox2 - ,04xy + ,52y2 and accounted for 95% of the variance in the data points. All of the coefficients except b3 were shown to be signifi- cantly different from zero beyond the .01 level by t tests. These coefficients reflect what is apparent in the graphical representation. Ratings increased with decreasing harmonic relationship of N2 to Cl and showed a particu- larly sharp increase when N2 was not a member of Cl. Ratings also showed a small and approximately linear increase with the size of the melodic interval between Nl and N2 when N2 was a member of Cl, but not otherwise. The latter may reflect a ceiling effect on the ratings.
The surface fit for nonmusicians has the equation z = .54 + .28* -
A4y - Ox2 - .04xy - .25y2 and accounted for 80% of the variance in the data points. The values of bl9 fo4, and b5 were significantly different from zero beyond the .01 level of confidence. As with the musicians, the ratings of nonmusicians increased with decreasing harmonic relationship of N2 to Cl and also with the size of the melodic interval between Nl ancl N2. However, the former relationship was somewhat weaker for the nonmusi- cians, and the latter relationship was stronger. That is to say, nonmu- sicians were relatively more affected by interval size, and musicians were relatively more affected by harmonic relationship.
Fig. 2. Scatter plots of mean ratings against relationship of N2 to Cl and melodic interval size from Nl to N2 for musicians and nonmusicians in Experiment 1. Shaded surfaces are the best-fitting quadratic surfaces for these data points.

Implied Harmony Changes in Triadic Melodies 251
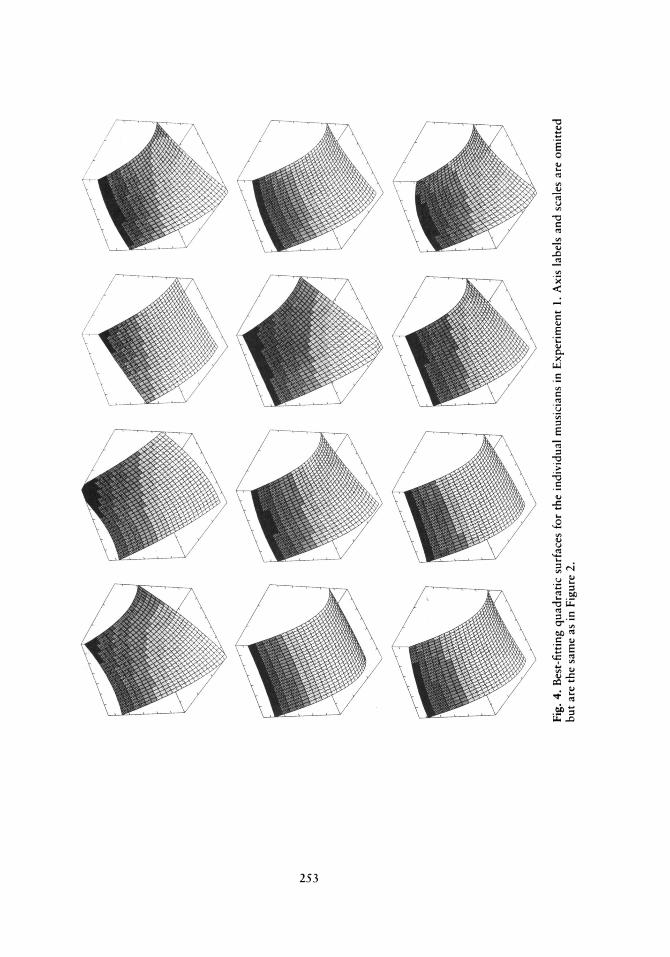
The excellent predictability of mean ratings from the harmonic relation- ship of N2 to Cl and the size of the melodic interval between Nl and N2 could be an artifact of averaging together the ratings of a large number of sub- jects by using a diversity of different cues to decide when a harmonic change was implied. To check this possibility, quadratic surface fits like those in Fig- ure 2 were made for each individual subject in the experiment. The resulting fits are shown in Figures 3 and 4 for nonmusicians and musicians, respec- tively. To save space and improve readability, the axis labels and scale values have been omitted from these figures, but they are the same as in Figure 2. Also no data points are shown, as they are necessarily highly variable because of the small number of observations (three) on which each point is based.
The nonmusician shown in the upper left corner of Figure 3 was clearly not using the cues so far identified, and apparently was simply assigning rat-
ings randomly. The remaining 11 subjects all appear to be basing their judg- ments on the two cues we have identified, so that the quadratic surface fits ac- counted for anywhere from 37% to 91% of the variance in their data points, with a median value of 63%. Some of these subjects were relatively more controlled by the harmonic relationship between N2 and Cl, the extreme case being the first subject in the second row, whose data look almost like the
group data for musicians. However, most of these nonmusicians were more
strongly affected by the size of the melodic interval between Nl and N2, the most extreme case being perhaps the last subject in the second row.
All of the musicians shown in Figure 4 displayed strong control by the harmonic relationship of N2 to Cl. A few, like the first subject in the second row, showed little if any control by the size of the melodic interval between Nl and N2, but most did. The quadratic surface fits accounted for anywhere from 60% to 93% of the variance in the musicians' data
points with a median value of 86%.
Discussion
Within the confines of the short isochronous triadic melodies used in this experiment, musicians and nonmusicians alike appeared to base their
judgments of whether the last note of the melody implied a harmony change on the harmonic relationship of that note to the preceding triad and the size of the melodic interval between that note and the one preced- ing it. Musicians relied relatively more on the former cue and nonmusi- cians more on the latter.
The importance of the harmonic relationship of the current note to the
preceding triad should come as no surprise because this is the "correct" cue in a music theoretic sense. On this same basis it might have been
predicted that subjects with formal musical training would be better able to use this cue. What is perhaps a bit more surprising is how well this cue

C/5
JJ
«
to <u
-Û J2 i£
< T- (
c
I X
tu
c .2 'G 3
|
3
72 ">
<v
J . 0 Si
s^ u.S
2 E 3 CJ & (a
4-* 4-1
i|
u, o
252
1 o
j8
*T3 C <n
<u CO
'>< <
C <u E
'V, (U
X UJ c t« c
3 E
3
>
c
<u
8
3^' y «
-a pu
M C <u
"5 E
253
254 John R. Platt Oc Ronald J. Racine
was used even by most subjects with no formal musical training. It is also impressive that subjects were so sensitive to this cue as to be more certain that a harmony change was not implied when the melody note was the root, as opposed to the third or fifth of the preceding triad.
The biggest surprise in our results was the relative importance of me- lodic interval size as a cue to implied harmony change. If this effect had occurred only for nonmusicians, one might be tempted to speculate that they knew very little about implied harmony changes and were simply looking for any detectable change in the melody. Because the melodies were isochronous, about the only thing left for the nonmusicians to grasp at might have been a large interval jump. However, the musicians should have known better, and did indeed use this cue less, but most were clearly affected by it. We are thus inclined to take this cue seriously. As there seems to be no basic dictum in music theory that associates implied har-
mony changes with melodic interval size, it may be that this is a statistical
property of traditional Western music that has escaped formalization. This
speculation would require verification by someone with access to a large musicological data base. The prediction to be tested is that the probability of an implied harmony change is a perhaps noisy but increasing function of melodic interval size across a wide variety of Western music.
Experiment 2
Perhaps the most limiting aspect of the stimuli used in Experiment 1 is the fact that only a single melody note was presented after the putative harmony change. Even if a harmony change was implied by design, on some occa- sions the single note from the new triad was also a member of the preceding triad because the root of the V chord is also the fifth of the I chord and the root of the I chord is also the fifth of the IV chord. On these occasions, there was no good reason for the subjects to infer a harmony change, and they usually did not. In the more realistic situation in which subjects hear addi- tional notes from the new triad, the issue arises as to how they would use these additional notes in making judgments about the putative point of
harmony change. The present experiment used 12-note melodies with a
putative harmony change at the fifth, sixth, seventh, or eighth note so that
anywhere from five to eight notes were presented from the final triad.
METHOD
Subjects
The subjects for this experiment were 28 students from the same introductory psychol- ogy class used in Experiment 1, and the group had a similar distribution of age and sex.

Implied Harmony Changes in Triadic Melodies 255
Half of these were nonmusicians with no formal musical training. The remaining 14 were musicians with 4-12 years of formal musical training. The median of 6.5 years of training was 2 years less than for the musicians in Experiment 1.
Apparatus
The apparatus was the same as that used in Experiment 1.
Stimuli
Each 12-note melody was isochronous with a tempo of 100 notes/min and was voiced by the same FM-synthesized piano voiced used in Experiment 1. The first 4-7 notes of the melody came from one triad (Cl) in the key of C major; and the remaining notes, along with a change in the color of the monitor screen from green to red, came from the same or a different triad (C2) in the same key. The beginning triad sounded as a chord for 1.0 s and terminated 0.5 s before the melody began.
Melodies were constructed by using all possible combinations of C-, F-, and G-major triads for Cl and C2, as well as all possible combinations of the last note (Nl) from Cl and the first note (N2) from C2, and the direction of the melodic interval between them for a total of 162 trial types as in Experiment 1. Once again the chord preceding the melody and notes Nl and N2 were voiced in the octave above middle C unless these 2 notes were of the same pitch class, in which case Nl was in the octave above middle C and N2 was an octave higher or lower.
Although Nl and N2 were set by design, the preceding and following notes were again generated by a random walk in which successive notes ascended or descended by one triadic scale step with equal probability. One such random walk proceeded backward from Nl and another proceeded forward from N2.
Procedure
Subjects initially filled out the same questionnaire used in Experiment 1 and received the same instructions and examples, modified only to reflect the longer melody length and variability in the location of the putative harmony change. The same five-point rating scale was again used.
Each subject was then presented with three instances of each of the 162 melody types for a total of 486 trials divided equally between two sessions run at least a day apart. On each trial the putative harmony change occurred with equal probability (.25) at either the fifth, sixth, seventh, or eighth note of the melody. Each subject received a unique random ordering of the melodies, and trials were again self-paced.
RESULTS AND DISCUSSION
Once again, the mean ratings of musicians and nonmusicians were
separated and scatter plotted in three dimensions against the harmonic
relationship of N2 to Cl and the size of the melodic interval between Nl and N2. Under the conditions of the present experiment, it was also neces-
sary to separate melodies for which the triad actually changed from those for which it did not because, whether or not N2 was also a member of Cl, the remaining notes provided additional (and sometimes conflicting) infor- mation as to whether an implied harmony change had occurred. Of course

256 John R. Platt & Ronald J. Racine
for melodies in which the triad did not change from Cl to C2, cases in which N2 bore no harmonic relation to Cl were not possible. For melo- dies in which the triad did change from Cl to C2, there could be no cases in which N2 was the third of Cl because thirds in elementary classical harmony are not shared by any other triad in the same key.
These scatter plots, along with best-fitting quadratic surfaces, are shown in Figure 5. Looking first at the musicians, when the triad did not
change from Cl to C2, the best-fitting surface was z= .32 + .30* +
.15y - .Olx2 - .0\xy + .Oly2. This surface accounts for 71% of the vari- ance in the data points and the bx and b3 coefficients differ from zero be-
yond the .001 level of significance, while all others fall far short of any con- ventional level of significance. That means that musicians false alarmed an
implied harmony change as an increasing function of the size of the me- lodic interval between Nl and N2. The harmonic relation of N2 to Cl = C2 was irrelevant.
When the triad did change from Cl to C2, the best-fitting surface for musicians was z = 2.83 + .09* + A9y - .003x2 - .03xy + .08y2. This surface accounted for 51% of the variance in the data points, and the only coefficients that differed significantly from zero were b0 and b4. The sizable
b0 coefficient simply reflects the fact that musicians gave overall higher ratings when the triad actually did change from Cl to C2 than when it did not. The small but significant bA coefficient reflects curvature in the surface as a joint function of x and y.
Turning to the nonmusicians, when the triad did not change from Cl to C2, the best fitting surface was z = .94 + .31* + A2y - .Olx2 +
.OOlxy - .04y2. This surface accounted for 84% of the variance in the data points, and the è0, bu and b3 coefficients differed from zero beyond the .01 level of significance. That is to say, when the triad did not change from Cl to C2, the nonmusicians showed an even larger increase in false- alarm tendency with increasing size of melodic interval between Nl and N2 than did the musicians. As with the musicians, the harmonic relation- ship of N2 to Cl = C2 was irrelevant.
When the triad did change from Cl to C2, the best-fitting surface for the nonmusicians was z = 2.16 + .09* + A6y + .002x2 - .Olxy + .04y2. This surface accounted for 56% of the variance in the data points, and the only coefficient that differed significantly from zero was b0. This means that the nonmusicians showed no statistically significant control by the relation- ship of N2 to Cl or the size of the melodic interval between Nl and N2 when the triad actually changed from Cl to C2, although both tendencies are apparent in the data.
To economize space, quadratic surface fits for individual subjects are not presented for this experiment. Such fits were somewhat more variable from subject to subject than in Experiment 1, presumably due to the much weaker

Implied Harmony Changes in Triadic Melodies 257
Fig. 5. Scatter plots of mean ratings against relationship of N2 to Cl and melodic interval size from Nl to N2 in Experiment 2. Separate plots are shown for musicians and nonmusicians, and for trials on which the triad did and did not change from Cl to C2. Shaded surfaces are the best-fitting quadratic surfaces for these data points.
control of ratings by the harmonic relationship of N2 to Cl, but do nothing to change the conclusions based on the group data shown in Figure 5.
The results of this experiment show that when subjects hear several notes after the putative harmony change, control of their judgments about whether an implied harmony change has occurred by the harmonic relation- ship of the first of these notes to the preceding triad is greatly reduced, but is still somewhat stronger for musicians than for nonmusicians. This reduc- tion simply means that subjects are using the additional notes to make their judgments in respect to the putative point of harmony change. This is particularly clear in cases in which the triad changes from Cl to C2, but the first note from C2 is also a member of Cl. Under these circumstances, a harmony change is only demanded when additional notes from C2 are

258 John R. Platt ÔC Ronald J. Racine
presented. The main question posed by these findings is the issue of exactly how many additional notes the subjects use in arriving at their judgments.
Although control of ratings by the harmonic relationship between N2 and Cl was greatly reduced in the present experiment, control by the size of the melodic interval between Nl and N2 persisted and was again stronger for nonmusicians than for musicians. In the present experiment, this relationship obtained statistical significance only when the triad did not change from Cl to C2. This indicates that when subjects hear several notes after the putative harmony change, the size of the melodic interval from Nl to N2 is primarily a determinant of false alarms or false positives concerning an implied harmony change.
Experiment 3
Analyses of the first two experiments were entirely ad hoc in that the two variables that appear to account for the ratings were not design variables, but were discovered by various exploratory techniques of data analysis. We thus desired to directly manipulate these variables experimentally and evaluate their effects by more conventional analytic statistics. In addition, the results of Experiment 2 raise the question of exactly how many melody notes after a putative harmony change contribute additional strength to the
certainty that a harmony change was or was not implied. This question would be most simply answered by observing the effects of parametrically manipulating the number of melody notes that follow the putative har-
mony change. The final experiment attempted to fulfill these goals.
METHOD
Subjects
Subjects for this experiment were 24 students from the same introductory psychology class used in Experiments 1 and 2, and the group had similar distributions of age and sex. Half of these subjects were musicians with 5-13 years of formal musical training and a median of 9.5 years. This median is slightly greater than that for Experiment 1. The remaining 12 subjects were nonmusicians with no formal musical training.
Apparatus
The apparatus was the same as for Experiments 1 and 2.
Stimuli
The stimuli for this experiment consisted of 192 melodies composed of anywhere from 9 to 15 equal-duration notes voiced by the same FM-synthesized piano used in the previous
Implied Harmony Changes in Triadic Melodies 259
experiments. All trials began with presentation of a C-major triad for 1.0 s, followed by 0.5 s of silence. Eight notes from this triad (Cl) were then presented at a rate of 100 notes/sec. A change in the screen color of the video monitor from green to red signaled this point in the melody, and additional notes came from an F- or G-major triad (C2) in half the trials, but continued to come from a C-major triad in the other half. This variable was crossed with three others: the size of the melodic interval (Nl to N2) at this point of putative harmony change could be small (4 semitones), medium (8 semitones) or large (11 or 12 semitones); the first note from C2 (N2) could be maximally harmonically related to Cl (its root) or minimally related (its third if Cl = C2 or not a member of Cl otherwise); and 1, 2, 3, or 6 notes could be presented from C2.
The complete design was thus a 2 between by 2 by 3 by 2 by 4 within, where the respective variables were musical training of the subjects, whether a melody contained an implied har- mony change, size of the melodic interval at the putative point of harmony change, relation of the first note from the final triad to the beginning triad, and number of notes presented from the final triad. There were 48 trial types specified by the experimental design, and each type was repeated 4 times with different pseudorandom melodies to obtain 192 trials.
The melody preceding Nl was again produced by a random walk that proceeded back- ward in triadic scale steps with equal probability of ascending or descending at each step. The melody notes that followed N2 were generated in a similar manner, with the additional provision that no note was repeated until all three pitch classes in C2 had occurred.
Procedure
Subjects initially filled out the same questionnaire used in the first two experiments and received the same instructions and examples, modified only to reflect the stimuli used in the present experiment. The 192 trials were then run in a single session that typically lasted a little less than 1 hr. At the end of each trial, the subject rated his/her confidence that an im- plied harmony change had or had not occurred by using the same five-point scale used in the previous experiments. A unique random ordering of the melodies was used for each subject.
RESULTS AND DISCUSSION
A mean rating for each subject over the four occurrences of each trial type was computed. These means were analyzed by using a 2 between by 2 by 3
by 2 by 4 within mixed-design analysis of variance on the design variables. All of the main effects and a number of the two- and three-way interactions of this analysis were statistically significant. A good picture of the important results can be had by examining the effect of any combination of variables in the highest order significant interaction in which they participate.
There was a significant interaction between the size of the melodic interval between Nl and N2 and the subjects' musical training [F(2,44) =
10.60, p = .0002]. This interaction is graphed in Figure 6 and shows that
ratings of confidence that a harmony change was implied increased with the size of this melodic interval, but more so for nonmusicians than for musicians, as in the previous experiments.
The size of the melodic interval between Nl and N2 also entered into a
three-way interaction with whether or not the triad changed from Cl to C2 and the harmonic relation of N2 to Cl [F(2,44) = 7.33, p = .0018], as shown in Figure 7. One can see that ratings were higher overall when the

260 John R. Platt & Ronald J. Racine
triad did change from Cl to C2 and with larger melodic intervals between Nl and N2. The three-way interaction results from a much smaller effect of interval size when N2 was not a member of Cl than when it was the third or root of that triad. This interaction may represent a ceiling effect on the rating scale, as was suggested in Experiment 1.
Figure 8 shows the significant interaction between whether the triad
changed from Cl to C2, the harmonic relationship of N2 to Cl, and the musical training of the subjects [P(l,22) = 5.35, p = .0304]. When no
harmony change was implied, nonmusicians false alarmed to a greater extent than musicians, and both showed only a very small effect of the harmonic relationship of N2 to Cl. When a harmony change was implied, ratings were higher overall, and musicians showed much more effect of the harmonic relationship than did nonmusicians. This is also in general agree- ment with the findings of the first two experiments.
Figure 9 shows the significant interaction between whether the triad
changed from Cl to C2, the harmonic relationship of N2 to Cl, and the number of notes that followed the putative point of harmony change [F(3,66) = 11.49, p < .0001]. When no harmony change was implied, ratings were uniformly low, showing no effect of number of notes and
Fig. 6. Mean ratings for musicians and nonmusicians in Experiment 3 as a function of size of the melodic interval from Nl to N2.

Fig. 7. Mean ratings for trials on which the triad did and did not change from Cl to C2 in Experiment 3 as a function of the size of the melodic interval from Nl to N2 and the harmonic relationship of N2 to Cl.
Fig. 8. Mean ratings for musicians and nonmusicians in Experiment 3 as a function of the harmonic relationship of N2 to Cl and whether the triad changed from Cl to C2.

262 John R. Platt & Ronald J. Racine
Fig. 9. Mean ratings in Experiment 3 as a function of whether the triad changed from Cl to C2, the harmonic relationship of N2 to Cl, and the number of notes presented from C2.
little effect of the harmonic relationship of N2 to Cl. When a harmony change was implied and N2 was not a member of Cl, ratings were uni- formly high and showed no effect of the number of notes presented. How- ever, when the triad changed and the only note presented from C2 was also a member of Cl, ratings were of course no higher than if the triad had not changed. When additional notes were presented from C2, these ratings increased, but not to the level that was obtained when N2 did not belong to Cl and not as an increasing function of additional notes. In other words, this result indicates that maximal confidence as to the occurrence of an implied harmony change was obtained from a single note after the putative point of harmony change, unless that note was a member of Cl, in which case maximum confidence was obtained from one additional note. In this latter case, however, confidence that a harmony change was implied never became as high as if N2 were not a member of Cl.
General Discussion
The results of Experiment 3 provide an experimental verification of the ad hoc analyses of the first two experiments using the variables of

Implied Harmony Changes in Triadic Melodies 263
interest as design variables and relying on conventional analytic statistics to support the conclusions. The primary conclusion is that subjects asked to detect implied harmony changes in pseudo-randomly constructed, iso- chronous, triadic melody segments conforming to the rules of elementary classical harmony do so on the basis of the harmonic relationship of the current note to the preceding triad and the size of the melodic interval between the current note and the one preceding it. Musicians rely rela- tively more on the first of these cues, and nonmusicians are more suscepti- ble to the latter cue.
Even more importantly, Experiment 3 clarifies the role of additional notes following the first one when a harmony change is implied. It appears that with the present stimuli subjects reach maximum confidence that a
harmony change is implied when they encounter the first note that is not a member of the preceding triad. The same would of course not necessarily be true in the context of more typical melodies that contained nonhar- monic notes.
Although the present experiments convincingly identify the cues sub- jects used to detect implied harmony changes, it could be argued that the stimuli are so impoverished as to make the findings uninteresting. It is certainly the case that additional research is needed to identify possible cues to implied harmony changes provided by metrical, rhythmic, lyrical, and temporal factors that were avoided in the present stimuli, but one must start some place, and it seems likely that melodic pitch cues might account for the majority of variance in this skill.
Even restricting consideration to such pitch cues, it could be argued that the present use of triadic melodies trivializes the results. These melodies are of course simply arpeggionated voicings of the triad appropriate to
harmonizing the melody at any particular point. Parncutt (1989, p. 148) has cited a study by Cuddy and Badertscher (1987) as suggesting that "listeners familiar with Western music can extrapolate tonal implications of simultaneous tones (chords) to those of sequential tones (broken chords)." Thus, findings quite similar to the current ones might have resulted from presenting a triad followed by a tone and asking how well the tone went with the triad (the probe-tone technique of Krumhansl, 1990) or by successively presenting two triads and asking subjects to rate their similarity (Stark, 1988). Nevertheless, triadic melodies do occur in the musical literature and provide the theoretical basis for a vast number of melodies that contain additional nonharmonic notes. They thus seem a reasonable starting point for a manageable experimental analysis.
The fact that the present melodies were triadic suggests a possible mechanism by which subjects may have used the harmonic relationship of the current melody note to the preceding triad to cue an implied harmony change. It is tempting to conclude that subjects simply held the three notes of the initial triad in memory and listened for a novel note. This would

264 John R. Platt & Ronald J. Racine
certainly account for the exclusive importance of the first note that was not a member of the preceding triad, but would not work for melodies with nonharmonic notes and would not account for the effect of melodic interval size between the current note and the one preceding it. Another possibility is that subjects held the entire triad in memory simultaneously and determined whether the current note sounded harmonious with it. Such a mechanism might also account for the observed effect of melodic interval size, because subjects often confuse pitch height differences for tonal or harmonic differences, particularly in the absence of extensive musical training (Stark, 1988). Clearly more research is needed to convinc- ingly choose between such possible mechanisms.
The most surprising finding in the present experiments was the effect of melodic interval size as a (not always appropriate) cue for harmonic change. It has already been suggested that there may be a statistical rela- tionship between melodic interval size and implied harmony changes in Western music. After all, large intervals are often used as melodic accents to separate phrases (Jones, 1987), and phrase boundaries are often associ- ated with implied harmony changes. This possibility can be verified only by interrogating a large musicological data base. If such interrogation does not support this conclusion, then less interesting possibilities such as the local novelty of large intervals in the present melodies or a tendency for less musically trained subjects to mistake any change for an implied har- mony change would need to be investigated.1
References
Cuddy, L.L., & Badertscher, B. Recovery of the tonal hierarchy: Some comparison across age and musical experience. Perception & Psychophysics, 1987, 41, 609-620.
Ebcioglu, K. An expert system for harmonizing four-part chorales. Computer Music Jour- nal, 1988, 12, 43-51.
Hepner, L. Dimensions of music. Toronto: Boddington Music Publications, 1979. Jones, M.R. Dynamic pattern structure in music: Recent theory and research. Perception &
Psychophysics, 1987, 41, 621-634. Krumhansl, C.L. Cognitive foundations of musical pitch. New York: Oxford University
Press, 1990. Parncutt, R. Harmony: A psychoacoustical approach. Berlin: Springer- Verlag, 1989. btark, M. 1 he effect of musical experience on the perception of triads. Unpublished doc-
toral dissertation, McMaster University, Hamilton, Ontario, Canada, 1988. Widmer, G. Qualitative perception modeling and intelligent musical learning. Computer
Music journal, 1992, 16, 51-68.
1. This research was supported by NSERC grant A8269 to the first author. We grate- fully acknowledge the technical assistance of Gary Weatherill in programming the present experiments.