detection of autoantigen-specific cd4 t cells in spk
TRANSCRIPT

SUPPLEMENTAL METHODS Detection of autoantigen-specific CD4 T cells in SPK patients 1 and 3. These two
patients were tested multiple times for GAD autoreactive CD4 T cells using previously described HLA class II tetramer-based assays (1;2). In brief, peripheral blood mononuclear cells (PBMC) were separated by gradient centrifugation (Lymphoprep; Nycomed, Oslo, Norway). PBMC were plated in culture media (10% pooled human serum in RPMI containing L-glutamine and HEPES with 1mM pyruvate, penicillin and streptomycin, both at 100 µg/ml) in 24-well plates (3-4 x 10⁶/well). The following peptides were added to the cultures: 1) the modified GAD 555-567 peptide, also known as 557i (NFIRMVISNPAAT); 2) the HA 306-318 peptide (PKYVKQNTLKLAT), a positive control peptide derived from the influenza hemagglutinin antigen; 3) the OspA 161–175 peptide (VLKSYVLEGTLTAEK) is derived from Borrelia Burgdorferi, the causative agent of Lyme disease. This is a rare disease (US incidence ~ 7/100,000, about 29/100,000 in endemic areas) and responses to this antigen are uncommon in the population. Peptides were added to separate wells at 10 µg/mL. Negative control reactions were set up in the absence of peptide. PBMC were cultured for 12-14 days, during which human IL-2 (Hemagen Diagnostics, Inc., Columbia, MD; 1 to 20 final dilution) was added on day 7 and media were replenished between day 9 and 11. The cultured PBMC were counted and a portion of the culture was removed for tetramer analysis. Typically, 100,000-300,000 cells from each in vitro culture were harvested for each tetramer stain. Tetramer was added to each sample at 10 µg/ml and incubated for 2.5 hours at 37 oC, followed by application of fluorescent-tagged antibodies, and incubated on ice for 15-30 minutes. The antibodies used included anti-CD4 (Becton Dickinson, San José, CA, or eBioscience, San Diego, CA), anti-Vb 5.1 (Beckman Coulter, Fullerton, CA), and anti-CD25 (Becton Dickinson or eBioscience). Flow cytometry profiles were generated on either a Becton Dickinson FACSCalibur or FACSVantage flow cytometer after washing with D-PBS containing 1% FBS (Hyclone, Logan, VT). Data analysis was conducted using CellQuest (Becton Dickinson, Franklin Lakes, NJ) and FlowJo (Ashland, OK).
Detection of autoantigen-specific CD8 T cells in SPK patient 2. We tested this patient for (IGRP)-reactive CD8 T cells using a class I HLA-A2 (A*0201) pentamer since she carried HLA class II genes for which there were no relevant tetramers. PBMC were cultured at 2x10⁶ cells per well with IGRP 152-160 peptide at a concentration of 10 µg/ml in 10% pooled human serum. Recombinant human (rh) IL-7 (20 ng/ml) was added to each well at the initiation of the culture period. rhIL-2 (10-20 ng/ml) was added to the wells every other day beginning on day 4 of culture. Well contents were split on days 6 and 10 and sub-cultured with fresh APC on day 14. On day 19, a portion of cells were collected for cytotoxicity assays, and the remaining cells were assayed for pentamer-staining on day 21. We modified the culture techniques in an effort to enhance the detection of presumably infrequent IGRP 152-reactive CD8 T cells in samples obtained subsequent to the additional immunosuppression given to patient 2. CD8 T cells were isolated from PBMC using the Miltenyi CD8 T cell isolation kit II (Miltenyi Biotec, Cologne, Germany) and added to wells coated with 3x10⁶ autologous, adherent PBMC at a ratio of 2:3 T cells: feeder cells. IGRP 152 peptide was added to wells at a 10 µg/ml final concentration of 10 µg/ml. Cultures received 10 ng/ml each of rhIL-7 and rhIL-15 on day 1. On day 7, IL-2 (48 ng/ml) was added to the cultures. Pentamer-staining was performed on day 14. HLA-A*0201 pentamers presenting either influenza matrix protein peptide (MP58) or IGRP 152-160 were synthesized by ProImmune Ltd. (Oxford, UK). Approximately 5x10⁵ cells were stained with 10 µl of indicated pentamer for at least one hour at RT in the dark. Cells were allowed to incubate
©2009 American Diabetes Association. Published online at http://diabetes.diabetesjournals.org/cgi/content/full/db09-0498/DC1.

on ice for an additional 15 minutes after addition of fluorochrome-labeled antibodies to CD8, CD45RA (BD Pharmingen, San Diego, CA) and CCR7 (R&D Systems, Minneapolis, MN). After washing with a solution of 1% BSA, cells were analyzed on a Becton Dickinson FACScalibur flow cytometer. Viable lymphocytes were gated based on size.
Generation and analysis of T cell clones. T cell clones were derived by single-cell sorting of tetramer-positive cells (3). After 2-3 rounds of amplification, wells with positive cell growth were studied to confirm peptide specificity and evaluate cytokine production to antigen response. Specificity of T cell clones was confirmed by standard proliferation assays (3H-thymidine uptake) in response to varying doses of the appropriate peptides. Supernatants were harvested at 48 hours for cytokine analysis (Cytometric Bead Array, Becton Dickinson Biosciences, San Jose, CA). Specificity was further assessed by analysis of tetramer binding. TCR V beta CDR3 sequences for human tetramer-positive CD4 T cell clones were determined by RT-PCR and sequence analysis (4). Briefly, total RNA was isolated from 0.5- 1 x 10⁶ human CD4 T cell clones using an RNeasy Mini Kit (Qiagen, Valencia, CA). Total RNA was Oligo d(T) reverse transcribed into first strand cDNA with a Taqman Reverse Transcription Kit (Applied Biosystems, Foster City, CA). A set of five multiplex PCR reactions covering a majority of the human V beta repertoire was performed as reported by Akatsuka et al. (5), using 75 ng of cDNA per reaction. PCR products were visualized using ethidium bromide stained 2% agarose gels, sequenced using a Big Dye Terminator v1.1 Cycle Sequencing Kit (Applied Biosystems) with either C beta 3’ primer or specific V beta 5’ primers, and then run on an Applied Biosystems 3100 Genetic Analyzer. TCR V beta CDR3 sequence data were analyzed using the IMGT/V-QUEST (http://imgt.cines.fr) web-based program from the Université Montpellier, France (6).
Analysis of pancreas transplant biopsies. Pancreatic tissue from transplant biopsies was fixed in formalin and paraffin-embedded. Positive controls tissues were pancreas, liver, thymus, lymph nodes, tonsils (normal and with chronic tonsillitis, Abnova, Taipei, Taiwan), intestine and breast cancer (Abnova). Negative control reactions were run omitting the primary antibody or the secondary antibody. We used both immunohistochemistry and immunofluorescence techniques.
For immunohistochemistry, tissue sections were stained with the following primary anti-human antibodies: anti-CD3 (1:50, mouse monoclonal F7.2.38; Dako, Carpinteria, CA) anti-CD4 (1:50, mouse monoclonal 4B12; Leica, Newcastle Upon Tyne, U.K.), anti-CD8 (1:50, mouse monoclonal C8/144B; Dako), anti-CD20 (1:200, mouse monoclonal L26; Dako), anti-glucagon (1:75; rabbit polyclonal; Dako), anti-insulin (1:50; guinea pig polyclonal, Dako), anti-IP-10 (3 ug/ml; rabbit polyclonal, Abcam, Cambridge, MA), anti-MCP-1 (10ug/ml, mouse monoclonal ab9858; Abcam), anti-CD68 (1:100, mouse monoclonal Kp1; Dako) and anti-INF-α (1:50; monoclonal MMHA-2; PBL Biomedical Laboratories, Piscataway, NJ). Several staining protocols required heat-induced epitope retrieval using a pressure cooker at 120°C. For CD3, CD8, CD4 and CD20 staining, slides were treated with antigen retrieval solution S1700 (Dako). For insulin, glucagon, CD3, CD4, CD8, and CD20 stains, immunohistochemistry was performed using the immunoperoxidase method (Histostain Plus; Zymed/Invitrogen, Carlsbad, CA) and the diaminobenzidine (DAB) substrate according to the manufacturer’s protocol using an automated stainer according to the standardized operating procedures of the Transplantation Laboratories and Immunopathology, Department of Surgery, University of Miami. For IP-10, MCP-1, CD68 and INF-α, tissue sections were incubated in 10 mM citrate buffer (pH 6.0) for 10 minutes at 120°C, stained with the same method but using the 3-amino-9-ethylcarbazole (AEC) substrate.
©2009 American Diabetes Association. Published online at http://diabetes.diabetesjournals.org/cgi/content/full/db09-0498/DC1.

Tissue slides stained by immunohistochemistry were examined imaged using a Leica DMLB microscope. Images were taken with a Leica DFC- 420C digital camera (Leica Microsystems, Bannockburn, IL, USA) using the IM50 Image Manager software. Whole images of the tissue sections were obtained with the Mirax Scan 150 (Zeiss, Thornwood, NY).
We used triple-immunofluorescence to examine the expression of caspase-3, Fas and VP-1, an enterovirus capside protein in α- and ß-cells identified by co-staining for glucagon and insulin, respectively. The following heat-induced (120°C) epitope retrieval procedures were used: 5 min in Tris- EDTA (pH 9.0) for caspase-3, 10 min in 1mM EDTA (pH 8.0) for VP-1 and 10 min in 10 mM citrate buffer (pH 6.0) for Fas. The primary antibodies used were or anti-glucagon (1:500; mouse monoclonal K79bB10, Sigma, St Luis, MO or 1:75; rabbit polyclonal; Dako), anti-insulin (ready to use; guinea pig polyclonal, Biogenex Laboratories, San Ramon, CA), anti-caspase-3 (1:50; rabbit polyclonal, Biocare Medical, Walnut Creek, CA), anti-FAS (1:250; mouse monoclonal SC-8009, Santa Cruz Biotechnology, Santa Cruz, CA), and anti-VP-1 (1:100 to 1:700; mouse monoclonal 5-D8/1; Dako). Specific binding was revealed with secondary antibody conjugates against the species of the primary antibodies used (Alexa-Fluor 568 goat anti-guinea pig IgG, Alexa-Fluor 488 goat anti-rabbit IgG, Alexa-Fluor 488 goat anti-mouse IgG, Alexa-Fluor 647 goat anti-mouse IgG, and Alexa-Fluor 647 goat anti-rabbit IgG, all from Invitrogen). Fas and caspase-3 staining were also performed using tyramide amplification to enhance sensitivity (NEN Life Science Products, Boston, MA) according to the manufacturer’s protocol. After washing in PBS, the appropriate secondary antibodies were applied for 1 hour at room temperature (1:400). Double and triple-immunofluorescence stains were carried out sequentially, so the above process was repeated for the second and third primary antibodies. The choice of secondary antibodies was such that the secondary antibodies could only react with their respective primary antibody. Proliferation was assessed by triple-immunofluorescence staining for insulin, CK-19 and Ki-67, as previously reported (Ref. 25 in main text). Stained sections were examined using a Zeiss Axiovert 200M inverted microscope. Images were acquired digitally using a Hamamatsu ORCA-ER camera (Bridgewater, NJ) and the Zeiss Axiovision 4.6.3 software. Confocal microscopy was performed with a Zeiss LSM-510 microscope to confirm colocalization by Z-stack analysis.
Analysis of experimental islet grafts. Formalin-fixed, paraffin-embedded sections of the islet grafts were stained with H&E or with antibodies to human insulin (guinea pig polyclonal, Biogenex, San Roman, CA), glucagon (monoclonal k79bB10, Sigma), and CD3 (rabbit polyclonal, Abcam). Primary antibodies were followed by the appropriate fluorescently labeled secondary antibodies (Alexa Fluor-conjugates, Invitrogen). Staining for CD68, IP-10, MCP-1, and INF-α was performed by immunohistochemistry using the immunoperoxidase method with streptavidin-biotin labeling (Zymed Histostain Plus, Invitrogen). Tissue sections were also stained with antibodies against Caspase-3, and Fas by triple immunofluorescence. The antibodies, reagents and protocols used for the analysis of the experimental islet grafts were identical to those described for the analysis of the pancreas transplant biopsies.
©2009 American Diabetes Association. Published online at http://diabetes.diabetesjournals.org/cgi/content/full/db09-0498/DC1.

SUPPLEMENTAL DATA
Analysis of T-cell clones from SPK patients 1 and 3 We characterized the function of several T-cell clones derived from the GAD-
autoreactive CD4 T-cells identified in patients 1 and 3 at multiple time points on follow-up. A representative T-cell clone obtained from patient 1 is shown in supplemental Fig. S2. This clone was one of 6 clones (supplemental Table S1) derived from the first peripheral blood sample tested following hyperglycemia (sample #1, Fig. 1C and 1D). Antigen specificity is shown by tetramer staining and dose-dependent proliferation in response to the specific GAD peptide. This and the other clones derived from this sample displayed a Th1 profile since the predominant cytokine produced was IFN-γ (Fig. S2). Table S1 shows data from 9 GAD-specific T-cell clones derived from a peripheral blood sample obtained on later follow-up (sample #8, Fig. 1C). This sample was obtained about one year after the patient received additional immunosuppression. These later clones produced much lower IFN-γ levels than the earlier ones and some expressed detectable levels of IL-5 or other Th2 cytokines. All clones derived from the GAD-autoreactive CD4 T-cells identified at both time points expressed the V beta 5.1 TCR chain. However, the CDR3 sequence between clones from these two time points was not identical (Table S1).
Supplemental Table S2 shows T-cell clones from patient 3. Fourteen DRB4*0101-restricted clones were obtained from the first sample studied after the onset of hyperglycemia (sample #1, Fig. 3B, 3C). Most (12/14) of these clones secreted high levels of IFN-γ and TNF-α in response to GAD peptide. A representative clone is shown in supplemental Fig. S3. Some clones also secreted low levels of IL4, IL-5 or IL-10, but these levels were always lower than 15% of the IFN-γ levels produced by those clones. Thus, these clones had a predominant Th1 profile. More DRB4*0101-restricted T-cell clones were obtained three years after re-transplantation and hence additional immunosuppression (sample #5, Fig. 3B, 3C). These clones also secreted Th2 cytokines although at much lower levels than IFN-γ (Table S2). Importantly, TCR analysis showed that clones from both time points used the TCR V beta 9 chain and the identical CDR3 sequence (Table S2), demonstrating the persistence of an oligoclonal population of autoreactive T-cells. Additional clones from patient 3 were restricted by DRB1*0402, expressed the TCR V beta 8 and V beta 6 chains, had similar but not identical CDR3 regions and displayed a heterogeneous cytokine profile (Table S2, clones derived from samples 4 and 5 plotted in Fig. 3B). Other DRB4*0101-restricted clones were derived from sample #8 and predominantly secreted IFN-γ (not shown).
Antigen-specific cytotoxicity studies in SPK patient 2 We tested the specificity and cytotoxic effects of the IGRP-autoreactive CD8 T-cells
obtained from the sample closest to the recurrence of hyperglycemia (sample # 1, Fig. 2C, Fig. 2D). Antigen-specific cytotoxicity of autoreactive CD8 T-cells was assessed using the CyToxiLux® assay (OncoImmunin, Gaithersburg, MD), which measures T-cell induced-caspase activation in fluorescently-labeled, peptide-loaded APC. The autoreactive CD8 T-cells from this patient induced caspase activation in APC loaded with IGRP but not with a control antigen or in the absence of peptide (Fig. S4). The data show that IGRP 152-responsive CD8 T-cells specifically targeted and lysed peptide-loaded cell lines, implying that the IGRP-autoreactive CD8 T-cells from this patient were functional and mediated antigen-specific cytotoxicity.
©2009 American Diabetes Association. Published online at http://diabetes.diabetesjournals.org/cgi/content/full/db09-0498/DC1.

Supplemental transplant biopsy data
Patient 1 Biopsies were taken from the head, body and tail of the transplanted pancreas, as well as
from the transplanted kidney. The pathology report noted no signs of acute rejection (grade 0) in the head of the pancreas. Inter-lobular and intra-lobular fibrosis as well as inflammation of undetermined significance (grade I) were noted in the body of the pancreas transplant. There was minimal evidence of rejection in the tail of the pancreas. There was no evidence of acute rejection in the transplanted kidney, although chronic allograft nephropathy and mild acute tubular necrosis were noted. These findings are common in transplanted patients. The patient continued to maintain pancreas transplant exocrine function and kidney transplant function for the remainder of the follow-up (an additional 5 years following the recurrence of hyperglycemia, for a total follow-up duration of 10 years; the patient passed away following a cerebrovascular accident). Insulitis and ß-cell loss were noted only in the tail biopsy.
Additional images from the pancreas transplant biopsy are provided in Figs. S5-S17. We examined 344 islets that were stained for glucagon, of which 52% (180) did not stain for insulin. Healthy islets and damaged or infiltrated islets (Fig. S5-S8) were seen without a particular lobular distribution in the tail biopsy. T-cell infiltrates in the islets were demonstrated by CD3 staining (Figs. S9-S11). Islet infiltrates contained both CD8 (Figs. S12, S13; 24/57 or 42% of the islets counted) and CD4 T-cells (Figs. S14, S15; 22/66 or 33% of the islets examined). B cell infiltrates were rare (Fig. S16).
Additional stains for macrophages (CD68), Fas, caspase-3, MCP-1, IP-10, IFN-α and VP-1 (Coxsackie B virus) were negative, noting that these analyses were less extensive due to limited tissue availability. As we previously reported (Ref. 25 in main text), we did not identify any replicating ß-cells that were Ki-67 positive; however, there was evidence for potential remodeling/regeneration since many of the ducts examined had insulin-positive cells. A representative example is shown in Fig. S17.
Patient 2 Biopsies were taken from the head and tail of the pancreas transplant. There was
inflammation of undetermined significance (grade I) in the pancreas tail. Supplemental figures show matched sections stained for glucagon, insulin, CD3 and CD20 from the tail of the pancreas and provide additional examples of the observed pathology. It can be appreciated that there were both substantial (Figs. S18-S20) and mild infiltrates (Figs. S21-S24). An example of a heavily infiltrated islet that did not stain for insulin is shown in Fig. S18. Damaged islets with loss of insulin staining are also shown in Figs. S22 and S24. Other islets appeared to have normal ß-cell and insulin content (Figs. S20, S23), consistent with residual C-peptide secretion at the time of biopsy, about a year after the clinical recurrence of hyperglycemia.
We examined 577 islets in the tail of the pancreas and 31 in a smaller fragment from the head. In the tail, 13% (76/577) of glucagon-positive islets did not stain for insulin and 47% (270/577) had T-cell infiltrates. CD3 staining revealed infiltrates in 22% (44/200) of the islets examined, of which 6% (12) did not stain for insulin. CD8 T-cell infiltrates appear to be more common than CD4 T-cell infiltrates, although they were often similar in intensity especially in mild infiltrates (Figs. S25, S26). B cell infiltrates were seen in 4.6% (27/577) of the islets
©2009 American Diabetes Association. Published online at http://diabetes.diabetesjournals.org/cgi/content/full/db09-0498/DC1.

studied. In the head of the pancreas, 35% (11/31) of glucagon-positive islets did not stain for insulin and 32% (10/31) showed predominantly CD8 T-cell infiltrates.
We could not demonstrate macrophages (CD68) or the expression of Fas, caspase-3, MCP-1, IP-10 and IFN-α, but these additional stains (not shown) could only be performed on remaining tissue sections that were largely unaffected and thus not very informative in this regard. However, sparse ß-cells were found to stain with the anti-VP1 antibody directed against an antigen of the Coxsackie B virus (Fig. S27). Approximately 2-3 ß-cells were found to be VP-1 positive in 13/145 (9%) islets examined. We did not identify any replicating ß-cells but also for patient 2 we had previously reported insulin-positive cells in the ducts (Ref. 25 in main text); an example is shown in Fig. S28.
A biopsy was also taken from the kidney transplant. The pathologist noted mild chronic allograft nephropathy, no evidence of acute rejection and signs of chronic calcineurin inhibitor toxicity.
Patient 3 Approximately one year after the development of recurrent diabetes and in the absence of detectable C-peptide secretion, patient 3 received a second pancreas transplant. A biopsy was obtained from the tail of the first pancreas transplant at the time of re-transplantation. Four tissue blocks were examined from the tail biopsy. The pathologist reported mild acute (grade III) and minimal chronic rejection. This level of inflammatory changes is commonly found in pancreas transplant biopsies in the absence of clinical rejection, as in the case of our patient. There was however dramatic and selective ß-cell loss, in keeping with the laboratory findings and clinical features (hyperglycemia and loss of c-peptide with preserved exocrine pancreas transplant function). Pancreatic ß-cells were completely absent in sections from two of the tail fragments examined. Two series of sections obtained cutting at different levels in these two blocks contained 118 and 76 islets, respectively, that stained for glucagon but showed complete lack of insulin staining (supplemental Figs. S29-S34). There was very little insulitis remaining in just a few islets (Figs. S33-S34); residual infiltrates predominantly consisted of CD8 T-cells. In a third block, 46 islets were counted that did not demonstrate insulitis and stained for both glucagon and insulin. The fourth block had no ß-cells left in islets but numerous ductal cells stained for insulin (Fig. S35), as we previously reported (Ref. 25 in main text). Some of these cells expressed Ki-67, suggesting replication (Fig. S36). We did not identify macrophages or the expression of Fas, caspase-3, MCP-1, IP-10, IFN-α and VP-1 in the islets (not shown).
Reference List 1. Reijonen,H, Mallone,R, Heninger,AK, Laughlin,EM, Kochik,SA, Falk,B, Kwok,WW,
Greenbaum,C, Nepom,GT: GAD65-specific CD4+ T-cells with high antigen avidity are prevalent in peripheral blood of patients with type 1 diabetes. Diabetes 53:1987-1994, 2004
2. Reijonen,H, Novak,EJ, Kochik,S, Heninger,A, Liu,AW, Kwok,WW, Nepom,GT: Detection of GAD65-specific T-cells by major histocompatibility complex class II tetramers in type 1 diabetic patients and at-risk subjects. Diabetes 51:1375-1382, 2002
©2009 American Diabetes Association. Published online at http://diabetes.diabetesjournals.org/cgi/content/full/db09-0498/DC1.
3. Laughlin,E, Burke,G, Pugliese,A, Falk,B, Nepom,G: Recurrence of autoreactive antigen-specific CD4+ T cells in autoimmune diabetes after pancreas transplantation. Clin Immunol 128:23-30, 2008
4. Laughlin,E, Burke,G, Pugliese,A, Falk,B, Nepom,G: Recurrence of autoreactive antigen-specific CD4+ T cells in autoimmune diabetes after pancreas transplantation. Clin Immunol 128:23-30, 2008
5. Akatsuka,Y, Martin,EG, Madonik,A, Barsoukov,AA, Hansen,JA: Rapid screening of T-cell receptor (TCR) variable gene usage by multiplex PCR: application for assessment of clonal composition. Tissue Antigens 53:122-134, 1999
6. Giudicelli,V, Chaume,D, Lefranc,MP: IMGT/V-QUEST, an integrated software program for immunoglobulin and T cell receptor V-J and V-D-J rearrangement analysis. Nucleic Acids Res 32:W435-W440, 2004
©2009 American Diabetes Association. Published online at http://diabetes.diabetesjournals.org/cgi/content/full/db09-0498/DC1.

Table S1. Cytokine profile, TCR V beta usage, CDR3 sequence and HLA-DR restriction of GAD-specific, CD4 T-cell clones from patient 1
____________________________________________________________________________________________________________ Sample Clone IFN-γ TNF-α IL-10 IL-5 IL-4 IL-2 V beta CDR3 Sequence HLA-DR ____________________________________________________________________________________________________________
1 N5 3140 192 34 1 2 1 5.1 CASSFTGDTGELFF DRB1*0405 1 N4 1862 115 5 0 2 3 5.1 CASSFTGDTGELFF DRB1*0405 1 N7 600 35 4 0 0 1 5.1 CASSFTGDTGELFF DRB1*0405 1 N8 571 55 2 0 0 1 5.1 CASSFTGDTGELFF DRB1*0405 1 N2 274 0 0 0 0 0 5.1 CASSFTGDTGELFF DRB1*0405 1 OB 731 60 9 0 4 2 5.1 CASSFTGDTGELFF DRB1*0405
8 RR12 155 18 2 6 3 38 5.1 CASSSLDLGTEAFF DRB1*0405 8 RR126 89 6 4 28 5 88 5.1 CASSSLDLGTEAFF DRB1*0405 8 R7 84 120 22 532 5 232 5.1 CASSSLDLGTEAFF DRB1*0405 8 R123 50 7 5 54 3 32 5.1 CASSSLDLGTEAFF DRB1*0405 8 R14 21 6 7 8 13 111 5.1 CASSSLDLGTEAFF DRB1*0405 8 R61 14 14 8 5 13 5 5.1 CASSSLDLGTEAFF DRB1*0405 8 R8 12 5 5 3 7 91 5.1 CASSSLDLGTEAFF DRB1*0405 8 R82 11 4 2 3 2 47 5.1 CASSSLDLGTEAFF DRB1*0405 8 R37 9 7 1 94 2 35 5.1 CASSSLDLGTEAFF DRB1*0405
____________________________________________________________________________________________________________ Cytokines levels were measured in supernatants of cultures stimulated with GAD 555-567 peptide at 10 µg/ml.
©2009 American Diabetes Association. Published online at http://diabetes.diabetesjournals.org/cgi/content/full/db09-0498/DC1.

Table S2. Cytokine profile, TCR V beta usage, CDR3 sequence and HLA-DR restriction of GAD-specific, CD4 T-cell clones from patient 3
____________________________________________________________________________________________________________
Sample Clone IFN-γ TNF-α IL-10 IL-5 IL-4 IL-2 V beta CDR3 Sequence HLA-DR ____________________________________________________________________________________________________________
1 AA243 11945 2576 174 0 0 478 9 CASSQVTAETQYF DRB4*0101 1 AA207 6722 1447 185 662 79 232 9 CASSQVTAETQYF DRB4*0101 1 AA219 6168 1047 256 0 17 273 9 CASSQVTAETQYF DRB4*0101 1 BB62 5760 2307 256 80 126 1082 9 CASSQVTAETQYF DRB4*0101 1 BB41 4297 797 113 5 15 89 9 CASSQVTAETQYF DRB4*0101 1 AA177 3982 845 22 0 13 4 9 CASSQVTAETQYF DRB4*0101 1 AA179 3840 1016 91 38 35 39 9 CASSQVTAETQYF DRB4*0101 1 AA72 3689 993 104 0 11 8 9 CASSQVTAETQYF DRB4*0101 1 AA280 3233 783 64 0 7 15 9 CASSQVTAETQYF DRB4*0101 1 AA205 2359 1094 126 0 31 64 9 CASSQVTAETQYF DRB4*0101 1 AA41 2270 947 140 0 12 25 9 CASSQVTAETQYF DRB4*0101 1 AA197 2168 1472 72 0 0 21 9 CASSQVTAETQYF DRB4*0101 1 AA286 1978 793 259 16 54 32 9 CASSQVTAETQYF DRB4*0101 1 BB30 1179 656 162 25 172 106 9 CASSQVTAETQYF DRB4*0101
4 AM72 7415 522 150 275 856 659 8 CASSLRGGPDTQYF DRB1*0402 4 AM28 2443 294 93 129 122 136 8 CASSLRGGPDTQYF DRB1*0402
5 AO302 16751 1211 563 3695 3200 860 9 CASSQVTAETQYF DRB4*0101 5 AO306 9440 523 410 364 484 190 9 CASSQVTAETQYF DRB4*0101 5 AO296 1421 254 201 139 641 153 9 CASSQVTAETQYF DRB4*0101
5 AN50 1367 236 1676 2985 3663 100 6 CASSFRGNRDTQYF DRB1*0402 5 AN25 990 325 5291 6951 4700 77 6 CASSFRGNRDTQYF DRB1*0402 5 AN45 658 133 261 35 593 18 6 CASSFRGNRDTQYF DRB1*0402
____________________________________________________________________________________________________________ Cytokines levels were measured in supernatants of cultures stimulated with GAD 555-567 peptide at 10 µg/ml.
©2009 American Diabetes Association. Published online at http://diabetes.diabetesjournals.org/cgi/content/full/db09-0498/DC1.
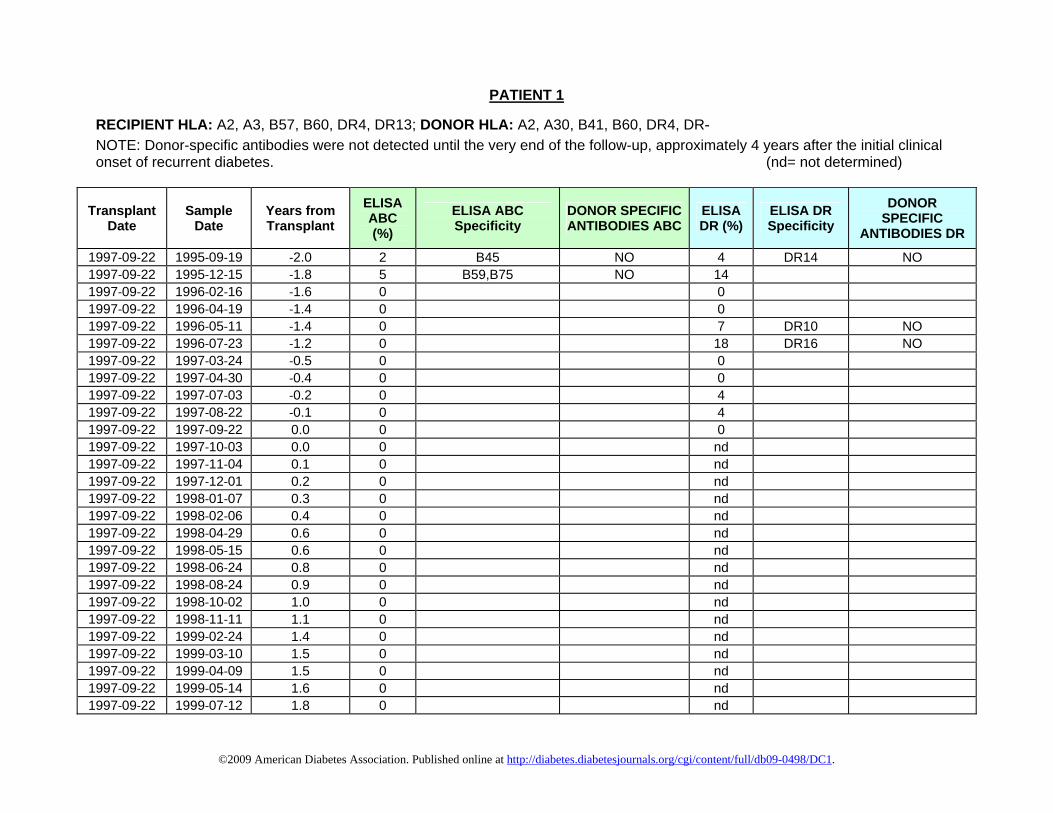
PATIENT 1
RECIPIENT HLA: A2, A3, B57, B60, DR4, DR13; DONOR HLA: A2, A30, B41, B60, DR4, DR‐ NOTE: Donor-specific antibodies were not detected until the very end of the follow-up, approximately 4 years after the initial clinical onset of recurrent diabetes. (nd= not determined)
Transplant Date
Sample Date
Years from Transplant
ELISA ABC (%)
ELISA ABC Specificity
DONOR SPECIFIC ANTIBODIES ABC
ELISA DR (%)
ELISA DR Specificity
DONOR SPECIFIC
ANTIBODIES DR
1997‐09‐22 1995‐09‐19 ‐2.0 2 B45 NO 4 DR14 NO1997‐09‐22 1995‐12‐15 ‐1.8 5 B59,B75 NO 141997‐09‐22 1996‐02‐16 ‐1.6 0 01997‐09‐22 1996‐04‐19 ‐1.4 0 01997‐09‐22 1996‐05‐11 ‐1.4 0 7 DR10 NO1997‐09‐22 1996‐07‐23 ‐1.2 0 18 DR16 NO1997‐09‐22 1997‐03‐24 ‐0.5 0 01997‐09‐22 1997‐04‐30 ‐0.4 0 01997‐09‐22 1997‐07‐03 ‐0.2 0 41997‐09‐22 1997‐08‐22 ‐0.1 0 41997‐09‐22 1997‐09‐22 0.0 0 01997‐09‐22 1997‐10‐03 0.0 0 nd1997‐09‐22 1997‐11‐04 0.1 0 nd1997‐09‐22 1997‐12‐01 0.2 0 nd1997‐09‐22 1998‐01‐07 0.3 0 nd1997‐09‐22 1998‐02‐06 0.4 0 nd1997‐09‐22 1998‐04‐29 0.6 0 nd1997‐09‐22 1998‐05‐15 0.6 0 nd1997‐09‐22 1998‐06‐24 0.8 0 nd1997‐09‐22 1998‐08‐24 0.9 0 nd1997‐09‐22 1998‐10‐02 1.0 0 nd1997‐09‐22 1998‐11‐11 1.1 0 nd1997‐09‐22 1999‐02‐24 1.4 0 nd1997‐09‐22 1999‐03‐10 1.5 0 nd1997‐09‐22 1999‐04‐09 1.5 0 nd1997‐09‐22 1999‐05‐14 1.6 0 nd1997‐09‐22 1999‐07‐12 1.8 0 nd
©2009 American Diabetes Association. Published online at http://diabetes.diabetesjournals.org/cgi/content/full/db09-0498/DC1.

1997‐09‐22 1999‐07‐12 1.8 0 nd1997‐09‐22 1999‐09‐01 1.9 0 nd1997‐09‐22 1999‐10‐28 2.1 0 nd1997‐09‐22 2000‐01‐05 2.3 0 nd1997‐09‐22 2000‐02‐03 2.4 0 nd1997‐09‐22 2000‐04‐25 2.6 0 nd1997‐09‐22 2000‐05‐04 2.6 0 nd1997‐09‐22 2000‐06‐09 2.7 0 nd1997‐09‐22 2000‐10‐19 3.1 0 nd1997‐09‐22 2000‐12‐13 3.2 0 nd1997‐09‐22 2001‐02‐13 3.4 0 nd1997‐09‐22 2002‐03‐29 4.5 0 nd1997‐09‐22 2002‐06‐21 4.7 0 nd1997‐09‐22 2002‐09‐09 5.0 0 nd1997‐09‐22 2002‐12‐23 5.3 0 nd1997‐09‐22 2003‐01‐10 5.3 0 nd1997‐09‐22 2003‐02‐13 5.4 7 B73 NO nd1997‐09‐22 2003‐04‐10 5.6 0 nd1997‐09‐22 2003‐05‐21 5.7 29 A3,B71,A66,B56,B76 NO nd1997‐09‐22 2003‐06‐24 5.8 0 nd1997‐09‐22 2003‐08‐01 5.9 0 nd1997‐09‐22 2003‐10‐15 6.1 0 nd1997‐09‐22 2003‐11‐12 6.1 0 nd1997‐09‐22 2004‐02‐04 6.4 0 nd1997‐09‐22 2004‐03‐05 6.5 0 nd1997‐09‐22 2004‐07‐26 6.8 0 01997‐09‐22 2004‐09‐21 7.0 0 01997‐09‐22 2004‐11‐05 7.1 0 01997‐09‐22 2005‐06‐09 7.7 0 nd1997‐09‐22 2005‐12‐01 8.2 0 01997‐09‐22 2006‐04‐07 8.5 0 01997‐09‐22 2006‐05‐10 8.6 0 01997‐09‐22 2006‐09‐19 9.0 0 56 DQ2,DQ7 NO1997‐09‐22 2006‐11‐15 9.1 13 A30,A31 YES 44 DQ2 NO1997‐09‐22 2007‐01‐17 9.3 41 A30,A29,A31,A34 YES 56 DQ2,DQ5 NO
©2009 American Diabetes Association. Published online at http://diabetes.diabetesjournals.org/cgi/content/full/db09-0498/DC1.

PATIENT 2 RECIPIENT HLA: A2, A24, B44, B56, DR9, DR11; DONOR HLA: A2, A3, B7, B14, DR7, DR9 NOTE: Donor-specific antibodies were never detected. (nd= not determined)
Transplant Date
Sample Date
Years from Transplant
ELISA ABC (%)
ELISA ABC Specificity
DONOR SPECIFIC ANTIBODIES ABC
ELISA DR (%)
ELISA DR Specificity
DONOR SPECIFIC ANTIBODIES DR
1995‐02‐15 1994‐07‐26 ‐0.6 0 0 1995‐02‐15 1995‐02‐15 0.0 0 0 1995‐02‐15 1995‐03‐20 0.1 0 0 1995‐02‐15 1995‐04‐05 0.1 0 0 1995‐02‐15 1995‐05‐05 0.2 0 0 1995‐02‐15 1995‐06‐13 0.3 0 0 1995‐02‐15 1995‐07‐11 0.4 0 0 1995‐02‐15 1995‐08‐22 0.5 0 0 1995‐02‐15 1995‐09‐05 0.6 0 0 1995‐02‐15 1995‐10‐03 0.6 0 0 1995‐02‐15 1995‐11‐14 0.7 0 0 1995‐02‐15 1995‐12‐05 0.8 5 B38 NO 0 1995‐02‐15 1996‐01‐23 0.9 0 B13 NO 14 1995‐02‐15 1996‐02‐27 1.0 0 0 1995‐02‐15 1996‐04‐18 1.2 0 0 1995‐02‐15 1996‐07‐02 1.4 0 A25 NO 10 1995‐02‐15 1997‐12‐09 2.8 0 nd 1995‐02‐15 1998‐03‐10 3.1 0 nd 1995‐02‐15 1998‐06‐30 3.4 0 nd 1995‐02‐15 1998‐09‐17 3.6 0 nd 1995‐02‐15 1998‐10‐22 3.7 0 nd 1995‐02‐15 1998‐12‐04 3.8 0 nd 1995‐02‐15 1999‐01‐05 3.9 0 nd 1995‐02‐15 1999‐03‐02 4.0 0 nd 1995‐02‐15 1999‐06‐03 4.3 0 nd 1995‐02‐15 1999‐08‐16 4.5 0 nd 1995‐02‐15 1999‐11‐18 4.8 0 nd 1995‐02‐15 2000‐01‐04 4.9 0 nd 1995‐02‐15 2000‐03‐10 5.1 0 nd
©2009 American Diabetes Association. Published online at http://diabetes.diabetesjournals.org/cgi/content/full/db09-0498/DC1.

1995‐02‐15 2000‐04‐06 5.1 0 nd 1995‐02‐15 2000‐05‐11 5.2 0 nd 1995‐02‐15 2000‐06‐12 5.3 0 nd 1995‐02‐15 2000‐07‐21 5.4 0 nd 1995‐02‐15 2000‐11‐13 5.7 0 nd 1995‐02‐15 2000‐12‐14 5.8 0 nd 1995‐02‐15 2001‐02‐02 6.0 0 nd 1995‐02‐15 2001‐07‐26 6.4 0 nd 1995‐02‐15 2001‐08‐09 6.5 0 nd 1995‐02‐15 2002‐01‐04 6.9 0 nd 1995‐02‐15 2002‐04‐26 7.2 0 nd 1995‐02‐15 2002‐06‐14 7.3 0 nd 1995‐02‐15 2002‐11‐15 7.8 3 nd 1995‐02‐15 2003‐04‐10 8.2 0 nd 1995‐02‐15 2003‐07‐15 8.4 0 nd 1995‐02‐15 2003‐10‐29 8.7 0 nd 1995‐02‐15 2004‐03‐18 9.1 0 nd 1995‐02‐15 2004‐08‐10 9.5 0 0 1995‐02‐15 2004‐11‐04 9.7 0 0 1995‐02‐15 2005‐03‐30 10.1 0 0 1995‐02‐15 2005‐04‐19 10.2 0 0 1995‐02‐15 2005‐05‐31 10.3 0 0 1995‐02‐15 2005‐06‐14 10.3 0 nd 1995‐02‐15 2005‐08‐15 10.5 0 0 1995‐02‐15 2005‐09‐22 10.6 0 0 1995‐02‐15 2005‐11‐16 10.8 0 0 1995‐02‐15 2006‐01‐05 10.9 0 0 1995‐02‐15 2006‐03‐14 11.1 0 0 1995‐02‐15 2006‐05‐02 11.2 0 0 1995‐02‐15 2006‐07‐17 11.4 0 0 1995‐02‐15 2006‐09‐20 11.6 0 0 1995‐02‐15 2006‐10‐18 11.7 0 0 1995‐02‐15 2006‐11‐03 11.7 0 0 1995‐02‐15 2007‐03‐21 12.1 0 0 1995‐02‐15 2007‐09‐11 12.6 0 0 1995‐02‐15 2007‐11‐28 12.8 0 0
©2009 American Diabetes Association. Published online at http://diabetes.diabetesjournals.org/cgi/content/full/db09-0498/DC1.

1995‐02‐15 2007‐12‐19 12.8 0 0 1995‐02‐15 2008‐02‐06 13.0 0 0 1995‐02‐15 2008‐05‐01 13.2 0 0
©2009 American Diabetes Association. Published online at http://diabetes.diabetesjournals.org/cgi/content/full/db09-0498/DC1.
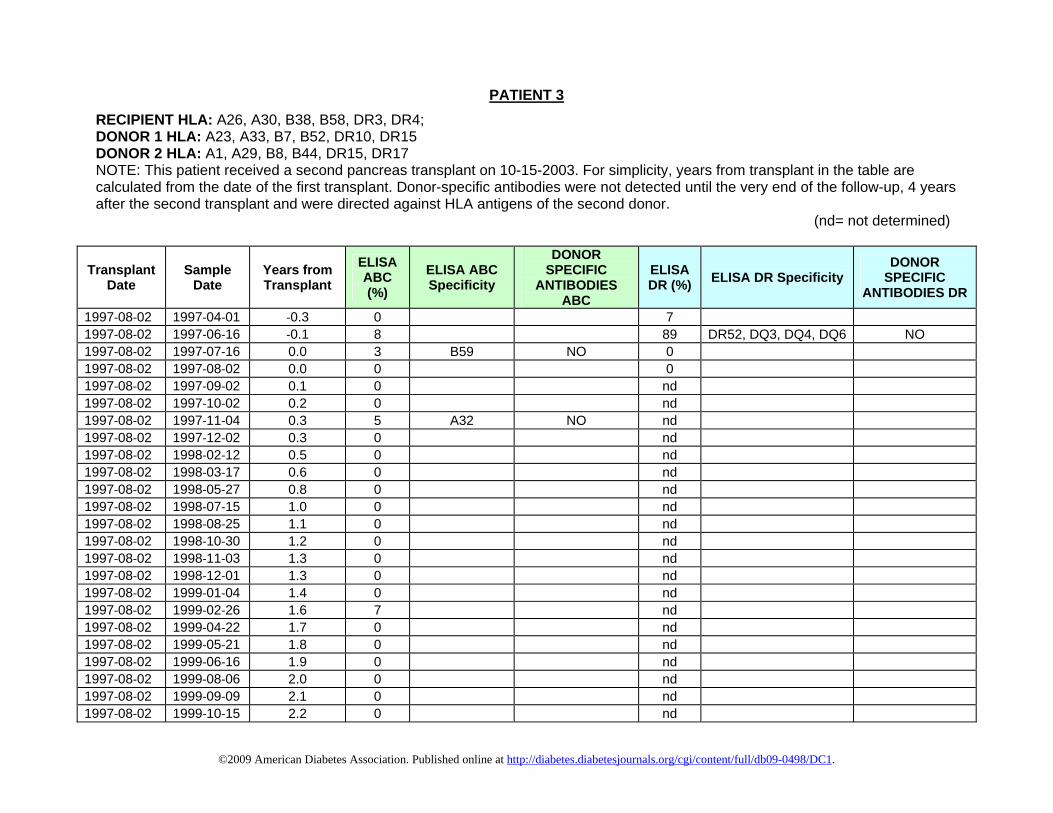
PATIENT 3 RECIPIENT HLA: A26, A30, B38, B58, DR3, DR4; DONOR 1 HLA: A23, A33, B7, B52, DR10, DR15 DONOR 2 HLA: A1, A29, B8, B44, DR15, DR17 NOTE: This patient received a second pancreas transplant on 10-15-2003. For simplicity, years from transplant in the table are calculated from the date of the first transplant. Donor-specific antibodies were not detected until the very end of the follow-up, 4 years after the second transplant and were directed against HLA antigens of the second donor. (nd= not determined)
Transplant Date
Sample Date
Years from Transplant
ELISA ABC (%)
ELISA ABC Specificity
DONOR SPECIFIC
ANTIBODIES ABC
ELISA DR (%) ELISA DR Specificity
DONOR SPECIFIC
ANTIBODIES DR
1997‐08‐02 1997‐04‐01 ‐0.3 0 7 1997‐08‐02 1997‐06‐16 ‐0.1 8 89 DR52, DQ3, DQ4, DQ6 NO 1997‐08‐02 1997‐07‐16 0.0 3 B59 NO 0 1997‐08‐02 1997‐08‐02 0.0 0 0 1997‐08‐02 1997‐09‐02 0.1 0 nd 1997‐08‐02 1997‐10‐02 0.2 0 nd 1997‐08‐02 1997‐11‐04 0.3 5 A32 NO nd1997‐08‐02 1997‐12‐02 0.3 0 nd 1997‐08‐02 1998‐02‐12 0.5 0 nd 1997‐08‐02 1998‐03‐17 0.6 0 nd 1997‐08‐02 1998‐05‐27 0.8 0 nd 1997‐08‐02 1998‐07‐15 1.0 0 nd 1997‐08‐02 1998‐08‐25 1.1 0 nd 1997‐08‐02 1998‐10‐30 1.2 0 nd 1997‐08‐02 1998‐11‐03 1.3 0 nd 1997‐08‐02 1998‐12‐01 1.3 0 nd 1997‐08‐02 1999‐01‐04 1.4 0 nd 1997‐08‐02 1999‐02‐26 1.6 7 nd 1997‐08‐02 1999‐04‐22 1.7 0 nd 1997‐08‐02 1999‐05‐21 1.8 0 nd 1997‐08‐02 1999‐06‐16 1.9 0 nd 1997‐08‐02 1999‐08‐06 2.0 0 nd 1997‐08‐02 1999‐09‐09 2.1 0 nd 1997‐08‐02 1999‐10‐15 2.2 0 nd
©2009 American Diabetes Association. Published online at http://diabetes.diabetesjournals.org/cgi/content/full/db09-0498/DC1.

1997‐08‐02 1999‐12‐01 2.3 0 nd 1997‐08‐02 2000‐01‐05 2.4 0 nd 1997‐08‐02 2000‐02‐10 2.5 0 nd 1997‐08‐02 2000‐03‐07 2.6 0 nd 1997‐08‐02 2000‐04‐14 2.7 0 nd 1997‐08‐02 2000‐05‐18 2.8 0 nd 1997‐08‐02 2000‐06‐16 2.9 0 nd 1997‐08‐02 2000‐07‐26 3.0 0 nd 1997‐08‐02 2000‐08‐29 3.1 0 nd 1997‐08‐02 2000‐11‐06 3.3 0 nd 1997‐08‐02 2000‐12‐07 3.3 0 nd 1997‐08‐02 2001‐01‐29 3.5 0 nd 1997‐08‐02 2001‐08‐21 4.1 0 nd 1997‐08‐02 2001‐11‐30 4.3 0 nd 1997‐08‐02 2001‐12‐27 4.4 0 nd 1997‐08‐02 2002‐01‐16 4.5 0 nd 1997‐08‐02 2002‐02‐28 4.6 0 nd 1997‐08‐02 2002‐06‐03 4.8 0 nd 1997‐08‐02 2002‐09‐03 5.1 0 nd 1997‐08‐02 2002‐10‐04 5.2 0 nd 1997‐08‐02 2002‐11‐04 5.3 0 nd 1997‐08‐02 2002‐12‐06 5.3 0 nd 1997‐08‐02 2003‐02‐26 5.6 0 nd 1997‐08‐02 2003‐03‐26 5.7 0 nd 1997‐08‐02 2003‐05‐01 5.7 0 0 1997‐08‐02 2003‐10‐06 6.2 0 0 1997‐08‐02 2003‐10‐15 6.2 0 nd 1997‐08‐02 2003‐11‐03 6.3 0 nd 1997‐08‐02 2004‐01‐05 6.4 0 nd 1997‐08‐02 2004‐02‐02 6.5 0 nd 1997‐08‐02 2004‐03‐08 6.6 0 nd 1997‐08‐02 2004‐04‐05 6.7 0 nd 1997‐08‐02 2004‐06‐07 6.8 0 0 1997‐08‐02 2004‐07‐12 6.9 0 0 1997‐08‐02 2004‐08‐09 7.0 0 0 1997‐08‐02 2004‐09‐20 7.1 0 0 1997‐08‐02 2004‐10‐25 7.2 0 0
©2009 American Diabetes Association. Published online at http://diabetes.diabetesjournals.org/cgi/content/full/db09-0498/DC1.

1997‐08‐02 2004‐11‐08 7.3 0 0 1997‐08‐02 2004‐12‐06 7.3 0 0 1997‐08‐02 2005‐01‐14 7.5 0 0 1997‐08‐02 2005‐04‐11 7.7 0 0 1997‐08‐02 2005‐06‐07 7.8 0 0 1997‐08‐02 2005‐07‐12 7.9 0 0 1997‐08‐02 2005‐08‐23 8.1 0 0 1997‐08‐02 2005‐09‐29 8.2 0 0 1997‐08‐02 2005‐11‐07 8.3 0 0 1997‐08‐02 2005‐12‐20 8.4 0 0 1997‐08‐02 2006‐01‐24 8.5 0 0 1997‐08‐02 2006‐02‐14 8.5 0 0 1997‐08‐02 2006‐03‐15 8.6 0 0 1997‐08‐02 2006‐04‐27 8.7 0 0 1997‐08‐02 2006‐06‐01 8.8 0 0 1997‐08‐02 2006‐06‐28 8.9 0 0 1997‐08‐02 2006‐07‐27 9.0 0 0 1997‐08‐02 2006‐08‐09 9.0 0 0 1997‐08‐02 2006‐10‐05 9.2 0 0 1997‐08‐02 2006‐11‐02 9.3 0 0 1997‐08‐02 2006‐12‐12 9.4 0 0 1997‐08‐02 2007‐01‐11 9.4 0 0 1997‐08‐02 2007‐03‐15 9.6 0 0 1997‐08‐02 2007‐05‐02 9.8 0 0 1997‐08‐02 2007‐06‐14 9.9 0 0 1997‐08‐02 2007‐07‐24 10.0 0 0 1997‐08‐02 2007‐08‐06 10.0 0 0 1997‐08‐02 2007‐10‐01 10.2 0 0 1997‐08‐02 2007‐11‐21 10.3 0 0
©2009 American Diabetes Association. Published online at http://diabetes.diabetesjournals.org/cgi/content/full/db09-0498/DC1.
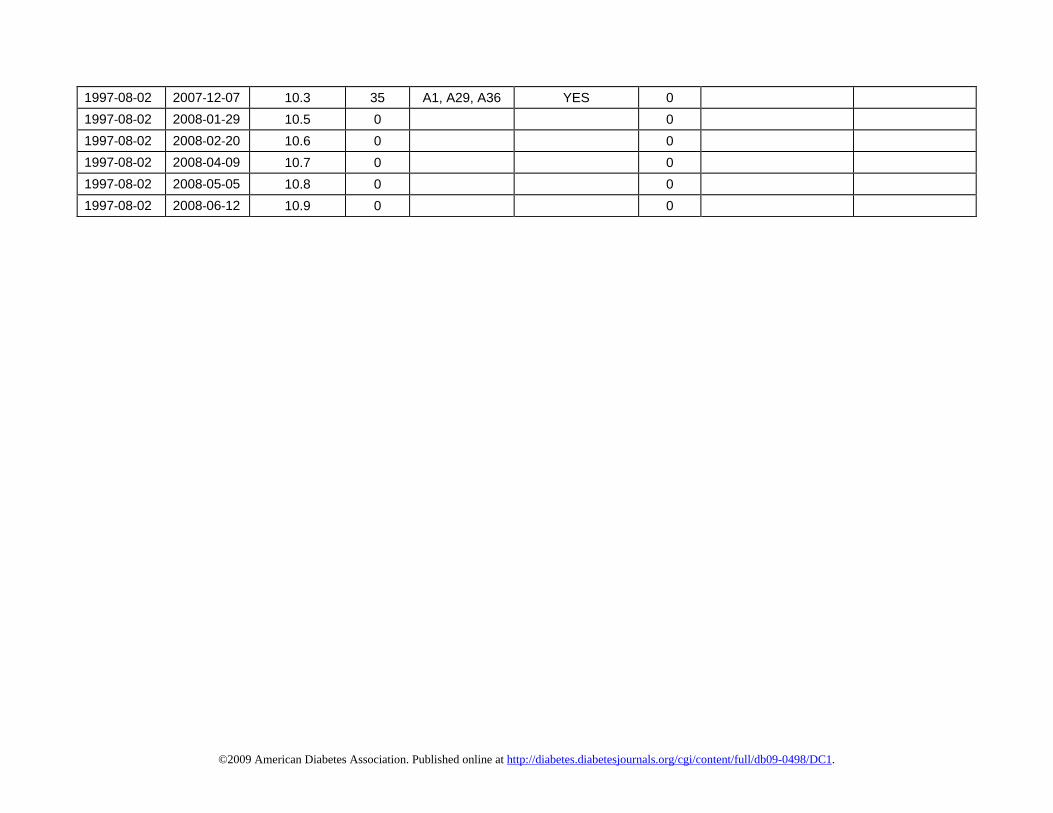
1997‐08‐02 2007‐12‐07 10.3 35 A1, A29, A36 YES 0 1997‐08‐02 2008‐01‐29 10.5 0 0 1997‐08‐02 2008‐02‐20 10.6 0 0 1997‐08‐02 2008‐04‐09 10.7 0 0 1997‐08‐02 2008‐05‐05 10.8 0 0 1997‐08‐02 2008‐06‐12 10.9 0 0
©2009 American Diabetes Association. Published online at http://diabetes.diabetesjournals.org/cgi/content/full/db09-0498/DC1.

GA
D A
Ab
IA2
AA
b Zn
T8 A
Ab
0 1 2 3 4 5 6 7 80
5
1 0
1 0 2 0 3 0 4 0 5 0
2 0
3 0
4 0
Fig. S1. Effects of plasmapheresis on autoantibody levels in patient 3
Days
Autoantibody serial measurements were performed during an 8-day period during the course of the plasmapheresis performed at the time of the second pancreas transplant. Plasmapheresis began on the day of surgery (day 0) and was performed again on days 3 and 5 post-transplantation. Also shown are autoantibody levels in a sample obtained 45 days after re-transplantation, corresponding to 6.3 years of follow-up in Fig. 3A. The horizontal line represents cutoffs for GAD, IA-2 and ZnT8 autoantibodies.
Tetramer Staining
HLA
-DR
B1*
0405
G
AD
-Tet
ram
er-P
EH
LA-D
RB
1*04
05
Con
trol T
etra
mer
-PE
CD4-FITC
0.6
71
100 10 1 0.1 0.010
5000
10000
15000
20000
25000
30000
Peptide Concentration (µg/ml)
cpm
Proliferation
IFN-g TNF-a IL-10 IL-5 IL-4 IL-20
250
500
750
pg/m
L
Fig. S2. GAD CD4 T-cell clone OB from patient 1
Cytokine Profile
Representative T-cell clone from patient 1. The clone was derived from the blood sample closest to hyperglycemia recurrence (sample #1, Fig. 1C, 1D). The clone stained strongly with the specific tetramer but not with control tetramer (DRB1*0405-OspA). Cells were gated on live lymphocytes. The frequency of CD4+Tetramer+ cells is shown. The clone proliferated in response to the indicated concentrations of GAD 555-567 peptide presented by irradiated APC from a DRB1*0405 donor. Data are mean + SE counts per minute (CPM) of 3H thymidine incorporation for the last 12 hrs of 72 hrs triplicate cultures. Cytokine levels were measured in supernatants collected at 48 hrs.
©2009 American Diabetes Association. Published online at http://diabetes.diabetesjournals.org/cgi/content/full/db09-0498/DC1.

4*01
01
amer
-PE
Fig. S3. GAD CD4 T cell clone AA280 from patient 3H
LA-D
RB
CTR
L Te
trH
LA-D
RB
4*01
01
GA
D-T
etra
mer
-PE
CD4-FITC10 1 0.1 0
0
10000
20000
30000
40000
50000
60000
Peptide Concentration (µg/ml)
cpm
IFN-g TNF-a IL-10 IL-5 IL-4 IL-20
500
1000
1500
2000
2500
3000
3500
pg/m
L
Tetramer Staining Proliferation Cytokine Profile
1.1
98
Representative T-cell clone from patient 3, derived from a blood sample obtained one year after the recurrence of hyperglycemia, before re-transplantation (sample # 1, Fig. 3B and 3C). The clone stained strongly with the specific tetramer but not with a control tetramer, proliferated vigorously in response to the indicated doses of GAD 555-557 peptide presented by DRB4*0101 APCs. Cytokine levels were measured in supernatants collected at 48 hrs.
Fig. S4. Assessment of the cytoxycity of IGRP-specific CD8 T-cells from patient 2
TFL4
(K56
2-A2
)
Caspase Activation
K562-A2 + no peptide K562-A2 + PD5 K562-A2 + IGRP152
7.6% 8.8% 21.8%
CD8 T-cells from patient 2 induce caspase activation in APCs loaded with IGRP 152-160 peptide. K562-A2 cells loaded with the indicated peptide were stained with TFL4 and then mixed with purified, IGRP 152-cultured CD8 T-cells for 45 minutes at an effector-target ratio of 1 in the presence of membrane-permeable caspase prior to flow cytometry analysis. Gates were set on TFL4 labeled K562-A2 cells. Caspase activity was increased by incubation of CD8 T-cells with the IGRP peptide compared to cells incubated with no peptide or an irrelevant peptide (pyruvate dehydrogenase 5, PD5).
©2009 American Diabetes Association. Published online at http://diabetes.diabetesjournals.org/cgi/content/full/db09-0498/DC1.

Pancreas Transplant Biopsy
Patient 1
©2009 American Diabetes Association. Published online at http://diabetes.diabetesjournals.org/cgi/content/full/db09-0498/DC1.

Fig. s5 – Patient 1, pancreas transplant biopsy, insulin staining, 20X lens
©2009 American Diabetes Association. Published online at http://diabetes.diabetesjournals.org/cgi/content/full/db09-0498/DC1.
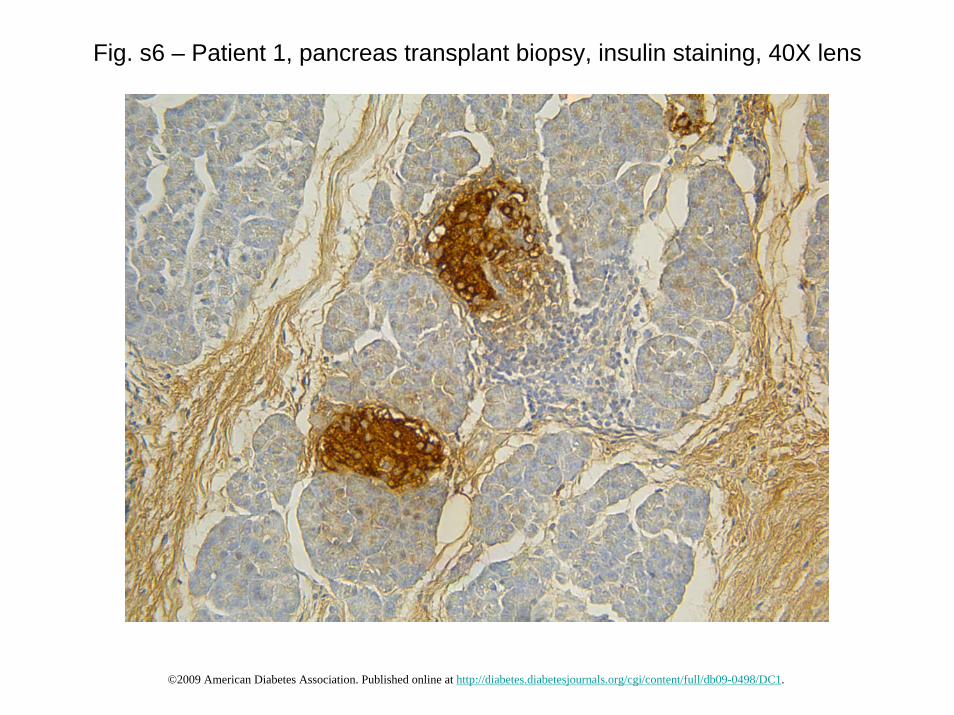
Fig. s6 – Patient 1, pancreas transplant biopsy, insulin staining, 40X lens
©2009 American Diabetes Association. Published online at http://diabetes.diabetesjournals.org/cgi/content/full/db09-0498/DC1.
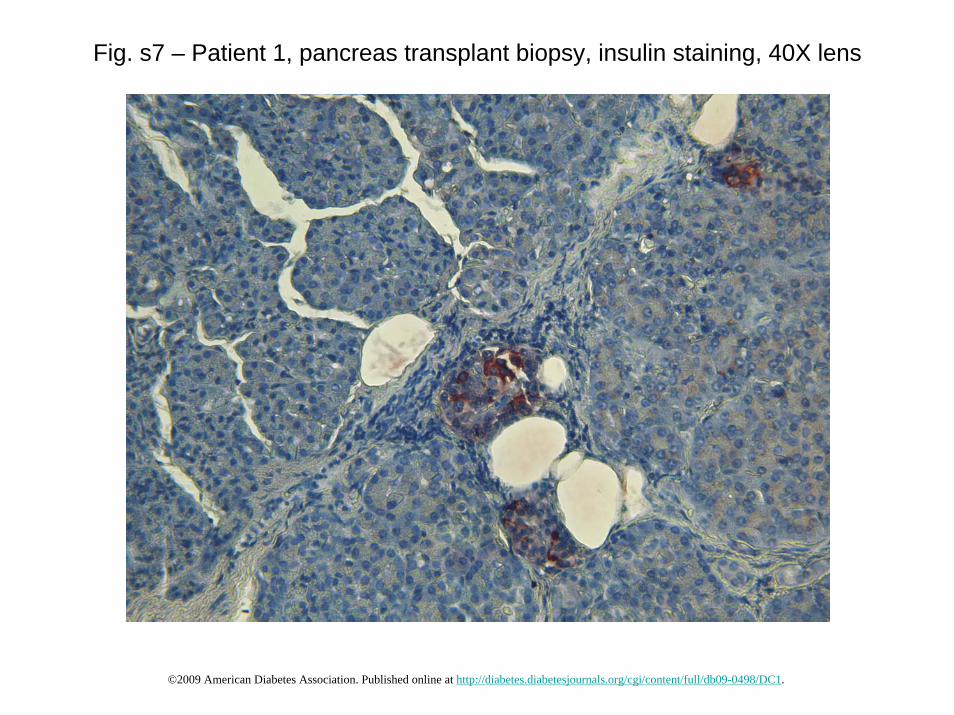
Fig. s7 – Patient 1, pancreas transplant biopsy, insulin staining, 40X lens
©2009 American Diabetes Association. Published online at http://diabetes.diabetesjournals.org/cgi/content/full/db09-0498/DC1.

Fig. s8 – Patient 1, pancreas transplant biopsy, insulin staining, 40X lens
©2009 American Diabetes Association. Published online at http://diabetes.diabetesjournals.org/cgi/content/full/db09-0498/DC1.

Fig. s9 – Patient 1, pancreas transplant biopsy, CD3 staining, 40X lens
©2009 American Diabetes Association. Published online at http://diabetes.diabetesjournals.org/cgi/content/full/db09-0498/DC1.

Fig. s10 – Patient 1, pancreas transplant biopsy, CD3 staining, 40X lens
©2009 American Diabetes Association. Published online at http://diabetes.diabetesjournals.org/cgi/content/full/db09-0498/DC1.
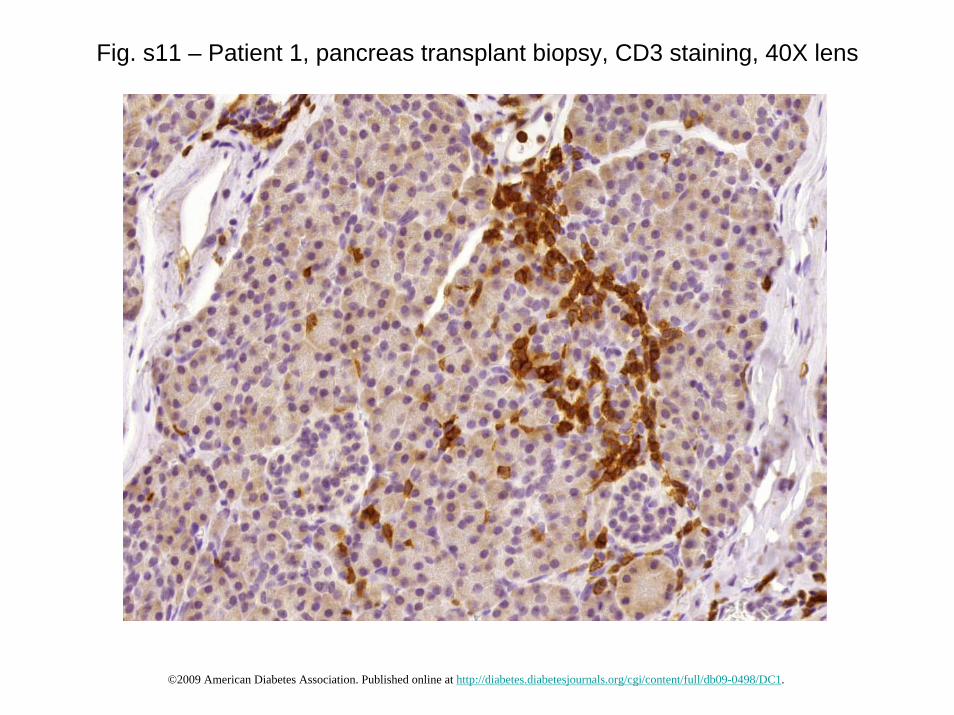
Fig. s11 – Patient 1, pancreas transplant biopsy, CD3 staining, 40X lens
©2009 American Diabetes Association. Published online at http://diabetes.diabetesjournals.org/cgi/content/full/db09-0498/DC1.
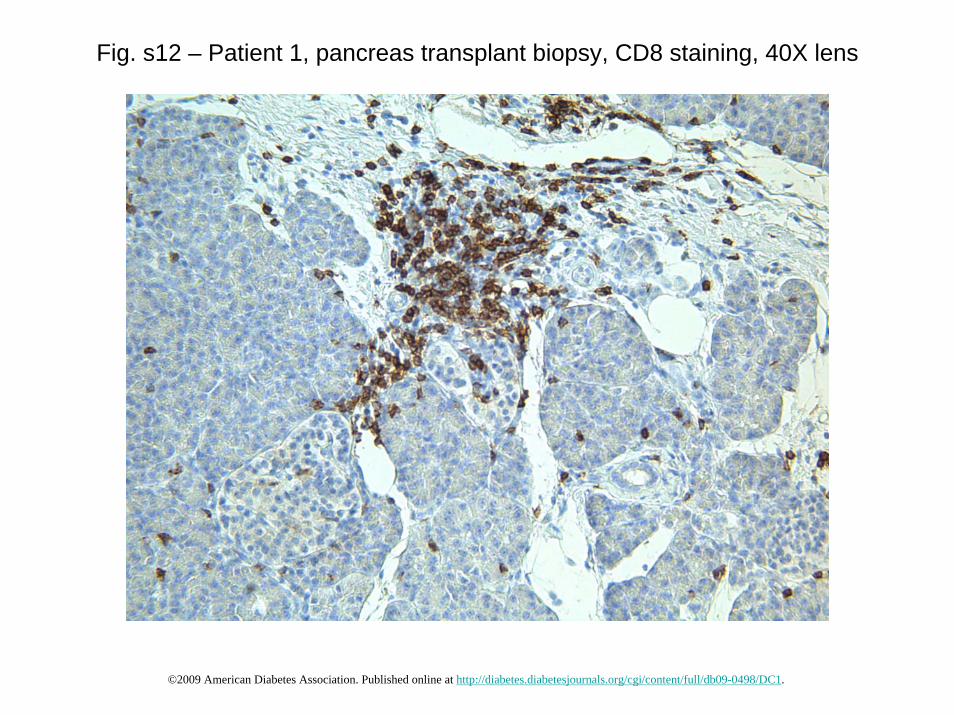
Fig. s12 – Patient 1, pancreas transplant biopsy, CD8 staining, 40X lens
©2009 American Diabetes Association. Published online at http://diabetes.diabetesjournals.org/cgi/content/full/db09-0498/DC1.

Fig. s13 – Patient 1, pancreas transplant biopsy, CD8 staining, 40X lens
©2009 American Diabetes Association. Published online at http://diabetes.diabetesjournals.org/cgi/content/full/db09-0498/DC1.

Fig. s14 – Patient 1, pancreas transplant biopsy, CD4 staining, 40X lens
©2009 American Diabetes Association. Published online at http://diabetes.diabetesjournals.org/cgi/content/full/db09-0498/DC1.
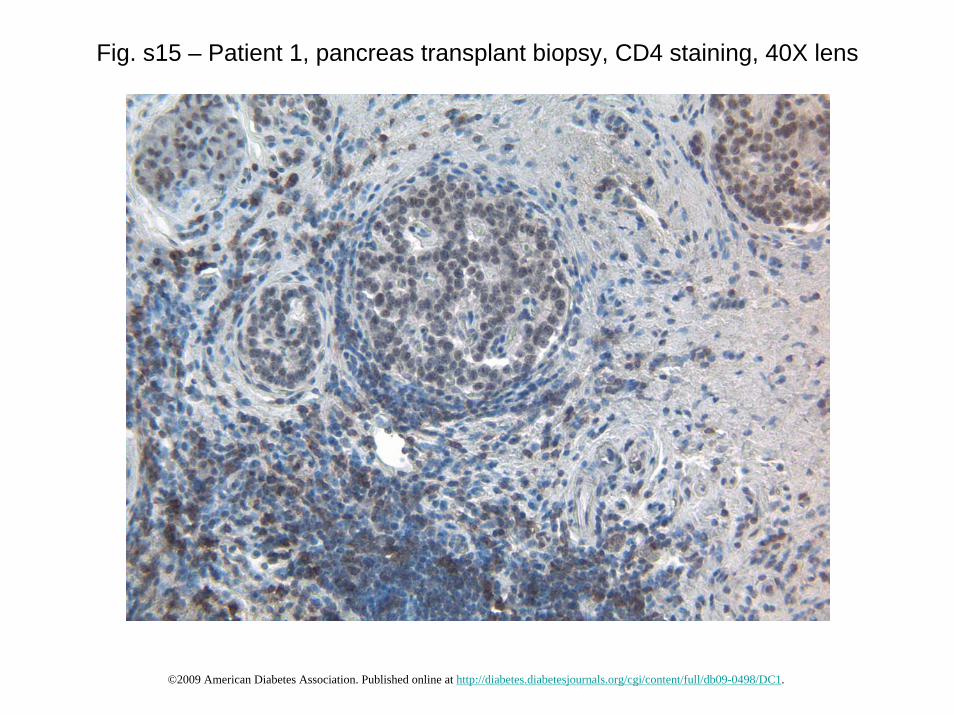
Fig. s15 – Patient 1, pancreas transplant biopsy, CD4 staining, 40X lens
©2009 American Diabetes Association. Published online at http://diabetes.diabetesjournals.org/cgi/content/full/db09-0498/DC1.

Fig. s16 – Patient 1, pancreas transplant biopsy, CD20 staining, 40X lens
©2009 American Diabetes Association. Published online at http://diabetes.diabetesjournals.org/cgi/content/full/db09-0498/DC1.
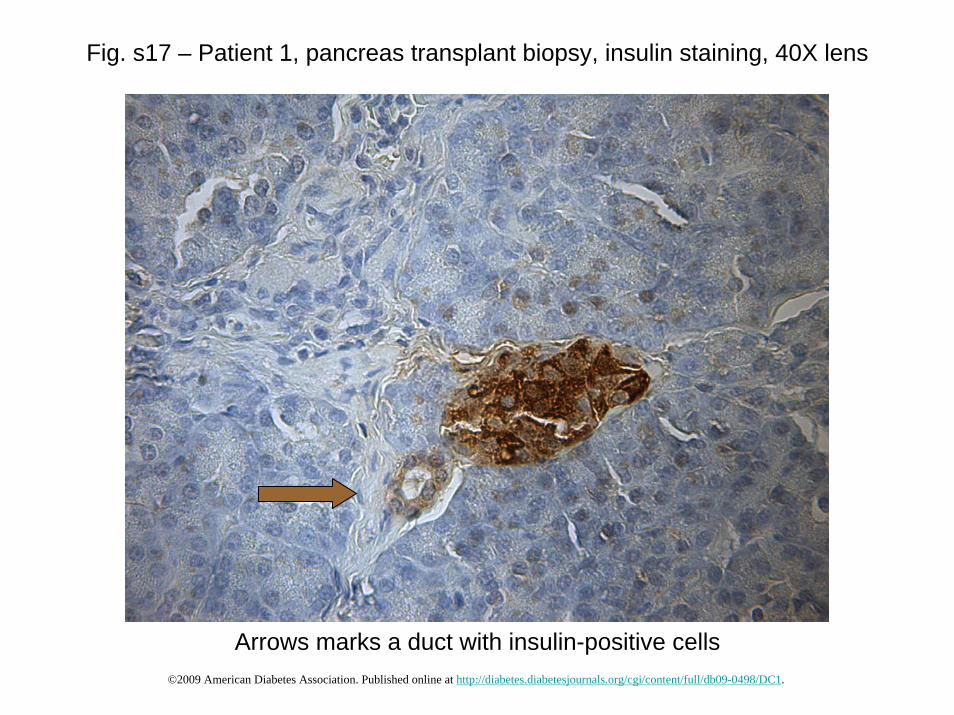
Fig. s17 – Patient 1, pancreas transplant biopsy, insulin staining, 40X lens
Arrows marks a duct with insulin-positive cells©2009 American Diabetes Association. Published online at http://diabetes.diabetesjournals.org/cgi/content/full/db09-0498/DC1.

Pancreas Transplant Biopsy
Patient 2
©2009 American Diabetes Association. Published online at http://diabetes.diabetesjournals.org/cgi/content/full/db09-0498/DC1.

Fig. s18 – Patient 2, pancreas transplant biopsy, 20X lens
GLU
CA
GO
N
INS
ULI
NC
D20
CD
3
©2009 American Diabetes Association. Published online at http://diabetes.diabetesjournals.org/cgi/content/full/db09-0498/DC1.

Fig. s19 – Patient 2, pancreas transplant biopsy, 20X lens
GLU
CA
GO
N
INS
ULI
NC
D20
CD
3
©2009 American Diabetes Association. Published online at http://diabetes.diabetesjournals.org/cgi/content/full/db09-0498/DC1.
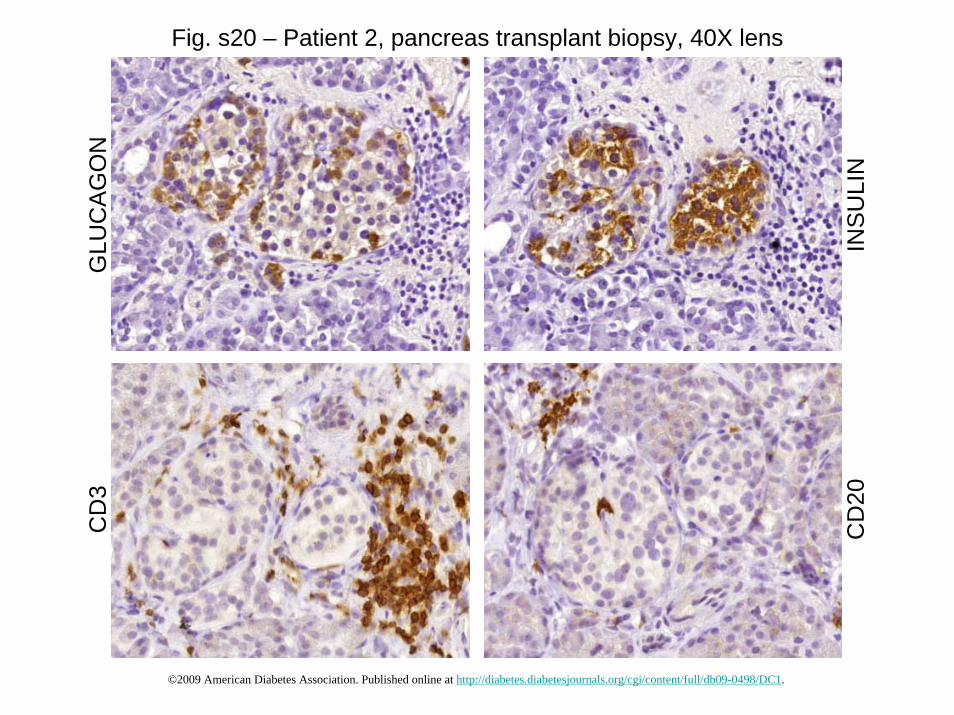
Fig. s20 – Patient 2, pancreas transplant biopsy, 40X lens
GLU
CA
GO
N
INS
ULI
NC
D20
CD
3
©2009 American Diabetes Association. Published online at http://diabetes.diabetesjournals.org/cgi/content/full/db09-0498/DC1.

Fig. s21 – Patient 2, pancreas transplant biopsy, 20X lens
GLU
CA
GO
N
INS
ULI
NC
D20
CD
3
©2009 American Diabetes Association. Published online at http://diabetes.diabetesjournals.org/cgi/content/full/db09-0498/DC1.
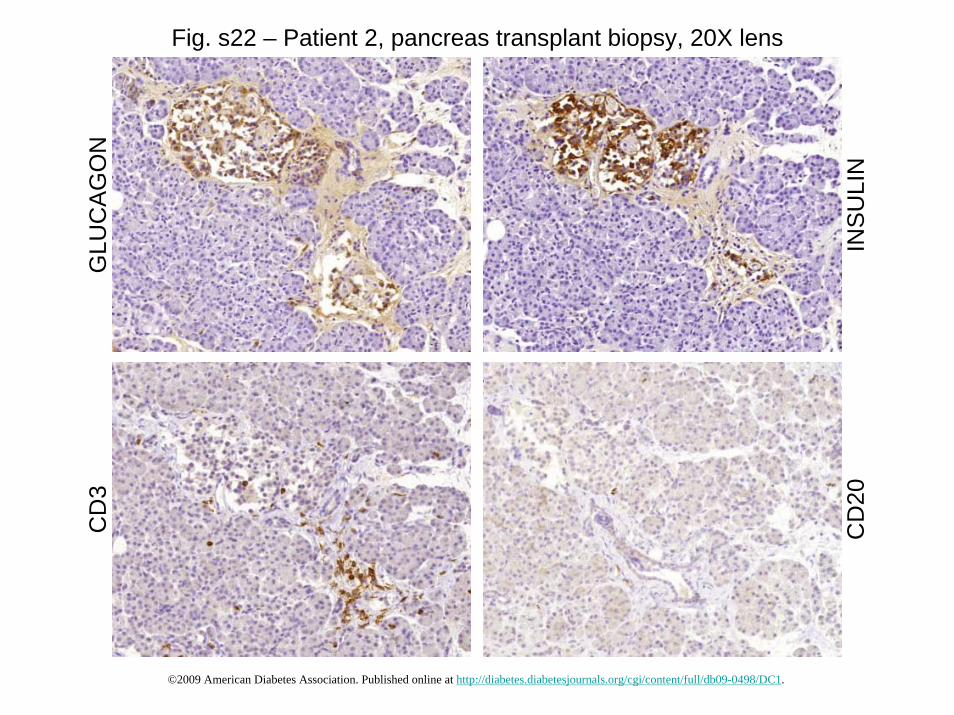
Fig. s22 – Patient 2, pancreas transplant biopsy, 20X lens
GLU
CA
GO
N
INS
ULI
NC
D20
CD
3
©2009 American Diabetes Association. Published online at http://diabetes.diabetesjournals.org/cgi/content/full/db09-0498/DC1.

Fig. s23 – Patient 2, pancreas transplant biopsy, 20X lens
GLU
CA
GO
N
INS
ULI
NC
D20
CD
3
©2009 American Diabetes Association. Published online at http://diabetes.diabetesjournals.org/cgi/content/full/db09-0498/DC1.

Fig. s24 – Patient 2, pancreas transplant biopsy, 20X lens
GLU
CA
GO
N
INS
ULI
NC
D20
CD
3
©2009 American Diabetes Association. Published online at http://diabetes.diabetesjournals.org/cgi/content/full/db09-0498/DC1.

Fig. s25 – Patient 2, pancreas transplant biopsy, CD840
X le
ns, e
xcep
t top
righ
t 20X
©2009 American Diabetes Association. Published online at http://diabetes.diabetesjournals.org/cgi/content/full/db09-0498/DC1.

Fig. s26 – Patient 2, pancreas transplant biopsy, CD4, 40X lens
©2009 American Diabetes Association. Published online at http://diabetes.diabetesjournals.org/cgi/content/full/db09-0498/DC1.

Fig. s27 – Patient 2, pancreas transplant biopsy
INSULIN
GLUCAGON
VP-1
MERGED
Left panel: a pancreatic islet stained for insulin (red), glucagon (light blue) and VP-1 (green).
Right panels: higher magnification of the inset from the left panel demonstrates colocalization of VP-1 and insulin. The image was selected from a Z-stack series acquired by confocal microscopy (63X lens).
©2009 American Diabetes Association. Published online at http://diabetes.diabetesjournals.org/cgi/content/full/db09-0498/DC1.

Fig. s28 – Patient 2, pancreas transplant biopsy, insulin staining, 40X lens
Arrow marks a duct with insulin-positive cells©2009 American Diabetes Association. Published online at http://diabetes.diabetesjournals.org/cgi/content/full/db09-0498/DC1.

Pancreas Transplant Biopsy
Patient 3
©2009 American Diabetes Association. Published online at http://diabetes.diabetesjournals.org/cgi/content/full/db09-0498/DC1.

Fig. s29 – Patient 3, 1st pancreas transplant biopsy, 5X lens
GLUCAGON INSULIN
©2009 American Diabetes Association. Published online at http://diabetes.diabetesjournals.org/cgi/content/full/db09-0498/DC1.

GLUCAGONFig. s30 – Patient 3, 1st pancreas transplant biopsy, 10X lens
INSULIN CD3
CD4 CD20 CD8©2009 American Diabetes Association. Published online at http://diabetes.diabetesjournals.org/cgi/content/full/db09-0498/DC1.

Fig. s31 – Patient 3, 1st pancreas transplant biopsy, 20X lensGLUCAGON INSULIN CD3
CD4 CD20 CD8©2009 American Diabetes Association. Published online at http://diabetes.diabetesjournals.org/cgi/content/full/db09-0498/DC1.

Fig. s32 – Patient 3, 1st pancreas transplant biopsy, 20X lensGLUCAGON INSULIN CD3
CD4 CD20 CD8©2009 American Diabetes Association. Published online at http://diabetes.diabetesjournals.org/cgi/content/full/db09-0498/DC1.

Fig. s33 – Patient 3, 1st pancreas transplant biopsy, 20X lensGLUCAGON INSULIN CD3
CD4 CD20 CD8©2009 American Diabetes Association. Published online at http://diabetes.diabetesjournals.org/cgi/content/full/db09-0498/DC1.

Fig. s34 – Patient 3, 1st pancreas transplant biopsy, 40X lensGLUCAGON INSULIN CD3
CD4 CD20 CD8©2009 American Diabetes Association. Published online at http://diabetes.diabetesjournals.org/cgi/content/full/db09-0498/DC1.

Fig. s35 – Patient 3, 1st pancreas transplant biopsy, insulin staining in ducts, 40X lens
©2009 American Diabetes Association. Published online at http://diabetes.diabetesjournals.org/cgi/content/full/db09-0498/DC1.

Fig. s36 – Patient 3, 1st pancreas transplant biopsy, insulin-positive ductal cells express the proliferation marker Ki-67, 63X lens
INSULINCK-19
MERGED KI-67
©2009 American Diabetes Association. Published online at http://diabetes.diabetesjournals.org/cgi/content/full/db09-0498/DC1.

Fig. s37 – Active Caspase 3 in human ß-cells co-transplanted with GAD autoreactive T-cells from Patient 3, 63X lens
©2009 American Diabetes Association. Published online at http://diabetes.diabetesjournals.org/cgi/content/full/db09-0498/DC1.