detection and mapping of soil liquefaction in the 2011
TRANSCRIPT
Earth Planets Space, 64, 1267–1276, 2012
Detection and mapping of soil liquefaction in the 2011 Tohoku earthquakeusing SAR interferometry
Kazuya Ishitsuka1, Takeshi Tsuji2, and Toshifumi Matsuoka1
1Department of Urban Management, Kyoto University, Kyoto, Japan2International Institute for Carbon-Neutral Energy Research (WPI-I2CNER), Kyushu University, Fukuoka, Japan
(Received December 27, 2011; Revised November 2, 2012; Accepted November 20, 2012; Online published January 28, 2013)
We have identified areas of soil liquefaction by the analysis of surface changes caused by the 2011 Tohokuearthquake, using synthetic aperture radar (SAR) interferometry in the Kanto region of Japan. Changes in surfacescattering properties were evaluated using phase-corrected coherence, computed from the reflective intensity(amplitude) of SAR data. Often, the loss of coherence (decorrelation) is simply considered to represent areasdamaged from the disaster. However, temporal decorrelation could also be induced by ordinal surface coverchange in addition to disaster damage. Therefore, we use a coherence change threshold to discriminate significantdecorrelation caused by soil liquefaction from that produced by ordinal surface cover changes. Moreover, localsurface displacements are estimated using phase information from the SAR data. Our results compare favorablywith those from surveys of sand boils and aerial photography, showing that surface changes derived from SARdata are associated with soil liquefaction. Our results demonstrate that soil liquefaction occurred mainly near thewaterfront along Tokyo Bay and the Tone River, and ground subsidence was widely distributed.Key words: Soil liquefaction, SAR interferometry, interferometric coherence, temporal decorrelation, changedetection, the 2011 Tohoku earthquake.
1. IntroductionThe 2011 Tohoku earthquake (Mw 9.0) occurred north-
east of the Japan Trench on 11 March with a rupture areaas large as 500 × 200 km (Ozawa et al., 2011), and wasthe fourth largest earthquake in the instrumental record.It was followed by numerous large aftershocks along thattrench. In the Kanto region including Tokyo, about 350km from the mainshock, seismic intensities of 5-lower to6-lower were recorded (Fig. 1(a)) (Hoshiba et al., 2011).There were large areas of soil liquefaction, especially alongTokyo Bay and the Tone River, causing extensive damage toresidential buildings and infrastructure (Bhattacharya et al.,2011; Yasuda and Harada, 2011; Senna et al., 2012). Ac-cording to the geomorphologic classification of the Kantoregion (Wakamatsu et al., 2005), areas around Tokyo Bayare mainly covered by filled land. Back marsh and naturallevees are widely distributed along the upper Tone River,and delta and coastal lowland extend from the middle to thelower part of the river (Fig. 1(c)).
Soil liquefaction is usually investigated by field recon-naissance and aerial photography. Here, we successfullyapply synthetic aperture radar (SAR) interferometry (In-SAR), derived from satellite data, to identify and map soilliquefaction. Satellite-based remote sensing methods holdpromise for providing broad and dense information on theEarth’s surface (Massonnet and Feigl, 1998; Burgmann et
Copyright c© The Society of Geomagnetism and Earth, Planetary and Space Sci-ences (SGEPSS); The Seismological Society of Japan; The Volcanological Societyof Japan; The Geodetic Society of Japan; The Japanese Society for Planetary Sci-ences; TERRAPUB.
doi:10.5047/eps.2012.11.002
al., 2000; Simons and Rosen, 2007) and have shown a po-tential advantage for investigating soil liquefaction (Atzoriet al., 2012). To our knowledge, this study is the first ap-plication of InSAR analysis to mapping soil liquefactioncaused by the 2011 Tohoku earthquake.
Soil liquefaction can cause decorrelation because theground surface becomes wetter and structures may be tilted.We derive such changes of ground surface properties andthereby identify soil liquefaction areas by quantifying thedegree of decorrelation, using phase-corrected coherenceinformation based on SAR amplitude data. Previous stud-ies have considered decorrelation as a geophysical phe-nomenon and integrated it with field surveys, for instancein mapping surface ruptures and estimating areas of ma-jor building damage caused by earthquakes (Simons et al.,2002; Fielding et al., 2005).
We also estimated surface displacement using InSAR,which can produce a surface displacement map over wideareas using phase information from paired satellite observa-tions, without the need for ground-based observations. In-SAR analysis has been successfully applied to understand-ing synoptic surface displacement caused by the 2011 earth-quake (Kobayashi et al., 2011; Feng et al., 2012). Thesestudies mainly focus on deformation over a few to severaltens of kilometers. Here, the focus is on the detection ofsmall-scale surface displacement produced by soil liquefac-tion, using InSAR analysis.
1267

1268 K. ISHITSUKA et al.: LIQUEFACTION AREAS OF THE 2011 TOHOKU EARTHQUAKE
Fig. 1. (a) The study area (black rectangle) overlaid on the Japan Meteorological Agency seismic intensity of the 2011 earthquake (based on Hoshiba etal., 2011). (b) The topography of the Kanto region and the analyzed scene. Two rectangles located on the waterfront along Tokyo Bay and the ToneRiver covered by the SAR data, with ascending and descending orbits. Main branch of the Tone River is shown by a black line. (c) A geomorphologicclassification map of the Kanto region with about a 1-km mesh (based on Wakamatsu et al., 2005).
Fig. 2. Epochs of the SAR data used in this study. We used four SAR data pairs (I1–I4). Two pairs (preseismic pair I1; coseismic pair I3) include thewaterfront along Tokyo Bay, and the other two pairs (preseismic pair I2; coseismic pair I4) include the waterfront along midstream and downstreamof the Tone River. All data pairs (I1–I4) are used to estimate the change in the surface scattering property using the phase-corrected coherence,while two coseismic pairs (I3, I4) are used to estimate the local surface displacement associated with the soil liquefaction. A pink star represents theoccurrence of the 2011 Tohoku earthquake.
2. Method2.1 Interferometric processing
We obtained single-look complex (SLC) data after pre-processing SAR data from a Level-1.0 product. The SARdata were acquired by the Phased Array Type L-band SAR(PALSAR) instrument aboard the Japanese Advanced LandObserving Satellite (Table 1; Figs. 1(b) and 2). SLC data iscomposed of a regular grid with complex values (C), whichis decomposed into amplitude and phase information:
C = A exp(iφ), (1)
where A and φ represent amplitude and phase, respectively.Interferometric processing uses two SLC datasets, calledmaster and slave. After repositioning and resampling eachslave pixel to its corresponding master, we apply the fol-lowing equation at each pixel:
C1C∗2 = A1 A2 exp(i(φ1 − φ2)), (2)
where C1 and C2 represent master and slave SLC data,and * indicates complex conjugation. Equation (2) yieldsamplitude (A1, A2) and phase (φ1, φ2) information that

K. ISHITSUKA et al.: LIQUEFACTION AREAS OF THE 2011 TOHOKU EARTHQUAKE 1269
Table 1. Interferogram and SAR data used. Master and slave indicate the period of SAR data for performing SAR interferometry. Displacement frommaster to slave is estimated via InSAR analysis. Off-nadir and Bperp show representative values of the off-nadir angle and perpendicular componentof baseline, respectively.
Type ID Master Slave Cycles Direction Off-nadir Bperp Covered area
Preseismic I1 20110104 20110219 1 cycle Ascending 34.3◦ 709 m Tokyo Bay
Preseismic I2 20101005 20101120 1 cycle Descending 34.3◦ 593 m Tone River
Coseismic I3 20110219 20110406 1 cycle Ascending 34.3◦ 394 m Tokyo Bay
Coseismic I4 20101120 20110407 3 cycles Descending 34.3◦ 914 m Tone River
describe the relationship between the SAR data in the pair.We sought to detect the distribution of soil liquefaction
using the change in coherence of amplitude A, and to es-timate the ground displacement in the InSAR analysis us-ing phase information φ. Data processing was done usingGAMMA software (Wegmuller and Werner, 1997). By av-eraging three pixels in the range direction, and five in theazimuthal direction, with multi-look processing, per-pixelresolution of the interferogram corresponds to a 14 × 16-mpolygon in slant-range and azimuthal direction.2.2 Damage area detection using decorrelation
The SAR system transmits microwaves and receivesbackscatter signal from illuminated surfaces. Generally,various scatterers (e.g., bare soil, buildings or crops) ex-ist within each SAR data pixel. Reflective intensity (am-plitude) and phase in a pixel is measured as the result ofcoherent summation of all returns from individual scatter-ers. When scatterers change between observations, the sumof scatter returns varies, which leads to decorrelation. Toquantify decorrelation, we calculated the phase-correctedcoherence γ (Hagberg et al., 1995; Guarnieri and Prati,1997):
γ =
∣∣∣∑Nn=1 C (n)
1 C∗(n)
2 exp(−i
(φ
(n)
1 − φ(n)
2
))∣∣∣√∑Nn=1
∣∣∣C (n)
1
∣∣∣2 ∑Nn=1
∣∣∣C (n)
2
∣∣∣2, (3)
where C (n)
1 and C (n)
2 indicate complex signals in each pixeland (φ
(n)
1 − φ(n)
2 ) is the phase difference between masterand slave. N is the number of adjacent pixels used to com-pute coherence as a spatial average, usually called the win-dow size. This size should be large enough to estimatecoherence, because of computing the expectation as spa-tial averages over a number of pixels in an interferometricpair (Touzi et al., 1999; Zebker and Chen, 2005). How-ever, spatial resolution decreases with window size. To es-timate coherence, we chose N = 7 × 7, corresponding toan area roughly 98 × 112 m. This is almost the same asthe number used by Fielding et al. (2005). Generally, co-herence including both amplitude and phase is used in In-SAR analysis. However, this coherence is influenced byphase variation not only from a change of noise in the sig-nal, but also from systematic phase variation caused by to-pographic, atmospheric, or deformation gradients. To quan-tify and classify changes of surface properties attributable toliquefaction, we used phase-corrected coherence calculatedbased on amplitude. Amplitude in an SAR pixel representsbackscatter intensity at a surface location. This intensity isaffected by water content and surface roughness, given the
same incidence angle, polarization, and radar wavelength.Hence, sand boils on the surface or buildings tilted by soilliquefaction alter amplitude relationships among adjacentpixels, generating decorrelation.
Although these surface changes are a source of decor-relation resulting from the earthquake, such decorrelationincludes other effects that must be taken into account. Co-herence comprises contributions from three effects (Zebkerand Villasenor, 1992):
γ = γN γG γT , (4)
where γN represents noise in the radar system and process-ing approach, γG is geometric coherence proportional to theperpendicular component of the baseline, and γT is the in-fluence of temporal backscatter change, e.g. from surfacecover change or vegetation.
Because soil liquefaction appears as a decrease in γT , weneed to extract γT from the total coherence. Therefore, wemade a coherence difference map. This used the result ofsubtracting the coherence of preseismic data pairs (datasetI1 covers Tokyo Bay and I2 covers Tone River; Table 1 andFig. 2) from that of coseismic pairs, acquired before andafter the earthquake (dataset I3 covers Tokyo Bay and I4covers Tone River; Table 1 and Fig. 2):
γdiff = γ c − γ p = γN γG(γ c
T − γp
T
), (5)
where γ c and γ p are the coherence of the coseismic pairand preseismic pair, respectively.
This procedure is based on the assumption that compo-nents γN and γG are identical, or nearly identical, in bothpreseismic and coseismic pairs, for the following reasons.Since SAR data are obtained by the same sensor (PAL-SAR), γN is identical. Supposing observation in a flat areaand an uniform scatterers distribution within a pixel, γG
of the datasets used can be calculated from the value ofperpendicular baselines and critical baseline of PALSAR(about 23000 m). As a result, we obtained γG values 0.97for I1, 0.97 for I2, 0.98 for I3, and 0.96 for I4. These resultsshow that the effect of γG is almost identical.
Although soil liquefaction decreases γT , so does ordinalsurface cover change and vegetation. To obtain a significantchange of γT caused only by the earthquake, we determineda coherence change threshold from the average and standarddeviation of ordinal change in temporal coherence (Eq. (6)).This estimation was made using datasets acquired beforethe earthquake, between 2006 and 2011 (Table 2):
γ thrediff = γ ave
diff − kγ stddiff, (6)
where γ thrediff is the threshold of significant coherence differ-
ence caused by the earthquake at a pixel, and γ avediff and γ std
diff

1270 K. ISHITSUKA et al.: LIQUEFACTION AREAS OF THE 2011 TOHOKU EARTHQUAKE
Table 2. SAR datasets used to estimate general trends of temporal coherence change before earthquake.
Master Slave Cycles Bperp Covered area
20060808 20060923 1 cycle 576 m Tokyo Bay
20071227 20080211 1 cycle 945 m Tokyo Bay
20080211 20080328 1 cycle 96 m Tokyo Bay
20081113 20081229 1 cycle 22 m Tokyo Bay
20081229 20090213 1 cycle 740 m Tokyo Bay
20100216 20100403 1 cycle 144 m Tokyo Bay
20110104 20110219 1 cycle 709 m Tokyo Bay
20080329 20080514 1 cycle 146 m Tone River
20080629 20080814 1 cycle 1507 m Tone River
20090817 20091002 1 cycle 236 m Tone River
20091002 20091117 1 cycle 237 m Tone River
20100520 20100705 1 cycle 139 m Tone River
20100705 20100820 1 cycle 173 m Tone River
20101005 20101120 1 cycle 593 m Tone River
20071228 20080514 3 cycles 616 m Tone River
20090517 20091002 3 cycles 654 m Tone River
20091002 20100102 3 cycles 587 m Tone River
Fig. 3. Differential interferograms representing the regional trend of the surface displacement caused by the 2011 Tohoku earthquake, in each line ofsight (LOS) direction. (a) A differential interferogram calculated from the coseismic pair I3 in Table 1 and Fig. 2. (b) A differential interferogramcalculated from the coseismic pair I4 in Table 1 and Fig. 2. (c) and (d) are the enlarged areas represented by the insets (dashed lines) in (a) and (b),in which the local phase disturbance is evident.
are the average and standard deviation of coherence differ-ence calculated by preseismic datasets (Table 2). k is a co-efficient that represents a weighting factor for standard de-viation. Suppose that the coherence difference at each pixelobeys a normal distribution (random surface cover change),we assumed that the coherence difference beyond 3-sigma(k = 3) represents significant surface change due to lique-faction.
2.3 InSAR analysisFrom interferometric phase information, InSAR analysis
enables us to obtain surface displacements. We used thecoseismic pair datasets I3 (Tokyo Bay) and I4 (Tone River)in this analysis.
To remove the effect of the difference in satellite po-sitions for the two acquisitions of a pair, we used 50-mmesh digital elevation models provided by the Geospatial

K. ISHITSUKA et al.: LIQUEFACTION AREAS OF THE 2011 TOHOKU EARTHQUAKE 1271
Fig. 4. (a) Coherence maps from the preseismic pair, covering Tokyo Bay (I1 in Table 1), (b) the coseismic pair, covering Tokyo Bay (I3 in Table 1),(c) the preseismic pair, covering the Tone River (I2 in Table 1), (d) the coseismic pair, covering the Tone River (I4 in Table 1).
Information Authority of Japan. To retain the high reso-lution of the data, we used an adaptive filter whose per-formance magnitude depends on coherence (Baran et al.,2003). Then, from phase information over the coherencethreshold (0.30), we carefully conducted a phase unwrap-ping procedure using a branch-cut algorithm (Goldstein etal., 1988). A variety of displacement scales may be in-duced by soil liquefaction, and some spatially-small dis-placements may be filtered out or be eliminated by thecoherence threshold. This filtering and unwrapping effectgives a spatially-continuous displacement, which is diffi-cult to obtain from a field survey only. Finally, we ob-tained a differential interferogram that represents the totalsurface displacement caused by the 2011 earthquake alongthe line of sight (LOS) direction (Fig. 3). To display the lo-cal ground subsidence associated with soil liquefaction, weremoved the long-wave ground displacement caused by theearthquake via the application of a best-fit quadratic func-tion.
3. Results and Discussion3.1 Temporal decorrelation
Coherence maps (Fig. 4 and I1, I2, I3 and I4 in Fig. 6)show coherence reduction from three effects (Eq. (4)) be-tween each pair. In the coherence difference maps ofFig. 5(a, b), zero values indicate areas where the coherencedid not change between preseismic and coseismic pairs (thatis, coherence in both interferograms was either high or low).Negative values indicate areas where coherence decreasedin the coseismic pair (I3 or I4) relative to the preseismic pair(I1 or I2). Positive values indicate areas where coherenceof the preseismic pair was lower than that of the coseismicpair. Negative values are distributed over the ground withartificial fill along Tokyo Bay (Fig. 5(a)), and near the banksof the Tone River (Fig. 5(b)). These observations suggestthat physical properties of the ground surface, such as wa-ter content or surface roughness, were changed by the earth-quake in these areas. Although negative values in the coher-ence difference map are possibly associated with the earth-quake, we must discriminate scatter change caused by the2011 earthquake from other temporal effects (e.g., ordinalchange in surface cover or decorrelation from vegetation).Therefore, we estimated the coherence change threshold at

1272 K. ISHITSUKA et al.: LIQUEFACTION AREAS OF THE 2011 TOHOKU EARTHQUAKE
Fig. 5. Difference maps of the phase-corrected coherence (i.e., the coherence difference maps) between (a) I1 and I3 (covering the waterfront alongTokyo Bay), and (b) I2 and I4 (covering the waterfront along the midstream and downstream of the Tone River).
Fig. 6. Coherence maps of each dataset used for areas along (A) Tokyo Bay, and (B) the Tone River.

K. ISHITSUKA et al.: LIQUEFACTION AREAS OF THE 2011 TOHOKU EARTHQUAKE 1273
Fig. 7. Land-cover classification derived from satellite optical data (based on Takahashi et al., 2010, 2012).
Fig. 8. (a) Averages and (b) standard deviations of coherence values, and (c) estimated threshold values of the coherence difference calculated from thepreseismic pair in the areas along Tokyo Bay. (d) Averages and (e) standard deviations of coherence values, and (f) estimated threshold values of thecoherence difference calculated from the preseismic pair in the areas along the Tone River.
each pixel using the average and standard deviation of thecoherence change caused by other temporal effects, whichappears in the coherence difference maps.
To reveal the effects of the temporal and spatial baselineconditions of our analyzed area, we studied datasets beforethe earthquake within a perpendicular baseline of 2000 m(Table 2): one satellite-cycle between 2006 and 2011 cover-ing waterfront areas along Tokyo Bay (seven datasets), andone cycle (seven datasets) and three cycles (three datasets)for the same period along the Tone River. Coherence mapsof each preseismic pair showed that most of the coherencein the areas along Tokyo Bay was stable with time, whilethe coherence along the Tone River was low and variable(Fig. 6). This can be interpreted as a result of surface coverin each area. Land-cover classification derived from opti-cal satellite data (Takahashi et al., 2010, 2012) show ar-eas along the bay to be urban, mainly covered by buildingsand asphalt roads. In contrast, areas along the Tone Riverare classified as paddy, crops and other vegetation, wherebackscatter signals tend to be unstable (Fig. 7). Ordinalcoherence change in paddy and crop areas along the river
were discovered in the analysis (Fig. 6(B)). Along the river,three-cycle pair coherences are lower than those of one-cycle pairs, because surface cover likely changes with theduration of observation (Fig. 6(B)). Considering the phys-ical reason for decorrelation in vegetated and agricultureareas (i.e., surface cover change), it may be inferred thatthere are annual trends of coherence reduction at each pixel.However, since the observation data are limited, we used allone-cycle and three-cycle pairs from areas along the ToneRiver for further analysis.
Next, average and standard deviation of coherence differ-ence values were calculated using all dataset combinationsfor the Tokyo Bay area (21 total combinations), and one-cycle pair and three-cycle pair combinations for the ToneRiver area (21 total combinations) (Fig. 8(a, b, d, e)). Then,according to Eq. (6), we calculated the coherence changethreshold at each pixel. We considered a coherence dif-ference below the threshold as a significant decorrelationcaused by surface changes of the 2011 earthquake (Fig. 8(c,f)). The processing indicated that the threshold in areasalong the bay is nearly zero, because the coherence is stable
1274 K. ISHITSUKA et al.: LIQUEFACTION AREAS OF THE 2011 TOHOKU EARTHQUAKE
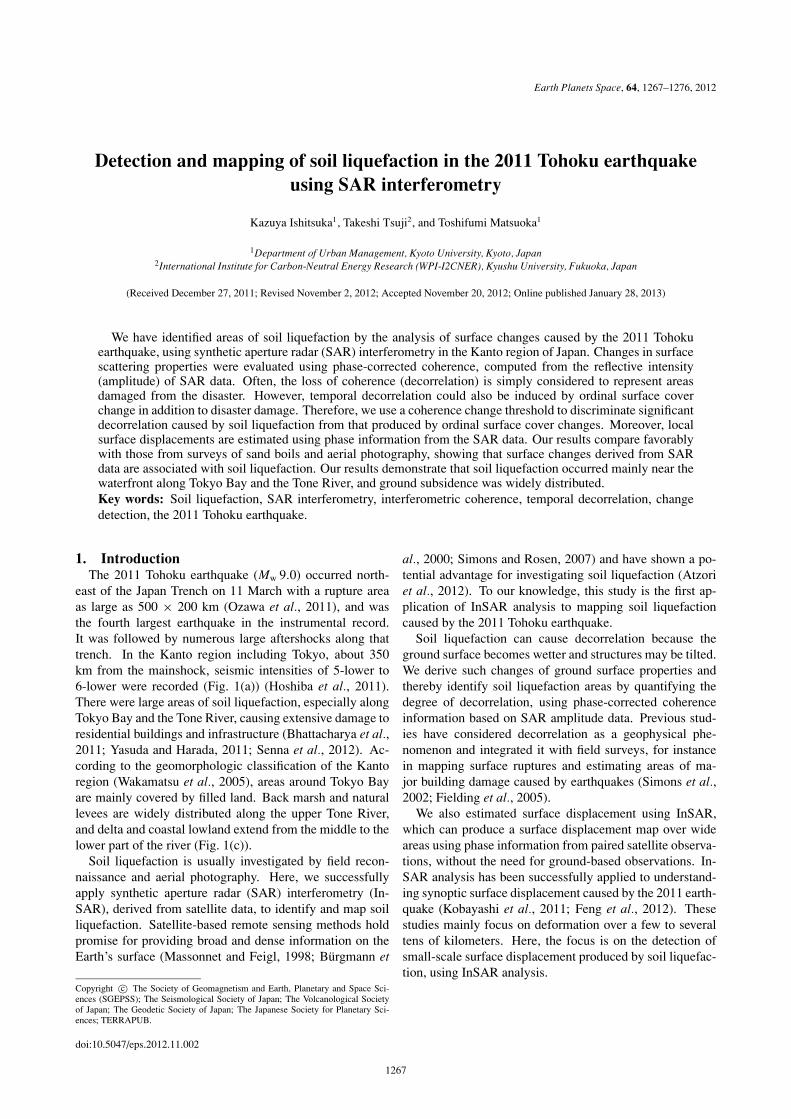
Fig. 9. Estimated liquefaction areas along (a1) Tokyo Bay and (b1) the Tone River. Observed liquefaction through field surveys conducted by KRDBand JGS (2011) overlaid on the estimated liquefaction for the waterfronts along (a2) Tokyo Bay and (b2) the Tone River. Red and blue indicateliquefaction and non-liquefaction areas, respectively, detected by field survey. Yellow and orange areas indicate the negative coherence areas belowthe coherence reduction threshold value. Significant coherence reduction cannot be estimated in gray areas where coherence in preseismic pair is lessthan the threshold value. Bold black lines indicate the Tone River.
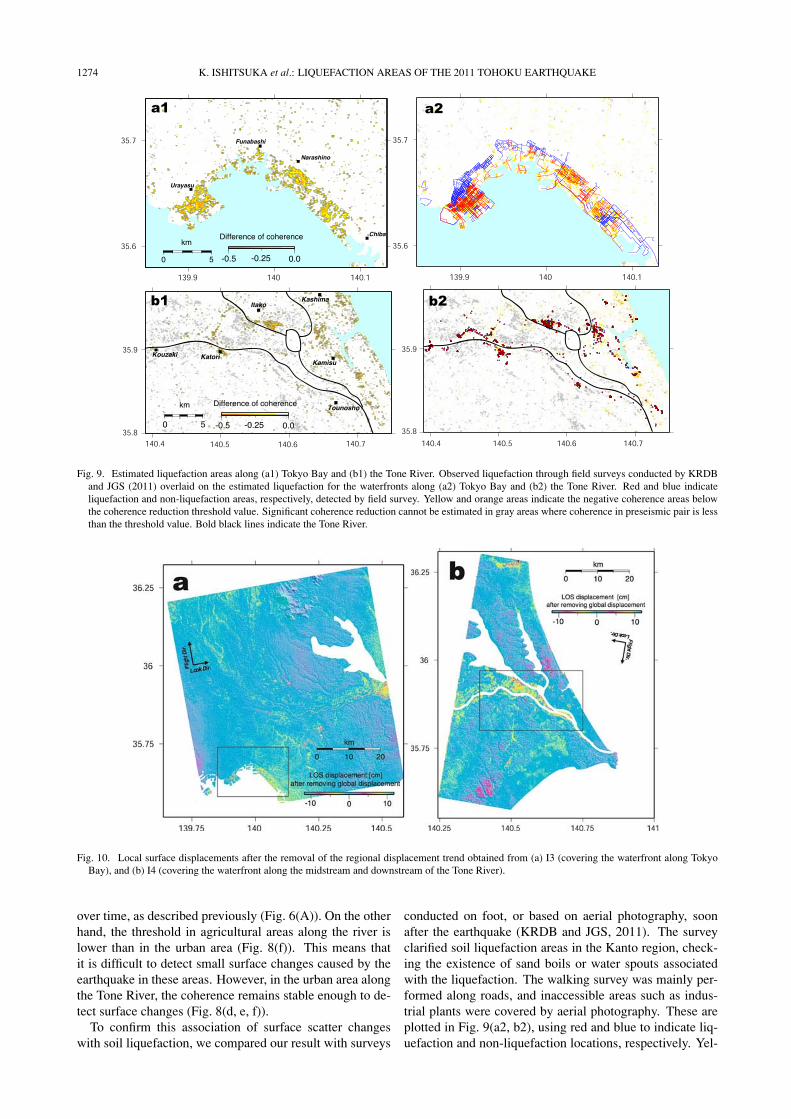
Fig. 10. Local surface displacements after the removal of the regional displacement trend obtained from (a) I3 (covering the waterfront along TokyoBay), and (b) I4 (covering the waterfront along the midstream and downstream of the Tone River).
over time, as described previously (Fig. 6(A)). On the otherhand, the threshold in agricultural areas along the river islower than in the urban area (Fig. 8(f)). This means thatit is difficult to detect small surface changes caused by theearthquake in these areas. However, in the urban area alongthe Tone River, the coherence remains stable enough to de-tect surface changes (Fig. 8(d, e, f)).
To confirm this association of surface scatter changeswith soil liquefaction, we compared our result with surveys
conducted on foot, or based on aerial photography, soonafter the earthquake (KRDB and JGS, 2011). The surveyclarified soil liquefaction areas in the Kanto region, check-ing the existence of sand boils or water spouts associatedwith the liquefaction. The walking survey was mainly per-formed along roads, and inaccessible areas such as indus-trial plants were covered by aerial photography. These areplotted in Fig. 9(a2, b2), using red and blue to indicate liq-uefaction and non-liquefaction locations, respectively. Yel-

K. ISHITSUKA et al.: LIQUEFACTION AREAS OF THE 2011 TOHOKU EARTHQUAKE 1275
Fig. 11. Local surface displacements near the waterfront along (a1) Tokyo Bay and (b1) the Tone River. Local surface displacements in the liquefactionareas along (a2) Tokyo Bay and (b2) the Tone River.
low and orange areas in Fig. 9(a1, a2, b1, b2) indicate neg-ative values of phase-corrected coherence, under the esti-mated threshold. Significant decorrelation due to disas-ter in areas where the coherence of the preseismic pair islower than the threshold value cannot be detected in prin-ciple. These areas are plotted in gray in Fig. 9(a1, a2, b1,b2). Comparison shows that 85% and 61% of liquefactionlocations detected by the field survey of KRDB and JGS(2011) in areas along Tokyo Bay and the Tone River, respec-tively, are consistent with the present results. Because ofthis consistency, negative coherence corresponds to surfacechanges from soil liquefaction caused by the 2011 earth-quake. Agreement in areas along the bay is slightly greaterthan along the river, probably because coherence was tem-porally stable in those areas (Fig. 6), resulting in easy de-tection of coherence change.3.2 InSAR-derived surface displacement
Figures 10 and 11 show local surface displacement in-ferred by InSAR, after the removal of global surface dis-placement. Magnitudes between about −30 to 3 cm weredetected in the soil liquefaction areas along Tokyo Bay andthe Tone River. Although local changes in the positive rangeare also found outside the soil liquefaction areas, we cannotcompletely determine whether these changes reflect surfacedisplacement or other effects (e.g., quadratic fitting error oratmospheric artifacts) (Fig. 10). Nevertheless, the magni-tude of these changes (less than 3 cm) is much smaller thanthat of local surface displacement in soil liquefaction ar-eas. Previous studies have shown that decorrelation leadsto an increase of phase variance (Rodriguez and Martin,1992; Just and Bamler, 1994). In the soil liquefaction areas,there are certainly decorrelation-induced phase discontinu-ities (e.g., A in Fig. 11(a1), C in Fig. 11(b1)); however, we
partly obtained a spatially-continuous displacement (e.g., Bin Fig. 11(a1)). Since most of the SAR data in liquefactionareas were collected in only one direction (not both ascend-ing and descending orbits), we cannot explicitly determinewhether these local surface displacements were subsidence.We inferred that local displacement may be ground subsi-dence, because soil liquefaction can cause soil grains to re-arrange into a more dense packing due to the phenomenathat a mass of soil loses its shear resistance and pore waterpressures increase, and such displacement is at liquefactionlocations where the ground surface is flat.
Estimated local ground displacements demonstrate char-acteristics of local displacement in each area. Along TokyoBay, this displacement was particularly widespread andcontinuous in the Narashino area (B in Fig. 11(a1)). Acontinuous fringe pattern predominates in the Narashino(B in Fig. 11(a1)) and Chiba areas, whereas a discontin-uous fringe pattern dominates in the Urayasu area (A inFig. 11(a1)). These observations suggest that continuousfringe pattern areas are uniformly deformed over a rela-tively wide area, but this is not true of discontinuous areas.
4. ConclusionsWe detected changes of surface scattering properties
caused by the 2011 Tohoku earthquake, using the differ-ence of phase-corrected coherence between preseismic andcoseismic SAR data pairs. To retrieve the significant decor-relation signal attributable to the earthquake, we proposedthe use of a coherence change threshold estimated from pre-seismic datasets. We also revealed local surface displace-ments using InSAR analysis. The results are consistent withfield surveys. Therefore, these surface changes are associ-ated with soil liquefaction. The areal extent of soil lique-

1276 K. ISHITSUKA et al.: LIQUEFACTION AREAS OF THE 2011 TOHOKU EARTHQUAKE
faction inferred from our analysis is difficult to obtain fromground-based measurements. This study shows that SARdata is effective for investigating the extent and detail ofsoil liquefaction.
In selecting the SAR data, Massonnet and Feigl (1998)reported that the maximum detectable deformation gradi-ent is one fringe per pixel. Thus, long-wavelength, high-resolution SAR data are better for detecting high deforma-tion gradients associated with soil liquefaction. This meansthat L-band SAR data are superior to C-band and X-banddata, given the same spatial resolution. We performed SARinterferometry analysis and then compared the result withfield survey results. However, InSAR analysis carried outimmediately after an earthquake shows promise in effec-tively guiding subsequent field surveys.
Acknowledgments. The PALSAR data used in this study be-long to the Ministry of Economy, Trade and Industry (METI)and the Japan Aerospace Exploration Agency (JAXA). Level-1.0 data were processed and provided by the Earth Remote Sens-ing Data Analysis Center (ERSDAC). We also acknowledge theKanto Regional Development Bureau of the Ministry of Land,Infrastructure, Transport and Tourism (KRDB) and the JapaneseGeotechnical Society (JGS) for providing soil liquefaction data.The land cover map was produced and furnished by the Earth Ob-servation Research Center, Japan Aerospace Exploration Agency(JAXA/EORC). We also express our appreciation to two review-ers (Dr. Taku Ozawa and anonymous) for their insightful com-ments, which helped us improve this paper. The authors acknowl-edge support for this study from ERSDAC and the Global Cen-ter for Education and Research on Human Security Engineeringfor Asian Megacities (GCOE). T. Tsuji gratefully acknowledgesthe support of the International Institute for Carbon Neutral En-ergy Research (I2CNER), sponsored by the World Premier Inter-national Research Center Initiative (WPI), MEXT, Japan.
ReferencesAtzori, S., C. Tolomei, A. Antonioli, J. P. M. Boncori, S. Bannister, E.
Trasatti, P. Pasquali, and S. Salvi, The 2010−2011 Canterbury, NewZealand, seismic sequence: Multiple source analysis from InSAR dataand modeling, J. Geophys. Res., 117, B08305, 2012.
Baran, I., M. P. Stewart, B. M. Kampes, Z. Perski, and P. Lilly, A modi-fication to the Goldstein radar interferogram filter, IEEE Trans. Geosci.Remote Sens., 41, 2114–2118, 2003.
Bhattacharya, S., M. Hyodo, K. Goda, T. Tazoh, and C. A. Taylor, Liq-uefaction of soil in the Tokyo Bay area from the 2011 Tohoku (Japan)earthquake, Soil Dyn. Earthq. Eng., 31, 1618–1628, 2011.
Burgmann, R., P. A. Rosen, and E. J. Fielding, Synthetic aperture radar in-terferometry to measure Earth’s surface topography and its deformation,Ann. Rev. Earth Planet. Sci., 28, 169–209, 2000.
Feng, G., X. Ding, Z. Li., J. Mi, L. Zhang, and M. Omura, Calibration ofan InSAR-derived coseismic deformation map associated with the 2011Mw-9.0 Tohoku-oki Earthquake, IEEE Trans. Geosci. Remote Sens.Lett., 9, 302–306, 2012.
Fielding, E. J., M. Talebian, P. A. Rosen, H. Nazari, J. A. Jackson, M.Ghorashi, and R. Walker, Surface ruptures and building damage of the2003 Bam, Iran, earthquake mapped by satellite synthetic aperture radarinterferometric correlation, J. Geophys. Res., 110, B03302, 2005.
Goldstein, R. M. and C. L. Werner, Radar Interferogram Filtering forGeophysical Applications, Geophys. Res. Lett., 25, 4035–4038, 1998.
Goldstein, R. M., H. A. Zebker, and C. L. Werner, Satellite radar interfer-ometry: Two-dimensional phase unwrapping, Radio Sci., 23, 713–720,1988.
Guarnieri, A. M. and C. Prati, SAR interferometry: A “Quick and Dirty”coherence estimator for data browsing, IEEE Trans. Geosci. RemoteSens., 35, 660–669, 1997.
Hagberg, J. O., L. M. H. Ulander, and J. Askne, Repeat-pass SAR inter-ferometry over forested terrain, IEEE Trans. Geosci. Remote Sens., 33,331–340, 1995.
Hoshiba, M., K. Iwakiri, N. Hayashimoto, T. Shimoyama, K. Hirano, Y.Yamada, Y. Ishigaki, and H. Kikuta, Outline of the 2011 off the Pacificcoast of Tohoku Earthquake (Mw 9.0)—Earthquake Early Warning andobserved seismic intensity—, Earth Planets Space, 63, 547–551, 2011.
Just, D., and R. Bamler, Phase statistics of interferograms with applicationsto synthetic aperture radar, Appl. Opt., 33, 4361–4368, 1994.
Kanto Regional Development Bureau of Ministry of Land, Infrastruc-ture, Transport and Tourism (KRDB) and Japanese Geotechnical So-ciety (JGS), Investigation of soil liquefaction in Kanto region asso-ciated with the 2011 Tohoku earthquake (http://www.ktr.mlit.go.jp/ orhttp://www.jiban.or.jp/), 2011 (in Japanese).
Kobayashi, T., M. Tobita, T. Nishimura, A. Suzuki, Y. Noguchi, and M.Yamanaka, Crustal deformation map for the 2011 off the Pacific coastof Tohoku Earthquake, detected by InSAR analysis combined withGEONET data, Earth Planets Space, 63, 621–625, 2011.
Massonnet, D. and K. L. Feigl, Radar interferometry and its application tochanges in the Earth’s surface, Rev. Geophys. 36, 441–500, 1998.
Ozawa, S., T. Nishimura, H. Suito, T. Kobayashi, M. Tobita, and T. Imaki-ire, Coseismic and postseismic slip of the 2011 magnitude-9 Tohoku-Oki earthquake, Nature, 475, 373–376, 2011.
Rodriguez, E. and J. M. Martin, Theory and design of interferometricsynthetic aperture radars, IEE Proc. F, 139, 147–159, 1992.
Senna, S., N. Hasegawa, T. Maeda, and H. Fujiwara, Liquefaction dam-age of the Tonegawa basin caused by the 2011 off the pacific coast ofTohoku earthquake, Proceedings of the International Symposium on En-gneering Lessons Learned from the 2011 Great East Japan Earthquake,719–730, 2012.
Simons, M. and M. Rosen, Interferometric Synthetic Aperture RaderGeodesy, in Treatise on Geophysics, edited by G. Schubert, 391–446,Elsevier B.V, Netherlands, 2007.
Simons, M., Y. Fialko, and L. Rivera, Coseismic deformation from the1999 Mw 7.1 Hector mine, California, Bull. Seismol. Soc. Am., 92,1390–1402, 2002.
Takahashi, M., K. Nasahara, T. Tadono, H. Murakami, and G. Kadosaki,High accuracy land cover map by “Daichi” ALOS satellite, Proceedingsof the 49th Annual Meeting of Remote Sensing Society of Japan, 41–42,2010 (in Japanese with English abstract).
Takahashi, M., K. Nasahara, T. Tadono, T. Watanabe, M. Doutsu, T. Sug-imura, and N. Tomiyama, Update of JAXA high resolution land-use andland-cover map and maintenance of ground validation data, Proceed-ings of the 52th Annual Meeting of Remote Sensing Society of Japan,81–82, 2012 (in Japanese with English abstract).
Touzi, R., A. Lopes, J. Bruniquel, and P. W. Vachon, Coherence estimationfor SAR imagery, IEEE Trans. Geosci. Remote Sens., 37, 135–149,1999.
Wakamatsu, K., S. Kubo, M. Matsuoka, K. Hasegawa, and M. Sugiura,Japan Engineering Geomorphologic Classification Map, 96 pp, Univer-sity of Tokyo Press, Japan, 2005 (product serial number: JEGM0001).
Wegmuller, U. and C. L. Werner, Gamma SAR processor and interferome-try software, Proceedings of the 3rd ERS Symposium, Eur. Space AgencySpec. Publ., ESA SP-414, 1686–1692, 1997.
Yasuda, S. and K. Harada, Liquefaction-induced Damage in the ReclaimedLands along Tokyo Bay, J. Jpn. Geotech. Soc., 59, 38–41, 2011 (inJapanese with English abstract).
Zebker, H. A. and K. Chen, Accurate estimation of correlation in In-SAR observations, IEEE Trans. Geosci. Remote Sens. Lett., 2, 124–127,2005.
Zebker, H. A. and J. Villasenor, Decorrelation in interferometric radarechoes, IEEE Trans. Geosci. Remote Sens., 30, 950–959, 1992.
K. Ishitsuka (e-mail: k [email protected]), T. Tsuji,and T. Matsuoka