detection and classification techniques of citrus leaves
TRANSCRIPT

Turkish Journal of Computer and Mathematics Education
__________________________________________________________________________________
3499
Research Article
Vol.12 No.6 (2021), 3499-3510
Detection and Classification Techniques of Citrus Leaves
Diseases: A Survey
Ashok Kumar Sainia, Roheet Bhatnagar
b, Devesh Kumar Srivastava
c
a Research Scholar, Department of Computer Science & Engineering, Manipal University Jaipur, Rajasthan (India). b Professor, Department of Computer Science & Engineering, Manipal University Jaipur, Rajasthan (India). cProfessor, Department of Information and Technology, Manipal University Jaipur, Rajasthan (India).
Article History: Do not touch during review process(xxxx)
_____________________________________________________________________________________________________
Abstract: Agricultural production is essential to the economic development of any country. That’s why disease identification in plants is critical in the agricultural sector, as a disease in plants is a regular occurrence. If reasonable precautions are not
taken on time, plants can significantly affect the environment, affecting product quality, quantity, and productivity. Lemons, grapes, limes, oranges, etc., are common citrus fruits grown the entire world. About 50% of citrus fruits are wasted each year because of diverse plant sicknesses. This paper offers a survey of various approaches for detecting and classifying diseases in citrus plant leaves. A comprehensive taxonomy of citrus leaf diseases is also presented. A study of automatic illness recognition and classification methods are also discussed. We explore different methods for pre-processing, segmentation, extraction of features and grouping. Discuss also the relevance of functional extraction and techniques of deep learning.
Keywords: Citrus, disease, detection and classification, deep learning
___________________________________________________________________________
1. Introduction
Plant infections are the most severe problem which has a significant impact on agricultural production
quality. The critical task for economic development is to improve production by identifying and classification
plant lesions at an early stage (Gutte& Gitte, 2016). Plants of citrus are infested by scratches such as anthracnose,
scab, greening, black spot, melanosis, downy mildew, and canker (Radhika et al., 2008). Citrus fruits have a wide
range of fibre, vitamins, and minerals, which means having healthy biological behaviours cautiously correlated
with various well-being assistances and inferior the risk of diseases (Boeing et al., 2012). Fruits of citrus have
anti-mutagenic and antioxidant effects, which are significant advantages. There are multiple strategies for
detecting citrus lesions, including active contour, edge tracking, clustering, watershed, saliency, thresholding,
and few others. During all methods, though, the identification mechanism is almost similar. In agricultural
sciences, the pre-processing step can be used to achieve the following goals: (1) To distinguish citrus diseases in
leaves, fruits, and stems (2) to find a cure of diseases (3) to determine colour and outline of affected areas in
plants and (4) to diagnose disease regions in plants of citrus. Segmentation is the process of partitioning the
image with distinct meanings for extracting features. The notable picture elements characterize texture, form,
and colour properties. Segmentation is a procedure of partitioning the image with distinct meanings for
extracting features. Classification is the grouping based on extracted features.
Prajapati et al. (Prajapati et al., 2016) addressed various segmentation and feature extraction techniques,
including region-based, threshold-based, edge-based, Principal Component Analysis, and Gabor filter. They used
colour segmentation with green pixel masking to remove the shadow and applied Otsu thresholding to the
diseased picture. They extracted colour, structure, and texture characteristics and then used a support vector
machine classifier to categorize diseases with high accuracy. Revathi and Hemalatha(Revathi &Hemalatha,
2014) looked at ten different plant diseases, including bacterial blot, late scorch, sunburn, fungal streaks, late
blight, sooty mould early, and so on. SVM is used to classify diseases based on texture features such as
homogeneity, cluster hue, cluster prominence, and contrast.
This survey discussed pre-processing, segmentation, attributes extraction, and disease classification with their
threats, strengths, and weaknesses for citrus fruit diseases. The following is how the remainder of the paper is
structured: The taxonomy of citrus leaf diseases is presented in Section 2. Section 3 provides an in-depth review
of various citrus leaf disease strategies. Section 4 discusses the study. Finally, Section 5 brings the paper to a
conclusion.
2. Citrus diseases taxonomy
Diseases in citrus plants are the principal cause of reduced productivity in the agricultural sector, which results
in the loss of the economy of any country. Citrus fruits are the prominent producer of vitamins C and A. Citrus

Ashok Kumar Saini, Dr. Roheet Bhatnagar, Dr. Devesh Kumar Srivastava
3500
diseases, on the other hand, have had a significant impact on production in terms of quality and quantity. Plants of
citrus such as grapes, oranges, lemons, and limes are affected by various citrus lesions such as anthracnose,
melanosis, greening, canker, scab, and a few others, as seen in Fig. 1, and their symptoms, favorable
circumstances in Table 1. The following is a short outline of several citrus diseases.
Figure 1.Categories of Citrus Diseases
Canker
Citrus canker disease is a very harmful disease, and it is just cancer in citrus plants; lacerations on citrus plant
leaves is the cause. Citrus canker is a bacterial disease that causes citrus plants to produce premature leaves and
fruits. The damaged leaves have white spongy patches that can eventually turn grey or brown. On both sides of
the stems, spots with oily borders or yellowish rings (lesions) can be seen. The presence of lesions may be used
to diagnose this disease in vines(Doh et al. 2019).
Citrus Scab
Scab acne is a combination of bacterial tissues and organisms in citrus fruits and leaves. This acne is often
raised in rose to brownish colour. Scab lesions are brown-yellow and grey-dirty(Doh et al. 2019).
Table 1. Indications of several citrus plant illnesses
Illness Name in
Citrus
Indications Favourable circumstances
Anthracnose Brown or black dot lesions Cool-weather
Canker Water-soaked yellow halo boundaries Spring period
Citrus Scab On leaves develop tiny, semi-translucent,
lesion-like spots.
Summer period
Sooty mould Leaves blackening Seasonal
Powdery mildew White powdery bacteria sometimes form on
the upper side
Moist weather, Cool
Black rot Reddish-brown markings formed on the
leaves irregularly
Warm weather and wet weather
Downy mildew Infested leaves develop steadily browning
yellow-green lesions. The leaves plagued
often drop prematurely.
Season rainy and summer humid
Anthracnose
Anthracnose is the first pathogen to colonize weakened or elderly tissue. Overwatering,rain spray, anddew
arethe reasons for the plants to thrive on stationary copse in the shelter, and they spread a short distance. Citrus
leaves have a more or more miniature battleship, rough field, and a brownish colour with a noticeable purple
boundary. Furthermore, other causes, including sunburn, chemically extreme heat, insect destruction, and
extended storage time, can negatively impact the fruit's appearance. Anthracnose lesion spots are brown and
1.5mm in diameter or larger(Doh et al. 2019).

Detection and Classification Techniques of Citrus Leaves Diseases: A Survey
3501
Black Spot
In black spots, disease plants are susceptible, and the atmosphere is favourable to disease, the black spot in
citrus, also known as CBS. Oval, tiny, hazardous spots with grey cubes are the symbols of citrus fruits and
leaves. Black spot lesions are dark brown and have a width of 0.12 to 0.4 inches.
Melanosis
It is a saprophyte whose strictness is moderate. The expanse of microorganisms on departed leaves in plants
shelter is used to describe it. A tiny brown spot appears on the leaf, which converts into a red-brown gum. The
age of the fruit determines fruit signs at the time of infection. On the exterior of fruit and leaves in citrus, the
symptoms appear(Sharif et al. 2018).
Greening
Yellow dragon infections, also known as greening, are caused by a bacteria pathogen. Greening infection is
hard to manage and replicate in infected plants. Orange, better, and misshapen fruits are produced by the infected
plants, making them unfit for sale as fresh fruits or juice. There is no treatment for a plant after it has been
infected, and it will die. Weed management, foliar feeding, drainage, sediment fertilizer, and effective psyllid
management will help keep plants healthy and profitable(Priya 2016).
3. Recognition and classification of citrus illness
This section contains a thorough outline of image processing procedures in fig. 2 that are used to recognize and
categorize citrus diseases. These measures include the use of all citrus fruits and leaves. Automated picture
processing procedures consist of four stages: pre-processing, segmentation, feature withdrawal, and classification.
Each step has its challenges, strength, and weakness.
Figure 2. Citrus disease detection and classification techniques
3.1.Pre-processing based techniques
It is pre-processingmeans to improve the input image's optical consistency. This eliminates many problems
such as luminosity, lighting, and issues related to weak contrast. Pre-processing is an essential part of the image
processing phase since low contrast photographs impair the precision of the lesion segmentation. A hybrid
stretching technique related to aGaussian and top-hat filter function is used(Sharif et al. 2018). The top-hat filter is
initially made on the inputimage. The laceration contrast can be increased by including the top-hat filter image and
the Gaussian-different image shown in Fig 3.

Ashok Kumar Saini, Dr. Roheet Bhatnagar, Dr. Devesh Kumar Srivastava
3502
Figure 3. Variance of image enhancement: (a) input image; (b) image after top-hat filter; (c) actual image in
Gaussian; (d) enhanced picture(Sharif et al. 2018)
3.1.1. Challenges
Compared to the initial picture, the pre-processing phase makes the disease area in the image more apparent,
as in fig. 3. The problems of the pre-processingof images are (1) low-intensityinput images; (2) the noisy
foreground from the achene covering;(3) variation in lighting; (4) many associated severances with thousands of
diverse frequency ranges; and (5) achieving the best contrast among the background and the fruit covering. These
difficulties have a significant impact on the precision of disease segmentation. The literature describes
variouspre-processing techniques, includingtop-hat filtering, colour spaces, median filtering, etc.
3.1.2. Picture enhancement
Histogram equalization, colour transformation are examples of image enhancement. For transforming RGB
colour space pictures to grayscale, colour transformation is used. For picture clarity, the histogram equalization
technique is used(Abdullah et al. 2012). Another approach for detecting plant diseases that use pre-processing
methods and a fuzzy logic system to identify the plant's lesions has been suggested. The goal of this study was to
find conditions in leaves in watermelon. To remove RGB details from photographs, RGB colour is used.
Anthracnose and mildew disease accuracies are 67% and 70%, respectively, according to the method(RAJESH
PYDIPATI 2004).
3.1.3. Colour based transformation
Renuka(Kajale 2015) suggested an image pre-processing scheme-based method for automated disease
detection. Soft mould, late sign, early fire, slight achromatic colour, and grey mould were among the five
diseases studied by the author. There are four main steps of this scheme. Initial photos are captured and
converted to HSI colour space transfer in the first step. The green pixel is protected and minimised in a
subsequent actionusingactual threshold values. The K-means sequence is for segmentation in the 3rd step, and
the features of texture are takeout using SGDM. Thediseases leaves are measured for the texture study(Rumpf et
al. 2010). Tushar and colleagues suggested a picture pre-processing-based method for detecting crop leave
diseases. The writers chose tiny whiteness Cottony mould, ashen mould, early scorch, and late scorch for this
study. To begin, a base image is created and converted to a colour space conversion. The green pixel is masked
after segmentation using the K-mean technique. Furthermore, the impacted regions' pixel values are deleted.
Finally, using a neural network classifier, the characteristics are extracted, and the system's precision rate is
between 83 and 94 percent(Hayat, Abdullah, and Chaudary 2007).
3.1.4. Noise reduction & resizing
(Ying et al. 2009)Noise is removed using simple and median filters, and photographs are segmented into the
spot backdrop using thresholding. The disease spots are classified by performing edge detection and snake
methods and got higher classification accuracy. (SS et al. 2011)focused on picture pre-processing and machine
learning strategies and created a hybrid smart system for detecting diseases in pomegranate fruits. There are four
key stages to the system's operation: After capturing the original images with a sensor, pre-
processingstrategieslike noise removal,scanning,enhancement, and morphological operations, resizing,
segmentation, and others, are implemented. The colour, texture, and shape features are then extracted, and these
extracted geographies are then fed into machine learning techniqueslike ANN and getting better classification
accuracy(Pujari, Yakkundimath, and Byadgi 2015).

Detection and Classification Techniques of Citrus Leaves Diseases: A Survey
3503
3.2.Image segmentationtechniques
The term "segmentation" refers to the division of a picture into many bits. The most general definition of
segmentation is detecting an image's region of interest (ROI). The difficulties in disease segmentation, as well as
their meanings, are outlined below.
3.2.1. Challenges
The main goal of picture segmentation in agriculture and other sectors is to distinguish the illness and context
parts of the picture. Numerous challenges happen for segmentation of ailment parts in the image, including (1)
change of disease colour while doing colour-based segmentation; (2) considerable inconsistency of colours
become segmentation procedures complex; (3) change in disease part size; (4) volume of fruits. These issues
wreak havoc on disease detection precision and reduce the system's overall efficiency. Below is a brief overview
of some common segmentation approaches, such asedge detection, thresholding, and K-means(Iqbal et al. 2018).
Table 2 has the strength and weakness of different segmentation approaches.
3.2.2. Thresholding
Thresholding is a straightforward segmentation strategy. The value of thresholding obtained usinga histogram
of the input pictures are used to complete the segmentation. As a result, Accurate edge detection will give
accuratethreshold values. This technique is ineffective when images are complicated; this is the weakness of this
technique.(Zhihua et al. 2013)demonstrated a segmentation technique focused on colour attributes and field
thresholding. The characteristics are used to differentiate between infections. Various black limits are used to
assess the effectiveness of field thresholding. (Patil and Bodhe 2011) determineOtsu threshold, K-mean
clustering and two image processing techniques. As opposed to the Otsu thresholding method, the k-
meansapproach produces more significant outcomes. (Phadikar 2012)suggested the use of basic threshold and
triangle threshold strategies. Leaf region and affected area are segmented using these techniques. This device has
a 98.6 percent overall accuracy(Iqbal et al. 2018).
3.2.3. Edge detection
Researchers like Gradient, Sobel, Canny, Robert, and Laplacian presented many edge detection techniques.
Propose an edge identification segmentation(Singh and Misra 2017) method for cotton leaf spot diseases. Picture
features like border,texture, colour, and form are calculated after segmentation to categorize the diseased
location; these derived features are used by neural network for disease categorization. This classifier recognises
wood diseases and differentiates between applications for fungicides. Using an edge detection segmentation
strategy, created a method for identifying cotton leaf diseases.
3.2.4. K-means clustering
The segmentation is finished by the K-means clustering method. It divides tainted photos into several
clusters. A solitary cluster is a group of picture elements comparable together but separates from the values of
other clusters. Dheeb has created a technique for recognizing illnesses focused on segmentation strategies for
plant leaves and stems. Initially, input images by the K-means methodology are segmented, and then these
segmented pictures are accepted via a NN classifier in the second phase. Five diseases such as late sparrow,
cotton mould,slight whiteness, early sparkling, and the ashen mould are obtained for this function. NN
classification is applied to the classification through automated identification and accurate assistance of the
diseases of the leaves with an accuracy of about 93%(Krishnan and Sumithra 2013). A novel approach has been
implemented in(Pujari and Yakkundimath 2013), which identifies the contamination sections of plants by a K-
means method. In different clusters, the disease and history regions are described.
Table 2. Strength and weakness of segmentation techniques
Segmentation
Techniques
Strength Weakness
K-means
Clustering
Relatively easy and fair fast.
K-mean is appropriate for the
segmentation of vast numbers of
dataset images.
The worse scenarios are bad
results.Time consumption.
Clusters need to be on the same scale
because the closest centre cluster
location is the right one.
Histogram
matching
The low difficulty of measurement.
No prior specifics are needed.
Spatial knowledge is not taken into
consideration and does not guarantee
the neighbouring segments.
Region-based Noise in the procedure of Serious measurement difficulty.
Ashok Kumar Saini, Dr. Roheet Bhatnagar, Dr. Devesh Kumar Srivastava
3504
techniques identification.
Display of square elements in the area
due to the partitioning technique.
Edge detection The study is practical for photographs
of more contrast illnesses.
This approach would not work better
if the picture has several edges.
Fuzzy techniques The Inference can be made with fuzzy. Computation should be focused.
Otsu Thresholding If two classes, such as the front and
background, are performed, Otsu
thresholds are suitable.
It takes less time.
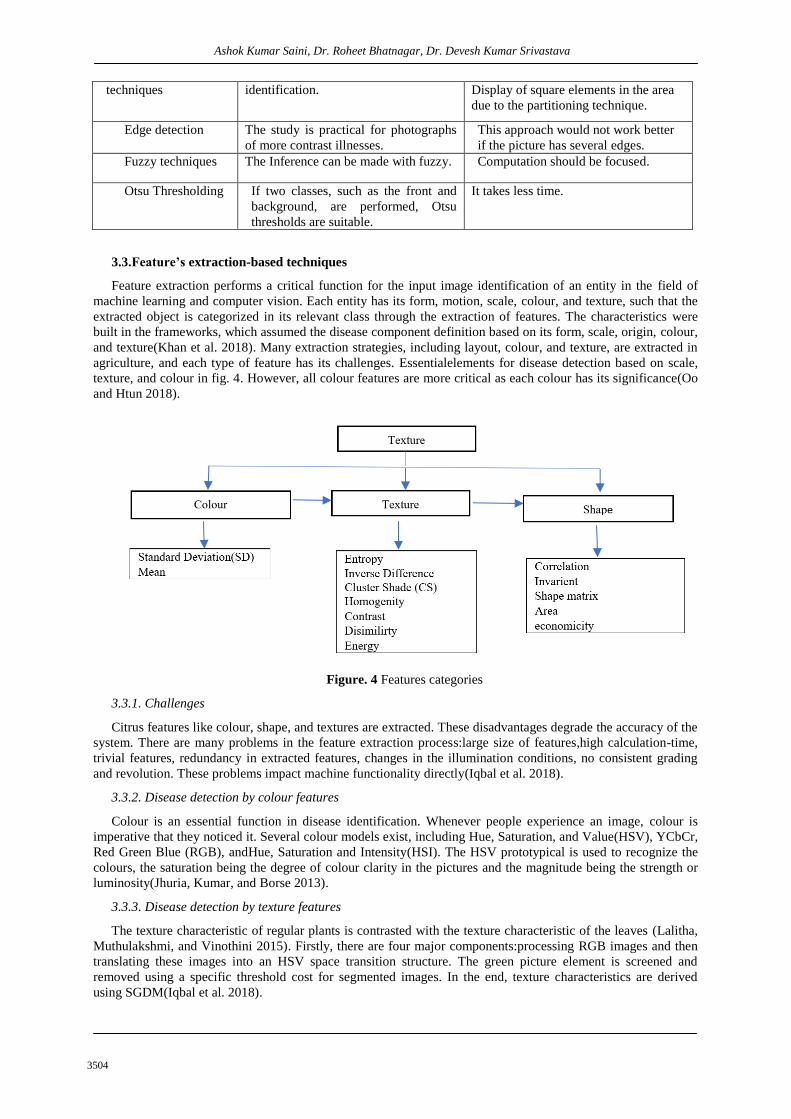
3.3.Feature’s extraction-based techniques
Feature extraction performs a critical function for the input image identification of an entity in the field of
machine learning and computer vision. Each entity has its form, motion, scale, colour, and texture, such that the
extracted object is categorized in its relevant class through the extraction of features. The characteristics were
built in the frameworks, which assumed the disease component definition based on its form, scale, origin, colour,
and texture(Khan et al. 2018). Many extraction strategies, including layout, colour, and texture, are extracted in
agriculture, and each type of feature has its challenges. Essentialelements for disease detection based on scale,
texture, and colour in fig. 4. However, all colour features are more critical as each colour has its significance(Oo
and Htun 2018).
Figure. 4 Features categories
3.3.1. Challenges
Citrus features like colour, shape, and textures are extracted. These disadvantages degrade the accuracy of the
system. There are many problems in the feature extraction process:large size of features,high calculation-time,
trivial features, redundancy in extracted features, changes in the illumination conditions, no consistent grading
and revolution. These problems impact machine functionality directly(Iqbal et al. 2018).
3.3.2. Disease detection by colour features
Colour is an essential function in disease identification. Whenever people experience an image, colour is
imperative that they noticed it. Several colour models exist, including Hue, Saturation, and Value(HSV), YCbCr,
Red Green Blue (RGB), andHue, Saturation and Intensity(HSI). The HSV prototypical is used to recognize the
colours, the saturation being the degree of colour clarity in the pictures and the magnitude being the strength or
luminosity(Jhuria, Kumar, and Borse 2013).
3.3.3. Disease detection by texture features
The texture characteristic of regular plants is contrasted with the texture characteristic of the leaves (Lalitha,
Muthulakshmi, and Vinothini 2015). Firstly, there are four major components:processing RGB images and then
translating these images into an HSV space transition structure. The green picture element is screened and
removed using a specific threshold cost for segmented images. In the end, texture characteristics are derived
using SGDM(Iqbal et al. 2018).
Detection and Classification Techniques of Citrus Leaves Diseases: A Survey
3505
3.3.4. Disease detection by form features
The form(shape) is the essential characteristic of the picture representation. The correct extraction of the form
attribute depends on the method of image segmentation. Since the photographs have been segmented, the border
and pixel of regions are surrounded by the boundary. Thus, form characteristics are split into two stages:
primary, the region-based attribute, and second limits-based.
3.4. Classification methods
Techniques dependent on classifiers are used to classify the images depending on their extractions. The final
phase of the work involves discovering an appropriate leaf disease classification algorithm for the group they
belong. We have selected five main classification algorithms to control their classification suitability. The
algorithm with the best efficiency is designed to construct a final model for its hyperparameters. Multi-SVM,
Artificial Neural Networks (ANN), Random Forest (RF), Naive Bayes(NB), and K-NN are used in this
analysis.The comparative accuracy disease classification of different classifiers shown in Table 3.
Multifunctional SVM (Support Vector Machine): The SVM is a monitored knowledge-based algorithm
used for sorting, regression, clustering, and detection. SVM is essentially a binary linear classifier that separates
two groups with the maximum hyperplane margin. A hyperplane with the longest distance to the closest data
points, thus called a maximum margin hyperplane, provides a good separation; the more significant the margin
lower the generalization error. The feature set may occur in a finite-dimensional space, but it is not linearly
separable in that space. To render the data linearly separable, the kernel function is converted into a higher
dimension domain, where it is linearly separable.
The binary grouping essence of SVM is solved by several single-vs-all and one-vs-one strategies. All classes
are chosen individually in one-vs-all Multi-SVM. One is considered a good mark, and all other categories are
educated as negatives and N classifiers. The issue with imbalanced data is that one class has fewer than all the
other types of samples, and general SVM implementation may be improperly conducted. One-vs-one train is a
different classification for each level, matched one by one, which overcomes the imbalance issue.This
contributes to X(X−1)/2 classifiers that make it even more computer-cost.
Artificial neural networks: ANNs are computer algorithms based on bio-artificial neural networks. These
systems may execute tasks without explicit rules from labelled instances. They dynamically change the weight of
the neurons for a classification task using training examples and attempt to identify new cases based on the
trained consequences. The input layer, output layer, and one or more hidden layers of a multi-layer Artificial
Neural Network are accessible. The number of neurons in the input layer usually is equivalent to the duration of
the functional vector, and the number of neurons in the output layer equal to the number of groups. The number
of hidden layers and neurons in each hidden layer varies depending on the specific problem set and cannot be
calculated in advance.
Random Forest: Overfitting is the underlying dilemma of a decision tree to overcome various storage
methods or praises. Random forest, which fits a series of decision trees on multiple sub-samples of training data
sets and uses an average for improved predictive precision, solves the issue of overfitting. The sample size is still
the same as the sample size so that the samples are replaced. The main benefit of reducing over-fitting is that
random forests are more exact than plain decision trees in most situations. However, the algorithm is complex,
and its forecast pace is sluggish. Estimates are founded on maximum probability(Ahmed, Asif, and Saleem
2021).
Naïve Bayes: It is a stochastic classification technique centred on the principle of Bayes that each function is
autonomous. It seems incorrect and simplistic to assume that each process is independent of some other feature
collection feature. This belief also helps mitigate the complications caused by the dimensionality curse.
Nevertheless, in real-world environments, Naïve Bayes needs no training data and can be calculated quickly.
Naïve Bayes is an algorithm, andseveral classification algorithms are built on the general belief that a
particular feature is independent of some other feature. It can be effectively learned through a guided learning
method, and in specific parameters, estimates the maximum probability.
K-NN: This is a non-parametric algorithm used to detect grouping, regression, or outlier. It is a supervised
learning algorithm that does not attempt to build a model but instead stores the data's training examples. The
designation is carried out by a clear majority vote of the closest neighbours. This is a favourite algorithm for
massive or noisy training data and is simpler to apply. Selection of the value of K is the issue with K-NN. Less
importance of K allows more acceptable boundaries of decisions leading to overfitting, and higher K results in
cleaner boundaries leading to worse classification accuracy owing to higher bias. The determination of K's
adequate value is computationally costly because all training samples must calculate the distance from each case

Ashok Kumar Saini, Dr. Roheet Bhatnagar, Dr. Devesh Kumar Srivastava
3506
Table 3. Various classifiers accuracy
Year/Reference Problem Methodology Dataset accuracy
2016(Sladojevic et al.
2016)
Deep NN
a Leafclassification
recognition of plant
diseases.
Deep CNN Dataset of citrus
photographs
obtained from the
Internet.
96.3%
2016(Wetterich et al.
2016)
Detecting Citrus canker SVM Training samples
size-20 Test sample
size-180.
97.8%
2016(Sandika et al.
2016)
Detect disease in grapes
leaves.
Random
forest
Grapes leaves 86%
2016(Waghmare,
Kokare, and
Dandawate 2016)
Detection of diseases in
grape leaves.
SVM
classifier
450 leaves image,160
healthy and 290
diseased.
96.6%.
2016(Padol and Yadav
2016)
Detection disease in
grape leaves
SVM Grapes leaves 88.89%
2017(Ustad, Korke,
and Bhaldar 2007)
Identification of a
diseased region of
grape leaves.
SVM grape leaves 90%.
2018(Behera et al.
2018)
Classify Orange fruits
diseases.
M-SVM The dataset of orange
fruit is 20 images
90%
2019(Doh et al. 2019) Citrus diseases
classification.
SVM, ANN Kaggle dataset
images
SVM -
93.12%
ANN -
88.96%
2019(Adeel et al.
2019)
Finding optimum grape
characteristics from
pictures.
Multi-
SVM
plant village dataset 91.4%
2019(Aravind et al.
2018)
Extraction of features
from the grape leaves.
CNN The dataset consisted
of 4063 diseased
leaves.
99.23%
.
2019(Jaisakthi et al.
2019)
Detection of diseases in
grapes
Adaboost
SVM,
Random
Forest
plant village dataset
5675
Adaboo
st –74.79%
SVM –
91%
Rando
m Forest –
83%
3.5. Performance measures
Several success metrics are included in algorithm assessment literature. This has performance,
sensitivity,accuracy rate, curve region (AUC),time, FNR, and FPR in Table 4. Exactness distinguishes between
right and incorrect samples thatevaluate the true negatives and truepositives. The sensitivity is often defined as an
actual positive rate that determines the photographs are appropriately labelled. The AUC is equal to the
likelihood that a classifier classifies how far more optimistic or pessimistic is the situation? (Radhakrishnan
2020).

Detection and Classification Techniques of Citrus Leaves Diseases: A Survey
3507
Table 4. Performance measures
4. Discussion
This section addressed the detection and grouping of illnesses in citrus fruits and leaves, their benefits,
andtheir drawbacks. Pre-processing techniques show how Euclidian distance techniques, improved colour
symbols, and grayscale techniques work well in most citrus diseases. The segmentation process is a crucial phase
in identifying areas that have been contaminated. K-means clustering, single and region thresholding are
effective and infected area is easily noticeable. These segmentation strategies do well for identifying the Region
of Interest (ROI). Various features like shape, colour, texture, etc. extracted by different techniques, but the
identification of disease based on texture features provides good results for disease classification. Other features
also help for disease identification. For the efficiency of the classification process, the primary feature collection
is more essential. For disease classification, Neural Network and Support Vector Machine techniques provide
better classification than other classification techniques.
5. Conclusion
In this survey, several image processing approaches for the recognition of plant diseases are addressed. It
involves four key stages, including (1) preprocessing; (2) segmentation; (3) feature extraction; and (4)
classification. Every step is compared with its methodology, efficiency, strength, and weakness. Through this
survey, we found that image preprocessing strategies contribute to growing the precision of segmentation. During
this survey, the k-means technique found the most critical segmentation strategy for diseased plants. The most
prominent characteristic of the picture is a texture for the depiction of disease, and SVM and NN are using these
characteristics. This requires their efforts to incorporate an effective, fast, reliable, and automated system to
recognize diseases on uninfluenced citrus leaves. The population includes prospective teachers of Tirunelveli
District. The investigators used simple random sampling technique and randomly selected 250 prospective
teachers in Tirunelveli District.
References
1. Abdullah, N. E., Hashim, H., Yusof, Y. W. M., Osman, F. N., Kusim, A. S., & Adam, M. S.
(2012). A characterization of watermelon leaf diseases using Fuzzy Logic. ISBEIA 2012 -
Ashok Kumar Saini, Dr. Roheet Bhatnagar, Dr. Devesh Kumar Srivastava
3508
IEEE Symposium on Business, Engineering and Industrial Applications, 1–6.
https://doi.org/10.1109/ISBEIA.2012.6422869.
2. Adeel, A., Khan, M. A., Sharif, M., Azam, F., Shah, J. H., Umer, T., & Wan, S. (2019).
Diagnosis and recognition of grape leaf diseases: An automated system based on a novel
saliency approach and canonical correlation analysis based multiple features fusion.
Sustainable Computing: Informatics and Systems, 24, 100349.
https://doi.org/10.1016/j.suscom.2019.08.002.
3. Ahmed, N., Asif, H. M. S., & Saleem, G. (2021). Leaf Image-based Plant Disease
Identification using Color and Texture Features. 1–29. http://arxiv.org/abs/2102.04515.
4. Aravind, K. R., Raja, P., Aniirudh, R., Mukesh, K. V, Ashiwin, R., & Vikas, G. (2018).
Transfer Learning Approach (Vol. 2018). Springer International Publishing.
https://doi.org/10.1007/978-3-030-00665-5.
5. Behera, S. K., Jena, L., Rath, A. K., &Sethy, P. K. (2018). Disease Classification and Grading
of Orange Using Machine Learning and Fuzzy Logic. Proceedings of the 2018 IEEE
International Conference on Communication and Signal Processing, ICCSP 2018, 678–682.
https://doi.org/10.1109/ICCSP.2018.8524415.
6. Boeing, H., Bechthold, A., Bub, A., Ellinger, S., Haller, D., Kroke, A., Leschik-Bonnet, E.,
Müller, M. J., Oberritter, H., Schulze, M., Stehle, P., &Watzl, B. (2012). Critical review:
Vegetables and fruit in the prevention of chronic diseases. European Journal of Nutrition,
51(6), 637–663. https://doi.org/10.1007/s00394-012-0380-y.
7. Doh, B., Zhang, D., Shen, Y., Hussain, F., Doh, R. F., &Ayepah, K. (2019). Automatic citrus
fruit disease detection by phenotyping using machine learning. ICAC 2019 - 2019 25th IEEE
International Conference on Automation and Computing, September, 1–5.
https://doi.org/10.23919/IConAC.2019.8895102.
8. Gutte, V. S., & Gitte, M. A. (2016). Survey on Recognition of Plant Disease with Help of
Algorithm. International Journal of Engineering Science and Computing, February.
https://doi.org/10.4010/2016.1691.
9. Hayat, S. A., Abdullah, A., &Chaudary, M. A. (2007). Automatic cleansing and classification
of cotton leaves , bolls and flower images using cmyk colour splitting. Enviromental and Rural
Sustainability through ICT, c.
10. Iqbal, Z., Khan, M. A., Sharif, M., Shah, J. H., ur Rehman, M. H., &Javed, K. (2018). An
automated detection and classification of citrus plant diseases using image processing
techniques: A review. Computers and Electronics in Agriculture, 153(July), 12–32.
https://doi.org/10.1016/j.compag.2018.07.032.
11. Jaisakthi, S. M., Mirunalini, P., Thenmozhi, D., &Vatsala. (2019). Grape leaf disease
identification using machine learning techniques. ICCIDS 2019 - 2nd International Conference
on Computational Intelligence in Data Science, Proceedings, 1–6.
https://doi.org/10.1109/ICCIDS.2019.8862084.
12. Jhuria, M., Kumar, A., &Borse, R. (2013). Image processing for smart farming: Detection of
disease and fruit grading. 2013 IEEE 2nd International Conference on Image Information
Processing, IEEE ICIIP 2013, 521–526. https://doi.org/10.1109/ICIIP.2013.6707647.
13. Kajale, R. R. (2015). Detection &Recognization of Plant Leaf Diseases Using Image
Processing and Android O .S . International Journal of Engineering Research and General
Science, 3(2), 6–9.
14. Khan, M. A., Sharif, M., Javed, M. Y., Akram, T., Yasmin, M., & Saba, T. (2018). License
number plate recognition system using entropy-based features selection approach with SVM.
IET Image Processing, 12(2), 200–209. https://doi.org/10.1049/iet-ipr.2017.0368.
15. Krishnan, M., &Sumithra, M. G. (2013). A novel algorithm for detecting bacterial leaf scorch
(BLS) of shade trees using image processing. 2013 IEEE 11th Malaysia International
Conference on Communications, MICC 2013, November, 474–478.
https://doi.org/10.1109/MICC.2013.6805876.
16. Lalitha, K., Muthulakshmi, K., &Vinothini, A. (2015). Proficient acquaintance based system
for citrus leaf disease recognition and categorization. 6(3), 2519–2524.

Detection and Classification Techniques of Citrus Leaves Diseases: A Survey
3509
17. Oo, Y. M., &Htun, N. C. (2018). Plant Leaf Disease Detection and Classification using Image
Processing. International Journal of Research and Engineering, 5(9), 516–523.
https://doi.org/10.21276/ijre.2018.5.9.4.
18. Padol, P. B., & Yadav, A. A. (2016). SVM classifier based grape leaf disease detection.
Conference on Advances in Signal Processing, CASP 2016, 175–179.
https://doi.org/10.1109/CASP.2016.7746160.
19. Patil, S. B., &Bodhe, S. K. (2011). Leaf disease severity measurement using image processing.
International Journal of Engineering and Technology, 3(5), 297–301.
20. Phadikar, S. (2012). Classification of Rice Leaf Diseases Based onMorphological Changes.
International Journal of Information and Electronics Engineering, 2(3), 460–463.
https://doi.org/10.7763/ijiee.2012.v2.137.
21. Prajapati, B. S., Dabhi, V. K., & Prajapati, H. B. (2016). A survey on detection and
classification of cotton leaf diseases. International Conference on Electrical, Electronics, and
Optimization Techniques, ICEEOT 2016, 2499–2506.
https://doi.org/10.1109/ICEEOT.2016.7755143.
22. Priya, N. S. (2016). Efficient Knowledge Based System to Detect Diseases in Lemon Leaf.
Imperial Journal of Interdisciplinary Research, 2(5), 275–280.
23. Pujari, Jagadeesh D., Yakkundimath, R., &Byadgi, A. S. (2015). Image processing Based
Detection of Fungal Diseases in Plants. Procedia Computer Science, 46(Icict 2014), 1802–
1808. https://doi.org/10.1016/j.procs.2015.02.137
24. Pujari, Jagadeesh Devdas, &Yakkundimath, R. (2013). Grading and Classification of
Anthracnose Fungal Disease of Fruits based on Statistical Texture Features. Citeseer, 52, 121–
132.
http://citeseerx.ist.psu.edu/viewdoc/download?doi=10.1.1.640.1709&rep=rep1&type=pdf.
25. Radhakrishnan, M. (2020). International Journal of Computational & Neural Engineering (
IJCNE ) ISSN : 2572-7389 Identification of Citrus Fruit Diseases Through Intelligent
Computational Approaches : A Review Computational Approaches for Diagnosis of Cit - rus
Fruit Diseases. 6(1), 105–116.
26. Radhika, G., Sudha, V., Mohan Sathya, R., Ganesan, A., & Mohan, V. (2008). Association of
fruit and vegetable intake with cardiovascular risk factors in urban south Indians. British
Journal of Nutrition, 99(2), 398–405. https://doi.org/10.1017/S0007114507803965.
27. RAJESH PYDIPATI. (2004). Evaluation of Classifiers for Automatic Disease Detection in.
Disertation.
28. Revathi, P., &Hemalatha, M. (2014). Cotton Leaf Spot Diseases Detection Utilizing Feature
Selection with Skew Divergence Method. International Journal of Scientific Engineering and
Technology, 3(3), 22–30.
29. Rumpf, T., Mahlein, A. K., Steiner, U., Oerke, E. C., Dehne, H. W., &Plümer, L. (2010).
Early detection and classification of plant diseases with Support Vector Machines based on
hyperspectral reflectance. Computers and Electronics in Agriculture, 74(1), 91–99.
https://doi.org/10.1016/j.compag.2010.06.009.
30. Sandika, B., Avil, S., Sanat, S., &Srinivasu, P. (2016). Random forest based classification of
diseases in grapes from images captured in uncontrolled environments. International
Conference on Signal Processing Proceedings, ICSP, 0(October 2018), 1775–1780.
https://doi.org/10.1109/ICSP.2016.7878133.
31. Sharif, M., Khan, M. A., Iqbal, Z., Azam, M. F., Lali, M. I. U., &Javed, M. Y. (2018).
Detection and classification of citrus diseases in agriculture based on optimized weighted
segmentation and feature selection. Computers and Electronics in Agriculture, 150(May
2017), 220–234. https://doi.org/10.1016/j.compag.2018.04.023.
32. Singh, V., &Misra, A. K. (2017). Detection of plant leaf diseases using image segmentation
and soft computing techniques. Information Processing in Agriculture, 4(1), 41–49.
https://doi.org/10.1016/j.inpa.2016.10.005.
33. Sladojevic, S., Arsenovic, M., Anderla, A., Culibrk, D., & Stefanovic, D. (2016). Deep Neural
Networks Based Recognition of Plant Diseases by Leaf Image Classification. Computational
Intelligence and Neuroscience, 2016(June). https://doi.org/10.1155/2016/3289801.

Ashok Kumar Saini, Dr. Roheet Bhatnagar, Dr. Devesh Kumar Srivastava
3510
34. SS, S., VS, R., VB, N., & R, A. K. (2011). a Hybrid Intelligent System for Automated
Pomegranate Disease Detection and Grading. International Journal of Machine Intelligence,
3(2), 36–44. https://doi.org/10.9735/0975-2927.3.2.36-44.
35. Ustad, M. S., Korke, A. G., &Bhaldar, K. (2007). Novel Algorithm for Detection and
Classification of Grape Leaf Disease Using K-Mean Clustering. International Journal of
Innovative Research in Computer and Communication Engineering An ISO, 3297(June 2007).
www.ijircce.com.
36. Waghmare, H., Kokare, R., &Dandawate, Y. (2016). Detection and classification of diseases
of Grape plant using opposite colour Local Binary Pattern feature and machine learning for
automated Decision Support System. 3rd International Conference on Signal Processing and
Integrated Networks, SPIN 2016, 513–518. https://doi.org/10.1109/SPIN.2016.7566749.
37. Wetterich, C. B., Felipe de Oliveira Neves, R., Belasque, J., &Marcassa, L. G. (2016).
Detection of citrus canker and Huanglongbing using fluorescence imaging spectroscopy and
support vector machine technique. Applied Optics, 55(2), 400.
https://doi.org/10.1364/ao.55.000400.
38. Ying, G., Miao, L., Yuan, Y., &Zelin, H. (2009). A study on the method of image pre-
processing for recognition of crop diseases. Proceedings - International Conference on
Advanced Computer Control, ICACC 2009, 202–206.
https://doi.org/10.1109/ICACC.2009.10.
39. Zhihua, D., Huan, W., Yinmao, S., &Yunpeng, W. (2013). IMAGE SEGMENTATION
METHOD FOR COTTON MITE DISEASE BASED ON COLOR FEATURES AND AREA
THRESHOLDING. Journal of Theoretical & Applied Information Technology, 48(1).