detecting sybil attacks in wireless …s2is.org/issues/v9/n2/papers/paper14.pdfdetecting sybil...
TRANSCRIPT
DETECTING SYBIL ATTACKS IN WIRELESS SENSOR
NETWORKS USING SEQUENTIAL ANALYSIS
P. Raghu Vamsi and Krishna Kant
Department of Computer Science and Engineering,
Jaypee Institute of Information Technology, Noida, India.
E-mails: [email protected], [email protected]
Submitted: Dec. 3, 2015 Accepted: Mar. 31, 2016 Published: June 1, 2016
Abstract: Wireless Sensor Networks (WSNs) suffer from many security attacks when deployed either in
remote or hostile environments. Among possible attacks, the Sybil attack is one of the severe attacks in
which malicious nodes report false identities and location information such that the remaining nodes
believe that many nodes exist in their vicinity. The current study proposes a method for detecting Sybil
attack using sequential analysis. This method works in two stages. First, it collects the evidences by
observing neighboring node activities. Further, the collected evidences are consolidated to provide
input to the second stage. In the second stage, collected evidences are validated using the sequential
probability ratio test to decide whether the neighbor node is Sybil or benign. The proposed method has
been evaluated using the network simulator ns-2. Simulation results show that the proposed method is
robust in detecting Sybil attacks with very low false positive and false negative rates.
Index terms: Sensor networks, Sybil attacks, malicious activities, sequential analysis, received
signal strength, false identity, false location information.
INTERNATIONAL JOURNAL ON SMART SENSING AND INTELLIGENT SYSTEMS VOL. 9, NO. 2, JUNE 2016
651
I. INTRODUCTION
Wireless Sensor Networks (WSNs) are composed of many low-cost and tiny sensing and
communication devices (also called as nodes) configured with limited memory, processing
capability and energy resource [1]. These nodes are often deployed in remote and hostile
environments to perform mission critical tasks. In such environments, an adversary can
physically capture and tamper the nodes such that the tampered node distorts the network
operations by launching various security attacks. Among possible attacks, the Sybil attack is a
severe attack in which a compromised node sends out false identity and/or location information
such that the remaining nodes believe that many nodes exist in their vicinity. A compromised
node can launch the Sybil attack using stolen or fabricated identities and/or location information.
An attacker may launch Sybil attacks in three ways as follows [2, 3, 31]
1) During the direct or indirect communication with the malicious nodes.
2) using fabricated or stolen information. During fabrication, an attacker generates
arbitrarily new identities or location data. Whereas, with stolen information an attacker
assigns valid identity or location data to a compromised node.
3) A malicious node could attack simultaneously by sending out all fabricated identities
or non-simultaneously by sending out each false identity at a time.
Since node identities and location data are vital to the network operations such as routing, data
aggregation, clustering, cluster head election, distributed storage, resource allocation, and others
[2], the network performance degrades substantially if Sybil attacks are present in the network.
There exist several promising applications of WSNs such as monitoring and control of industrial
equipment, home automation, patient monitoring, environmental monitoring, climate change
monitoring, detecting hazardous chemical levels, combat field surveillance, remotely detecting
or controlling landmines, intrusion detection, criminal hunting, and others [4-8]. These
applications need the node identity and location information to process the sensor data at the
destination. The advantages of such applications can be fully utilized only if nodes report the
correct identity and location data.
To this end, the Sybil attack has been widely studied by the researchers and proposed a number
of methods in the literature [9-34]. However, existing methods require costly requirements such
as relay nodes placement [9], directional antennas [10], cryptography methods [11-15, 42], etc.
P. Raghu Vamsi and Krishna Kant, DETECTING SYBIL ATTACKS IN WIRELESS SENSOR NETWORKS USING SEQUENTIAL ANALYSIS
652

However, these methods increase overhead and not suitable for the resource-limited sensor
nodes. Therefore, a simple and efficient method is required for resource constrained WSNs to
detect Sybil attacks without additional overhead. To this end, the current study presents a node-
centric method for Sybil Attack Detection using Sequential Analysis (SADSA). The SADSA
method works in two phases: evidence collection and evidence validation. In the existing
literature, nodes in a network are categorized into benign or malicious based on certain
parameters (or evidences). These evidences could be message authentication [11], random
passwords [12], signal strength [16, 26], Time Difference of Arrival (TODA) [17], location
verification [18-22], trust values [23], identifying common neighbors [25, 26], energy and hop
count [28], traffic monitoring [29], signal print [30], and others. By having the evidences, Sybil
attack detection methods analyze and classify the malicious nodes from benign nodes. To this
end, similar treatment has been considered for the proposed SADSA method. In the first stage,
nodes consider location data of neighbors, Received Signal Strength Indicator (RSSI) and
timestamp of the messages received from neighbors as evidences. The collected evidences are
consolidated to provide inputs to the second phase. In the second phase, the consolidated
evidences are validated using the sequential probability ratio test to determine whether the
neighbor node is benign or Sybil. In this way, these two phases are repeated for each evidence
throughout the network operation. The advantage of the proposed method is that it does not
require special hardware, heavy communication process, heavy computation, and high memory
requirements as the nodes obtain RSS of messages without any additional hardware
requirements.
The remainder of the paper is organized as follows. Section II discusses related works on Sybil
attack detection. Section III presents the preliminaries, system model, and assumptions
considered for SADSA method. Section IV describes the proposed SADSA method. Section V
presents the performance evaluation of the SADSA method using a simulation study. Finally,
Section VI concludes the paper with the future scope.
II. RELATED WORK
Douceur et al. [32] first coined the term Sybil attacks in the realm of network security. The
authors defined the Sybil attack in a peer-to-peer network as damaging nodes’ reputation by
duplicating their identities. In another study, Abu-Ghazaleh et al. [33] studied that reporting false
INTERNATIONAL JOURNAL ON SMART SENSING AND INTELLIGENT SYSTEMS VOL. 9, NO. 2, JUNE 2016
653
location information by a malicious node as Sybil attack. It is because, in location-based routing
protocols, location data of nodes are important to route the packets from the source to the
destination. Shan et al. [21] introduced location-based attack with multiple counterfeit identities
on WSN localization process. Authors analyzed the impact of false identities and location on the
localization process. Therefore, a malicious node is said to be Sybil if it reports false identity
and/or location information to distort the network operations. The following section in sequel
presents the related work on Sybil attack detection methods considering false identity and false
location data. Conventional cryptography methods come into force when there is a need for
security in distributed networks. Newsome et al. [31] showed that Sybil attacks are extremely
harmful to the sensor networks and proposed security measures using random key distribution
techniques. However, cryptography operations are more expensive in terms of processing and
storage capabilities. Thus, they are not suitable for resource constrained WSNs.
Ssu et al. [24] proposed a Sybil attack detection method using neighboring information
(DSANI). Nodes running this method detect the Sybil identities by analyzing the neighboring
node information. To do this, when a node A suspects there is a Sybil attack, it sends out a
Request-Reply (RR) message to one of its neighbor B. In turn, node B broadcast a neighbor reply
message over its maximum communication range. The purpose of an RR message is to seek all
its neighbors to send a reply message to the request originator A. Then, node A maintains a
record of node identities of replied nodes to form a Common Neighbor Set (CNS) of nodes A
and B. In this way, each node repeats this process for each neighbor node. Finally, node A counts
how many times each neighbor identity has appeared in CNS. From this count, node identities
that appear below a threshold value (𝜃) are predicted as Sybil identities. The 𝜃 value is
calculated as 0.7*|𝑁𝑐 |, where 𝑁𝑐 is the number of neighbors. To avoid false detection, the
aforementioned process will be repeated by reducing the communication range until the Sybil
identities fall outside of nodes vicinity. Although this method has shown significant Sybil
identities detection rate, adjusting communication range and sending a request message to each
neighbor as part of preparing CNS can lead to high communication overhead. Therefore, such
heavy communication process is not suitable for resource constrained WSNs. Reza et al. [25]
proposed a method to detect Sybil attacks using two-hop messages. It is an extension of Ssu et al.
[24] method. However, this method also suffers from high communication overhead like DSANI
method.
P. Raghu Vamsi and Krishna Kant, DETECTING SYBIL ATTACKS IN WIRELESS SENSOR NETWORKS USING SEQUENTIAL ANALYSIS
654
Ho et al. [26] proposed a replica cluster detection method using sequential analysis. In this,
malicious nodes forge identities of benign nodes and launch various attacks by creating duplicate
clusters. The proposed method prepares a test statistic by observing the distinction in the
messages sent by the nodes. This test statistic is compared against two thresholds to run
sequential hypothesis testing. The simulation results have shown that this method has high
malicious node detection rate with the low false positive and false negative rate.
Vasudeva et al. [35] proposed a method to detect Sybil attacks on lowest identity-based
clustering algorithms. In these algorithms, a node with the lowest identity is selected as the
cluster head for processing the data. In this work, the malicious nodes disrupt the cluster
formation process by sending out low identity numbers. Nodes running this method detect
malicious activities by validating each neighbor’s information. Like Ssu et al. [24] method, this
method collects the neighbors information by varying the transmission range.
Golestani et al. [29] proposed a Sybil attack detection method to improve the security of WSNs
for smart grids. This method works by analyzing the traffic on the network. It assumes that the
traffic density will be more around the Sybil nodes. Each node observes the traffic density in its
vicinity and detects the malicious nodes by analyzing the traffic using k-means clustering and
averaging methods.
Li et al. [27] proposed Regional Statistics Detection (RSD) method for identifying Sybil attacks.
It is a distributed detection algorithm. This method uses RSSI of messages to detect the Sybil
identities. The detection process has three steps. In the first step, nodes record the RSSI of the
messages received from their neighbors. Each node enters this record into its RSSI-ID table. In
the second step, each node identifies the neighbor node identities with the same RSSI values. In
the third step, each node checks for common identities having same RSSI values in the RSSI-ID
tables of neighbor nodes. Then, such common identities are considered as Sybil identities.
Finally, messages of common identities are blocked in the network operations. This method
works fine with small networks. However, it suffers from high false detection rate in the large
networks due to two reasons. First, when nodes are randomly placed in the network, they could
receive messages with same RSSI values. Second, the communication range can deviate due to
the presence of noise.
Sharmila et al. [28] proposed energy and hop based Sybil attack detection method for mobile
wireless sensor networks. This method uses node residual energy and hop count of nodes as
INTERNATIONAL JOURNAL ON SMART SENSING AND INTELLIGENT SYSTEMS VOL. 9, NO. 2, JUNE 2016
655

evidences to detect the Sybil attack. This method works in three stages. First, each node collects
the residual energy information of its neighbors and compares them against a threshold value.
Second, the distance between a suspected malicious node and a suspecting node is calculated. In
the third step, the path taken by the packets is recorded. Information obtained from the three
stages is analyzed to confirm a suspected identity as a Sybil identity. This method can lead to
high error rate if a malicious node deliberately reports false residual energy.
Karupiah et al. [36] proposed an energy efficient Sybil attack detection method called Sybil
Secure. In this method, nodes in the network are grouped into clusters and a cluster head (CH) is
selected from the cluster members to initiate the Sybil attack detection process. CH periodically
sends out a query message asking the cluster members to respond. In turn, each cluster member
responds to the CH request. Then, CH collects the information such as the identities of nodes that
are not replied within a response period, node identities whose details are similar to previous
records, and nodes that sent different location coordinates. Finally, Sybil Secure method analyzes
this collection to identify Sybil identities.
Bin et al. [34] proposed Sybil attack detection methods based on communication ranging in
WSNs. These methods work with the help of anchor nodes. These methods assume that
malicious nodes perform the Sybil attack from a fixed location in the network. When a node
receives the beacon message from its neighbors, it calculates the polar distance by measuring the
polar angle. A Sybil attack is detected when the polar distance of different nodes is less than a
threshold value. However, this method requires additional hardware setup such as anchor nodes.
From the aforementioned literature, it is observed that each method its own strengths and
limitations. Most of the methods are based on conventional cryptography, use of additional
hardware setup such as anchor nodes, and having heavy communication process. In general,
nodes have to execute the attack detection methods in conjunction with the application protocols.
To this end, a node-centric approach is required to detect the Sybil attacks efficiently without
additional overheads.
III. PRELIMINARIES, SYSTEM MODEL, AND ASSUMPTIONS
a. Sequential Probability Ratio Test (SPRT)
Sequential Probability Ratio Test (SPRT) is a statistical hypothesis testing method that was
developed by Wald [38]. Unlike conventional hypothesis testing, SPRT works without having
P. Raghu Vamsi and Krishna Kant, DETECTING SYBIL ATTACKS IN WIRELESS SENSOR NETWORKS USING SEQUENTIAL ANALYSIS
656

fixed sample size. It has become a promising testing method to detect defective items in
manufacturing industries. A detailed survey on SPRT applications can be found in [39-41].
SPRT is modeled as a random walk with a lower and upper bound. In this random walk, the
decision-making process will start at a point in the two bounds and move towards any of the two
bounds depending on the input evidences. When the random walk reaches or exceeds the upper
bound, SPRT rejects the null hypothesis and accepts the alternate hypothesis. On the other hand,
if the random walk reaches or exceeds the lower bound, SPRT accepts the null hypothesis and
rejects the alternate hypothesis. Let 𝑥1, 𝑥2, … . , 𝑥𝑛 be the evidences and then for each incoming
evidence the SPRT prepares a test statistic T(X) and compare it against two thresholds 𝑡𝑙 and 𝑡𝑢
respectively to choose a decision among three alternatives. First, accept the null hypothesis
if 𝑇(𝑋) ≤ 𝑡𝑙 . Second, accept the alternate hypothesis if 𝑇(𝑥) ≥ 𝑡𝑢 . Finally, computing test
statistic one more time if 𝑡𝑙 < 𝑇(𝑥) < 𝑡𝑢. Further, the test will be carried out using the user
configured false positive and false negative values. The main advantage of SPRT is the test
terminates with few pieces of evidences.
b. System model and assumptions
This study considers an insecure, homogeneous and static wireless sensor network. The
following assumptions are considered for the study.
Each node has a fixed communication range R.
An adversary can compromise nodes in the network with a certain probability.
Each node has a unique identity.
Each node is aware of its location information. For example, the CC2431 system-on-chip
solution based on the IEEE 802.15.4 specification is popular for obtaining location
information. This chip has the advantage of CC2420 transceiver and location detection
module [44, 45].
Each node periodically broadcast a beacon message consists of its identity and location
information to know about their neighbors.
Each node maintains an observation table to store the neighbor nodes information. This
table consists of the fields such as neighboring node identity, location information,
Received Signal Strength (RSS), estimated distance, Euclidian distance, and timestamp.
INTERNATIONAL JOURNAL ON SMART SENSING AND INTELLIGENT SYSTEMS VOL. 9, NO. 2, JUNE 2016
657

c. Adversary model
Both the benign and malicious nodes are with similar hardware configuration. Initially, it is
assumed that there are no malicious nodes in the network. Malicious nodes appear in the network
after some time from the network initialization. It is assumed that, during the network operations,
an adversary captures and tampers one or more benign nodes and place them back on the
network. These tampered nodes fabricate a set of false identities (FI) and location data (LD).
Using this set, a malicious node launch non-simultaneous Sybil attack as mentioned in any one
of the following cases:
Case-1: A malicious node sends out a false identity with correct location data.
Case-2: A malicious node sends out its correct identity with false location data.
Case-3: A malicious node sends out both false identity and false location data.
IV. SYBIL ATTACK DETECTION USING SEQUENTIAL ANALYSIS (SADSA)
As showed in Figure 1, the proposed SADSA method consists of two phases: 1) evidence
collection and 2) evidence validation. As allude in section I, nodes in a network has to be
categorized as benign or malicious based on some parameters. Such parameters are gathered in
the evidence collection phase.
Figure 1: Flow diagram of the SADSA method
SADSA method considers these parameters as evidences. In the first phase, nodes running
SADSA method extracts the evidences from the beacons received from the neighbor nodes. In
the second phase, SADSA method consolidates the collected evidences and proceeds for
validation. The main objective of validating the evidences is to detect the Sybil nodes with a
minimum number of evidences. To do this, each node in the network runs SPRT to identify the
Sybil attack. With SPRT, a node can accept a hypothesis between two competing hypotheses (H0
P. Raghu Vamsi and Krishna Kant, DETECTING SYBIL ATTACKS IN WIRELESS SENSOR NETWORKS USING SEQUENTIAL ANALYSIS
658
(null): neighboring node is not a Sybil node, H1 (alternate): neighboring node is a Sybil node).
The following section in the sequel explains these two phases.
a. Evidence collection
The evidence is a fact by which a node is to be decided as malicious or benign. Evidence
collection deals with gathering and consolidating all such facts. To do this, nodes running
SADSA method use the information available in beacon messages. Recall that each node
periodically sends out a beacon message that consists of identity and location information. Let us
consider that the time domain of each sensor node is divided into non-overlapping time
intervals (Δtn). During these time intervals, let a node 𝑆𝑖 receives the beacon message from one
of its neighbors 𝑆𝑗 then 𝑆𝑖 collect the evidences as a series of binary values to simplify further
computation. A node can receive messages from all the nodes within its communication
radius 𝑅. When 𝑆𝑖 receives a message from its neighbor, it records the details such as neighbor
node identity, location data, RSSI of the beacon, estimated distance via RSSI, Euclidean
distance, and a timestamp of beacon in its observation table. The rest of this section explains how
a node extracts evidences from this record.
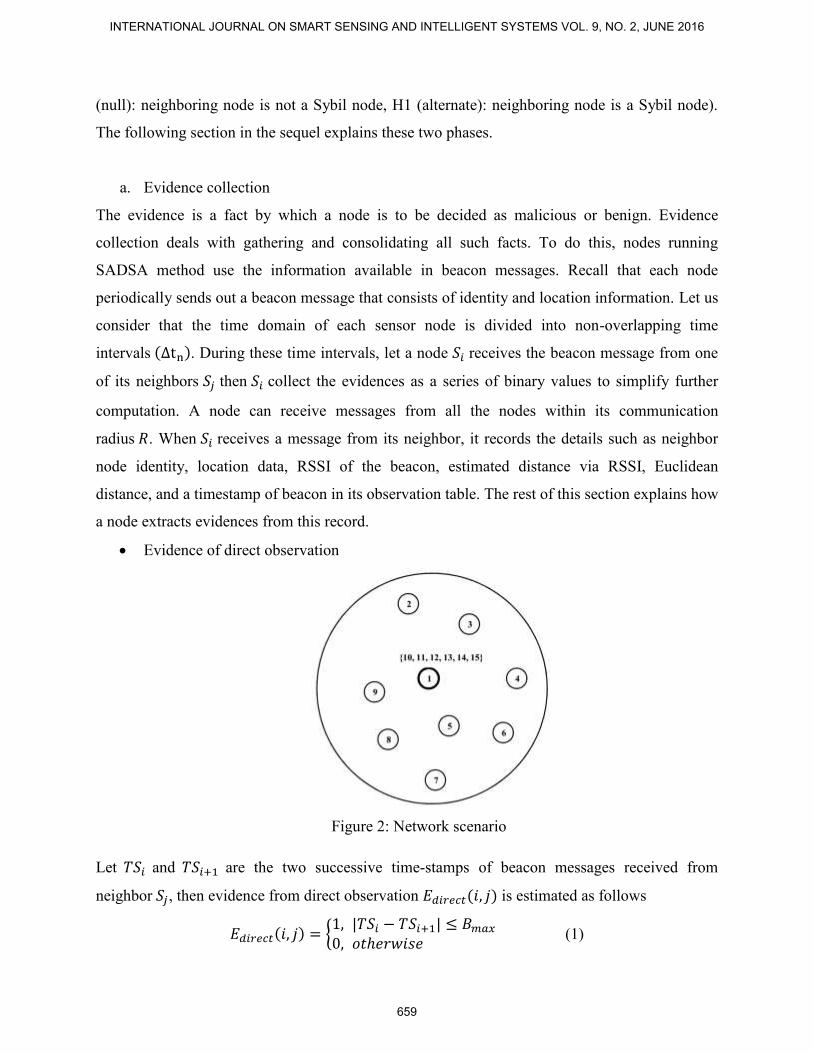
Evidence of direct observation
Figure 2: Network scenario
Let 𝑇𝑆𝑖 and 𝑇𝑆𝑖+1 are the two successive time-stamps of beacon messages received from
neighbor 𝑆𝑗, then evidence from direct observation 𝐸𝑑𝑖𝑟𝑒𝑐𝑡(𝑖, 𝑗) is estimated as follows
𝐸𝑑𝑖𝑟𝑒𝑐𝑡(𝑖, 𝑗) = {1, |𝑇𝑆𝑖 − 𝑇𝑆𝑖+1| ≤ 𝐵𝑚𝑎𝑥
0, 𝑜𝑡ℎ𝑒𝑟𝑤𝑖𝑠𝑒 (1)
INTERNATIONAL JOURNAL ON SMART SENSING AND INTELLIGENT SYSTEMS VOL. 9, NO. 2, JUNE 2016
659

It means 𝐸𝑑𝑖𝑟𝑒𝑐𝑡(𝑖, 𝑗) become 1 if the difference between two successive time-stamps is less than
the maximum beacon period 𝐵𝑚𝑎𝑥. Otherwise, direct observation becomes 0. In other words, a
benign node will always send out a beacon message within 𝐵𝑚𝑎𝑥. For example, in Figure 2, there
are nine nodes in which node 1 is the malicious node. Node 1 fabricates five Sybil identities.
When node 1 performs non-simultaneous a attack, a false identity will be sent out with each
beacon packet during a beacon interval. Neighbors of node 1 receive the beacon with only one
identity at a time. Therefore, when malicious nodes perform non-simultaneous a Sybil attack,
messages from a Sybil identity may be received in different beacon intervals. Thus, using time-
stamps, this fact can be identified using Eq. (1).
Evidence of distance measurement
There are two concepts in distance measurement: signal distance (SD) and Euclidean distance
(ED). SD is the distance measured using RSS. In a homogeneous wireless network, nodes can
obtain the RSSI of a message received from its neighbor without additional hardware
requirements. Further, the distance between a node and its neighbor can be calculated using the
radio propagation model as follows
𝑃𝑟
𝑃𝑡= 𝑘 (
𝑑0
𝑑)
𝛾
(2)
In Eq. (2), 𝑃𝑡 , 𝑃𝑟 , 𝑑0, 𝑑 𝑎𝑛𝑑 𝑘 respectively are the transmitted power of the packet, receiving
power of the packet, near earth reference distance (in meters), estimated distance between the
nodes, and free space measurement. The value of k is calculated as 𝑘 = (𝜆
4𝜋𝑑0)
2
[16], and 𝛾 is
the path loss index. It depends on radio propagation model or deployment environment.
Therefore, with E.q (2), the distance 𝑑 is calculated. We consider this 𝑑 as the estimated
distance (𝐸𝑠𝑡𝑑𝑖𝑠𝑡𝑎𝑛𝑐𝑒).
On the other hand, the Euclidean distance is the distance measured using the location data of
nodes. Since each node is aware of its location, they can calculate the ED with the location data
available in the beacon messages. Let (𝑥𝑖, 𝑦𝑖) be the location data of node 𝑆𝑖 and (𝑥𝑗 , 𝑦𝑗) be the
location data of node 𝑆𝑗 , then the Euclidean distance between two nodes is calculated
as 𝐸𝐷(𝑖, 𝑗) = √(𝑥𝑖 − 𝑥𝑗)2
+ (𝑦𝑖 − 𝑦𝑗)2
. With ED, the evidence of distance measurement is
obtained as follows
P. Raghu Vamsi and Krishna Kant, DETECTING SYBIL ATTACKS IN WIRELESS SENSOR NETWORKS USING SEQUENTIAL ANALYSIS
660

𝐸𝑑𝑖𝑠𝑡𝑎𝑛𝑐𝑒(𝑖, 𝑗) = {1, |𝐸𝐷(𝑖, 𝑗) − 𝐸𝑠𝑡𝑑𝑖𝑠𝑡𝑎𝑛𝑐𝑒| ≤ 𝐷𝑡ℎ
0, 𝑜𝑡ℎ𝑒𝑟𝑤𝑖𝑠𝑒 (4)
From Eq. (3), the 𝐸𝑑𝑖𝑠𝑡𝑎𝑛𝑐𝑒(𝑖, 𝑗) becomes 1 if the difference between 𝐸𝐷(𝑖, 𝑗) and the estimated
distance is less than or equal to a distance threshold 𝐷𝑡ℎ. Otherwise, it becomes 0. However, in
real environments the communication link between two nodes is not symmetric due to
environmental factors such as noise. Usually, noise factor in communication is estimated via
training. The current study models the noise as a zero mean Gaussian noise (0, 𝜎𝑛), Where, 𝜎𝑛 is
the noise variance in between [-0.5, +0.5].
Evidence of location verification
A node initiates the location verification when 𝐸𝑑𝑖𝑠𝑡𝑎𝑛𝑐𝑒 becomes 0 (from Eq. (4)). Localization
and location verification are two procedures used to derive and verify the location data.
Localization is the process of deriving a blind node’s (i.e., a node which is unaware of its
location) location with the help of known locations. Triangulation [22] is a popular method used
to obtain the blind node’s location data. Location verification is the process of verifying location
claims. There exists several secure location verification algorithms in the literature [18, 19].
These algorithms work with the help of special verification devices, centralized authorities, relay
nodes, etc. It means a node has to verify a location claim with the help of known locations.
Further, algorithms assume that the devices help for location verification is trustworthy.
However, such assumptions do not hold in practice when WSNs are deployed in remote and
hostile environments. To this end, the current study presents a simple and efficient location
verification process without additional overhead. The key aspect of this is, each node assesses
the sincerity in providing the information by its neighbors. This is said to be trust value of
neighbors. Then, nodes initiate the triangulation localization process with the location data of
two highly trusted nodes and location reported by a malicious node.
Trust value calculation
Consider a localization scenario shown in Figure 3. In this, node A, B, and D are benign nodes
and node C is a malicious node. D is within the communication radius of A, B and C. Node C
deliberately sends out false location data to disrupt the network operations. Since D is within the
communication radius of C, it receives the beacons sent by C. At this time, D has to prove C as
INTERNATIONAL JOURNAL ON SMART SENSING AND INTELLIGENT SYSTEMS VOL. 9, NO. 2, JUNE 2016
661
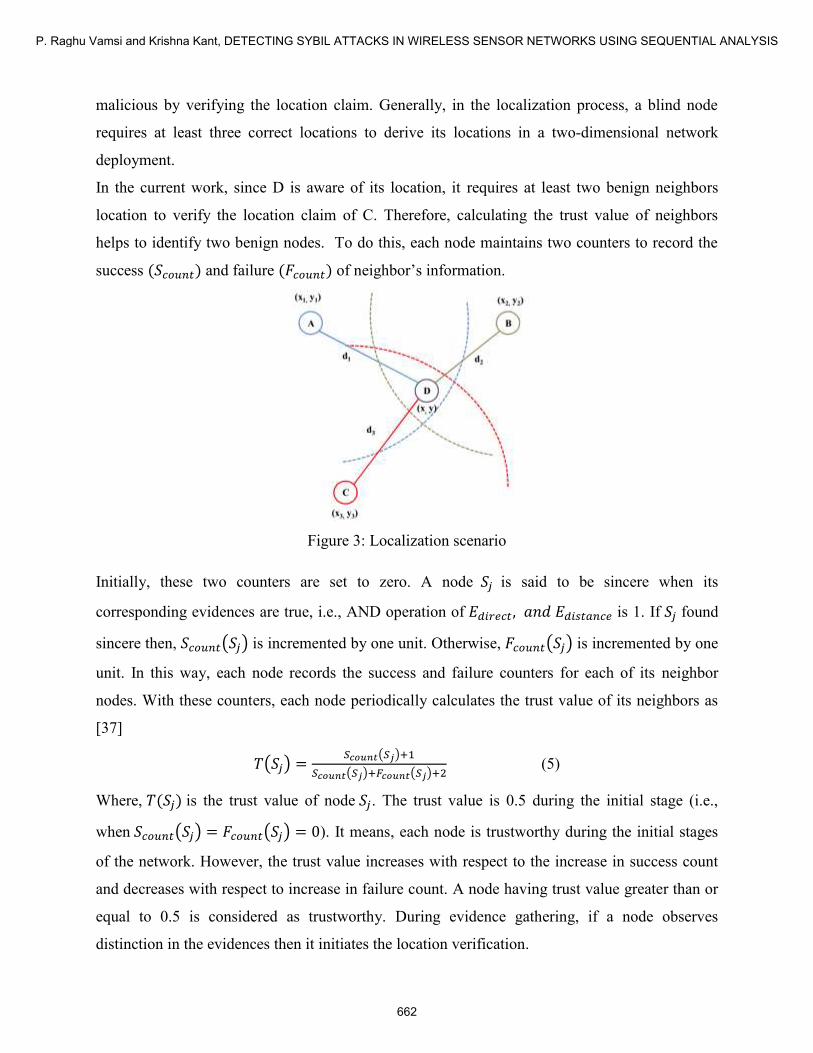
malicious by verifying the location claim. Generally, in the localization process, a blind node
requires at least three correct locations to derive its locations in a two-dimensional network
deployment.
In the current work, since D is aware of its location, it requires at least two benign neighbors
location to verify the location claim of C. Therefore, calculating the trust value of neighbors
helps to identify two benign nodes. To do this, each node maintains two counters to record the
success (𝑆𝑐𝑜𝑢𝑛𝑡) and failure (𝐹𝑐𝑜𝑢𝑛𝑡) of neighbor’s information.
Figure 3: Localization scenario
Initially, these two counters are set to zero. A node 𝑆𝑗 is said to be sincere when its
corresponding evidences are true, i.e., AND operation of 𝐸𝑑𝑖𝑟𝑒𝑐𝑡, 𝑎𝑛𝑑 𝐸𝑑𝑖𝑠𝑡𝑎𝑛𝑐𝑒 is 1. If 𝑆𝑗 found
sincere then, 𝑆𝑐𝑜𝑢𝑛𝑡(𝑆𝑗) is incremented by one unit. Otherwise, 𝐹𝑐𝑜𝑢𝑛𝑡(𝑆𝑗) is incremented by one
unit. In this way, each node records the success and failure counters for each of its neighbor
nodes. With these counters, each node periodically calculates the trust value of its neighbors as
[37]
𝑇(𝑆𝑗) =𝑆𝑐𝑜𝑢𝑛𝑡(𝑆𝑗)+1
𝑆𝑐𝑜𝑢𝑛𝑡(𝑆𝑗)+𝐹𝑐𝑜𝑢𝑛𝑡(𝑆𝑗)+2 (5)
Where, 𝑇(𝑆𝑗) is the trust value of node 𝑆𝑗. The trust value is 0.5 during the initial stage (i.e.,
when 𝑆𝑐𝑜𝑢𝑛𝑡(𝑆𝑗) = 𝐹𝑐𝑜𝑢𝑛𝑡(𝑆𝑗) = 0). It means, each node is trustworthy during the initial stages
of the network. However, the trust value increases with respect to the increase in success count
and decreases with respect to increase in failure count. A node having trust value greater than or
equal to 0.5 is considered as trustworthy. During evidence gathering, if a node observes
distinction in the evidences then it initiates the location verification.
P. Raghu Vamsi and Krishna Kant, DETECTING SYBIL ATTACKS IN WIRELESS SENSOR NETWORKS USING SEQUENTIAL ANALYSIS
662

Location verification
Recall the scenario in Figure 3, consider that D has identified A, B as highly trusted nodes and it
has to verify the location claim of C. At this time, D knows its actual location (AL), location data
reported by A, B and C. Now, D estimates its locations (EL) with the help of location data of A,
B, and C. The localization process will be carried out as follows [22]:
Consider the general equation of the circle as shown below
𝑑2 = 𝑥2 + 𝑦2 (6)
From Figure 3, let (𝑥1, 𝑦1), (𝑥2, 𝑦2), (𝑥3, 𝑦3), and (𝑥, 𝑦) be the location data of nodes A, B, C
and D respectively, the labels 𝑑1, 𝑑2 and 𝑑3 respectively on the edges be the estimated distance
(using Eq. (2)) between the node pairs (D, A), (D, B) and (D, C), then the Eq.(6) can be modified
for A, B and C as
𝑑12 = (𝑥 − 𝑥1)2 + (𝑦 − 𝑦1)2 (7)
𝑑22 = (𝑥 − 𝑥2)2 + (𝑦 − 𝑦2)2 (8)
𝑑32 = (𝑥 − 𝑥3)2 + (𝑦 − 𝑦3)2 (9)
Then, location D(𝑥, 𝑦) can be calculated using Eq. (6), Eq. (7) and Eq. (8) as follows
𝐷 = 𝐴−1𝑏 (10)
The parameters in Eq. (10) is expressed as
𝐴 = 2 [𝑥1 − 𝑥3 𝑦1 − 𝑦3
𝑥2 − 𝑥3 𝑦2 − 𝑦3] (11)
𝑏 = [𝑥1
2 − 𝑥32 + 𝑦1
2 − 𝑦32 − 𝑑1
2 + 𝑑32
𝑥22 − 𝑥3
2 + 𝑦22 − 𝑦3
2 − 𝑑22 + 𝑑3
2] (12)
𝐷 = [𝑥𝑦] (13)
The estimated location (EL) of D is obtained using the following:
𝐷 = (𝐴𝑇𝐴)−1𝐴𝑇𝑏 (14)
Once the EL is calculated, D obtains the evidence of location verification as follows
𝐸𝑙𝑜𝑐(𝐷, 𝐶) = {1, 𝐸𝐷(𝐸𝐿, 𝐴𝐿) ≤ 𝐸𝑡ℎ
0, 𝑜𝑡ℎ𝑒𝑟𝑤𝑖𝑠𝑒 (15)
Where, EL and AL are the estimated location and actual location of the verifying node (i.e., D).
The 𝐸𝑙𝑜𝑐(𝐷, 𝐶) will become 1 if the Euclidean distance between the EL and AL is less than or
INTERNATIONAL JOURNAL ON SMART SENSING AND INTELLIGENT SYSTEMS VOL. 9, NO. 2, JUNE 2016
663

equal to a localization error threshold 𝐸𝑡ℎ . Otherwise, it becomes 0. We consider 𝐸𝑡ℎ as 0.5
meters. Algorithm 1 shows the procedure of evidence collection and location verification.
Algorithm 1: Evidence collection and location verification in SADSA method
Input Beacon from neighbor node 𝑆𝑗 consists of node identity, location
data.
Initialization 𝑆𝑐𝑜𝑢𝑛𝑡(𝑆𝑗) = 0, 𝐹𝑐𝑜𝑢𝑛𝑡(𝑆𝑗) = 0
Output Evidences in binary values
Start Procedure
Step 1 Record the node identity, location data, RSSI of the beacon,
Euclidean distance, signal distance and timestamp of the beacon
in the neighbor table.
Step 2 Calculate the evidence of direct observation (𝐸𝑑𝑖𝑟𝑒𝑐𝑡)
using Eq. (1)
Step 3 Calculate the signal distance using Eq. (2) and Euclidean distance
with the reported location data. Then, calculate the evidence of
distance measurement (𝐸𝑑𝑖𝑠𝑡𝑎𝑛𝑐𝑒) using Eq. (4).
Step 4 If 𝐸𝑑𝑖𝑟𝑒𝑐𝑡 𝐴𝑁𝐷 𝐸𝑑𝑖𝑠𝑡𝑎𝑛𝑐𝑒 is 0, then increment the 𝐹𝑐𝑜𝑢𝑛𝑡(𝑆𝑗) by 1.
Otherwise, increment the 𝑆𝑐𝑜𝑢𝑛𝑡(𝑆𝑗) by 1.
Step 5 If 𝐸𝑑𝑖𝑠𝑡𝑎𝑛𝑐𝑒 = 0, then perform the steps 6. Otherwise, set evidence
of location verification 𝐸𝑙𝑜𝑐 = 1 and go to step 7.
Step 6 Initiate location verification
Step 6.1 Calculate the trust value of each neighbor using Eq. (5)
Step 6.2 Identify two neighbors with the trust value greater than or equal to
0.5.
Step 6.3 Estimate the verification node location using Eq. (14).
Step 6.4 Calculate the evidence of location verification 𝐸𝑙𝑜𝑐 using Eq. (15).
Step 7 Return 𝐸_𝑑𝑖𝑟𝑒𝑐𝑡, 𝐸𝑑𝑖𝑠𝑡𝑎𝑛𝑐𝑒 and 𝐸𝑙𝑜𝑐.
Stop the procedure.
In this way, nodes gather the evidence of direct observation, distance measurement, and location
verification. An adversary may launch Sybil attack in three cases (see Section III (c)): 1) a
malicious node sends out a false identity with correct location data (case-1); 2) a malicious node
sends out its correct identity with false location data (case-2), and 3) a malicious node sends out
P. Raghu Vamsi and Krishna Kant, DETECTING SYBIL ATTACKS IN WIRELESS SENSOR NETWORKS USING SEQUENTIAL ANALYSIS
664

both false identity and false location data (case-3). Although each node collects the evidences,
the possibility of Sybil attack in the above three cases can be identified only by systematic
analysis. To do this, collected evidences are consolidated and then proceeds to the validation
phase. The objective of the evidence consolidation is to provide a binary value to the validation
phase. The evidences are consolidated as follows
𝐸𝑐1 = 𝐸𝑑𝑖𝑟𝑒𝑐𝑡(𝑖, 𝑗) ⊗ 𝐸𝑑𝑖𝑠𝑡𝑎𝑛𝑐𝑒(𝑖, 𝑗) (16)
𝐸𝑐2 = 𝐸𝑑𝑖𝑟𝑒𝑐𝑡(𝑖, 𝑗) ⊗ 𝐸𝑙𝑜𝑐(𝑖, 𝑗) (17)
𝐸𝑐3 = 𝐸𝑐1 ⨀ 𝐸𝑐2 (18)
Where, 𝐸𝑐1, 𝐸𝑐2 and 𝐸𝑐3 are consolidated evidences respectively used to identify the case 1, 2,
and 3 attacks. The symbol ⊗ indicates the exclusive-OR operation and ⨀ indicates the logical
AND operation. With these values, malicious activities can be identified. For example, if
𝐸𝑑𝑖𝑠𝑡𝑎𝑛𝑐𝑒 = 1 and 𝐸𝑑𝑖𝑟𝑒𝑐𝑡 = 0 , then 𝐸𝑐1 = 1 . It means that a malicious node is within the
communication radius and sending the false identities in different beacon intervals. Similarly, if
𝐸𝑙𝑜𝑐 = 1 and 𝐸𝑑𝑖𝑟𝑒𝑐𝑡 = 0, then 𝐸𝑐1 = 1. It means that a malicious node is sending the beacons
within the beacon interval with false location data. The case 3 attack can be identified by
performing AND operation of 𝐸𝑐1 and 𝐸𝑐2. Algorithm 2 shows the procedure of consolidating
the collected evidences. Using these consolidated evidences, SADSA method proceeds to the
evidence validation phase.
Algorithm 2: Evidence consolidation in SADSA method
Input Evidence values 𝐸_𝑑𝑖𝑟𝑒𝑐𝑡, 𝐸_𝑑𝑖𝑠𝑡𝑎𝑛𝑐𝑒, and 𝐸_𝑙𝑜𝑐
Output Consolidated evidences 𝐸𝑐1 (for case 1),
𝐸𝑐2 (for case 2) and 𝐸_𝑐3 (for case 3)
Start Procedure
Step 1 Prepare the consolidated evidence for identifying case 1
attacks (𝐸𝑐1) using Eq. (16)
Step 2 Prepare the consolidated evidence for identifying case 2
attacks (𝐸𝑐2) using Eq. (17)
Step 3 Prepare the consolidated evidence for identifying case 3
attacks (𝐸𝑐3) using Eq. (18)
Step 4 Return 𝐸𝑐1, 𝐸𝑐2 and 𝐸𝑐3.
Stop the procedure.
INTERNATIONAL JOURNAL ON SMART SENSING AND INTELLIGENT SYSTEMS VOL. 9, NO. 2, JUNE 2016
665

b. Evidence validation
The aim of evidence validation phase is to decide a node as either malicious or benign with a
minimum number of evidences. Consolidated evidence values (Eq. (16), Eq. (17) and Eq. (18))
result into a series of binary values and they are assigned to a Bernoulli random variable 𝑋𝑖 to
represent 1 as (true/success) and 0 as (false/failure) in identifying malicious node. It is
formulated as
𝑋𝑖 = {1, 𝑖𝑓 𝐸𝑐1 = 1 𝑜𝑟 𝐸𝑐2 = 1 𝑜𝑟 𝐸𝑐3 = 10, 𝑜𝑡ℎ𝑒𝑟𝑤𝑖𝑠𝑒
(19)
With this, the success probability (𝑝) of Bernoulli distribution is defined as 𝑝 = Pr(𝑋𝑖 = 1) =
1 − Pr (𝑋𝑖 = 0). A node observes similar messages as 𝑋~𝑓(𝑥, 𝜃), where 𝑓(𝑥, 𝜃) represents the
conditional density over data vector X given the parameter 𝜃 ∈ Θ . Where, Θ denotes the
parameter space as Θ = {Θ0: 𝐵𝑒𝑛𝑖𝑔𝑛 𝑛𝑜𝑑𝑒, Θ1: 𝑀𝑎𝑙𝑖𝑐𝑖𝑜𝑢𝑠 𝑛𝑜𝑑𝑒} with prior density 𝜋(𝜃) for 𝜃
on Θ. The prior 𝜋𝑖(𝜃) with support to Θ𝑖 for 𝑖 = 0,1 is given as
𝜋𝑖(𝜃) =𝐼(𝜃∈Θ)𝜋(𝜃)
∫ 𝜋(𝜃) 𝑑𝜃Θ𝑖
(20)
Where, 𝐼(. ) takes the value 1 if the given condition is satisfied, otherwise, it takes 0. The
marginal density of X with constraints on Θ𝑖, for i=0,1 is defined as
𝑚𝑖(𝑋) = ∫ 𝑓(𝑋|𝜃)𝜋(𝜃)Θ𝑖
(21)
With the prior density, the problem of comparing two competing hypothesis can be considered as
H0: Neighbor node 𝑆𝑗 is a benign node
H1: Neighbor node 𝑆𝑗 is a malicious node
Where, H0 𝑎𝑛𝑑 H1 are the null and alternative hypotheses respectively. During the hypothesis
testing the false positive (𝛼) and false negative (𝛽) are defined as follows
𝛼: False positive error that the decision leads to acceptance of H1, when H0 is true.
𝛽: False negative error that the decision leads to acceptance of H0, when H1 is true.
To minimize 𝛼 and 𝛽 values, a large number of samples are required for conventional hypothesis
testing. However, using sequential hypothesis testing a decision can be achieved with few
samples, and by maintaining desired 𝛼 and 𝛽 values. Since, 𝛽 is the false negative rate, 1 − 𝛽 is
the probability of detecting a malicious node. The success probability favors H0 and the failure
probability favors H1. The sequential hypothesis testing uses a test static 𝑇(𝑋) as the logarithm
of ratio of marginal distributions that favor the hypothesis as follows
P. Raghu Vamsi and Krishna Kant, DETECTING SYBIL ATTACKS IN WIRELESS SENSOR NETWORKS USING SEQUENTIAL ANALYSIS
666

𝑇(𝑋) = ∑ 𝑙𝑛 (𝑚1(𝑋𝑖)
𝑚0(𝑋𝑖))𝑛
𝑖=1 (22)
Where, 𝑛 is the number of observations. Among 𝑛 observations, let 𝛾𝑛 be the number of
observations that 𝑋𝑖 = 1, then we rewrite 𝑇(𝑋) as
𝑇(𝑋) = 𝛾𝑛 ln𝑃1
𝑃0+ (𝑛 − 𝛾𝑛) ln
1−𝑃1
1−𝑃0 (23)
Where, 𝑃0 = Pr(𝑋𝑖 = 1|H0) , 𝑃1 = Pr(𝑋𝑖 = 1|H1), 𝑎𝑛𝑑 𝑃0 < 𝑃1. Assigning a small value to 𝑃0
and a large value to 𝑃1 helps the test in detecting malicious nodes accurately [38]. T(X) can be
tested by comparing to a non-negative constant threshold (t) such that 𝑇(𝑋) ≤ 𝑡. However, two
thresholds are required to remain the T(X) in the decision region as follows
𝑇𝑂 = {H0
H1
𝑐𝑜𝑛𝑡𝑖𝑛𝑢𝑒
𝑇(𝑋) ≤ 𝑡𝑙
𝑇(𝑋) ≤ 𝑡𝑢
𝑡𝑙 < 𝑇(𝑋) < 𝑡𝑢
(24)
Where, TO is the test output, 𝑡𝑙 and 𝑡𝑢 are the lower and upper thresholds in which 𝑡𝑙 =
𝑙𝑛 (𝛽∗
1−𝛼∗), and 𝑡𝑢 = 𝑙𝑛 (
1−𝛽∗
𝛼∗) [38]. The terms 𝛼∗ and 𝛽∗ are the user configured false positive
and false negative values. Wall [38] has proved that this test will be terminated with probability
one. Nodes compute the test statistic one more time with new evidences if the test statistic
remains in between 𝑡𝑙 and 𝑡𝑢 . Average number of evidences shows the ability of SPRT in
accepting a hypothesis with the desired number of false positive and false negative rates.
According to Wald [38], the expected number of samples required to accept the test is given by
𝐸[𝑛] =𝐸[𝑇(𝑋)]
𝐸[lnPr(𝑋𝑖|𝐻1)
Pr(𝑋𝑖|𝐻0)] (25)
Algorithm 3 shows the evidence validation phase of SADSA method. In the next section, the
performance of the proposed method is analyzed using the simulation.
Algorithm 3: Evidence validation phase of SADSA method
Input Evidences 𝐸𝑐1 (for case 1), 𝐸𝑐2 (for case 2) and 𝐸_𝑐3 (for
case 3), Bernoulli random variable 𝑋𝑖, 𝑃0, 𝑃1, user configured
false positive (𝛼∗) and false negative (𝛽∗) values.
Output Accept the hypothesis H0 or H1
Start Procedure
Step 1 Update 𝑋𝑖 according to the given input of consolidated
evidences using Eq. (19)
Step 2 Compute the test statistic T(X) using Eq. (23)
INTERNATIONAL JOURNAL ON SMART SENSING AND INTELLIGENT SYSTEMS VOL. 9, NO. 2, JUNE 2016
667
Step 3 Identify the decision region using Eq. (24). If 𝑇(𝑋) ≤ 𝑡𝑙 then
accept H0 (null hypothesis) and go to step 4. If 𝑇(𝑋) ≥ 𝑡𝑢
then accept H1 (alternate hypothesis) and terminate the test. If
𝑡𝑙 ≤ 𝑇(𝑋) ≤ 𝑡𝑢 then go to step 5.
Step 4 Initialize the evidences and stop the procedure.
Step 5 Backup the current 𝑋𝑖 value to prepare for next evidences and
to compute the test statistic one more time.
V. SIMULATION STUDY
The performance of the proposed SADSA method is analyzed using the network simulator ns-
2.35 [43]. The SADSA method is compared against DSANI [24] and RSD [27] methods. This
section in sequel presents the simulation setup, results and the discussion, and overhead analysis.
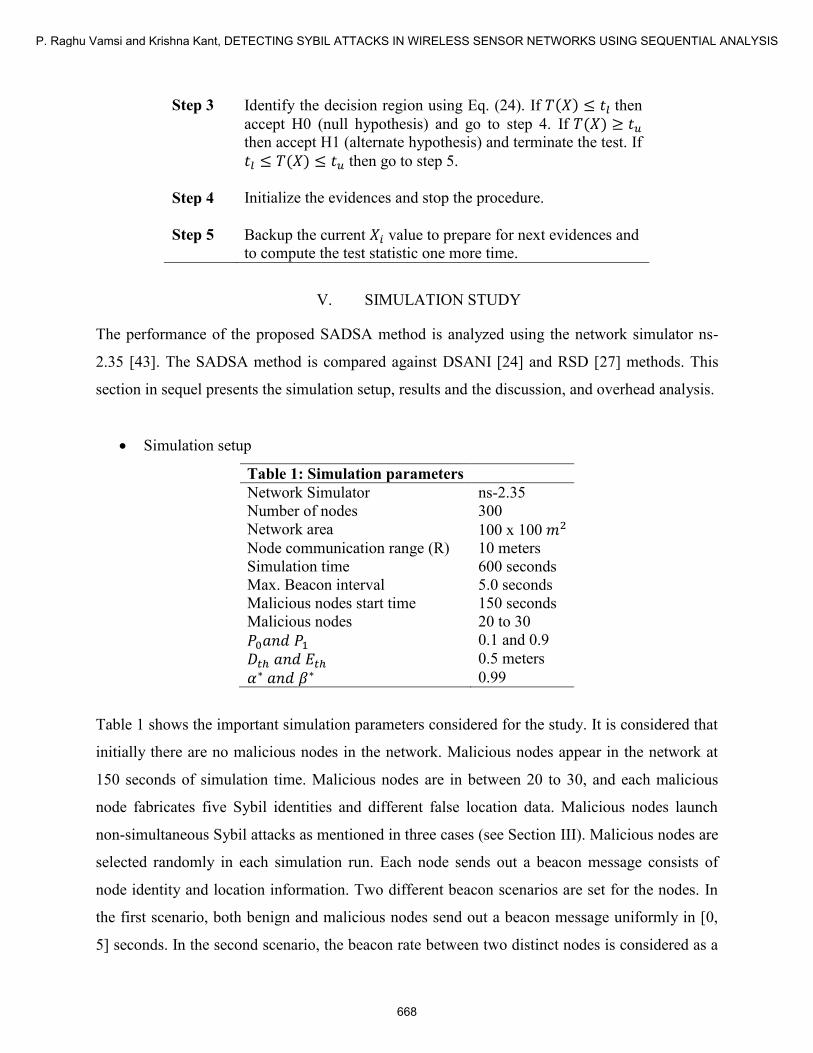
Simulation setup
Table 1: Simulation parameters
Network Simulator ns-2.35
Number of nodes 300
Network area 100 x 100 𝑚2
Node communication range (R) 10 meters
Simulation time 600 seconds
Max. Beacon interval 5.0 seconds
Malicious nodes start time 150 seconds
Malicious nodes 20 to 30
𝑃0𝑎𝑛𝑑 𝑃1 0.1 and 0.9
𝐷𝑡ℎ 𝑎𝑛𝑑 𝐸𝑡ℎ 0.5 meters
𝛼∗ 𝑎𝑛𝑑 𝛽∗ 0.99
Table 1 shows the important simulation parameters considered for the study. It is considered that
initially there are no malicious nodes in the network. Malicious nodes appear in the network at
150 seconds of simulation time. Malicious nodes are in between 20 to 30, and each malicious
node fabricates five Sybil identities and different false location data. Malicious nodes launch
non-simultaneous Sybil attacks as mentioned in three cases (see Section III). Malicious nodes are
selected randomly in each simulation run. Each node sends out a beacon message consists of
node identity and location information. Two different beacon scenarios are set for the nodes. In
the first scenario, both benign and malicious nodes send out a beacon message uniformly in [0,
5] seconds. In the second scenario, the beacon rate between two distinct nodes is considered as a
P. Raghu Vamsi and Krishna Kant, DETECTING SYBIL ATTACKS IN WIRELESS SENSOR NETWORKS USING SEQUENTIAL ANALYSIS
668
homogeneous Poisson process with a rate parameter λ. With this, the beacon time interval
between two nodes is modeled as − ln(𝑈)
𝜆. Where, U is the uniform random number in [0, 1] and
𝜆 is the rate parameter set for benign and malicious nodes. The beacon time interval decreases
with respect to increase in 𝜆 value. The rate parameter for benign nodes (𝜆𝑏) is set to 0.1, and the
rate parameter for malicious nodes (𝜆𝑚) is set to 0.2. These parameters are used to validate the
performance of SADSA method in the case of relatively different beacon intervals. The
following network performance metrics are considered for the evaluation
Detection rate: It is the accuracy of the detection method for detecting malicious nodes as
malicious.
Error rate: It is the false detection of benign nodes as malicious.
Number of control packets generated: It is the number of router packets generated in the
network for execution of the method. This metric shows the communication overhead of
the detection method.
Energy consumption: It is the energy consumed by the nodes in the network for executing
the detection method. This method shows the energy consumption of the method.
Average number of samples: In this metric, evidence is considered as a sample. It is the
average number of evidences required by the SADSA method for detecting benign and
Sybil nodes. This metric shows the time taken by the SADSA method in accepting the
test.
The results presented in the next section are the average of 50 simulation runs.
Results and discussion
Scenario 1: Nodes sending out beacon messages with a fixed beacon rate.
This section presents the performance metrics such as the detection rate, error rate,
communication overhead, energy consumption and an average number of samples required to
accept null and alternate hypothesis is presented. In this scenario, malicious nodes launch case-3
attack that is difficult to detect than case-1 and case-2 attacks.
INTERNATIONAL JOURNAL ON SMART SENSING AND INTELLIGENT SYSTEMS VOL. 9, NO. 2, JUNE 2016
669
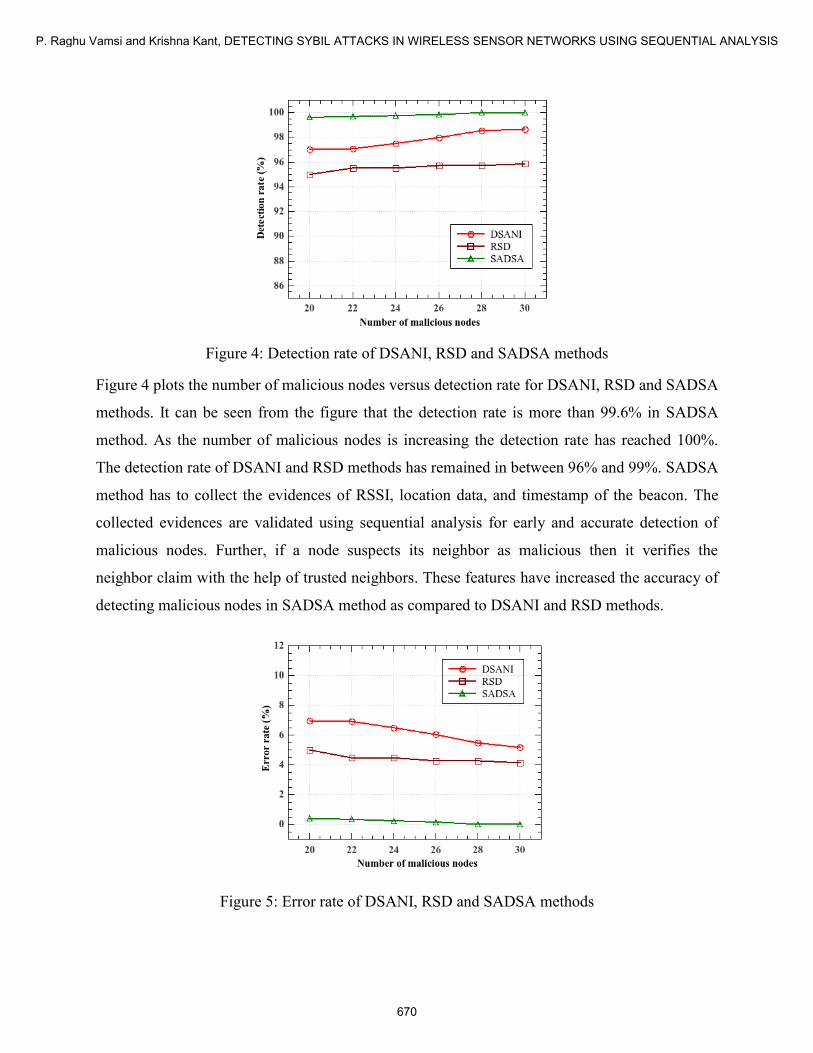
Figure 4: Detection rate of DSANI, RSD and SADSA methods
Figure 4 plots the number of malicious nodes versus detection rate for DSANI, RSD and SADSA
methods. It can be seen from the figure that the detection rate is more than 99.6% in SADSA
method. As the number of malicious nodes is increasing the detection rate has reached 100%.
The detection rate of DSANI and RSD methods has remained in between 96% and 99%. SADSA
method has to collect the evidences of RSSI, location data, and timestamp of the beacon. The
collected evidences are validated using sequential analysis for early and accurate detection of
malicious nodes. Further, if a node suspects its neighbor as malicious then it verifies the
neighbor claim with the help of trusted neighbors. These features have increased the accuracy of
detecting malicious nodes in SADSA method as compared to DSANI and RSD methods.
Figure 5: Error rate of DSANI, RSD and SADSA methods
P. Raghu Vamsi and Krishna Kant, DETECTING SYBIL ATTACKS IN WIRELESS SENSOR NETWORKS USING SEQUENTIAL ANALYSIS
670
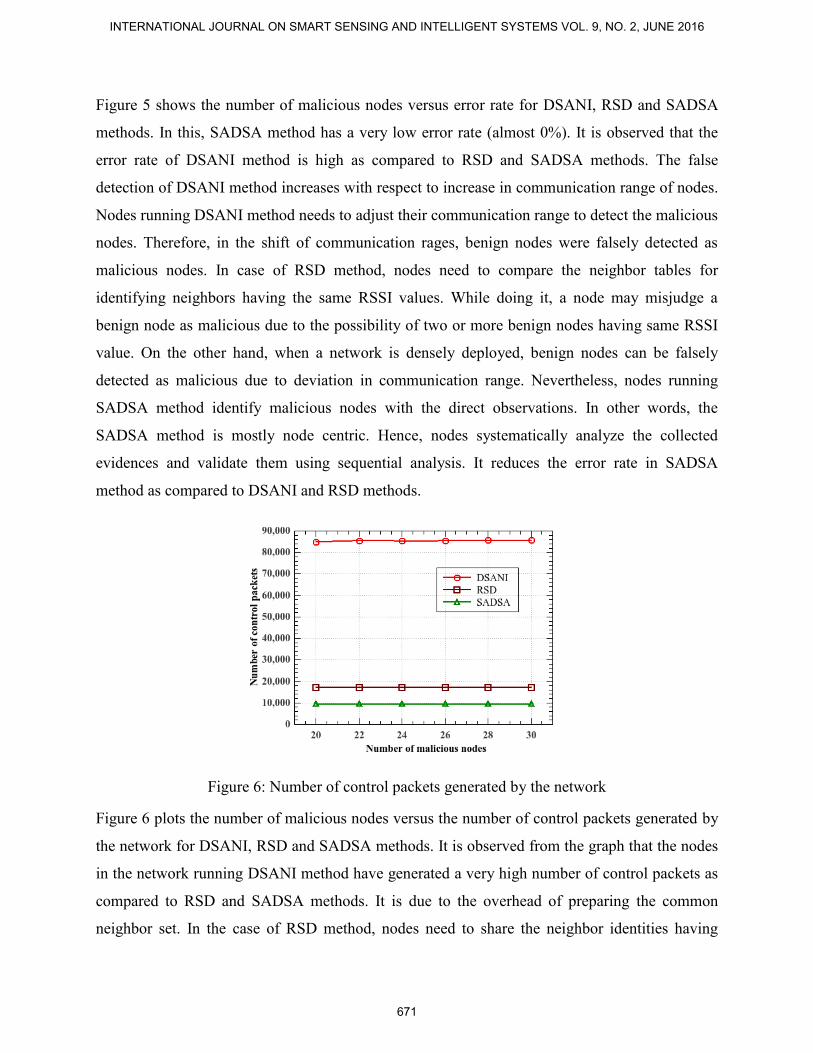
Figure 5 shows the number of malicious nodes versus error rate for DSANI, RSD and SADSA
methods. In this, SADSA method has a very low error rate (almost 0%). It is observed that the
error rate of DSANI method is high as compared to RSD and SADSA methods. The false
detection of DSANI method increases with respect to increase in communication range of nodes.
Nodes running DSANI method needs to adjust their communication range to detect the malicious
nodes. Therefore, in the shift of communication rages, benign nodes were falsely detected as
malicious nodes. In case of RSD method, nodes need to compare the neighbor tables for
identifying neighbors having the same RSSI values. While doing it, a node may misjudge a
benign node as malicious due to the possibility of two or more benign nodes having same RSSI
value. On the other hand, when a network is densely deployed, benign nodes can be falsely
detected as malicious due to deviation in communication range. Nevertheless, nodes running
SADSA method identify malicious nodes with the direct observations. In other words, the
SADSA method is mostly node centric. Hence, nodes systematically analyze the collected
evidences and validate them using sequential analysis. It reduces the error rate in SADSA
method as compared to DSANI and RSD methods.
Figure 6: Number of control packets generated by the network
Figure 6 plots the number of malicious nodes versus the number of control packets generated by
the network for DSANI, RSD and SADSA methods. It is observed from the graph that the nodes
in the network running DSANI method have generated a very high number of control packets as
compared to RSD and SADSA methods. It is due to the overhead of preparing the common
neighbor set. In the case of RSD method, nodes need to share the neighbor identities having
INTERNATIONAL JOURNAL ON SMART SENSING AND INTELLIGENT SYSTEMS VOL. 9, NO. 2, JUNE 2016
671

same RSSI values in addition to HELLO packets. Nevertheless, in the SADSA method, unlike
DSANI and RSD methods, nodes periodically transmit beacon packets to know their neighbors.
Periodic beacons are most common in WSNs. Therefore, SADSA has low communication
overhead as compared to DSANI and RSD methods.
Figure 7: Energy consumption of DSANI, RSD and SADSA methods
A detection method has to be energy efficient in addition to low communication overhead.
Figure 7 plots the number of malicious nodes versus average energy consumed by the nodes in
the network for DSANI, RSD and SADSA methods. Energy consumption of DSANI method is
very high since the number of control packets generated is high (see Figure 6). Energy
consumption in RSD method is due to periodic beacons and comparison of the routing table. On
the other hand, energy consumption of nodes in SADSA method is due to periodic beacons with
identity and location data. This, the energy consumption of the network is almost same when
RSD and SADSA methods are employed.
P. Raghu Vamsi and Krishna Kant, DETECTING SYBIL ATTACKS IN WIRELESS SENSOR NETWORKS USING SEQUENTIAL ANALYSIS
672
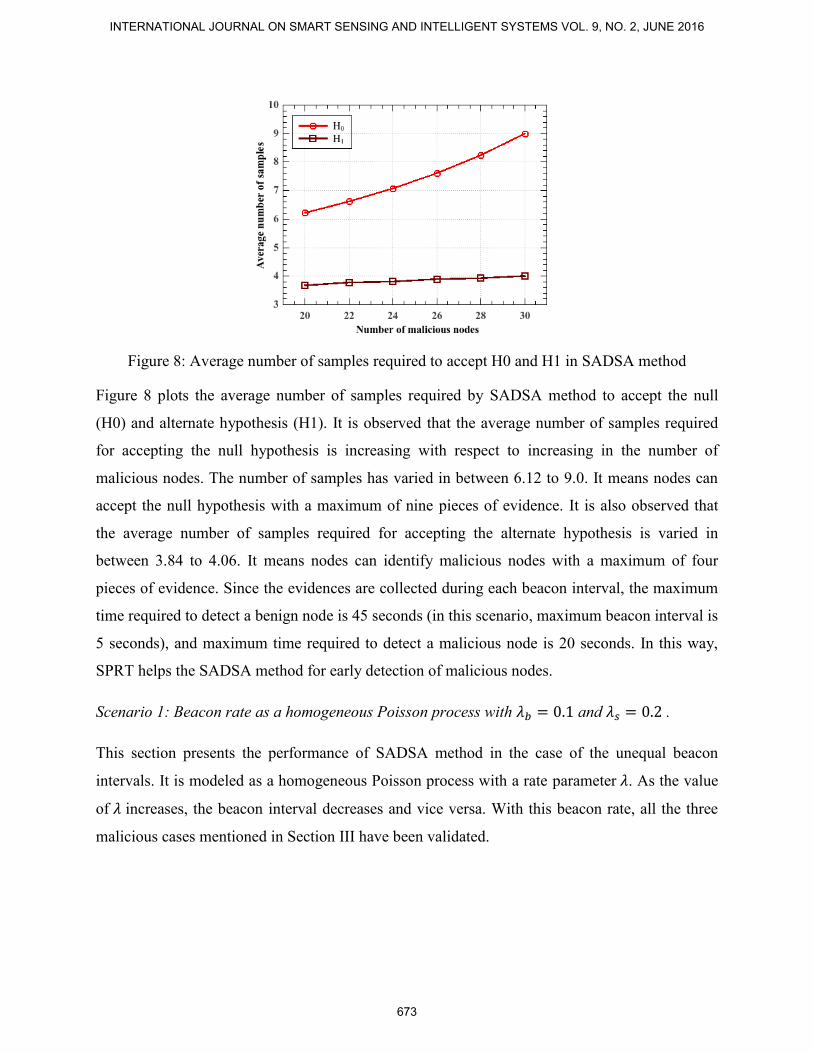
Figure 8: Average number of samples required to accept H0 and H1 in SADSA method
Figure 8 plots the average number of samples required by SADSA method to accept the null
(H0) and alternate hypothesis (H1). It is observed that the average number of samples required
for accepting the null hypothesis is increasing with respect to increasing in the number of
malicious nodes. The number of samples has varied in between 6.12 to 9.0. It means nodes can
accept the null hypothesis with a maximum of nine pieces of evidence. It is also observed that
the average number of samples required for accepting the alternate hypothesis is varied in
between 3.84 to 4.06. It means nodes can identify malicious nodes with a maximum of four
pieces of evidence. Since the evidences are collected during each beacon interval, the maximum
time required to detect a benign node is 45 seconds (in this scenario, maximum beacon interval is
5 seconds), and maximum time required to detect a malicious node is 20 seconds. In this way,
SPRT helps the SADSA method for early detection of malicious nodes.
Scenario 1: Beacon rate as a homogeneous Poisson process with 𝜆𝑏 = 0.1 and 𝜆𝑠 = 0.2 .
This section presents the performance of SADSA method in the case of the unequal beacon
intervals. It is modeled as a homogeneous Poisson process with a rate parameter 𝜆. As the value
of 𝜆 increases, the beacon interval decreases and vice versa. With this beacon rate, all the three
malicious cases mentioned in Section III have been validated.
INTERNATIONAL JOURNAL ON SMART SENSING AND INTELLIGENT SYSTEMS VOL. 9, NO. 2, JUNE 2016
673

Figure 9: Average number of samples to accept H0 in SADSA when 𝝀𝒃 = 𝟎. 𝟏 and 𝝀𝒔 = 𝟎. 𝟐
Figure 9 plots the number of malicious nodes versus the average number of samples required by
the SADSA method to accept the null hypothesis in the three cases. It is observed that the case-1
attacks are detected with a maximum of four pieces of evidence across a varying number of
malicious nodes. In case-2 and case-3, it is observed that the number of samples required is
steadily increasing as the number of malicious nodes increase in the network. Further, to accept
H0 in the case-3, SADSA method took more samples as compared to case-2 attacks. This is
because SADSA method is putting the best efforts to identify malicious nodes in irregular
beacon intervals.
Figure 10: Average number of samples to accept H1 in SADSA when 𝝀𝒃 = 𝟎. 𝟏 and 𝝀𝒔 = 𝟎. 𝟐
Figure 10 plots the number of malicious nodes versus the average number of samples required to
accept alternate hypothesis by SADSA method. It is observed that the average number of
P. Raghu Vamsi and Krishna Kant, DETECTING SYBIL ATTACKS IN WIRELESS SENSOR NETWORKS USING SEQUENTIAL ANALYSIS
674

samples required for accepting H1 has varied in between 3.42 to 3.76 in all the three cases.
Therefore, it can be concluded that SADSA method requires a maximum of four samples to
detect a malicious node in all the three cases.
Figure 11: Detection rate of SADSA method when 𝝀𝒃 = 𝟎. 𝟏 and 𝝀𝒔 = 𝟎. 𝟐
Figure 11 plots the number of malicious nodes versus detection rate for SADSA method. It is
apparent that the detection rate is above 99% in all the three cases. As the number of malicious
nodes is increasing, the detection rate is also increasing. Case-1 attacks are detected accurately
across a varying number of malicious nodes. In case-2 and case-3 attacks, the detection rate is
higher than 99.6% when there is a maximum number of malicious nodes in the network.
Figure 12: Error rate of SADSA method when 𝝀𝒃 = 𝟎. 𝟏 and 𝝀𝒔 = 𝟎. 𝟐
INTERNATIONAL JOURNAL ON SMART SENSING AND INTELLIGENT SYSTEMS VOL. 9, NO. 2, JUNE 2016
675

Figure 12 plots the number of malicious nodes versus error rate for SADSA method. It is
observed that the error rate is below 2% in all the three attack cases. The error rate of case-2 is
steadily increased with respect to the increase in the number of malicious nodes. It is because of
irregular beacon intervals. SADSA method analyzes the case-3 with identity and location data.
Therefore, the low error rate has been observed for case-3 attacks as compared to case-2 attacks.
Since the false location claims are verified with the help of trusted nodes, the error rate is very
close to 0% in the case-3 attacks.
Since the SADSA method considers the consolidated evidences in terms of binary values, the
number of evidences required to store in node’s memory is directly related to the number of
neighbors (n). Each node has to store the consolidated evidence of present and previous
observations to compute the test statistic. Therefore, a maximum of two binary values is required
for each neighbor to decide a hypothesis. With this, each node has to store a maximum of 2xn
bits to run SADSA method. Further, the SADSA method is mostly node-centric. It does not
require additional control messages other than beacon messages. Thus, the SADSA method
works without additional communication overhead as periodic beaconing is a default
communication paradigm to discover neighboring nodes.
VI. CONCLUSION AND FUTURE SCOPE
In this paper, a Sybil Attack Detection method using Sequential Analysis (SADSA) is proposed.
It is a node-centric approach to detect the Sybil attacks. This method works in two phases, via,
evidence collection and evidence validation. Nodes collect the evidences to reach a decision on
detecting malicious nodes. The collected evidences are consolidated and provided as input to the
SPRT for validation. The simulation results show that the proposed method has low
communication and processing overhead. Further, the simulation study has shown that the
SADSA method is robust in detecting Sybil identities with very low false positive and false
negative rates. As a future work, we will extend the proposed method to heterogeneous and
mobile WSNs.
P. Raghu Vamsi and Krishna Kant, DETECTING SYBIL ATTACKS IN WIRELESS SENSOR NETWORKS USING SEQUENTIAL ANALYSIS
676

REFERENCES
[1] I. F. Akyildiz, W. Su, Y. Sankarasubramaniam, and E. Cayirci, “Wireless sensor networks: a
survey," Computer networks, vol. 38, no. 4, pp. 393-422, 2002.
[2] C. Karlof and D. Wagner, “Secure routing in wireless sensor networks: Attacks and
countermeasures," Ad hoc networks, vol. 1, no. 2, pp. 293-315, 2003.
[3] Q. Zhang, P. Wang, D. S. Reeves, and P. Ning, “Defending against sybil attacks in sensor
networks," in Distributed Computing Systems Workshops, 2005. 25th IEEE International
Conference on, pp. 185-191, IEEE, 2005.
[4] E. Fadel, V. Gungor, L. Nassef, N. Akkari, M. A. Maik, S. Almasri, and I. F. Akyildiz, “A
survey on wireless sensor networks for smart grid," Computer Communications, vol. 71, pp
22-33, November 2015.
[5] Bhattacharjee, D., and R. Bera. "Development of smart detachable wireless sensing system
for environmental monitoring." International Journal on Smart Sensing and Intelligent
Systems, vol. 7, no. 3, 2014,pp 1239-1253.
[6] Q. Yang, X. Zhu, H. Fu, and X. Che, “Survey of security technologies on wireless sensor
networks," Journal of Sensors, Volume 2015, pp 1-9.
[7] A. Wheeler, “Commercial applications of wireless sensor networks using zigbee," IEEE
Communications Magazine, vol. 45, no. 4, pp. 70-77, 2007.
[8] El Alami, Hassan, and Abdellah NAJID. "SEFP: A New Routing Approach Using Fuzzy
Logic for Clustered Heterogeneous Wireless Sensor Networks", International Journal on
Smart Sensing & Intelligent Systems, vol. 8, no. 4, 2015,pp 2286-2306.
[9] J. Wang, G. Yang, Y. Sun, and S. Chen, “Sybil attack detection based on rssi for wireless
sensor network," in International Conference on Wireless Communications, Networking and
Mobile Computing, pp. 2684- 2687, IEEE, 2007.
[10] N. Sastry, U. Shankar, and D. Wagner, “Secure verification of location claims," in
Proceedings of the 2nd ACM workshop on Wireless security, pp. 1-10, ACM, 2003.
[11] U. S. R. K. Dhamodharan and R. Vayanaperumal, “Detecting and preventing sybil
attacks in wire-less sensor networks using message authentication and passing method," The
Scientific World Journal, vol. 2015, 2015.
INTERNATIONAL JOURNAL ON SMART SENSING AND INTELLIGENT SYSTEMS VOL. 9, NO. 2, JUNE 2016
677

[12] R. AMUTHAVALLI and R. BHUVANESWARAN, “Detection and prevention of sybil
attack in wireless sensor network employing random password comparison method.,"
Journal of Theoretical & Applied Information Technology, vol. 67, no. 1, 2014.
[13] W. Wang, D. Pu, and A. Wyglinski, “Detecting sybil nodes in wireless networks with
physical layer network coding," in 2010 IEEE/IFIP International Conference on Dependable
Systems and Networks (DSN), pp. 21-30, IEEE, 2010.
[14] W. Chang and J. Wu, “A survey of sybil attacks in networks," Temple University, Computer
and Information Sciences. Philadelphia: Temple University.
[15] S. Hussain and M. S. Rahman, “Using received signal strength indicator to detect node
replacement and replication attacks in wireless sensor networks," in SPIE Defense, Security,
and Sensing, pp. 73440G- 73440G, International Society for Optics and Photonics, 2009.
[16] S. Marian and P. Mircea, “Sybil attack type detection in wireless sensor networks based on
received signal strength indicator detection scheme," in Applied Computational Intelligence
and Informatics (SACI), 2015 IEEE 10th Jubilee International Symposium on, pp. 121-124,
IEEE, 2015.
[17] M. Wen, H. Li, Y.-F. Zheng, and K.-F. Chen, “Tdoa-based sybil attack detection scheme for
wireless sensor networks," Journal of Shanghai University (English Edition), vol. 12, pp. 66-
70, 2008.
[18] Y. Zeng, J. Cao, J. Hong, S. Zhang, and L. Xie, “Secure localization and location
verification in wireless sensor networks: a survey," the Journal of Supercomputing, vol. 64,
no. 3, pp. 685-701, 2013.
[19] Y. Wei and Y. Guan, “Lightweight location verification algorithms for wireless sensor
networks," IEEE Transactions on Parallel and Distributed Systems, vol. 24, no. 5, pp. 938-
950, 2013.
[20] D. Mukhopadhyay and I. Saha, “Location veri cation based defense against sybil attack in
sensor net-works," in Distributed Computing and Networking, pp. 509-521, Springer, 2006.
[21] H. Shen and X.-G. Ye, “Research on the location attack based on multiple counterfeit
identities tech-nology in sensor networks," in 2014 International Conference on Wireless
Communication and Sensor Network (WCSN), pp. 193-197, IEEE, 2014.
[22] G. Mao, B. Fidan, and B. D. Anderson, “Wireless sensor network localization techniques,"
Computer networks, vol. 51, no. 10, pp. 2529-2553, 2007.
P. Raghu Vamsi and Krishna Kant, DETECTING SYBIL ATTACKS IN WIRELESS SENSOR NETWORKS USING SEQUENTIAL ANALYSIS
678

[23] G. V. Crosby, L. Hester, and N. Pissinou, “Location-aware, trust-based detection and
isolation of com-promised nodes in wireless sensor networks.," IJ Network Security, vol. 12,
no. 2, pp. 107-117, 2011.
[24] K.-F. Ssu, W.-T. Wang, and W.-C. Chang, “Detecting sybil attacks in wireless sensor
networks using neighboring information," Computer Networks, vol. 53, no. 18, pp. 3042-
3056, 2009.
[25] R. Rafeh and M. Khodadadi, “Detecting sybil nodes in wireless sensor networks using two-
hop messages," Indian Journal of Science and Technology, vol. 7, no. 9, pp. 1359-1368,
2014.
[26] J.-W. Ho, “Sequential hypothesis testing based approach for replica cluster detection in
wireless sensor networks," Journal of Sensor and Actuator Networks, vol. 1, no. 2, pp. 153-
165, 2012.
[27] M. Li, Y. Xiong, X. Wu, X. Zhou, Y. Sun, S. Chen, and X. Zhu, “A regional statistics
detection scheme against sybil attacks in wsns," in 12th IEEE International Conference on
Trust, Security and Privacy in Computing and Communications (TrustCom), pp. 285-291,
IEEE, 2013.
[28] G. U. S Sharmila, “Energy and hop based detection of sybil attack for mobile wireless sensor
networks," International Journal of Emerging Technology and Advanced Engineering, vol.
4, no. 4, 2014.
[29] S. Golestani Najafabadi, H. R. Naji, and A. Mahani, “Sybil attack detection: Improving
security of wsns for smart power grid application," in Smart Grid Conference (SGC), 2013,
pp. 273-278, IEEE, 2013.
[30] Y. Liu, D. Bild, R. Dick, Z. M. Mao, and D. Wallach, “The mason test: A defense against
sybil attacks in wireless networks without trusted authorities," Indian Journal of Science and
Technology, 2014.
[31] J. Newsome, E. Shi, D. Song, and A. Perrig, “The sybil attack in sensor networks: analysis
& defenses," in Proceedings of the 3rd international symposium on Information processing
in sensor networks, pp. 259- 268, ACM, 2004.
[32] J. R. Douceur, “The sybil attack," in Peer-to-peer Systems, pp. 251-260, Springer, 2002.
INTERNATIONAL JOURNAL ON SMART SENSING AND INTELLIGENT SYSTEMS VOL. 9, NO. 2, JUNE 2016
679

[33] N. Abu-Ghazaleh, K.-D. Kang, and K. Liu, “Towards resilient geographic routing in wsns,"
in Proceedings of the 1st ACM international workshop on Quality of service & security in
wireless and mobile networks, pp. 71-78, ACM, 2005.
[34] B. Tian, Y. Yao, L. Shi, S. Shao, Z. Liu, and C. Xu, “A novel sybil attack detection scheme
for wire-less sensor network," in 2013 5th IEEE International Conference on Broadband
Network & Multimedia Technology (IC-BNMT), pp. 294-297, IEEE, 2013.
[35] A. Vasudeva and M. Sood, “Sybil attack on lowest id clustering algorithm in the mobile ad
hoc network," International Journal of Network Security & Its Applications (IJNSA), vol. 4,
no. 5, 2012.
[36] M. A. B. Karuppiah and A. R. Prakash, “Sybilsecure: An energy efficient sybil attack
detection technique in wireless sensor network," International Journal of Information, vol. 4,
no. 3, 2014.
[37] A. Jsoang and R. Ismail, “The beta reputation system," in Proceedings of the 15th bled
electronic commerce conference, vol. 5, pp. 2502-2511, 2002.
[38] A. Wald, Sequential analysis. Courier Corporation, 1973.
[39] I. Chang, and Y.-C, “Applications of Sequential Probability Ratio Test to computerized
criterion-referenced testing”, Sequential Analysis, vol. 23, no. 1, pp. 45-61, 2004.
[40] K.Cohen, and Q.Zhao, “Quest Anomaly Detection: a case of active hypothesis testing”,IEEE
Information Theory Applications workshop (ITA), pp 1-5, 2014.
[41] T.L.Lai, “Sequential analysis: some classical problems and new challenges”, Statist Sinica,
Vol. 11, no. 2, pp. 303-350, 2001.
[42] Juliana, M. Roseline, and S. Srinivasan. "SELADG: Secure Energy Efficient Location
Aware Data Gathering Approach for Wireless Sensor Networks", International Journal on
Smart Sensing & Intelligent Systems, vol. 8, no.3, 2015, pp. 1748-1767
[43] Network simulator ns-2.35, http:// www.isi.edu/nsnam/ns. Accessed: 2015-11-10.
[44] Cc2420 data sheet. http://www.ti.com/product/cc2420. Accessed: 2015-11-10.
[45] Cc2431 data sheet. www.ti.com/cn/lit/gpn/cc2431. Accessed: 2015-11-10.
P. Raghu Vamsi and Krishna Kant, DETECTING SYBIL ATTACKS IN WIRELESS SENSOR NETWORKS USING SEQUENTIAL ANALYSIS
680